Multisensory gaze stabilization in response to subchronic alteration of vestibular type I hair cells
- Université Paris Cité, CNRS UMR 8002, INCC - Integrative Neuroscience and Cognition Center, France
- Departament de Ciències Fisiològiques, Universitat de Barcelona, Spain
- Institut de Neurociènces, Universitat de Barcelona, Spain
- Institut d'Investigació Biomèdica de Bellvitge (IDIBELL), Spain
- Department of Paediatric Otolaryngology, Hôpital Necker-Enfants Malades, France
Figures
Figure 1 with 1 supplement
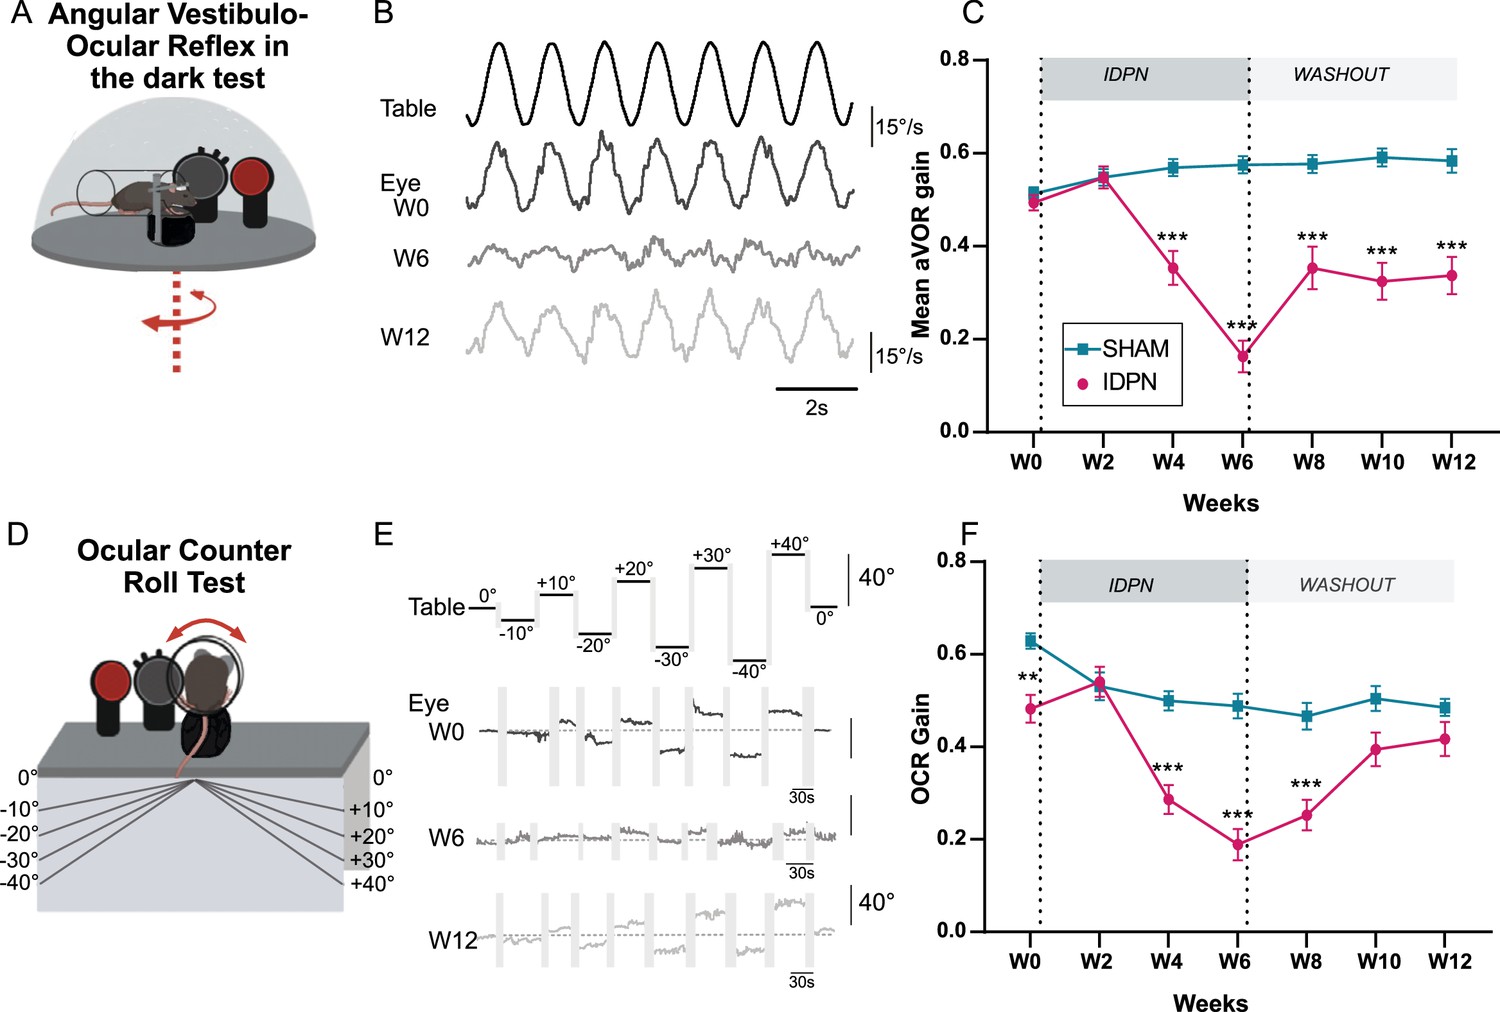
Effects of subchronic IDPN on canal- and otolithic- dependent VOR.
(A) Illustration of the angular horizontal vestibulo-ocular reflex (aVOR) set-up. All tests are performed in complete dark. (B) Examples of velocity aVOR traces in response to table rotations (1 Hz at 30°/s) recorded in the dark in an IDPN mouse before (W0, corresponding gain of 0.785; VAF of 0.98), after 6 weeks of treatment (W6, gain: 0.14; VAF: 0.61) and 6 weeks of washout (W12, gain:0.48; VAF: 0.92). Right movement is represented up. (C) Mean aVOR gain of SHAM (n=22) and IDPN (n=21) mice during the protocol (repeated measures ANOVA). (D) Illustration of the ocular- counter roll (OCR) set-up. (E) Examples of raw OCR traces at W0, W6 and W12 in a IDPN mouse recorded in the dark. Tilt to the right is represented up (positive values). (Left) eye elevation is represented up. (F) Mean OCR gain of SHAM (n=14) and IDPN (n=13) mice (mix-model ANOVA). We note that there was a significant difference between SHAM and IDPN during the initial measurements at W0. However, at this time point mice were not yet separated into different groups. This incidental difference completely disappeared on the measurement performed at W2. (*p<0.05; **p<0.01; ***p<0.001). Error bars represent ± SEM.
-
Figure 1—source data 1
Effects of subchronic IDPN on canal- and otolithic- dependent VOR.
- https://cdn.elifesciences.org/articles/88819/elife-88819-fig1-data1-v2.xlsx
Figure 1—figure supplement 1
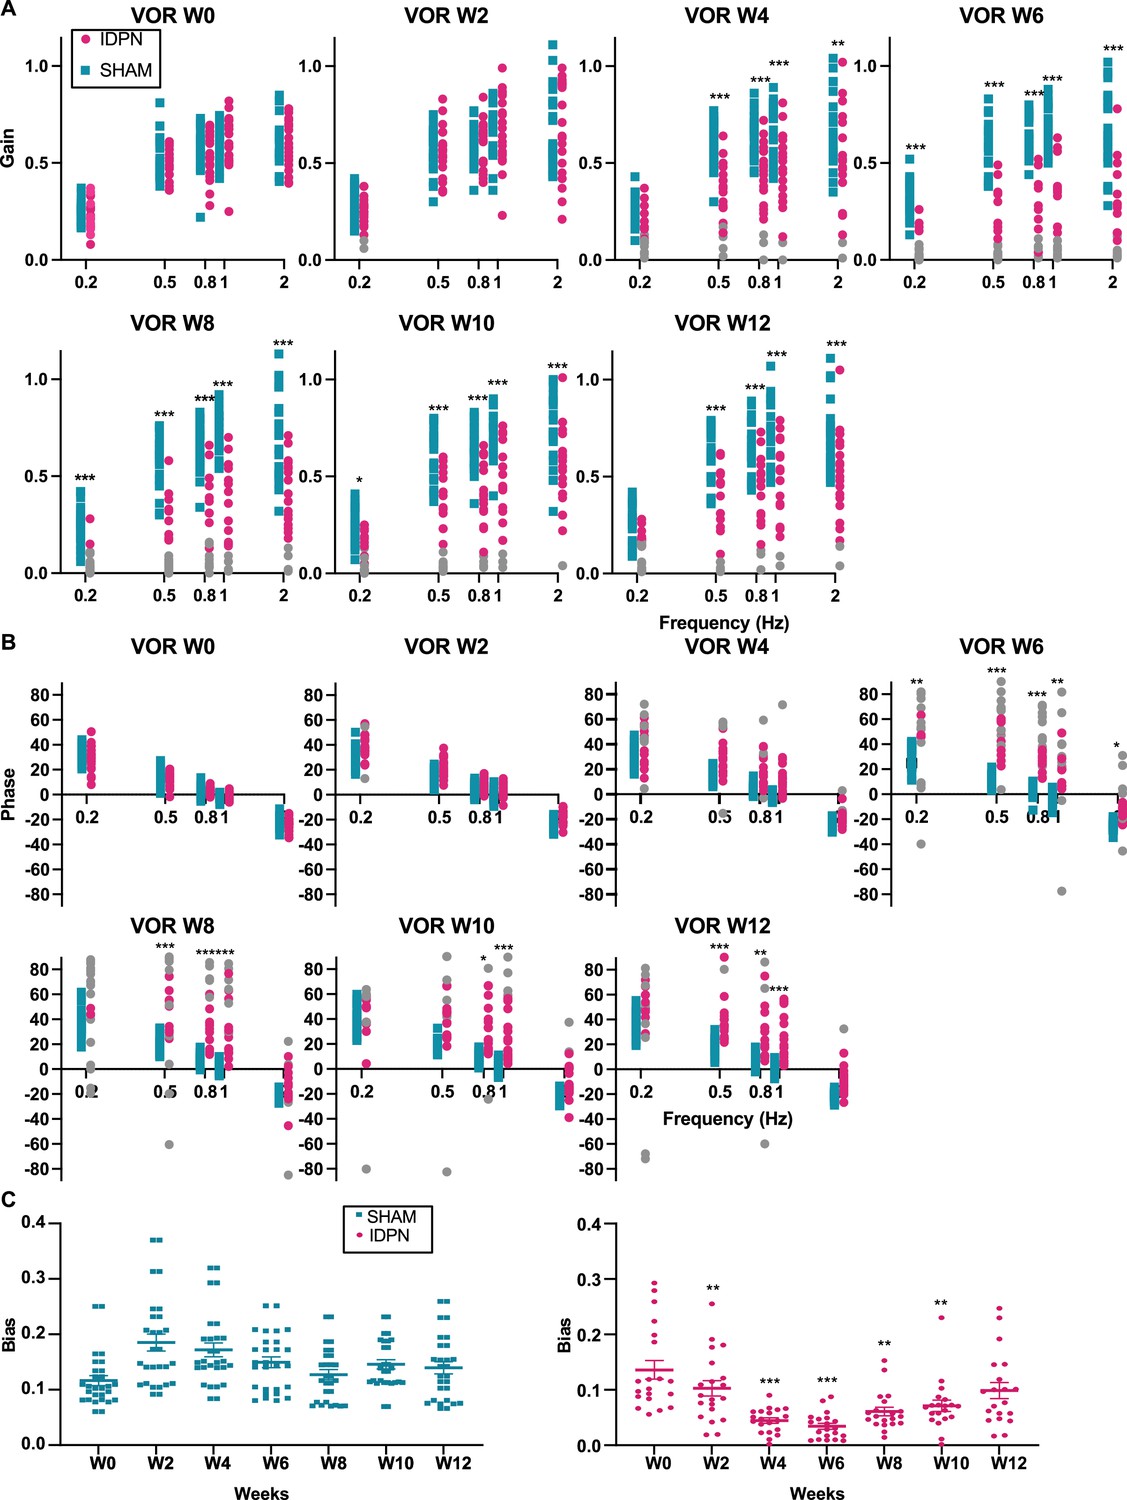
Effects of subchronic IDPN on canalar- and otolith-dependent VOR.
(A, B) aVOR (A) Gain and (B) Phase across all frequencies and weeks tested for IDPN (n=21) and SHAM (n=22) mice. The grey symbols in the left panel correspond to aVOR gain values associated with VAF <0.5 (repeated measures ANOVA) .(C) OVAR MOR bias for IDPN (n=13) and SHAM (n=14) mice during the protocol (mix-model ANOVA). (*p<0.05; **p<0.01; ***p<0.001). Error bars represent ± SEM.
Figure 2
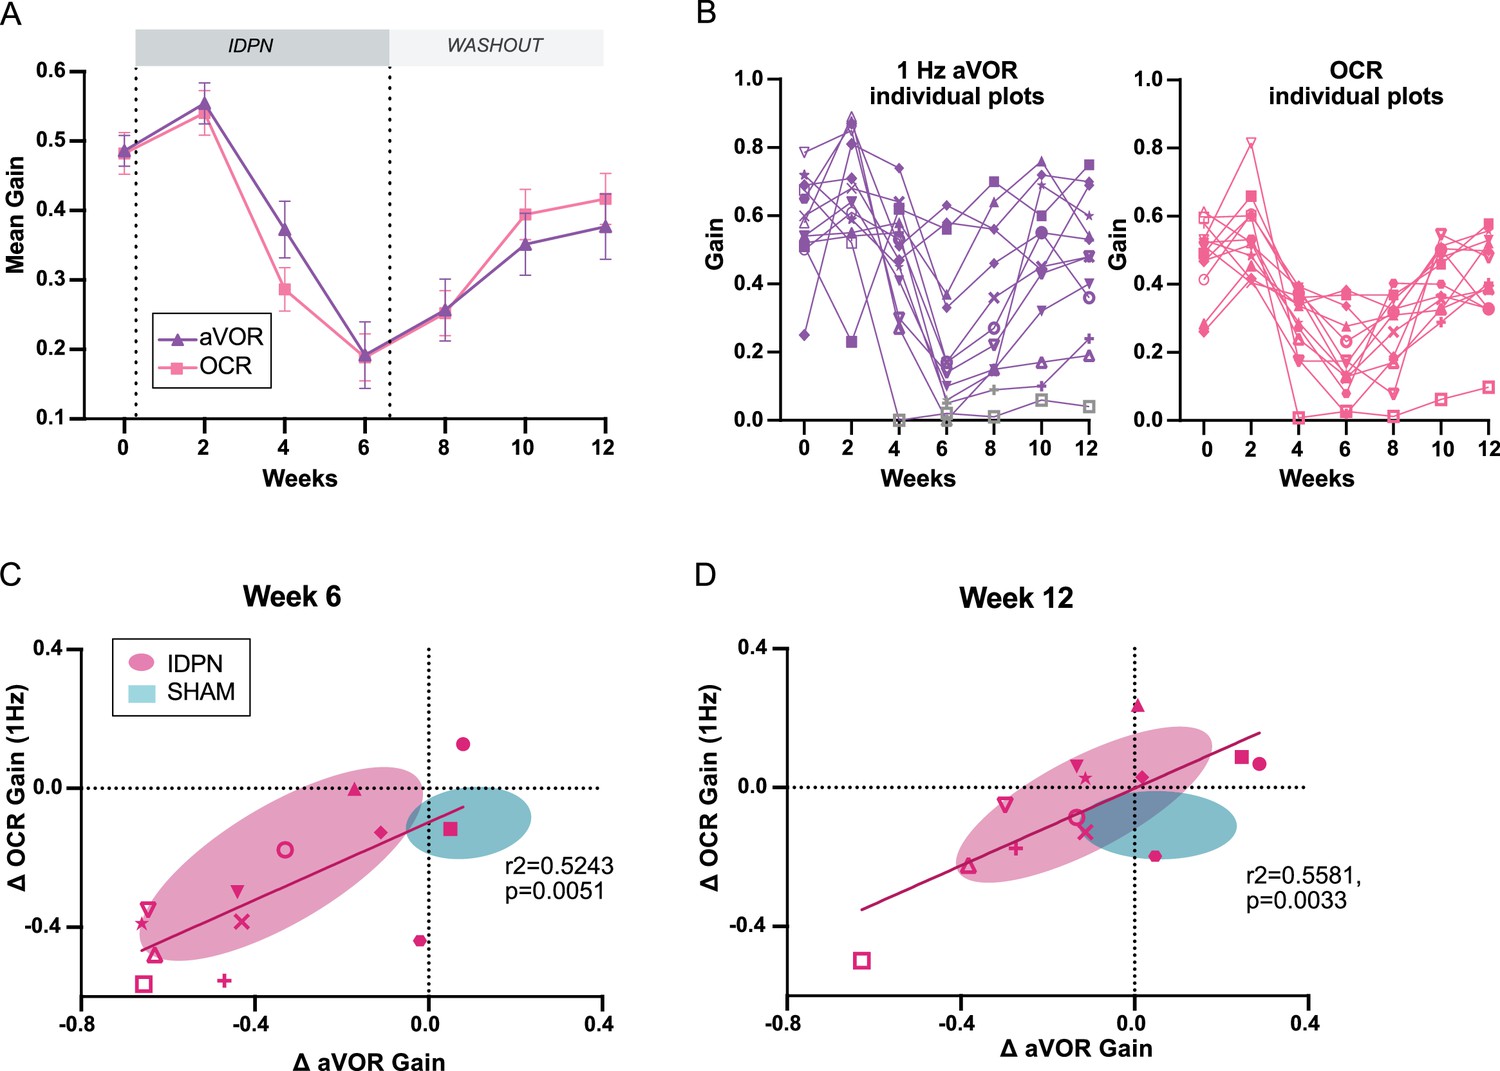
Comparison of the dynamics of canalar and otolithic loss of function.
(A) Evolution of the Mean Gain of the aVOR (1 Hz) and OCR responses of IDPN mice (n=13) during the treatment and washout periods. (B) Individual gains for 1 Hz aVOR (left) and OCR (right) of the 13 IDPN mice, identified with similar symbols. The grey symbols in the left panel correspond to aVOR gain values associated with VAF <0.5. (C, D) Individual ΔaVOR gains as a function of individual ΔOCR gains at W6 (C) and W12 (D) compared to W0, for SHAM (n=14) and IDPN (n=13) mice. The linear regression corresponds to IDPN values is represented, as well as the 50% confidence interval of each group (shaded areas). The symbols for each animal are the same in panels B, C, and D. (*p<0.05; **p<0.01; ***p<0.001). Error bars represent ± SEM.
-
Figure 2—source data 1
Comparison of the dynamics of canalar and otolithic loss of function.
- https://cdn.elifesciences.org/articles/88819/elife-88819-fig2-data1-v2.xlsx
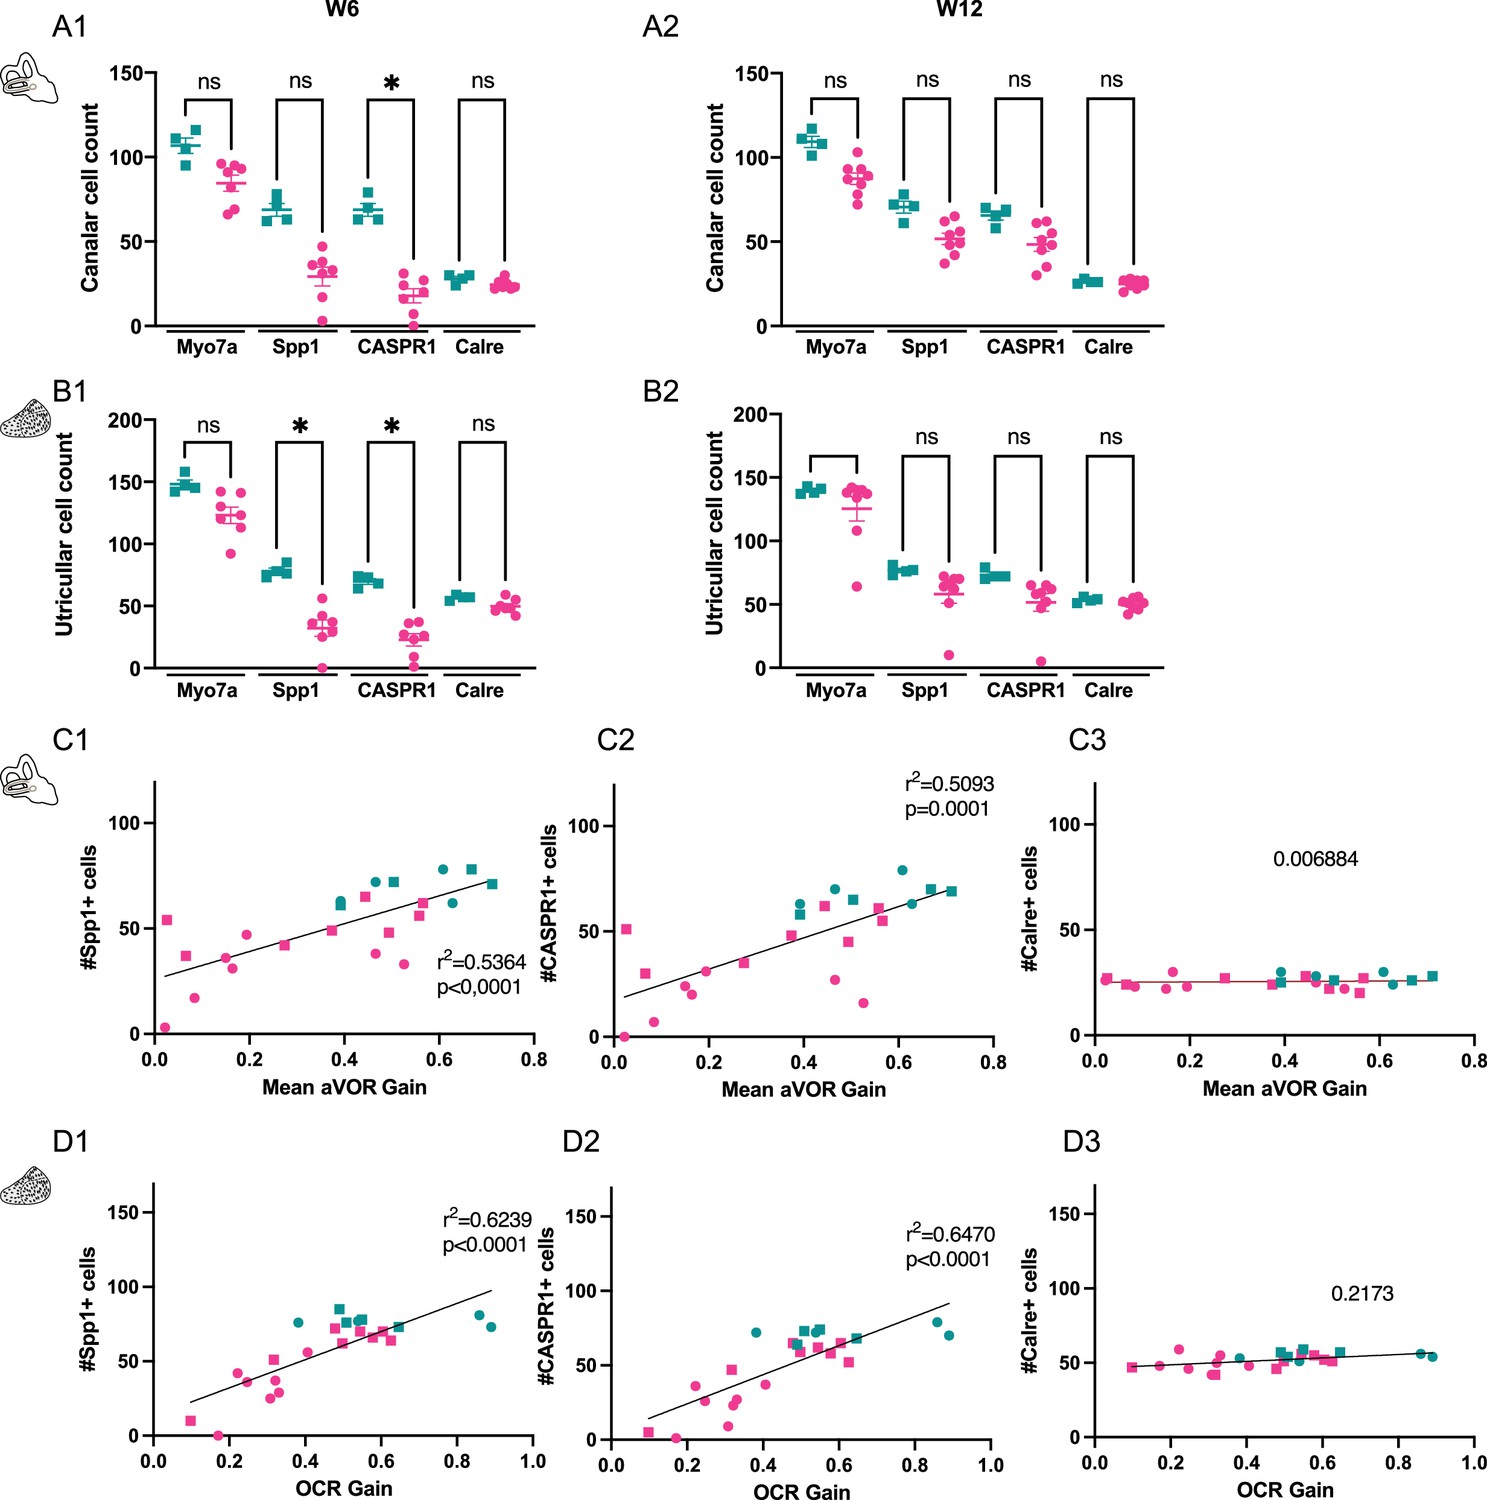
Figure 3 with 1 supplement
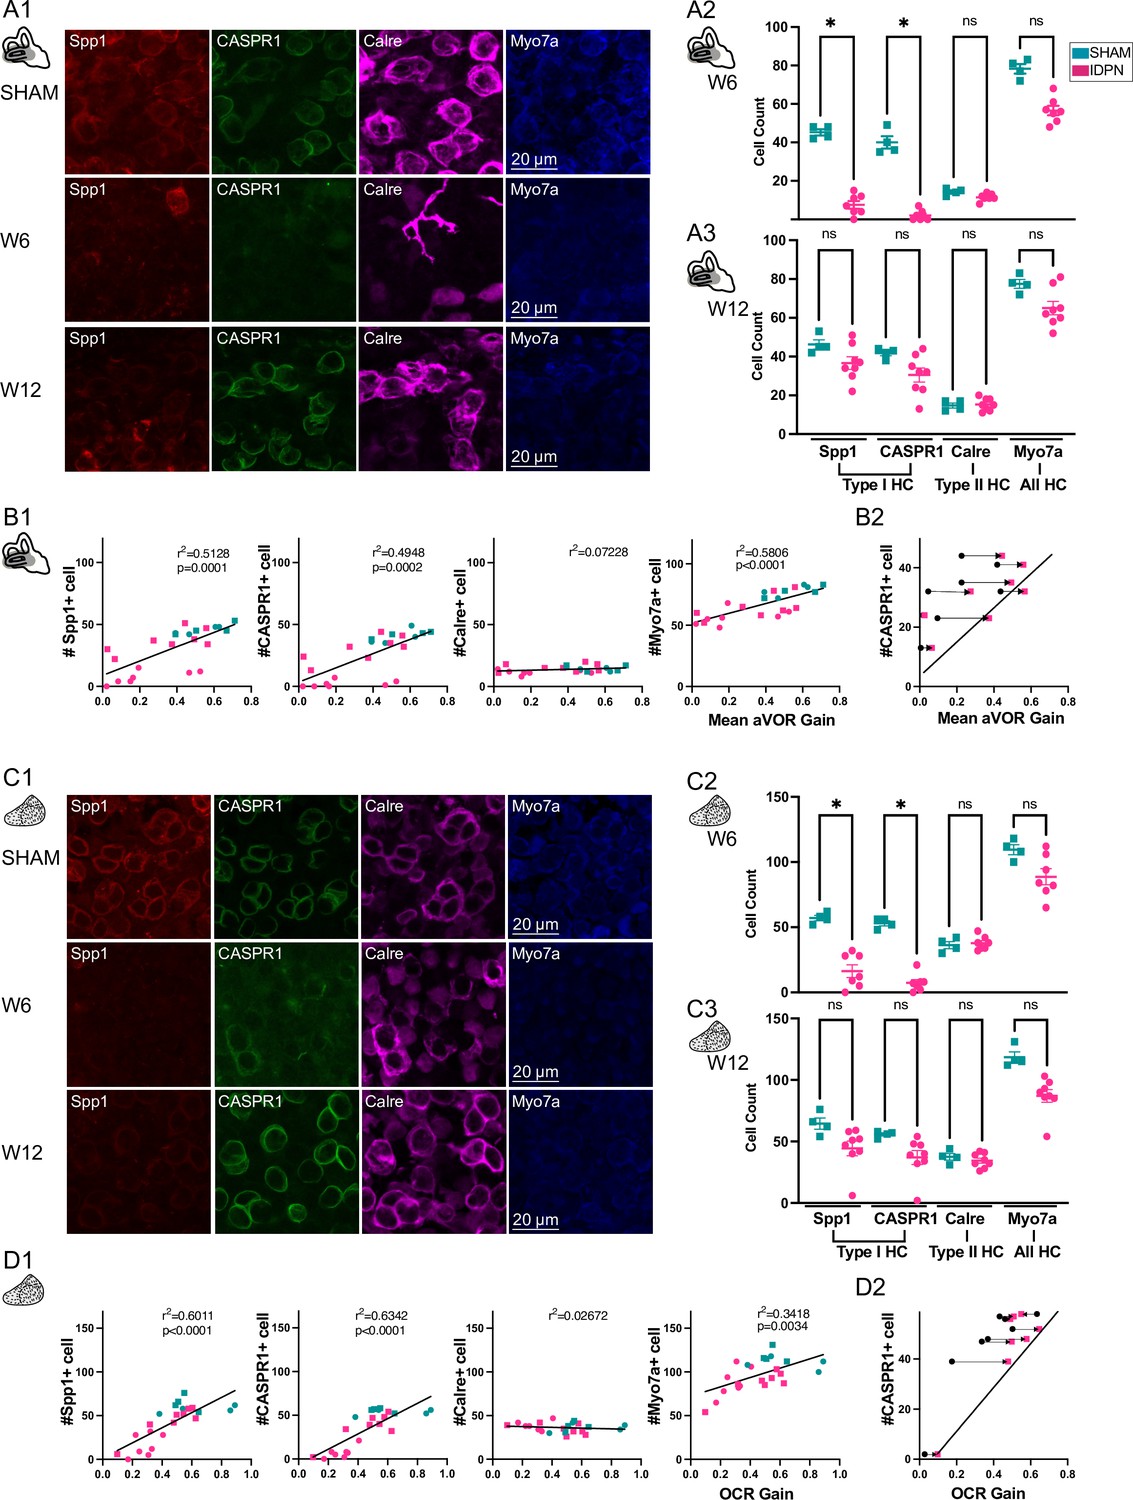
Immuno-labelling of HC in the central regions of the horizontal SCC ampulla and striolar region of the utricule Macula.
(A, C) Immunolabelling of type I HC (Spp1 + and CASPR1+), type II HC (Calre +), or all HC (Myo7a) for the SHAM, IDPN W6 and IDPN W12 groups in the central ampulla of the horizontal canal (A1) and central utricular maculae (C1). Cell count at W6 and W12 in the central horizontal ampulla (A2 and A3) and central utricular maculae (C2 and C3) for individual mice (Kruskal Wallis test). (B1, D1) Individual number of central Spp1 + type I HC, CASPR1 + type I HC and Calre + type II HC, or all HC(Myo7a) as a function of the aVOR gain (B1) or OCR gain (D1) at W6 (circle) and W12 (squares) groups. The linear regressions correspond to all individuals (n=23 mice). (B2, D2) Comparison of the number of CASPR1 type I HC as a function of the aVOR (B2) gain or OCR gain (D2) at W6 (black and circle) and at W12 (pink and square) for each IDPN mice of the W12 group (n=8). Note that all points are shifted toward the regression line (redrawn from respectively B1 and D1), indicating that the number of cells at W12 better correlates with the recovered aVOR. (*p<0.05; **p<0.01; ***p<0.001). Error bars represent ± SEM.
-
Figure 3—source data 1
Immuno-labelling of HC in the central regions of the horizontal SCC ampulla and striolar region of the utricule Macula.
- https://cdn.elifesciences.org/articles/88819/elife-88819-fig3-data1-v2.xlsx
Figure 3—figure supplement 1
Effects of the IDPN on the number of HC in the peripheral regions of the horizontal SCC ampulla and extrastriolar utricule Macula.
(A) Individual cell count of peripheral horizontal semi-circular canal type I and type II HC for W6 (1) andW12 (2). (B) Cell count of peripheral utricular type I and type II HC for W6 (1) and W12 (2) (Kruskal Wallis test). (C) Individual number of peripheral Spp1 +type I HC (1), CASPR1 +type I HC (2) and Calre +type II HC (3) as a function of the aVOR gain for W6 (circle) and W12 (squares). The linear regressionof both groups (n=23 mice) and the goodness of fit is represented. (D) Individual number of peripheral Spp1 +type I HC (1), CASPR1 +type I HC (2) and Calre +type II HC (3) as a function of the OCR gain for W6 (circle) and W12 (squares). The linear regression of both groups (n=23 mice) and the goodness of fit is represented. (*p<0.05; **p<0.01; ***p<0.001). Error bars represent ± SEM.
Figure 4 with 1 supplement
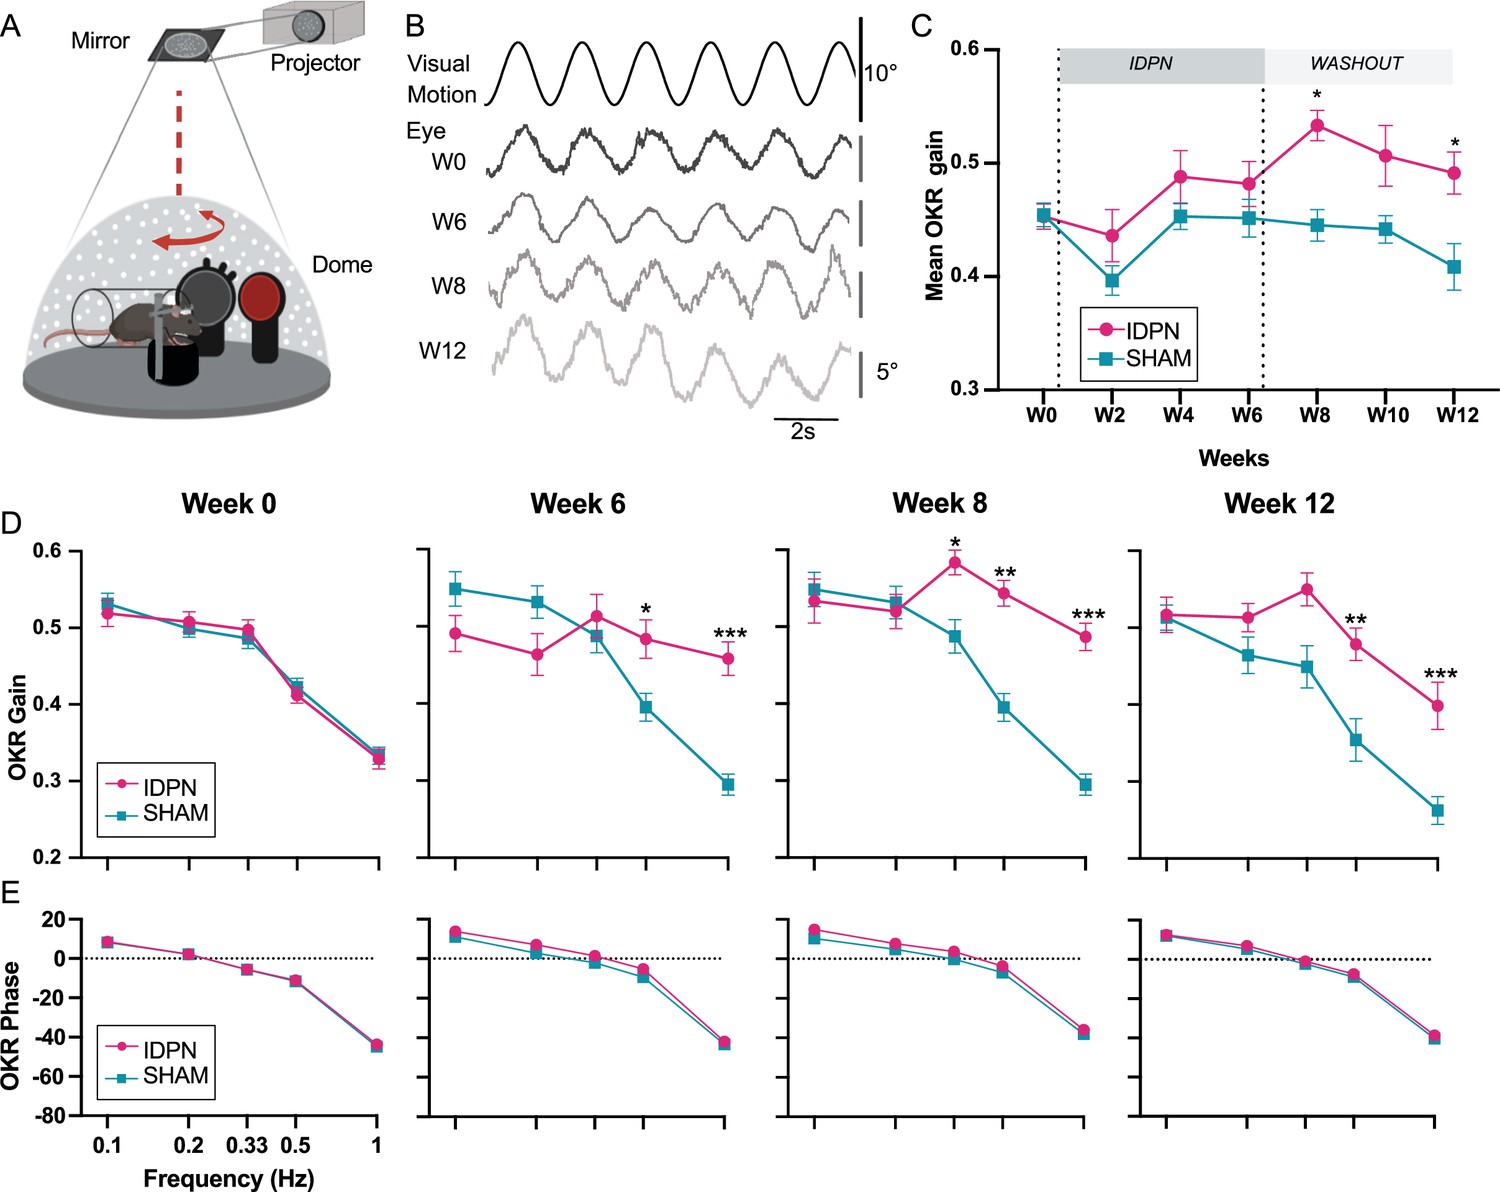
Effects of subchronic IDPN treatment on the OKR.
(A) Illustration of the optokinetic reflex (OKR) set-up. (B) Example of raw traces of an OKR recorded in response to stimulation at 0.5 Hz at a peak velocity of 10°/s before (W0), after 4 weeks of IDPN treatment (W4), 2 weeks (W8) and 6 weeks of washout (W12). All traces are from the same individual. (C) Mean OKR gain of IDPN (n=12) and SHAM (n=12) mice (repeated measures ANOVA). (D) OKR gain and (E) phase for IDPN (n=12) and SHAM (n=12) for each frequency at W0, W6, W8 and W12 (repeated measures ANOVA). (*p<0.05; **p<0.01; ***p<0.001). Error bars represent ± SEM.
Figure 4—figure supplement 1
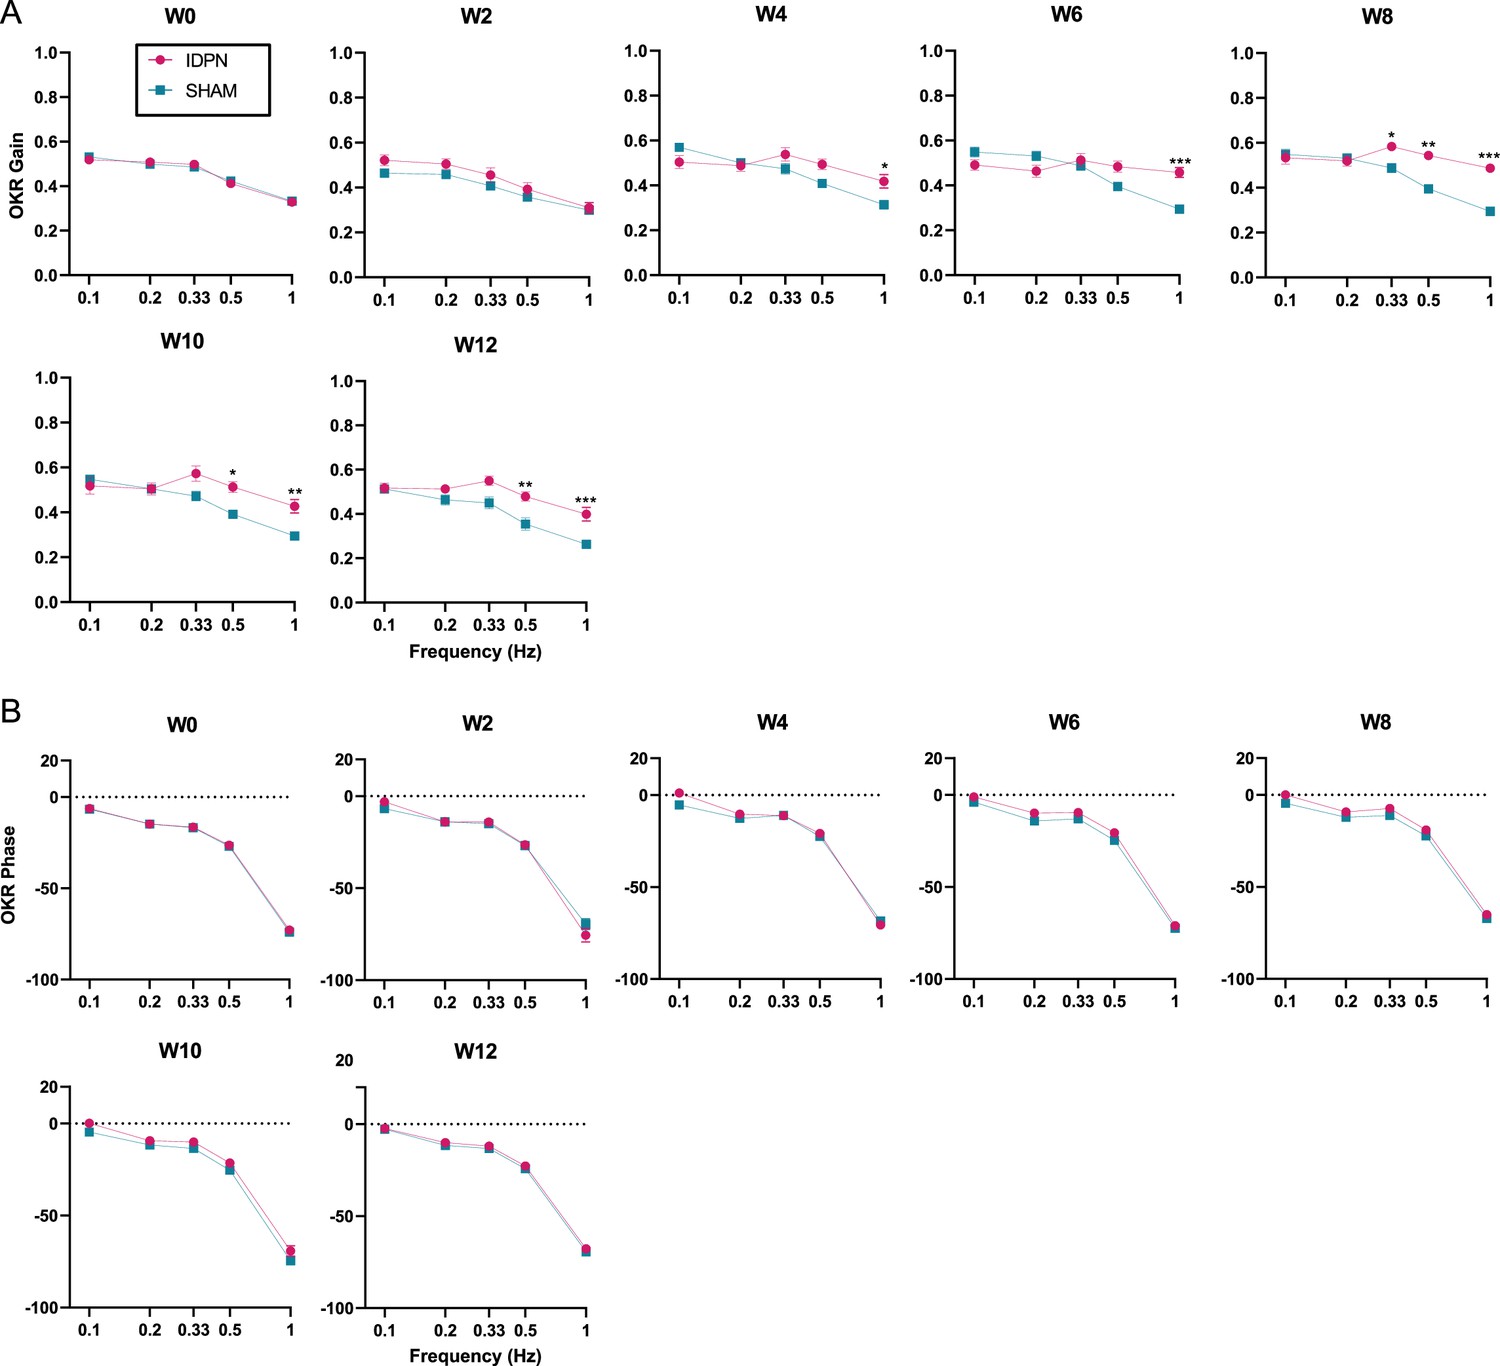
Effect of the IDPN on optokinetic reflex amplitude and timing.
(A) OKR Gain across all frequencies and weeks tested (B) OKR Phase across all frequencies and weeks tested. (repeated measures ANOVA, *p<0.05; **p<0.01; ***p<0.001). Error bars represent ± SEM.
Figure 5
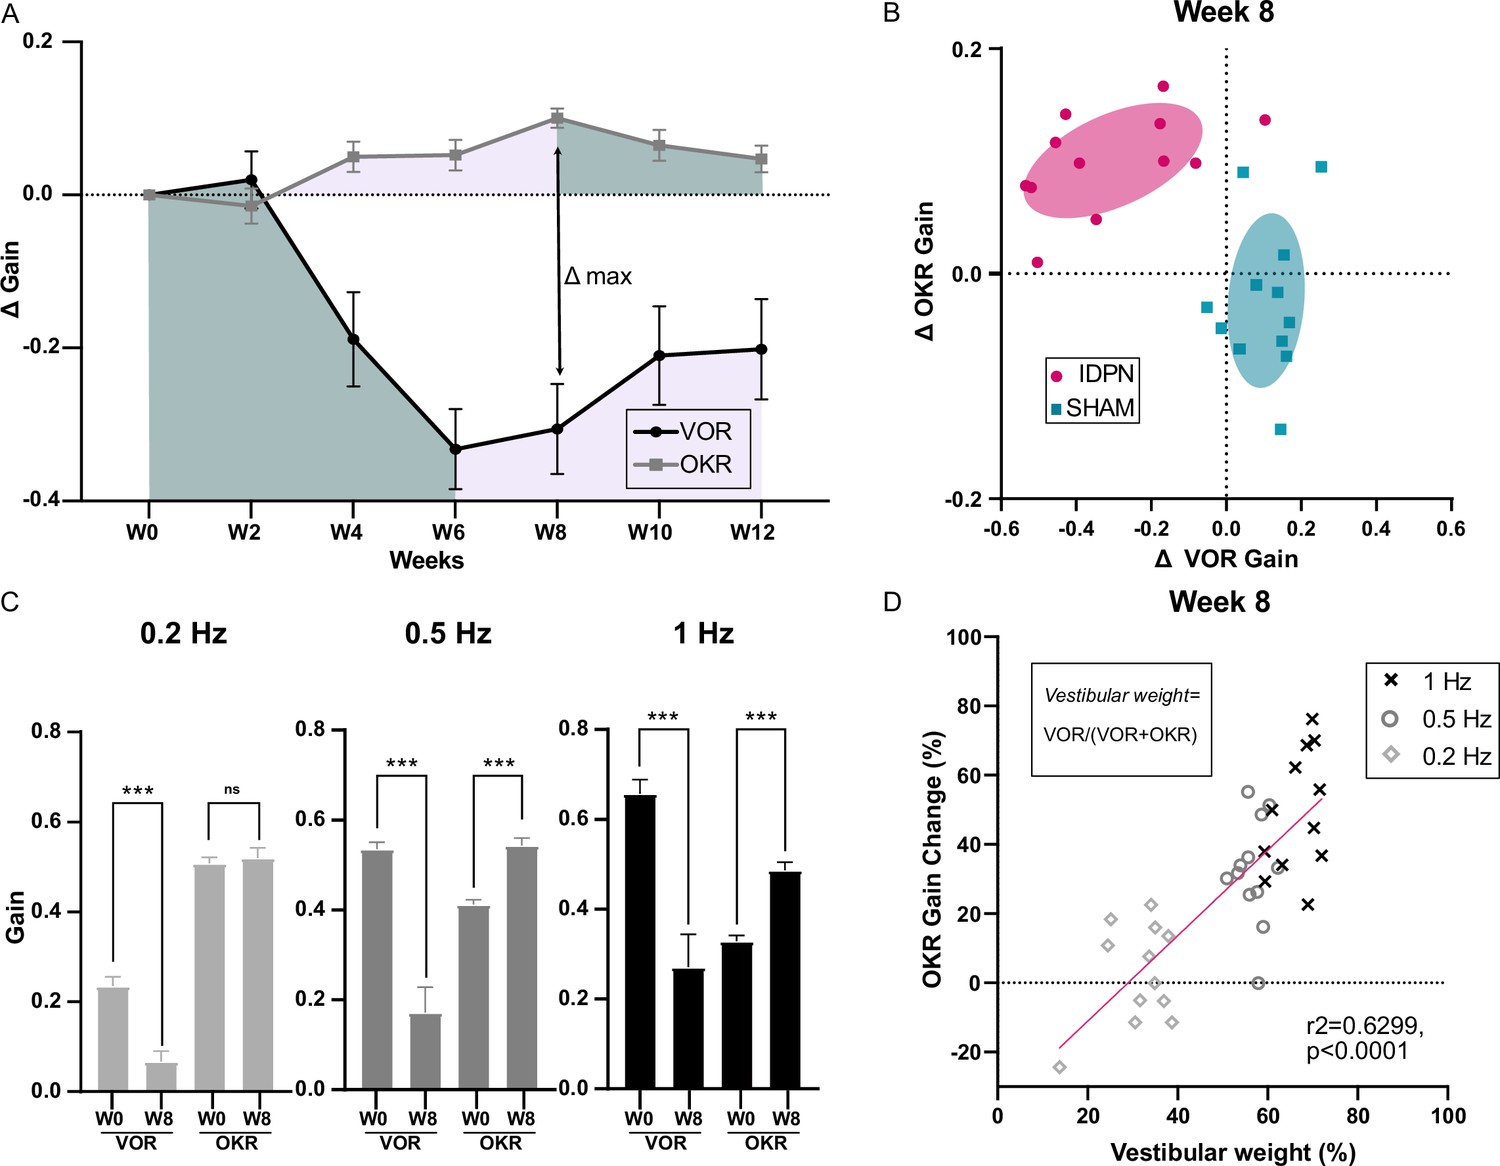
Comparison of the IDPN treatment on OKR and aVOR.
(A) Mean Δ aVOR and Δ Gain OKR for 0.2, 0.5, and 1 Hz for IDPN (n=12) and SHAM (n=12) mice. (B) Individual ΔOKR gains as a function of individual ΔaVOR gains. The 50% confidence interval of each group is represented in the shaded areas. (C) aVOR and OKR gains of IDPN mice (n=12) at W0 and W8 for frequencies of 0.2, 0.5, and 1 Hz (repeated measures ANOVA). (D) Percentage of the individual vestibular weight (inset), as a function of the percentage of the individual OKR gains change for IDPN (n=12). The linear regression corresponds to all values (n=36). (*p<0.05; **p<0.01; ***p<0.001). Error bars represent ± SEM.
Figure 6
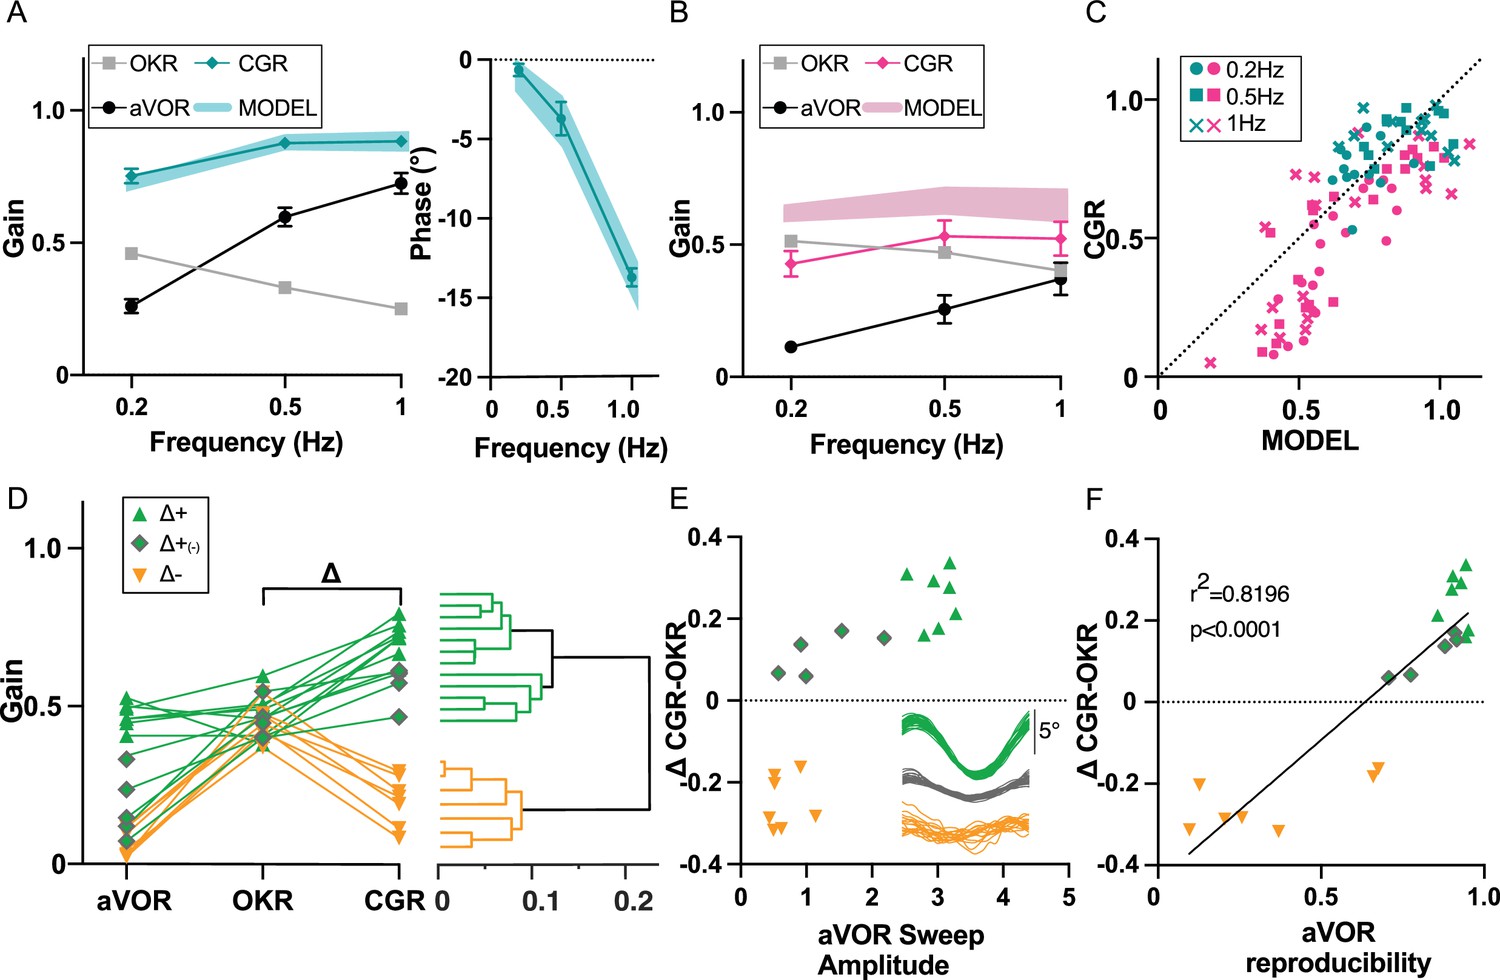
Visuo-Vestibular interactions following IDPN treatment.
(A) aVOR, OKR, CGR data (CGR) and predicted CGR (MODEL) gains (left panel), and CGR phase (data and model, right panel), for the SHAM mice (n=12) at W6 and W12. (B) aVOR, OKR, CGR data (CGR) and predicted CGR (MODEL) gains for the IDPN mice (n=19) at W6 and W12. (C) Comparison of the predicted versus measured CGR for all frequencies tested. The dotted line at 45° represents a perfect match between prediction and data (optimal CGR). (D) aVOR, OKR, and CGR values of the IDPN mice (n=19) (left panel). Clustering analysis (right panel) distinguish two groups based on Delta (CGR-OKR), and a subgroup based on VOR. The horizontal coordinate of each cluster (vertical lines) represents the distance between two connected clusters. (E) Δ(CGR-OKR) as a function of the VOR Sweep Amplitude of the Δ+ (green triangle), Δ+(-) (green diamonds) and Δ- (orange) IDPN mice. The inset panel represents typical raw cycles representative of the three subgroups. (F) Delta (CGR-OKR) as a function of the VOR reproducibility of the Δ+ (green triangle), Δ+(-) (green diamonds), and Δ- (orange) IDPN mice. Regression line correspond to all values (n=19).
-
Figure 6—source data 1
Visuo-Vestibular interactions following IDPN treatment.
- https://cdn.elifesciences.org/articles/88819/elife-88819-fig6-data1-v2.xlsx
Tables
Table 1
Statistics table of the aVOR gain for the IDPN-treated group.
| W0 | W2 | W4 | W6 | W8 | W10 | W12 | |
|---|---|---|---|---|---|---|---|
| ns | *** | *** | *** | *** | *** | W0 | |
| ns | *** | *** | *** | *** | *** | W2 | |
| *** | *** | *** | *** | ns | ns | W4 | |
| *** | *** | *** | * | *** | *** | W6 | |
| *** | *** | *** | * | *** | *** | W8 | |
| *** | *** | ns | *** | *** | ns | W10 | |
| *** | *** | ns | *** | *** | ns | W12 |
Table 2
Statistics table of the OKR gain for the IDPN-treated group.
| W0 | W2 | W4 | W6 | W8 | W10 | W12 | |
|---|---|---|---|---|---|---|---|
| ns | ns | ns | *** | ns | ns | W0 | |
| ns | ns | ns | *** | ** | ns | W2 | |
| ns | ns | ns | ns | ns | ns | W4 | |
| ns | ns | ns | * | ns | ns | W6 | |
| *** | *** | ns | * | ns | ns | W8 | |
| ns | ** | ns | ns | ns | ns | W10 | |
| ns | ns | ns | ns | ns | ns | W12 |
Key resources table
| Reagent type (species) or resource | Designation | Source or reference | Identifiers | Additional information |
|---|---|---|---|---|
| Antibody | Anti-Myosin 740 VIIa (rabbit polyclonal) | Proteus Biosciences | Cat#:25–6790 | 1/400 |
| Antibody | Anti-rabbit IgG H+L (donkey polyclonal) | Jackson Immuno Research | RRID:AB_2340616 | 1/500 |
| Antibody | Anti-contactin-associated protein (mouse monoclonal) | Neuromab | Cat#:75–001 | 1/400 |
| Antibody | Anti-mouse IgG H+L (donkey polyclonal) | Life Technologies | RRID:AB_141607 | 1/500 |
| Antibody | Anti-calretinin (guinea-pig polyclonal) | Synaptic Systems | Cat#: 214 104 | 1/500 |
| Antibody | Anti-guinea-pig IgG H+L (donkey polyclonal) | Jackson Immuno Research | RRID:AB_2340476 | 1/500 |
| Antibody | Anti-osteopontin (goat polyclonal) | R&D Systems | Cat#:AF808 | 1/400 |
| Antibody | Anti-goat IgG H+L (donkey polyclonal) | Invitrogen | RRID:AB_2535853 | 1/500 |
| Software | Spike2 | Cambridge Electronic Design | RRID:SCR_000903 | |
| Software | Prism | GraphPad | RRID:SCR_002798 | |
| Software | ImageJ | National Institutes of Health | RRID:SCR_003070 |
Additional files
Download links
A two-part list of links to download the article, or parts of the article, in various formats.
Downloads (link to download the article as PDF)
Open citations (links to open the citations from this article in various online reference manager services)
Cite this article (links to download the citations from this article in formats compatible with various reference manager tools)
Multisensory gaze stabilization in response to subchronic alteration of vestibular type I hair cells
eLife 12:RP88819.
https://doi.org/10.7554/eLife.88819.3


