Unveiling the domain-specific and RAS isoform-specific details of BRAF kinase regulation
- Rowan University, United States
- Max Planck Institute of Biophysics, Germany
- School of Laboratory Medicine and Life Science, Wenzhou Medical University, China
Figures
Figure 1 with 1 supplement
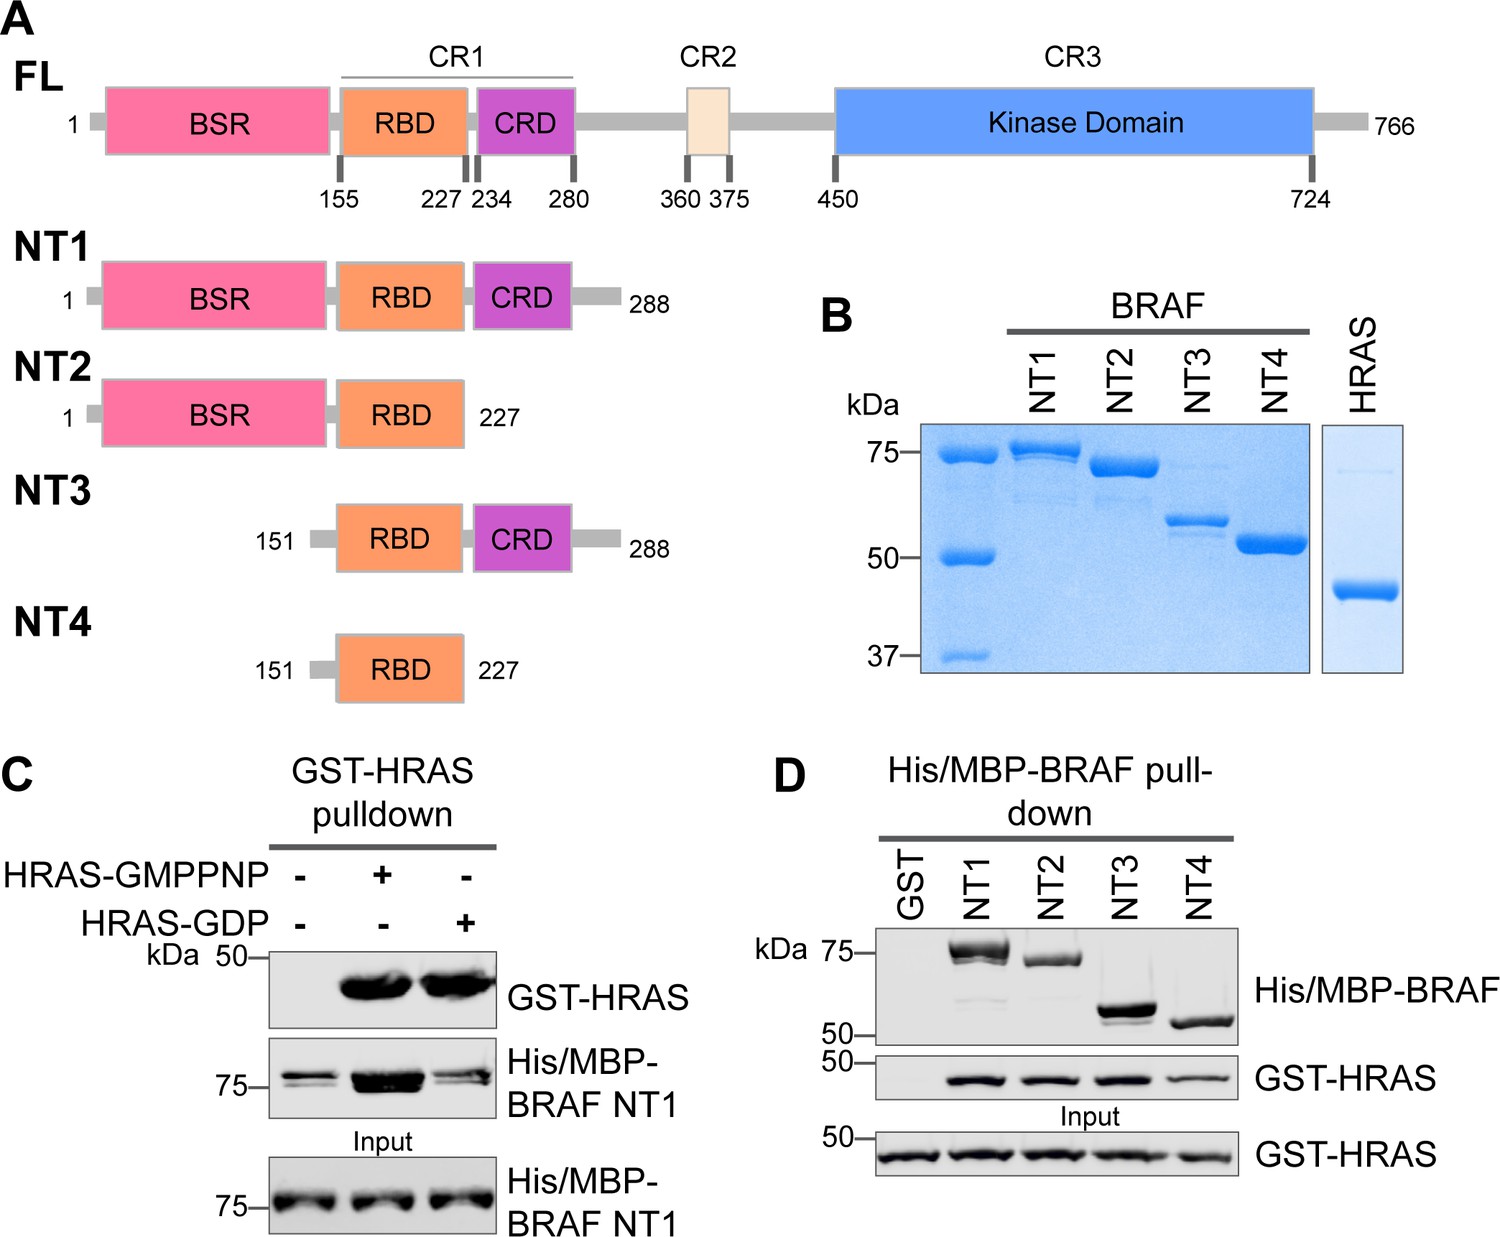
Specific purified N-terminal domains are involved in HRAS interactions.
(A) Diagram of BRAF NT constructs. Top panel is full-length BRAF, followed by proteins NT1–4 expressed in Escherichia coli and purified. Not shown: 6xHis/MBP tag on the N-terminal of NT proteins. BSR: BRAF specific region; RBD: RAS binding domain; CRD: cysteine rich domain. (B) Coomassie stained gels of purified NT1–4 and GST-HRAS. (C) Western blot of HRAS-GMPPNP or HRAS-GDP pulled down on glutathione resin to probe for NT1 binding. (D) Western blot of BRAF NT1–4 pulled down on amylose resin to probe for HRAS-GMPPNP binding.
-
Figure 1—source data 1
(Panel b) Coomassie stained gels of purified NT1–4 and GST-HRAS.
- https://cdn.elifesciences.org/articles/88836/elife-88836-fig1-data1-v1.zip
-
Figure 1—source data 2
(Panel c) Western blot of HRAS-GMPPNP or HRAS-GDP pulled down on glutathione resin to probe for NT1 binding.
HRAS probed with anti-GST antibody; NT1 probed with anti-His antibody.
- https://cdn.elifesciences.org/articles/88836/elife-88836-fig1-data2-v1.zip
-
Figure 1—source data 3
(Panel d) Western blot of BRAF NT1–4 pulled down on amylose resin to probe for HRAS-GMPPNP binding.
HRAS probed with anti-GST antibody; NT1 probed with anti-His antibody.
- https://cdn.elifesciences.org/articles/88836/elife-88836-fig1-data3-v1.zip
Figure 1—figure supplement 1
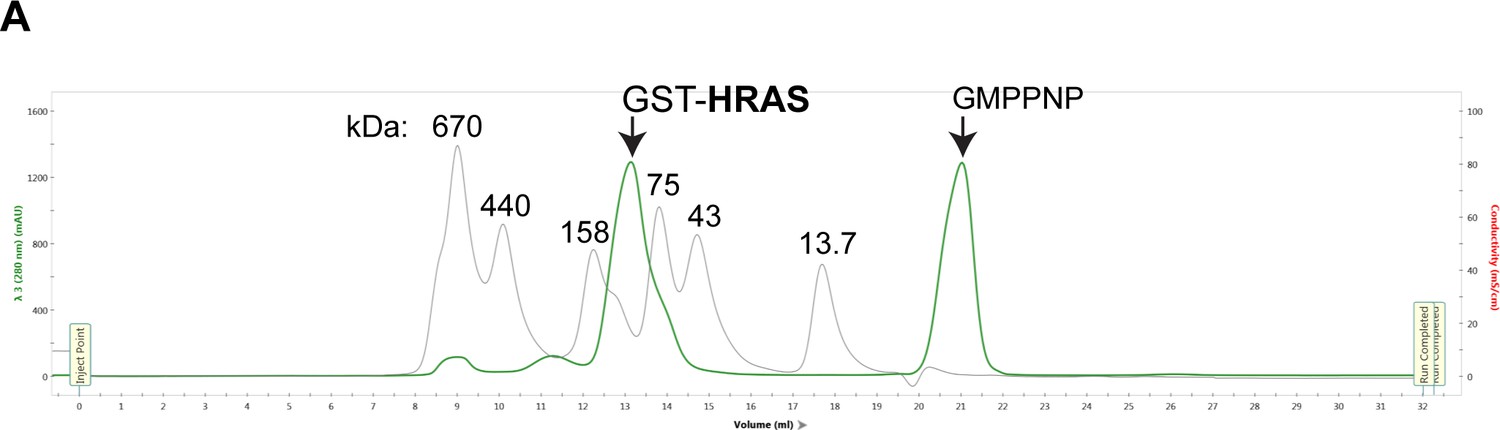
SEC of active GST-HRAS.
(A) GST-HRAS monomer is ~45 kDa and elutes as a dimer at ~90 kDa. HRAS elution profile (green) on a Superdex 200 (Cytiva) overlayed with protein size standard elution profile (gray) labeled in kDa.
Figure 2 with 3 supplements
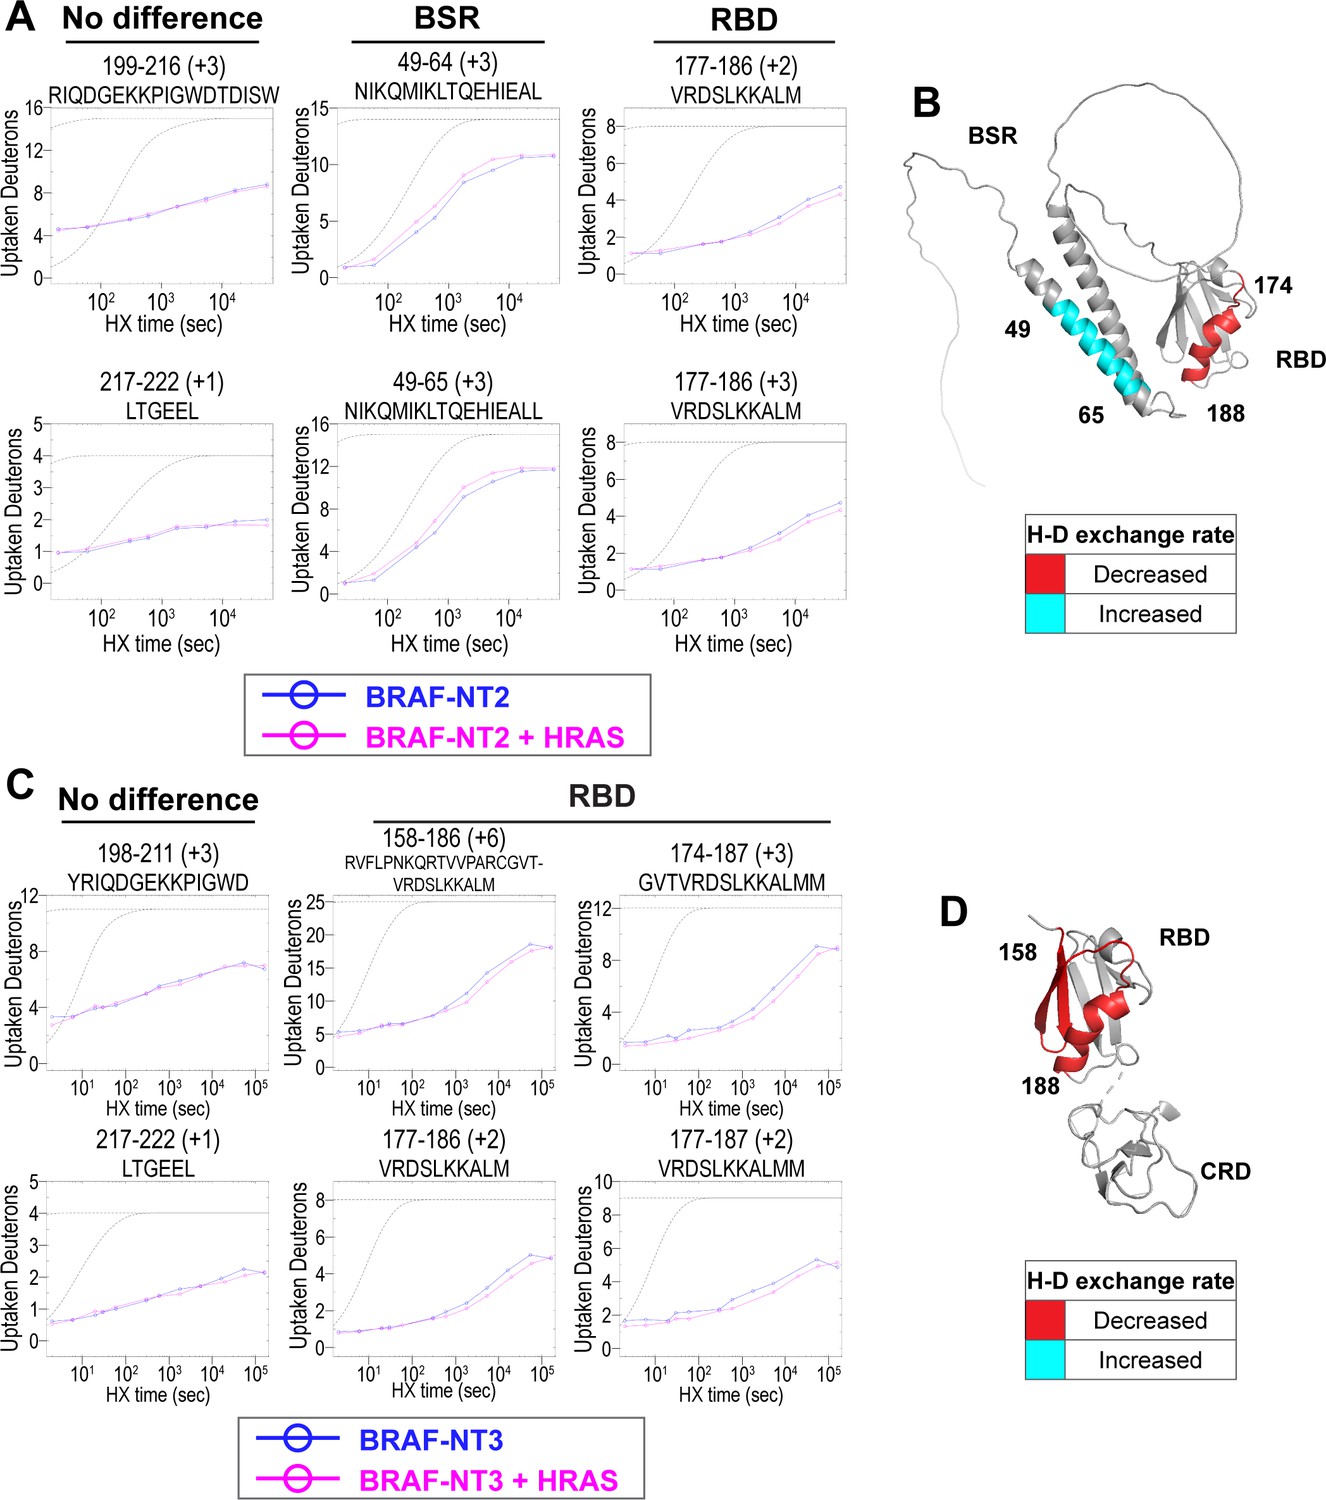
Hydrogen-deuterium exchange mass spectrometry (HDX-MS) reveals conformational changes of BRAF N-terminal domains in response to active HRAS binding.
(A, C) Representative NT2 (A) and NT3 (C) peptides identified from HDX-MS in the absence (blue) and presence (pink) of HRAS. Peptides with ‘no difference’ in H-D exchange rate are consistent in both NT2 and NT3. Presented peptide plots displaying differences in H-D exchange rate are representative of a trend of at least four multiple overlapping peptides in the BRAF specific region (BSR) and/or RAS binding domain (RBD). Gray dotted lines represent the theoretical exchange behavior for specified peptide that is fully unstructured (top) or for specified peptide with a uniform protection factor (fraction of time the residue is involved in protecting the H-bond) of 100 (lower). (B, D) Deuteron uptake differences of NT2 (B) and NT3 (D) mapped on the predicted BRAF AlphaFold structure, where deuterium exchange is decreased (red) or increased (cyan).
-
Figure 2—source data 1
(Panel a) Raw data used to plot curves with EXMS2.
Also applies to plots presented in Supplementary file 1 and Figure 2—figure supplement 1 and Figure 2—figure supplement 3.
- https://cdn.elifesciences.org/articles/88836/elife-88836-fig2-data1-v1.zip
-
Figure 2—source data 2
(Panel c) Raw data used to plot curves with EXMS2.
Also applies to plots presented in Supplementary file 1; Figure 2—figure supplement 1 and Figure 2—figure supplement 2.
- https://cdn.elifesciences.org/articles/88836/elife-88836-fig2-data2-v1.zip
Figure 2—figure supplement 1
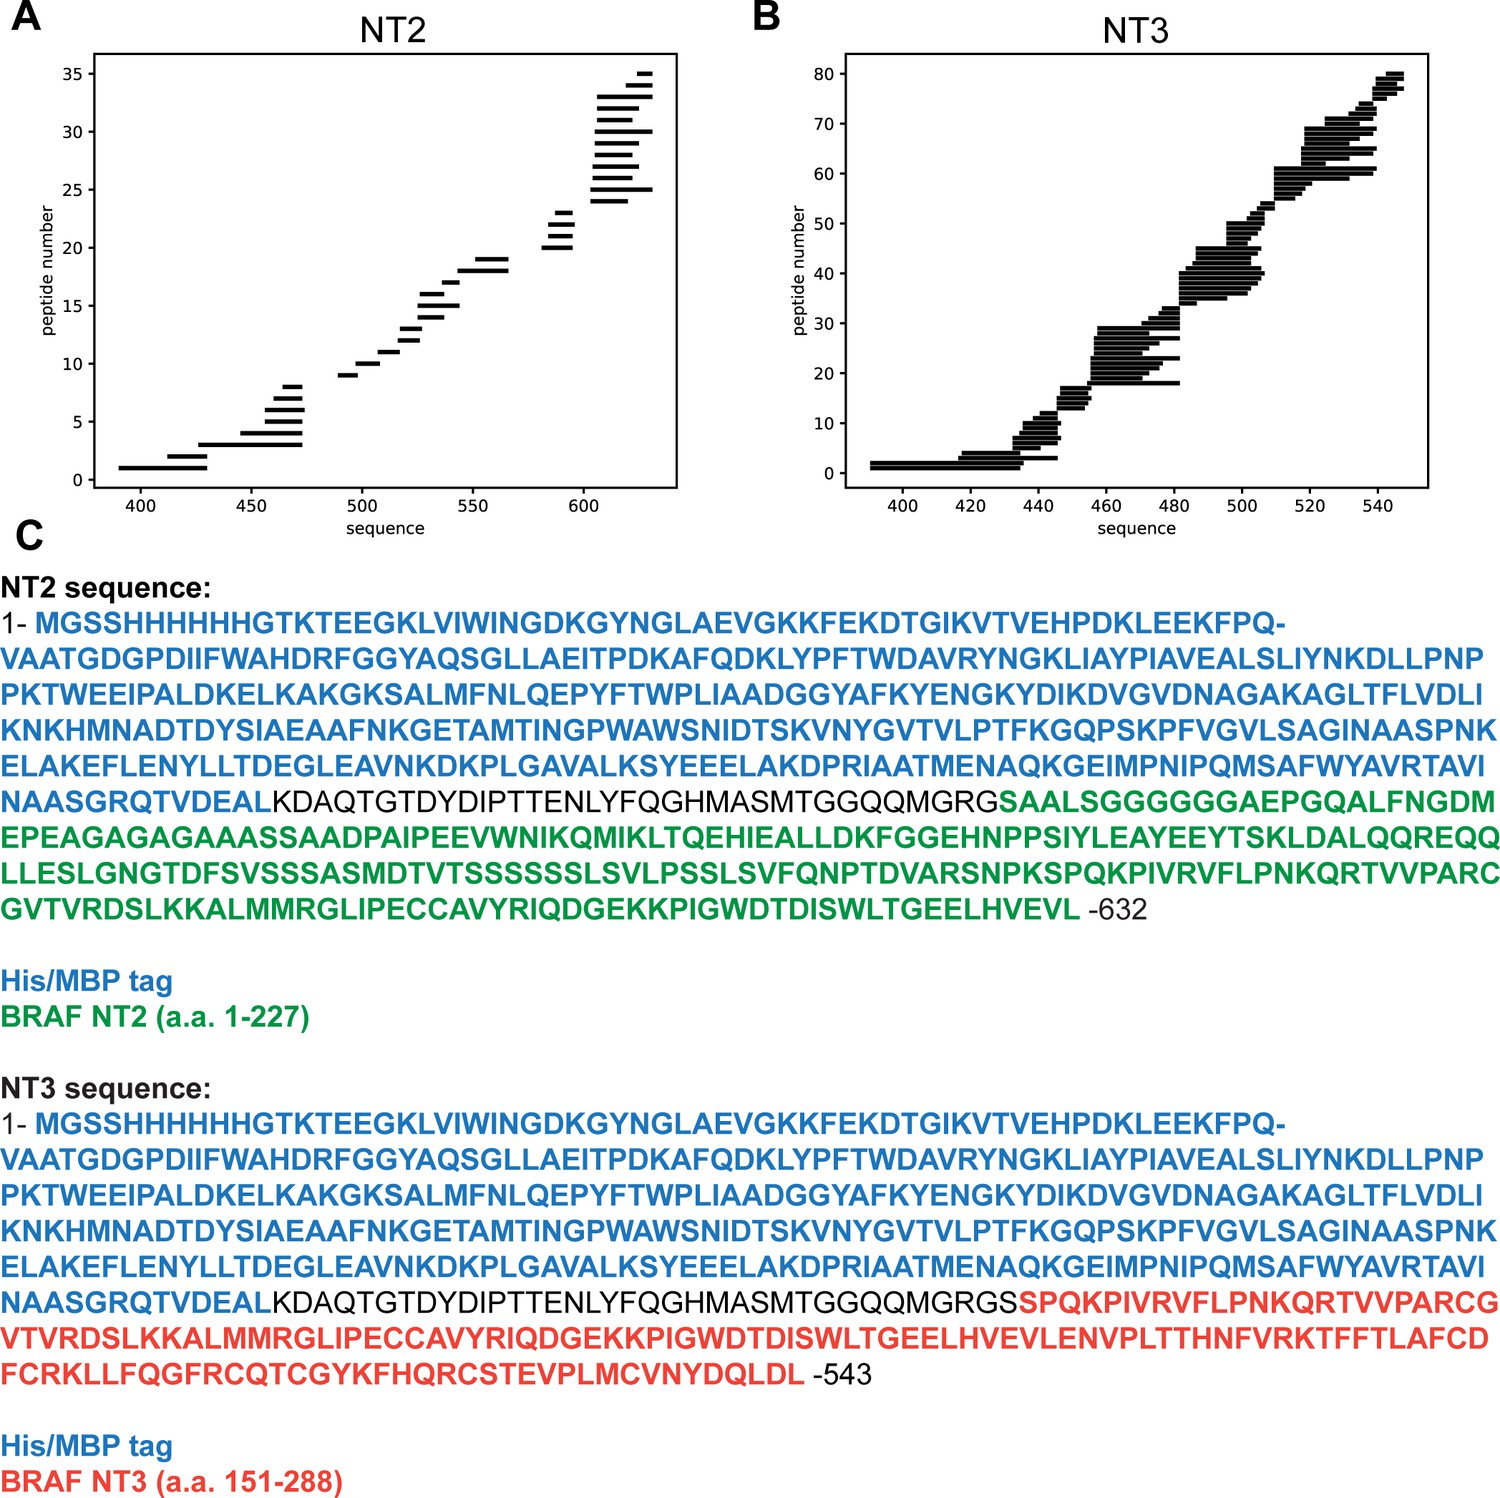
Stripe plots for peptides identified in BRAF NT2 (A) and BRAF NT3 (B).
Peptide coverage shown begins at the start of BRAF NT2 or BRAF NT3 (not shown: coverage for MBP-tag N-terminal to the BRAF sequence). (C) Protein sequences used in MS analysis.
Figure 2—figure supplement 2
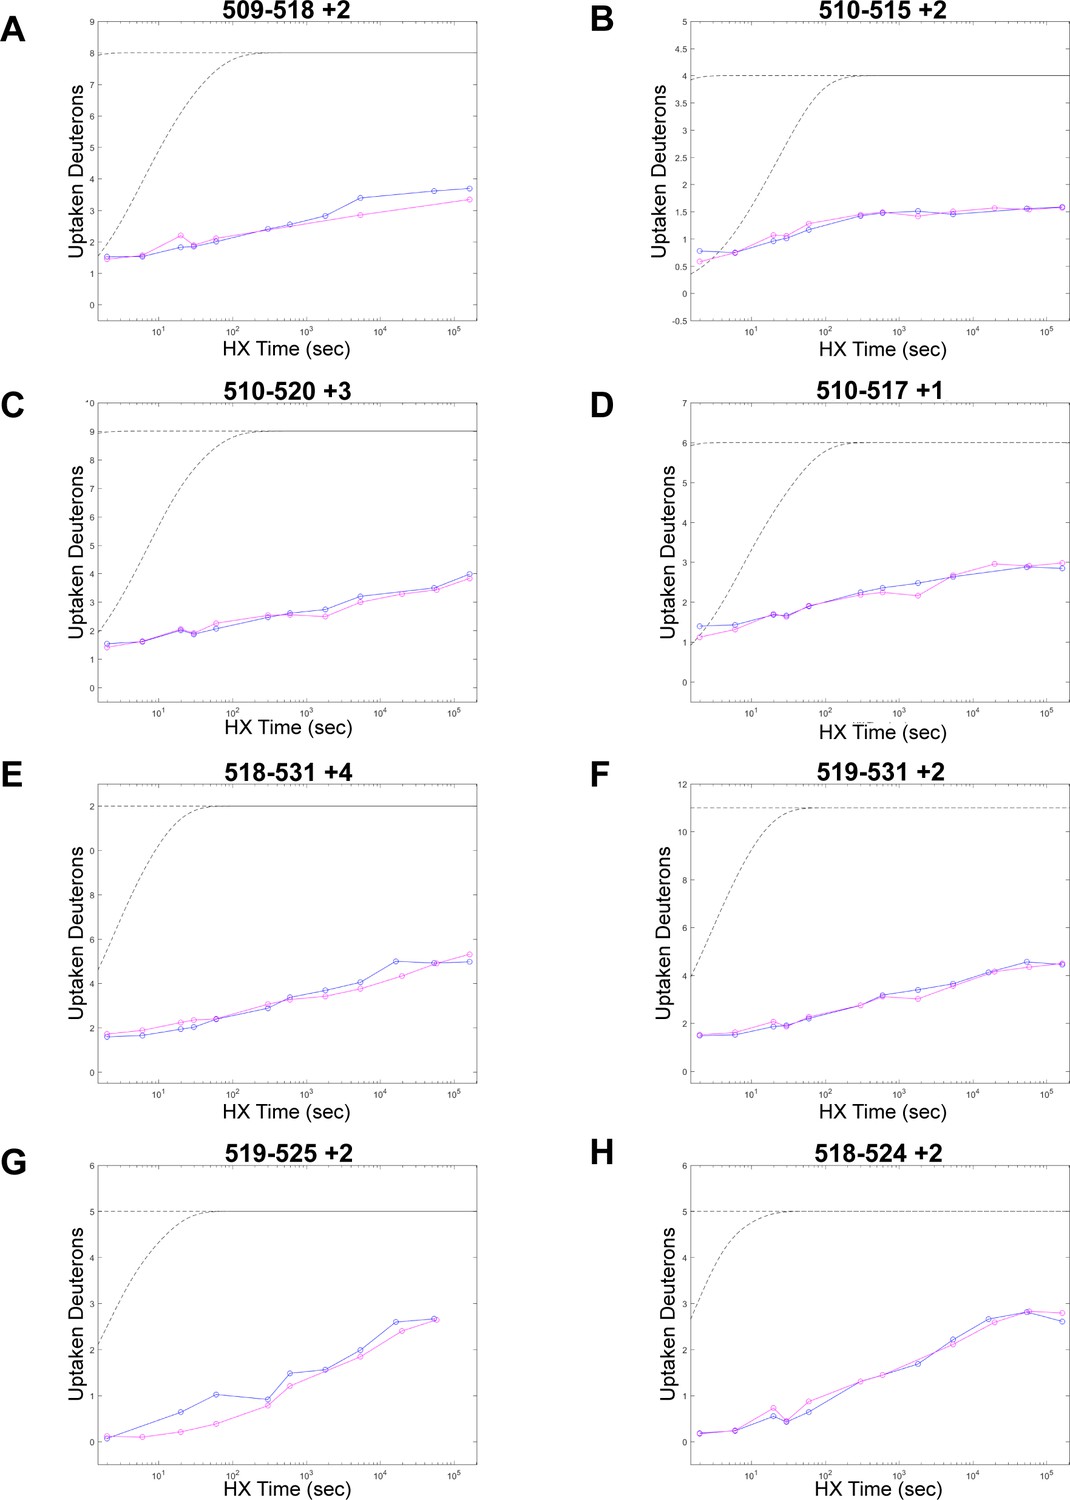
Peptides from NT3 in the cysteine rich domain (CRD) region.
(A, C, E, G) Plots on left represent peptides that could have slowed deuterium exchange rate. (B, D, F, H) Plots on right represent peptides in the same region that show essentially no change. Blue = NT3 apo; magenta = NT3+HRAS. BRAF residues 232–284 (CRD)=peptide residues 491–543. Gray dotted lines represent the theoretical exchange behavior for specified peptide that is fully unstructured (top) or for specified peptide with a uniform protection factor (fraction of time the residue is involved in protecting the H-bond) of 100 (lower).
Figure 2—figure supplement 3
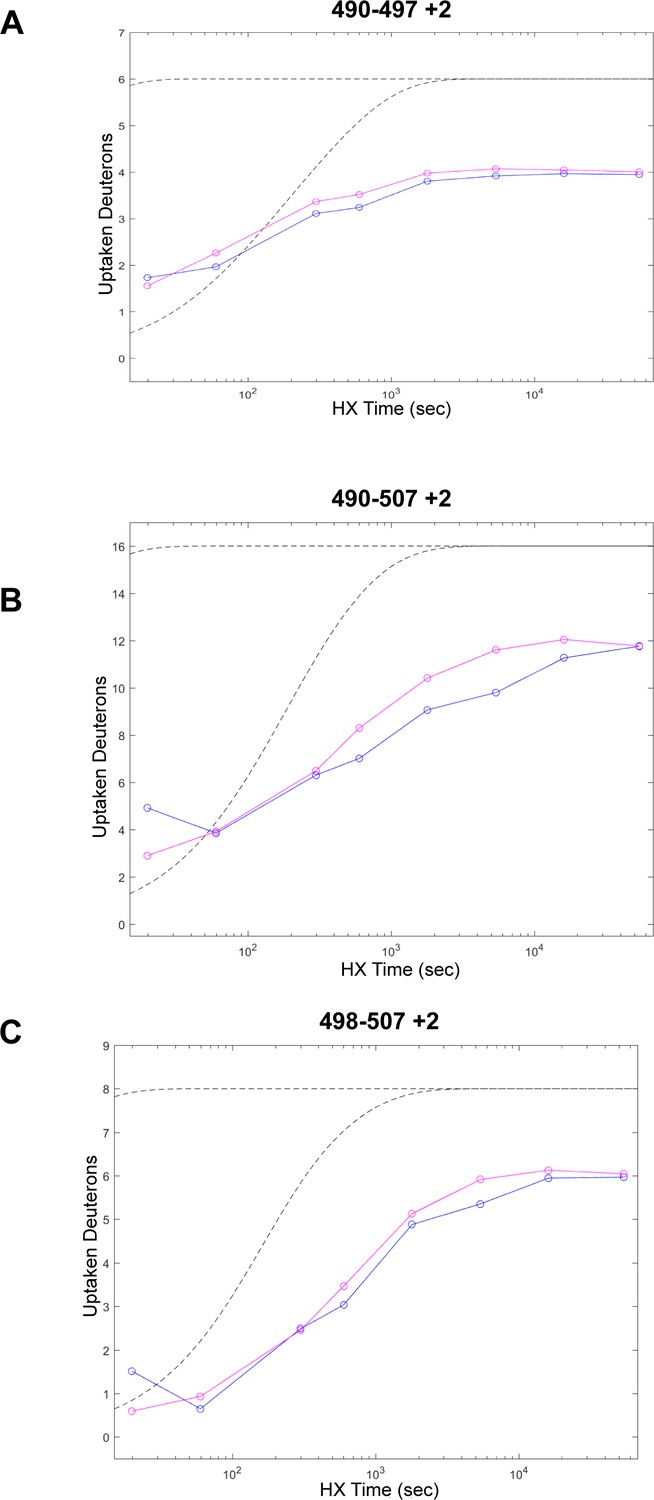
Peptides from NT2 in the BRAF specific region (BSR) (amino acids 82–99).
(A-C) Three representative peptide plots that have increased deuterium exchange rate. Blue = NT2 apo; magenta = NT2+HRAS. BRAF residues 82–99 correspond with peptide residues 490–507. Gray dotted lines represent the theoretical exchange behavior for specified peptide that is fully unstructured (top) or for specified peptide with a uniform protection factor (fraction of time the residue is involved in protecting the H-bond) of 100 (lower).
Figure 3 with 1 supplement
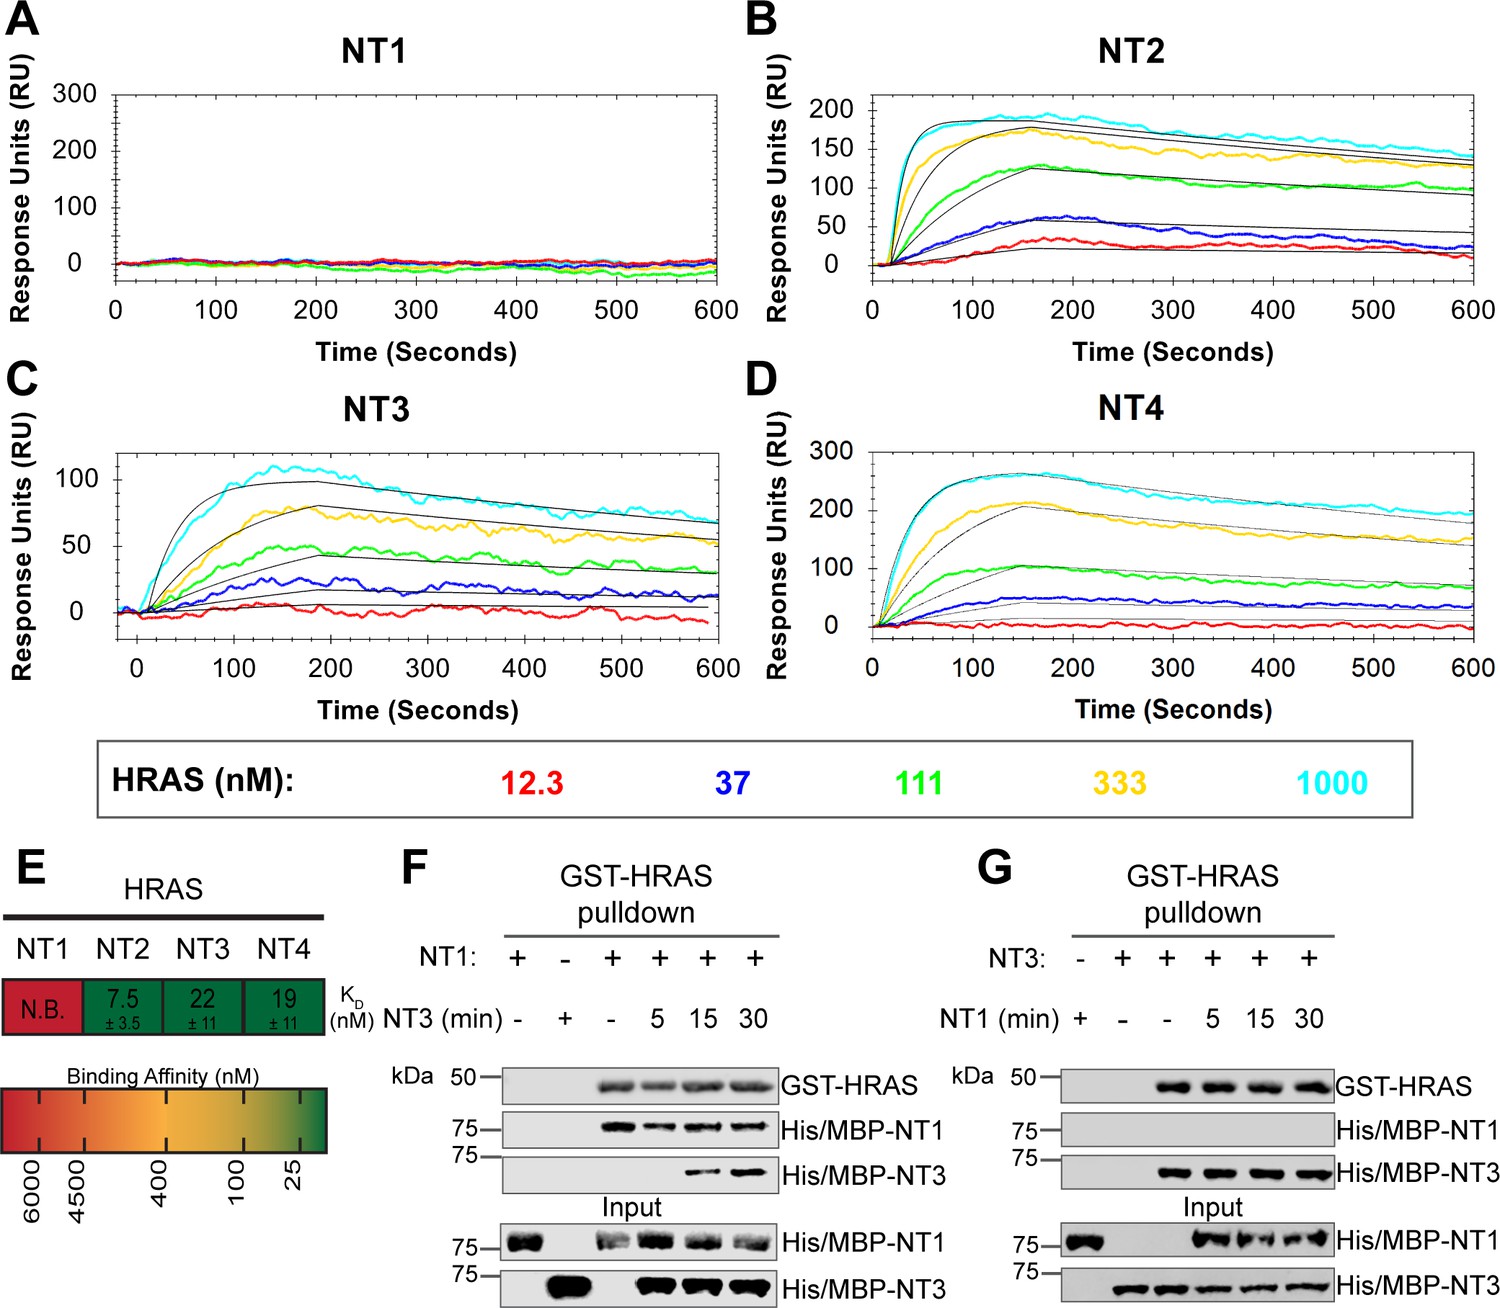
BRAF specific region (BSR) in conjunction with the cysteine rich domain (CRD) reduces binding affinity for HRAS.
(A–D) Open surface plasmon resonance (OpenSPR) binding curves of HRAS flowed over NT1–4 immobilized on NTA sensors and the best fit curves (black) produced from a 1:1 fitting model kinetic evaluation. Representative of independent experiments with similar results each (NT1: n=7, NT2: n=2, NT3: n=2, NT4: n=3). (E) Diagram of the mean dissociation constant (KD) ± standard deviation from independent OpenSPR experiments of HRAS flowed over immobilized NT1–4. (F–G) Western blot of purified His/MBP-NT1 (F) or -NT3 (G) binding to active GST-HRAS on glutathione resin in a pulldown assay and subsequent competition with NT3 (F) or NT1 (G). Representative of two independent experiments each with similar results.
-
Figure 3—source data 1
(Panels a–e) Kinetic evaluation of 1:1 fits made in TraceDrawer for fitted curves NT2, NT3, and NT4.
- https://cdn.elifesciences.org/articles/88836/elife-88836-fig3-data1-v1.zip
-
Figure 3—source data 2
(Panel f) Western blot of purified His/MBP-NT1 binding to active GST-HRAS on glutathione resin in a pulldown assay and subsequent competition with NT3.
HRAS probed with anti-GST antibody; NT1 probed with anti-His antibody.
- https://cdn.elifesciences.org/articles/88836/elife-88836-fig3-data2-v1.zip
-
Figure 3—source data 3
(Panel g) Western blot of purified His/MBP-NT3 binding to active GST-HRAS on glutathione resin in a pulldown assay and subsequent competition with NT1.
HRAS probed with anti-GST antibody; NT1 probed with anti-His antibody.
- https://cdn.elifesciences.org/articles/88836/elife-88836-fig3-data3-v1.zip
Figure 3—figure supplement 1
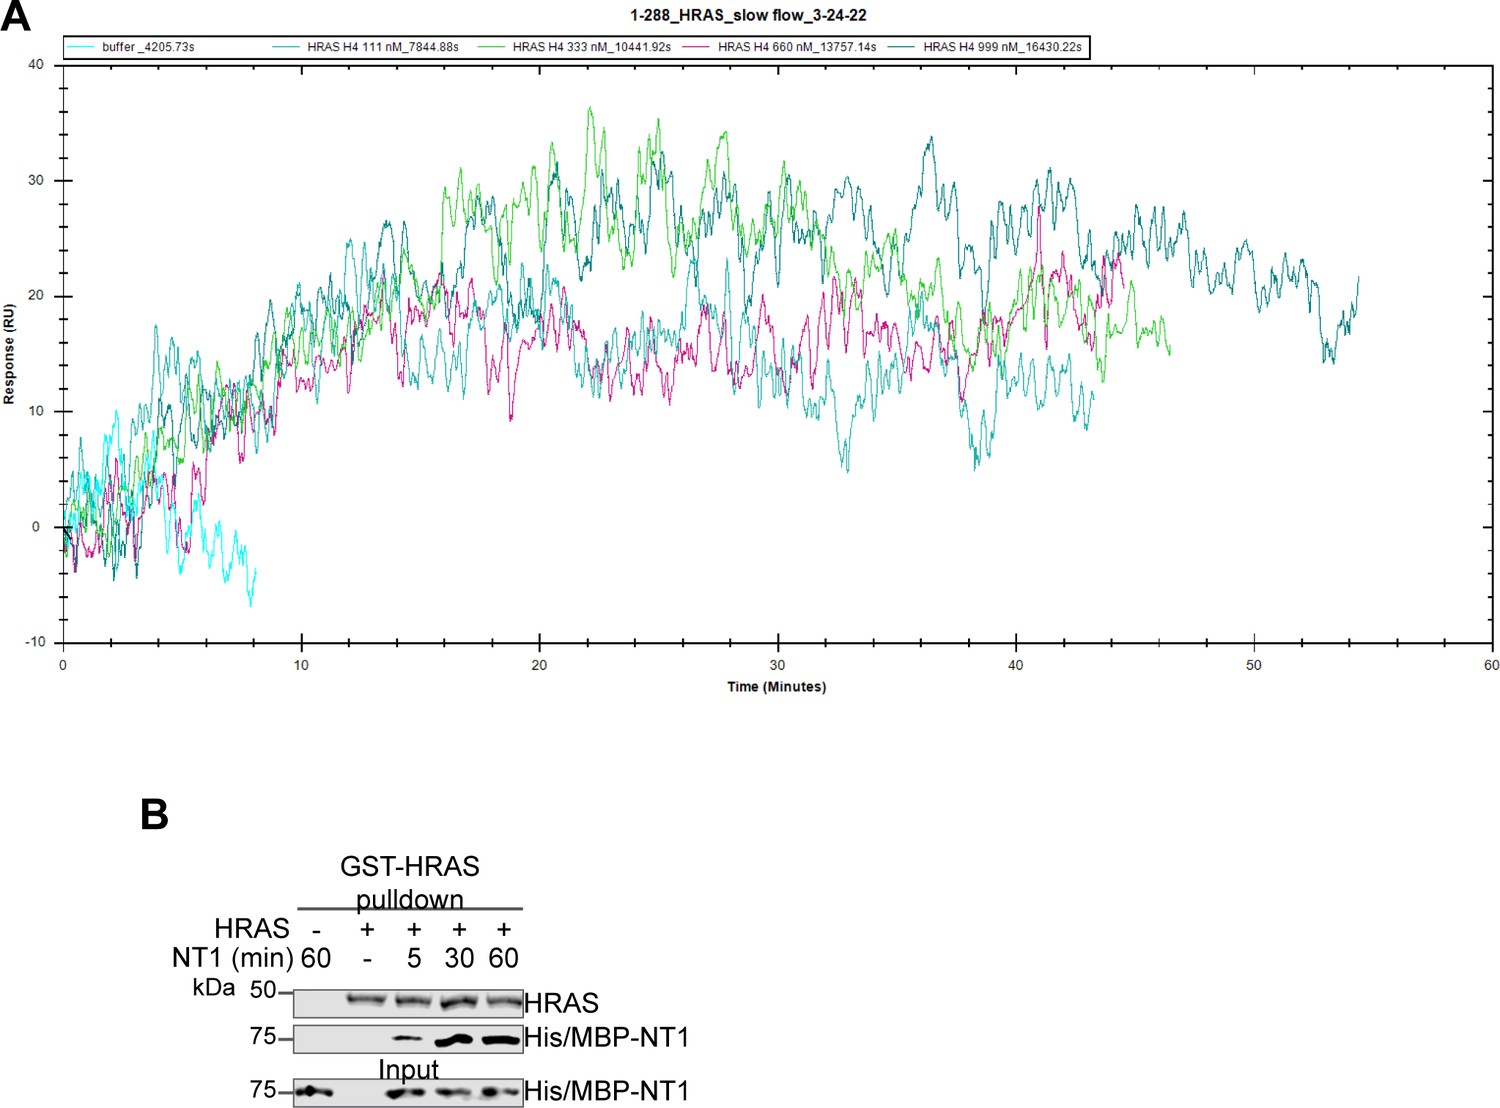
HRAS-NT1 open surface plasmon resonance (OpenSPR) shows slow association.
(A) OpenSPR injections of HRAS (111, 333, 660, and 999 nM) at 5 µL/min over His/MBP-NT1 immobilized on an NTA sensor. (B) Western blot of GST-HRAS on glutathione resin and NT1 binding through pulldown assay. HRAS was first added to resin for 1 hr. After washing to remove unbound HRAS, NT1 was added in a 1:1 molar ratio and incubated at 4°C for 5, 30, and 60 min. HRAS was probed with GST antibody and NT1 with His antibody.
-
Figure 3—figure supplement 1—source data 1
Western blot of GST-HRAS on glutathione resin and NT1 binding through pulldown assay.
HRAS was first added to resin for 1 hr. After washing to remove unbound HRAS, NT1 was added in a 1:1 molar ratio and incubated at 4°C for 5, 30, and 60 min. HRAS was probed with GST antibody and NT1 with His antibody.
- https://cdn.elifesciences.org/articles/88836/elife-88836-fig3-figsupp1-data1-v1.zip
Figure 4 with 4 supplements
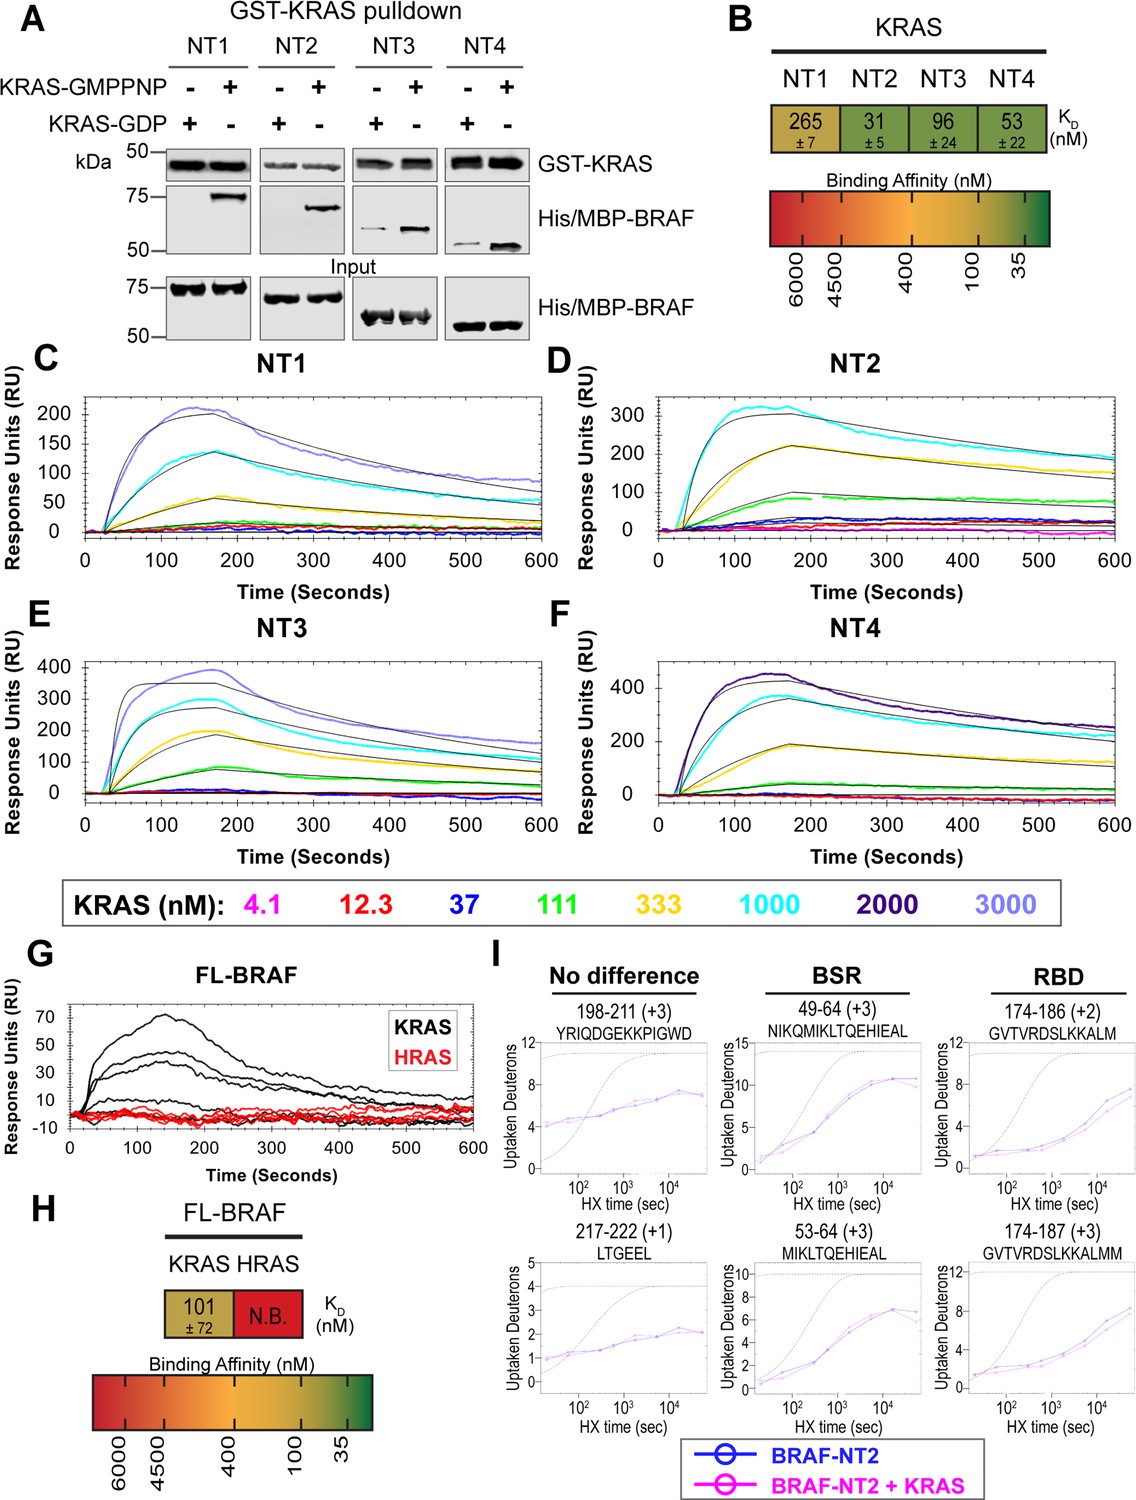
BRAF specific region (BSR) differentiates the BRAF-KRAS interaction from the BRAF-HRAS interaction.
(A) Western blot of purified His/MBP-NT1–4 binding to GST-KRAS on glutathione resin in a pulldown assay. Representative of two independent experiments with similar results. (B) Diagram of the mean dissociation constant (KD) ± standard deviation from independent open surface plasmon resonance (OpenSPR) experiments of KRAS flowed over immobilized NT1–4. (C–F) OpenSPR binding curves of KRAS flowed over NT1–4 immobilized on NTA sensors and the best fit curves (black) produced from a 1:1 fitting model kinetic evaluation. Representative of at least two independent experiments with similar results each. (G) OpenSPR binding curves of KRAS and HRAS flowed over FL-BRAF immobilized on NTA sensors and the best fit curves (black) produced from a 1:1 fitting model kinetic evaluation. K- and HRAS flowed over at increasing concentrations of 12.3, 37, 111, 333, 1000, and 3000 nM at 30 µL/min. Representative of two independent experiments with similar results each. (H) Diagram of the mean dissociation constant (KD) ± standard deviation from independent OpenSPR experiments of H/KRAS flowed over immobilized FL-BRAF. FL-BRAF:KRAS compared to NT:KRAS unpaired t test p=0.0551. (I) Representative NT2 peptides identified from hydrogen-deuterium exchange mass spectrometry (HDX-MS) in the absence (blue) and presence (pink) of KRAS. Peptides with no difference in H-D exchange rate are exemplified under ‘no difference’. Presented peptide plots displaying differences in H-D exchange rate are representative of a trend of 4+ overlapping peptides in the RAS binding domain (RBD). Gray dotted lines represent the theoretical exchange behavior for specified peptide that is fully unstructured (top) or for specified peptide with a uniform protection factor (fraction of time the residue is involved in protecting the H-bond) of 100 (lower).
-
Figure 4—source data 1
(Panel a) Western blot of purified His/MBP-NT1-4 binding to GST-KRAS on glutathione resin in a pulldown assay.
KRAS probed with anti-GST antibody; NTs probed with anti-His antibody.
- https://cdn.elifesciences.org/articles/88836/elife-88836-fig4-data1-v1.zip
-
Figure 4—source data 2
(Panels b–f) Kinetic evaluations of 1:1 fits made in TraceDrawer for fitted curves NT1, NT2, NT3, and NT4.
Full test preview provided in .txt format for NT1, NT2, NT3, and NT4. NT2 data also applies for Figure 4—figure supplement 2.
- https://cdn.elifesciences.org/articles/88836/elife-88836-fig4-data2-v1.zip
-
Figure 4—source data 3
(Panels g and h) Kinetic evaluations of 1:1 fits made in TraceDrawer for fitted curves full-length (FL) BRAF.
Full test preview provided in .txt format for FL-BRAF. Data applies for Figure 4—figure supplement 4b.
- https://cdn.elifesciences.org/articles/88836/elife-88836-fig4-data3-v1.zip
-
Figure 4—source data 4
(Panel i) Raw data used to plot curves with ExMS2.
Also applies to plots presented in Supplementary file 1.
- https://cdn.elifesciences.org/articles/88836/elife-88836-fig4-data4-v1.zip
Figure 4—figure supplement 1
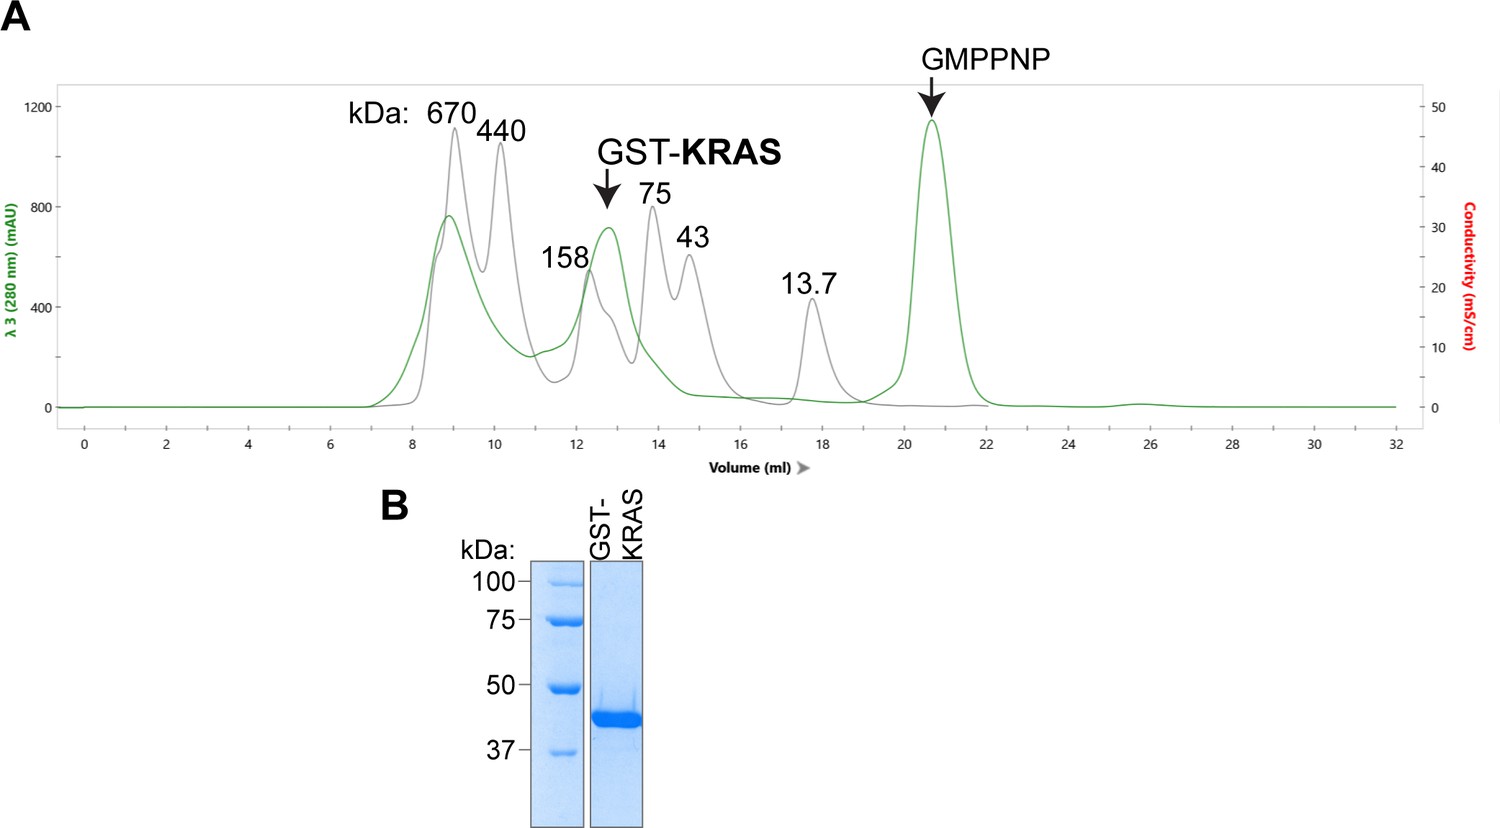
SEC of active GST-HRAS and GST-KRAS.
(A) GST-KRAS monomer is ~45 kDa and elutes as a dimer at ~90 kDa. KRAS elution profile (green) on a Superdex 200 (Cytiva) overlayed with protein size standard elution profile (gray) labeled in kDa. Fractions from ~12 to 14 mL were collected and concentrated. (B) Coomassie stained gel of GST-KRAS final purification product.
-
Figure 4—figure supplement 1—source data 1
Coomassie stained gel of GST-KRAS final purification product.
- https://cdn.elifesciences.org/articles/88836/elife-88836-fig4-figsupp1-data1-v1.zip
Figure 4—figure supplement 2
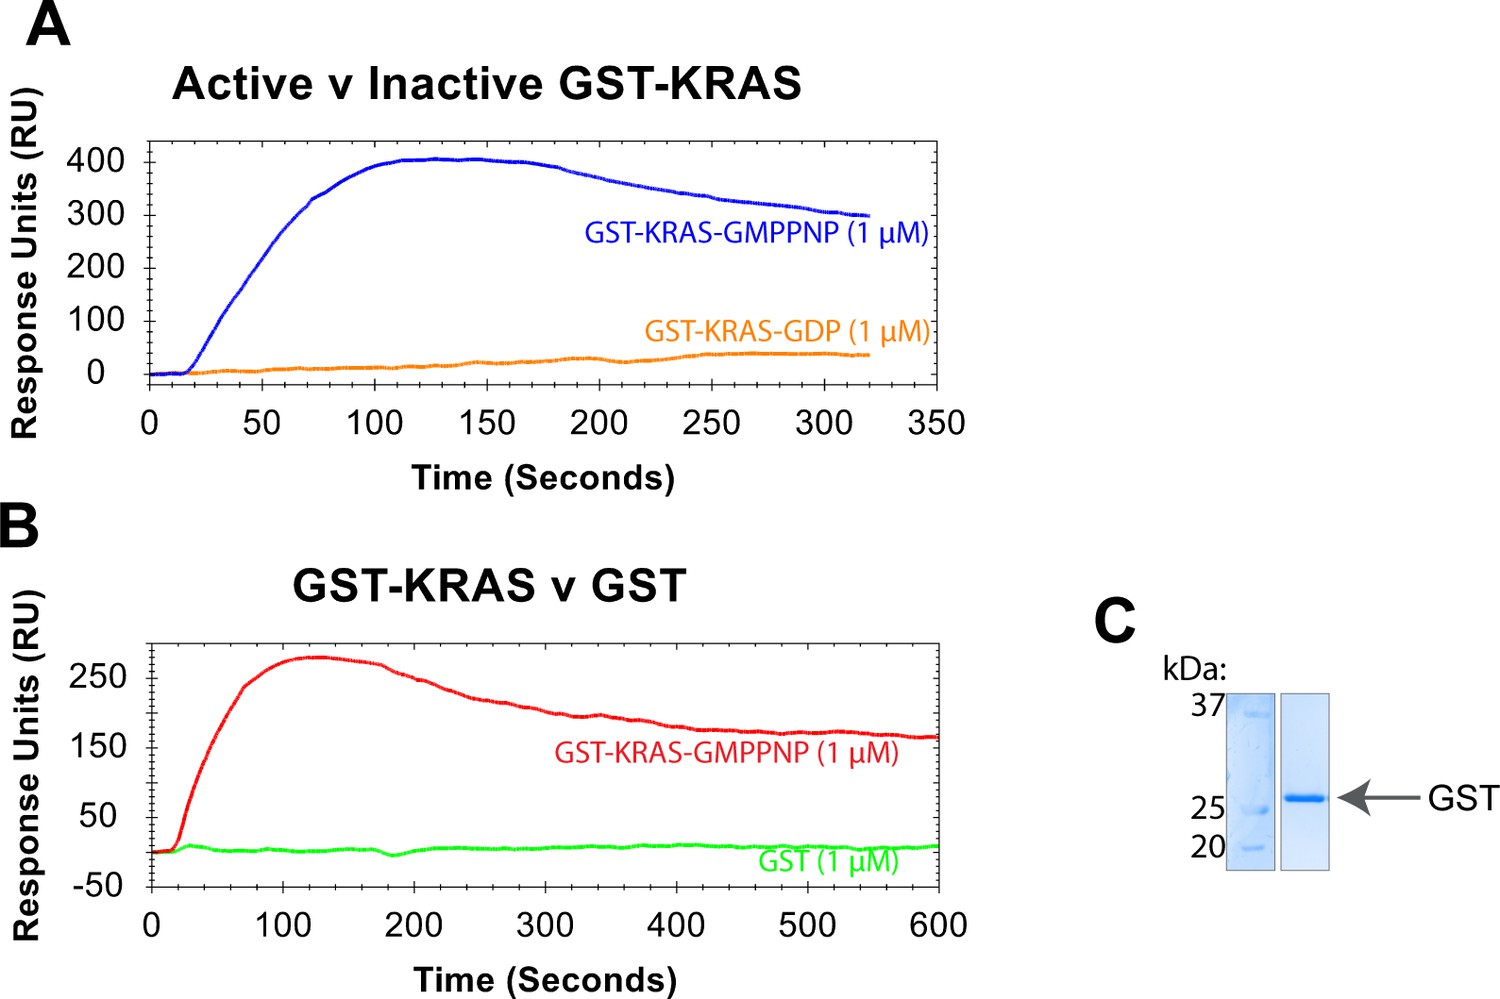
Active GST-KRAS specifically binds to BRAF-NTs.
(A) Binding curves of 1 μM GST-KRAS (active/GMPPNP = blue; inactive/GDP = orange) flowed over NTA-immobilized BRAF NT2 at 30 μL/min. (B) Binding curves of 1 μM GST-KRAS (active/GMPPNP-loaded=red) and purified GST (green) flowed over NTA-immobilized BRAF NT2 at 30 μL/min. (C) Coomassie stained gel of GST protein, purified following the same protocol as GST-HRAS.
-
Figure 4—figure supplement 2—source data 1
Coomassie stained gel of GST protein, purified following the same protocol as GST-HRAS.
- https://cdn.elifesciences.org/articles/88836/elife-88836-fig4-figsupp2-data1-v1.zip
Figure 4—figure supplement 3
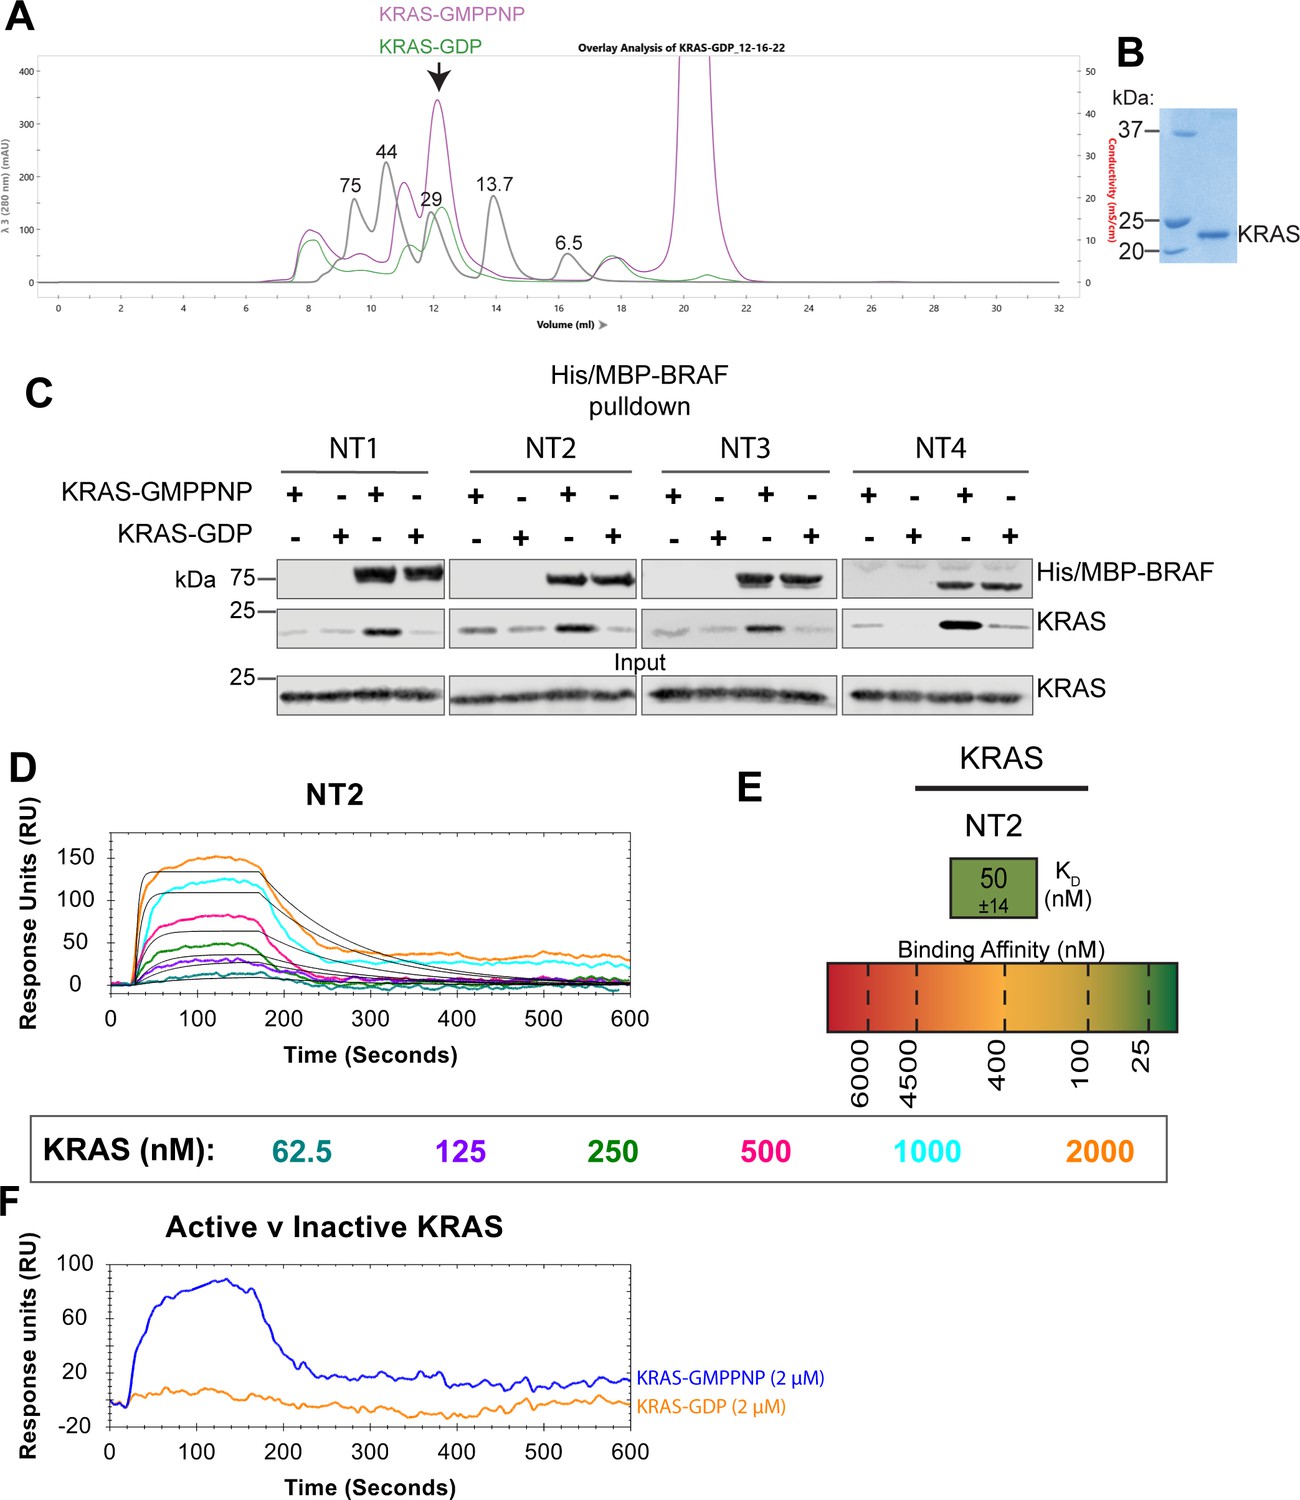
Characterizing untagged KRAS.
(A) Untagged KRAS is displayed as a monomer with a molecular weight of ~22 kDa including N-terminal linker residues. KRAS-GMPPNP (purple) and KRAS-GDP (green) elution profile on a Superdex 75 (Cytiva) overlayed with protein size standard elution profile (gray) labeled in kDa. (B) Coomassie stained gel of untagged KRAS final purification product. (C) Western blot of purified KRAS binding to His/MBP-NT1–4 on amylose resin in a pulldown assay. Representative of three independent experiments with similar results. (D) Open surface plasmon resonance (OpenSPR) binding curves of KRAS flowed over NT2 and the best fit curves produced from a 1:1 fitting model kinetic evaluation. Representative of two independent experiments with similar results each. KRAS was flowed over at 30 μL/min (20 mM HEPES pH 7.4, 150 mM NaCl, 0.05% Tween-20, 1% wt:vol BSA) for 10 min at increasing concentrations (62.5, 125, 250, 500, 1000, 2000 nM). (E) Diagram of the average binding constant (KD) ± standard deviation from independent OpenSPR experiments of KRAS flowed over immobilized NT2. (F) Binding curves of 2 μM KRAS (active/GMPPNP = blue; inactive/GDP = orange) flowed over NTA-immobilized BRAF NT2 at 30 μL/min.
-
Figure 4—figure supplement 3—source data 1
(Panel c) Western blot of purified KRAS binding to His/MBP-NT1–4 on amylose resin in a pulldown assay.
KRAS probed with RAS (E8N8L) XP Rabbit mAb (Cell Signaling #67648); NTs probed with anti-His antibody.
- https://cdn.elifesciences.org/articles/88836/elife-88836-fig4-figsupp3-data1-v1.zip
-
Figure 4—figure supplement 3—source data 2
(Panels d–f) Kietic evaluations of 1:1 fits made in TraceDrawer for fitted curves NT2.
Full test preview provided in .txt format for NT2.
- https://cdn.elifesciences.org/articles/88836/elife-88836-fig4-figsupp3-data2-v1.zip
Figure 4—figure supplement 4
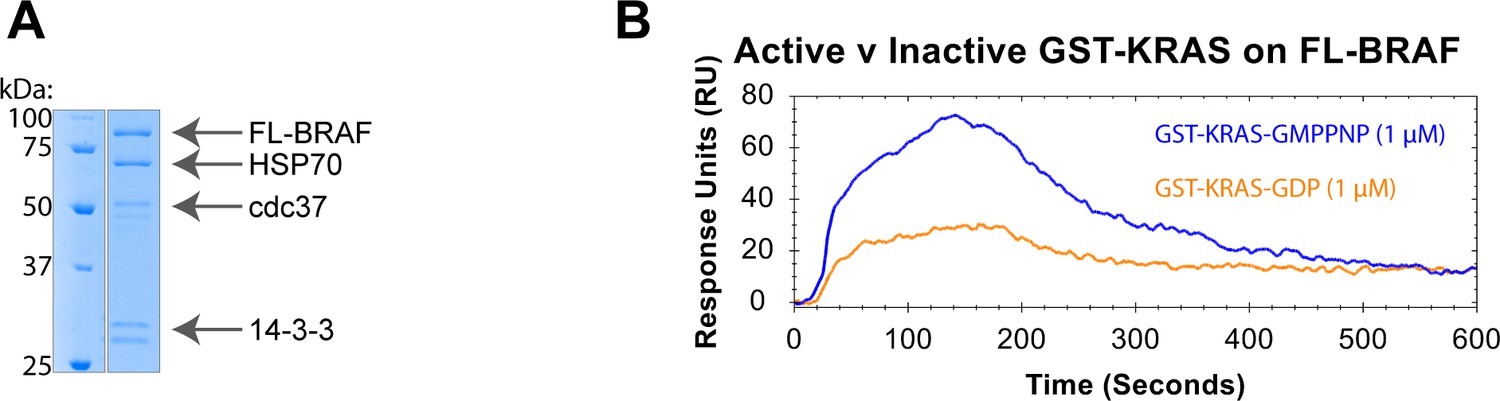
Full-length BRAF binds specifically to active GST-KRAS.
(A) Coomassie stained gel of purified recombinant full-length (FL) BRAF with copurified chaperone proteins. (B) Binding curves of 1 μM GST-KRAS (active/GMPPNP = blue; inactive/GDP = orange) flowed over NTA-immobilized FL-BRAF at 30 μL/min.
-
Figure 4—figure supplement 4—source data 1
Coomassie stained gel of purified recombinant full-length (FL) BRAF with copurified chaperone proteins.
- https://cdn.elifesciences.org/articles/88836/elife-88836-fig4-figsupp4-data1-v1.zip
Figure 5 with 1 supplement
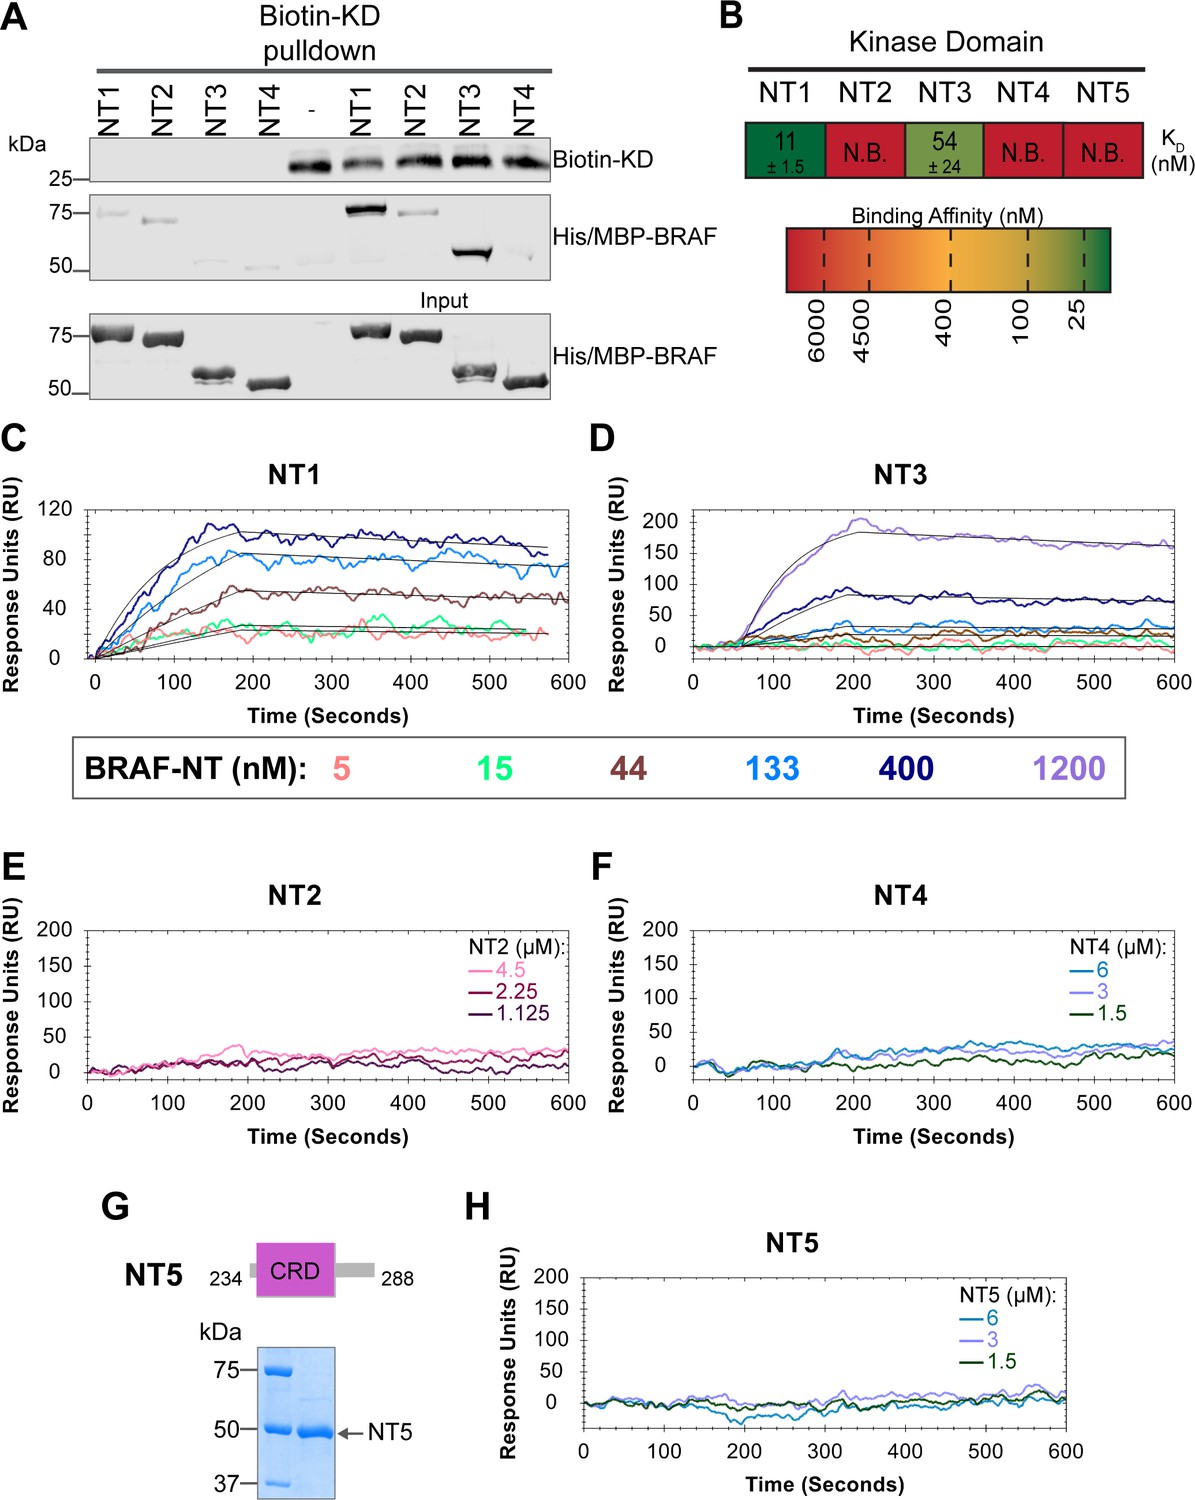
BRAF specific region (BSR) and cysteine rich domain (CRD) promote BRAF autoinhibitory interactions.
(A) Western blot of purified His/MBP-NT1–4 binding to biotinylated His-KD on streptavidin beads in a pulldown assay. Representative of three independent experiments with similar results. (B) Diagram of the mean dissociation constant (KD) ± standard deviation from independent open surface plasmon resonance (OpenSPR) experiments of NTs flowed over immobilized KD. KD of NT1 compared to NT3 unpaired t test p=0.0423. (C–D) OpenSPR binding curves of NT1 and NT3 at 5, 15, 44, 133, 400, and 1200 nM (NT3 only) flowed over KD and the best fit curves (black) produced from a 1:1 fitting model kinetic evaluation. Representative of independent experiments with similar results (NT3: n=2, NT1: n=3). (E–F) No binding of NT2 or NT4 to immobilized KD was observed by OpenSPR even at high concentrations (NT2: 1.125, 2.25, 4.5 µM; NT4: 1.5, 3, 6 µM). Representative of two independent experiments each with similar results. (G) Diagram of BRAF NT5 (top) and Coomassie stained gel of recombinant NT5 (lower). (H) NT5 at 1.5, 3, and 6 µM flowed over immobilized KD on a carboxyl sensor. Representative of three independent experiments.
-
Figure 5—source data 1
(Panel a) Western blot of purified His/MBP-NT1–4 binding to biotinylated His-KD on streptavidin beads in a pulldown assay.
KD and NTs probed with anti-His antibody.
- https://cdn.elifesciences.org/articles/88836/elife-88836-fig5-data1-v1.zip
-
Figure 5—source data 2
(Panels b–f, h) Kinetic evaluations of 1:1 fits made in TraceDrawer for fitted curves NT1 and NT3.
Full test preview provided in .txt format for NT1 and NT3. Data for NT1 applies to curves in Figure 6B and C.
- https://cdn.elifesciences.org/articles/88836/elife-88836-fig5-data2-v1.zip
-
Figure 5—source data 3
(Panel g) Coomassie stained gel of recombinant NT5.
- https://cdn.elifesciences.org/articles/88836/elife-88836-fig5-data3-v1.zip
Figure 5—figure supplement 1

MBP tag does not interfere with the interaction between NT1 and KD.
(A) Open surface plasmon resonance (OpenSPR) binding curves of BRAF NT1 without maltose bind protein (MBP) flowed over immobilized BRAF-KD at 30 μL/min in increasing concentrations. Best fit curves (black) are produced from a 1:1 fitting model kinetic evaluation.
Figure 6
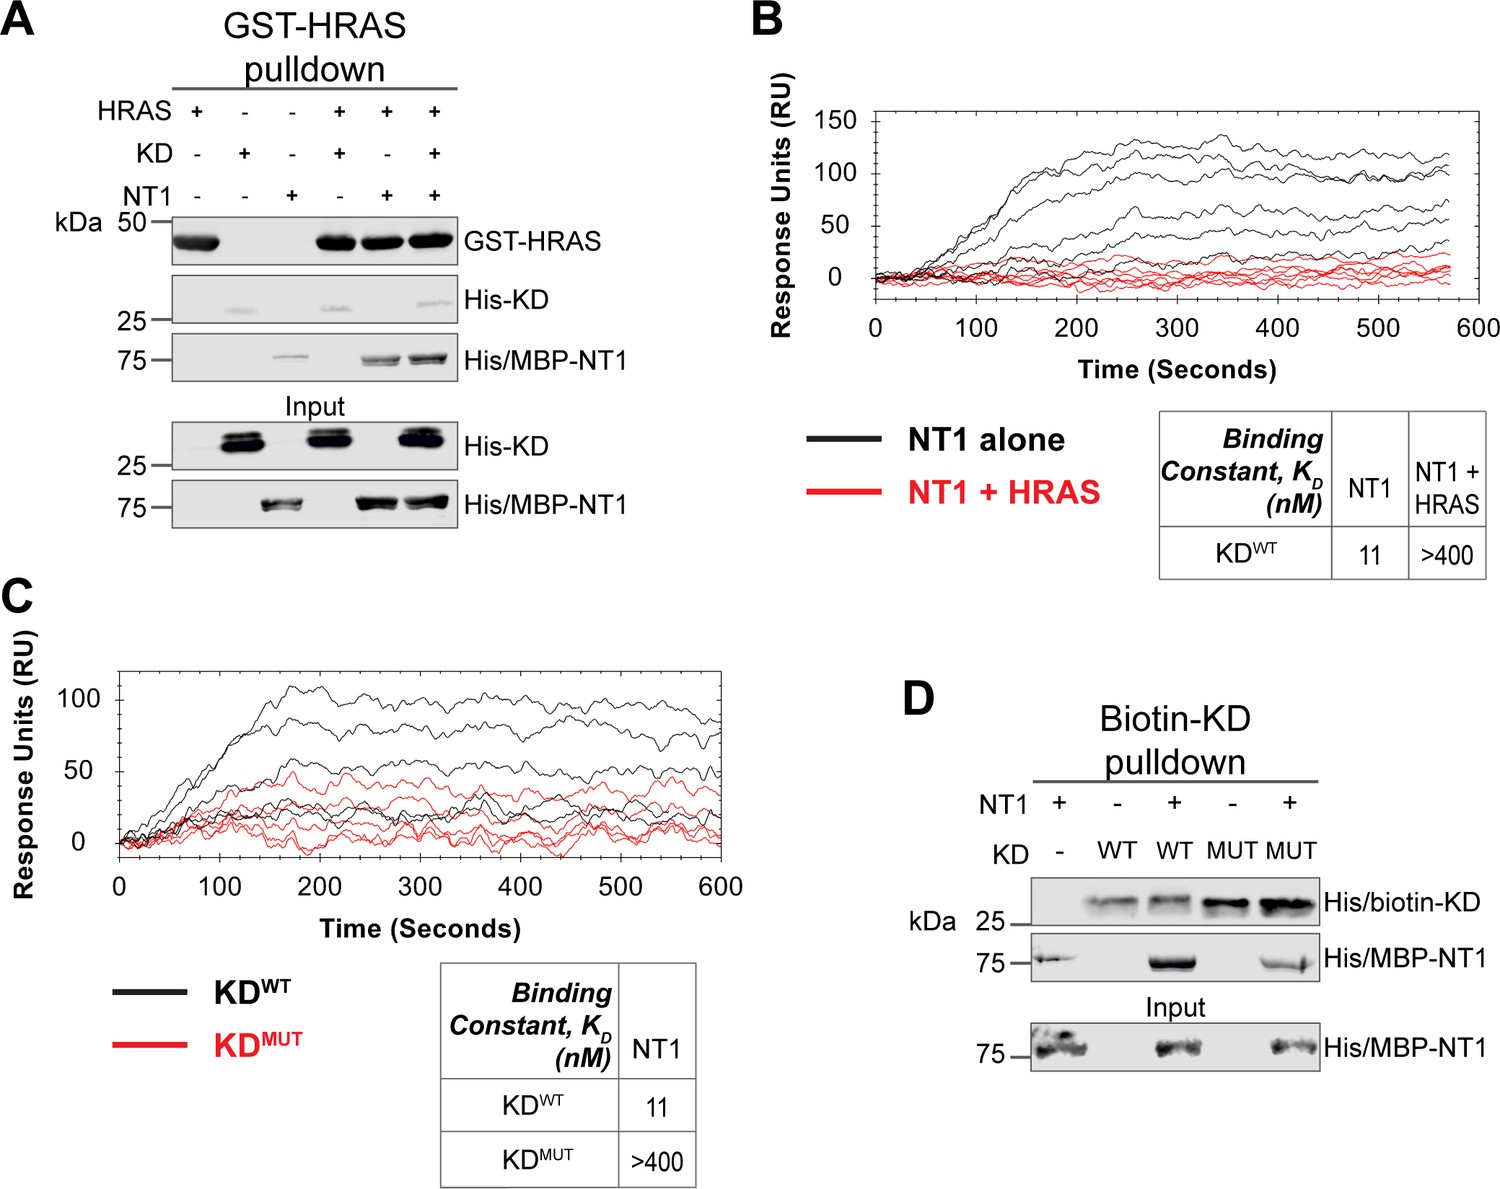
HRAS and KDD594G disrupt BRAF autoinhibition.
(A) Western blot of pulldown assay of pre-incubated His/MBP-NT1 and His-KD added to purified active GST-HRAS on glutathione resin. Representative data of two independent biological replicates with similar results. (B) Open surface plasmon resonance (OpenSPR) experiments in which NT1 at 5, 15, 44, 133, 400 nM (black) and NT1 + HRAS-GMPPNP (1:1) at 5, 15, 44, 133, and 400 nM (red) flowed over KD immobilized on carboxyl sensors. Representative data of three independent biological replicates with similar results. (C) OpenSPR experiments of NT1 at 5, 15, 44, 133, and 400 nM flowed over immobilized KDWT (black) or KDMUT (D594G; red) on carboxyl sensors. Representative data of three independent biological replicates with similar results. (D) Western blot of purified His/MBP-NT1 binding to either biotinylated His-KDWT or His-KDMUT (D594G) in pulldown assays on streptavidin beads. Representative data of three independent biological replicates with similar results.
-
Figure 6—source data 1
(Panel a) Western blot of pulldown assay of pre-incubated His/MBP-NT1 and His-KD added to purified active GST-HRAS on glutathione resin.
HRAS probed with anti-GST antibody; KD and NT1 probed with anti-His antibody.
- https://cdn.elifesciences.org/articles/88836/elife-88836-fig6-data1-v1.zip
-
Figure 6—source data 2
(Panel d) Western blot of purified His/MBP-NT1 binding to either biotinylated His-KDWT or His-KDMUT (D594G) in pulldown assays on streptavidin beads.
KD and NTs probed with anti-His antibody.
- https://cdn.elifesciences.org/articles/88836/elife-88836-fig6-data2-v1.zip
Figure 7
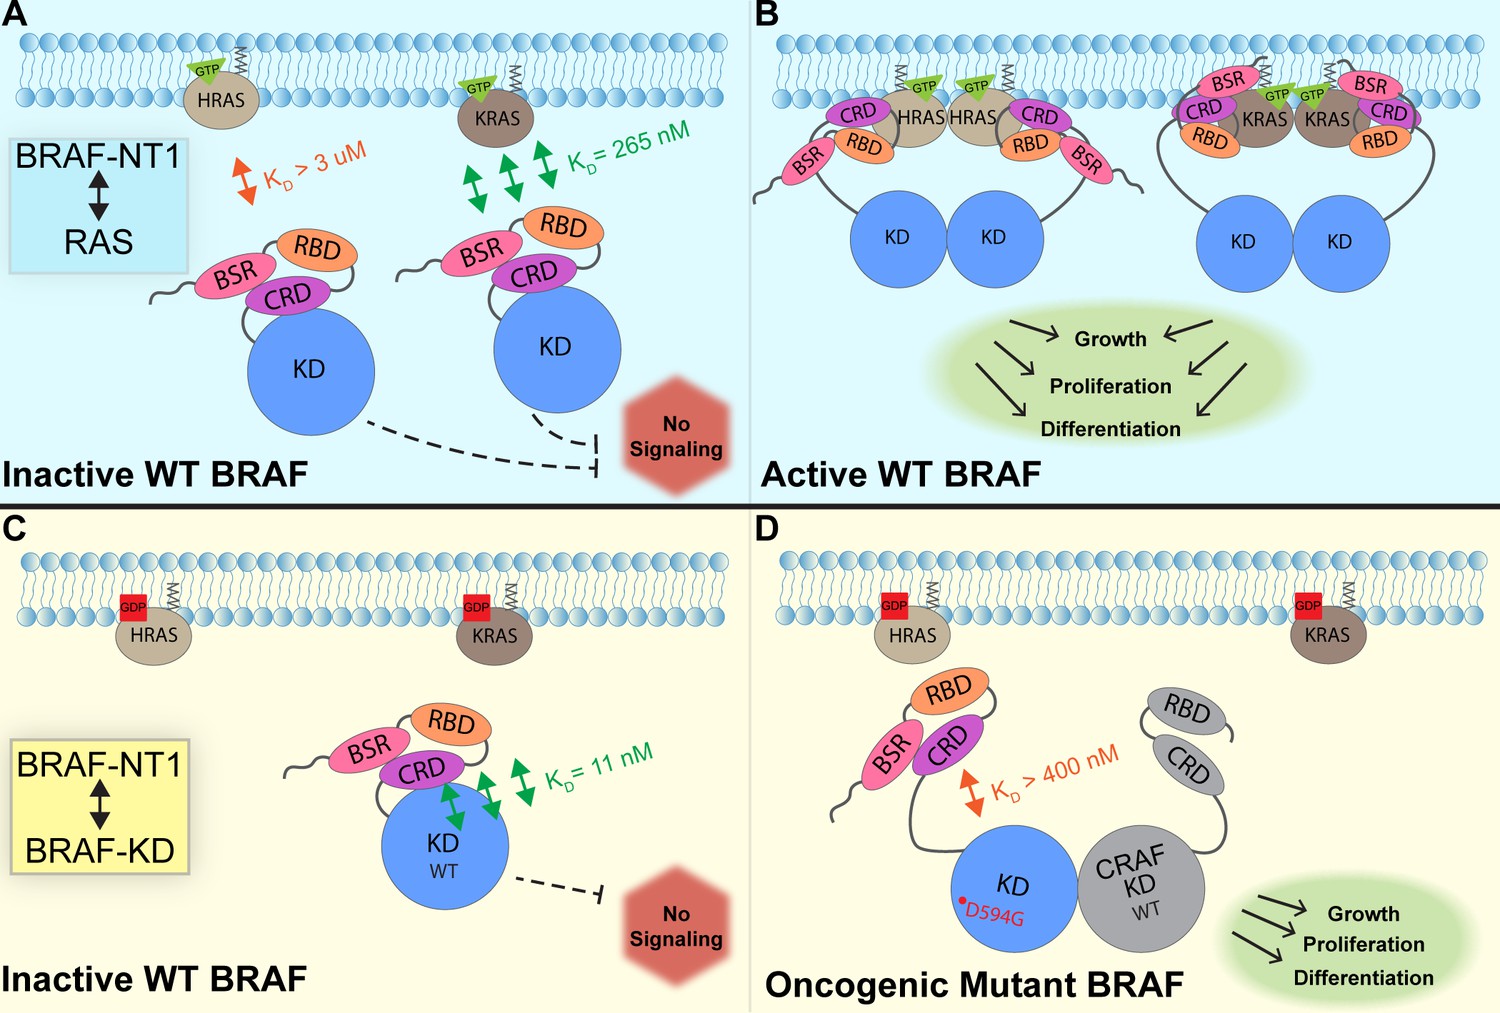
Model of BRAF activation.
(A) BRAF is initially an autoinhibited monomer in the cytosol, in which signaling through the RAS-RAF-MEK-ERK cascade is not promoted. The BRAF N-terminal region (NT1; amino acids 1–288), including the BRAF specific region (BSR), cysteine rich domain (CRD), and RAS binding domain (RBD), interacts with active GTP-bound RAS at the membrane in an isoform-specific manner (relative positions of N-terminal domains may not reflect all interactions). BRAF has higher affinity for KRAS due to isoform differences, as shown through the different dissociation constants (KD) determined through open surface plasmon resonance (OpenSPR). (B) Once bound to active H- or KRAS, BRAF is unable to remain in the autoinhibited conformation and is subsequently activated upon dimerization, which stimulates signaling for events such as cell growth, proliferation, and differentiation. (C) Tight binding is observed with the BRAF kinase domain (KD; amino acids 442–723) and BRAF NT1, revealing the concerted action of the BSR, RBD, and CRD domains to reinforce the autoinhibited conformation and restrict signaling without upstream activation. (D) Oncogenic BRAFD594G stimulates activation of MAPK pathway through a decreased ability to remain in the autoinhibited conformation and an increased potential to dimerize with CRAF. Evading autoinhibitory regulation leads to overactivation of the signaling cascade and tumorigenesis.
Tables
Appendix 1—key resources table
| Reagent type (species) or resource | Designation | Source or reference | Identifiers | Additional information |
|---|---|---|---|---|
| Strain, strain background (Escherichia coli) | BL21 codon + | NEB | ||
| Strain, strain background (Escherichia coli) | DH5α | NEB | C2987I | |
| Antibody | Anti-GST (mouse monoclonal) | Santa Cruz Biotechnology | SC-138 | WB (1:5000) |
| Antibody | Anti-RAS (rabbit monoclonal) | Cell Signaling | 67648S | WB (1:5000) |
| Antibody | Anti-His (rabbit monoclonal) | Sigma-Aldrich | SAB5600227 | WB (1:5000) |
| Recombinant DNA reagent | GST-HRAS | Addgene | 55653 | |
| Recombinant DNA reagent | His/MBP-KRAS | Addgene | 159546 | |
| Sequence-based reagent | GST-KRAS_For | This paper | PCR primers | 5’ATCTGGTTCCGCGTGGATCCACTGAATATAAACTTGTGGTAG 3’ |
| Sequence-based reagent | GST-KRAS_Rev | This paper | PCR primers | 5’ CAGTCAGTCACGATGAATTCTTACATAATTACACACTTTGTCTTTG 3’ |
| Sequence-based reagent | GST-vector_For | This paper | PCR primers | 5’ GAATTCATCGTGACTGACTGACG 3’ |
| Sequence-based reagent | GST-vector_Rev | This paper | PCR primers | 5’ GGATCCACGCGGAACCAG 3’ |
| Sequence-based reagent | BRAF-RBD_For 1 | This paper | PCR primers | 5’ CATATGCTCGGATCCGCGGCGCTGAGCGGTG 3’ |
| Sequence-based reagent | BRAF-RBD_For 151 | This paper | PCR primers | 5’ CATATGCTCGGATCCTCACCACAAAAACCTATCGTTAG 3’ |
| Sequence-based reagent | BRAF-RBD_Rev 227 | This paper | PCR primers | 5’ GTTGTAAGAATTCAAGCTTACAACACTTCCACATGCAATTC 3’ |
| Sequence-based reagent | BRAF-RBD_Rev 288 | This paper | PCR primers | 5’ CAAAGAACTGAATTCAAGCTTACAAATCAAGTTGGT 3’ |
| Sequence-based reagent | BRAF-CRD_For | This paper | PCR primers | 5’ AGCAAATGGGTCGCGGATCCACACACAACTTTGTACGAAAAAC’3 |
| Sequence-based reagent | BRAF-CRD_Rev | This paper | PCR primers | 5’CGAGTGCGGCCGCAAGCTTACAAATCAAGTTGGTCATAATTAAC’3 |
| Commercial assay or kit | EZ-Link Sulfo-NHS-Biotin, No-Weigh Format | Thermo Fisher | A39256 | |
| Chemical compound, drug | GMPPNP | Sigma-Aldrich | G0635 | |
| Software, algorithm | ExMS2 | https://doi.org/10.1021/acs.analchem.9b01682 | ||
| Software, algorithm | TraceDrawer | https://tracedrawer.com/ | ||
| Software, algorithm | SEQUEST | Thermo Proteome Discoverer |
Additional files
-
MDAR checklist
- https://cdn.elifesciences.org/articles/88836/elife-88836-mdarchecklist1-v1.docx
-
Supplementary file 1
Complete set of peptide plots.
Time-dependent deuterium uptake plots for NT2+/- HRAS, NT2 +/-KRAS, and NT3+/-HRAS.
- https://cdn.elifesciences.org/articles/88836/elife-88836-supp1-v1.docx
Download links
A two-part list of links to download the article, or parts of the article, in various formats.
Downloads (link to download the article as PDF)
Open citations (links to open the citations from this article in various online reference manager services)
Cite this article (links to download the citations from this article in formats compatible with various reference manager tools)
Unveiling the domain-specific and RAS isoform-specific details of BRAF kinase regulation
eLife 12:RP88836.
https://doi.org/10.7554/eLife.88836.3


