Leveraging inter-individual transcriptional correlation structure to infer discrete signaling mechanisms across metabolic tissues
- Department of Biological Chemistry, UC Irvine, United States
- Center for Epigenetics and Metabolism, UC Irvine, United States
- Department of Anatomy and Physiology, University of Melbourne, Australia
- Translational Research Institute, AdventHealth, United States
- Veterans Administration Greater Los Angeles Healthcare System, Geriatric Research Education and Clinical Center (GRECC), United States
- Divison of Hematology/Oncology, Department of Medicine, UC Irvine Health, United States
- Department of Medicine, Division of Endocrinology, Diabetes, and Hypertension, David Geffen School of Medicine at UCLA, United States
- Iris Cantor-UCLA Women’s Health Research Center, David Geffen School of Medicine at UCLA, United States
- Division of Endocrinology, Department of Medicine, University of Pittsburg, United States
- Department of Molecular Biology and Biochemistry, School of Biological Sciences, University of California Irvine, United States
Figures
Figure 1 with 4 supplements
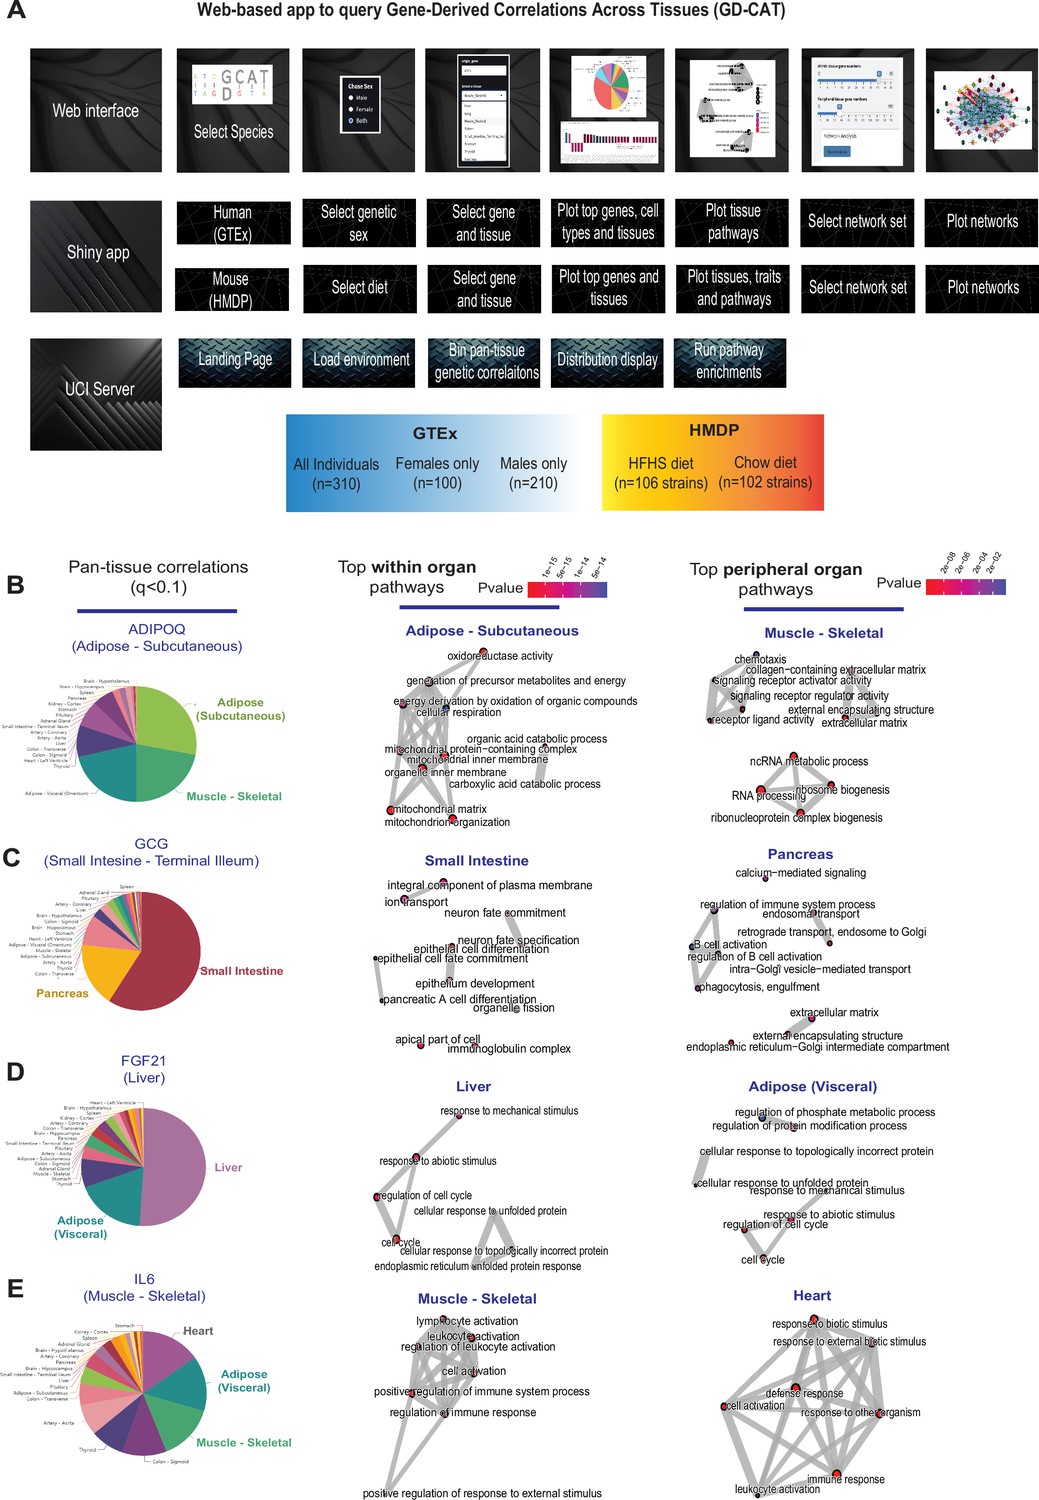
Web tool overview and inter-individual correlation structure of established endocrine proteins.
(A) Web server structure for user-defined interactions, as well as server and shiny app implementation scheme for gene-derived correlations across tissues (GD-CAT). (B) All genes across the 18 metabolic tissues in 310 individuals were correlated with expression of ADIPOQ in subcutaneous adipose tissue, where a q-value cutoff of q<0.1 showed the strongest enrichments with subcutaneous and muscle gene expression (pie chart, left). Gene set enrichment analysis (GSEA) was performed using the bicor coefficient of all genes to ADIPOQ using gene ontology biological process annotations and network construction of top pathways using clusterprofiler, where pathways related to fatty acid oxidation were observed in adipose (left) and chemotaxis/ECM remodeling in skeletal muscle (right). (B–D) The same q-value binning, top within-tissue and top peripheral enrichments were applied to intestinal GCG (C), liver FGF21 (D), and muscle IL6 (E). For these analyses all 310 individuals (across both sexes) were used and q-value adjustments calculated using a Benjamini-Hochberg FDR adjustment.
Figure 1—figure supplement 1
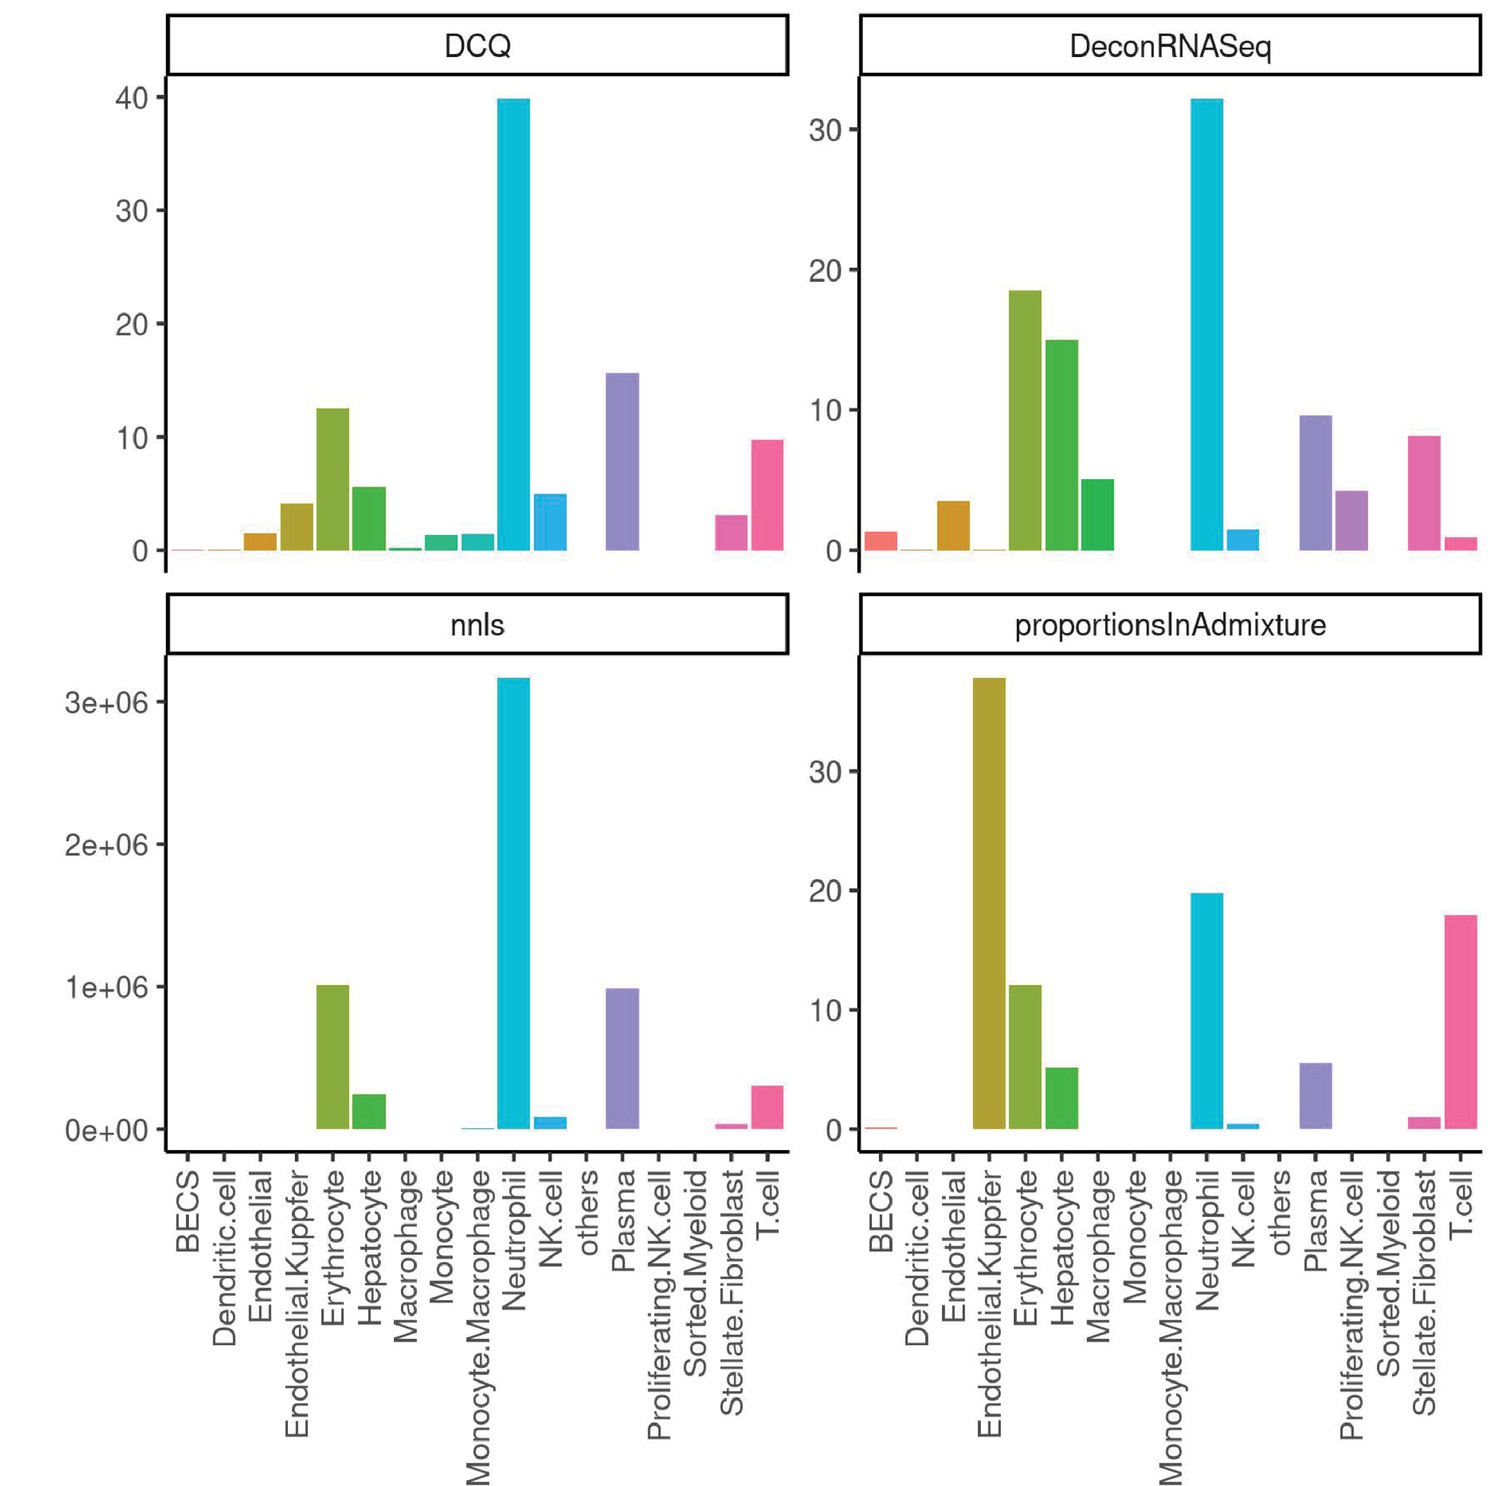
Performance across four methods of cell-type deconvolution where relative proportions of cells (y-axis) are shown for all cell types annotated in single-cell reference (x-axis) in liver.
Figure 1—figure supplement 2
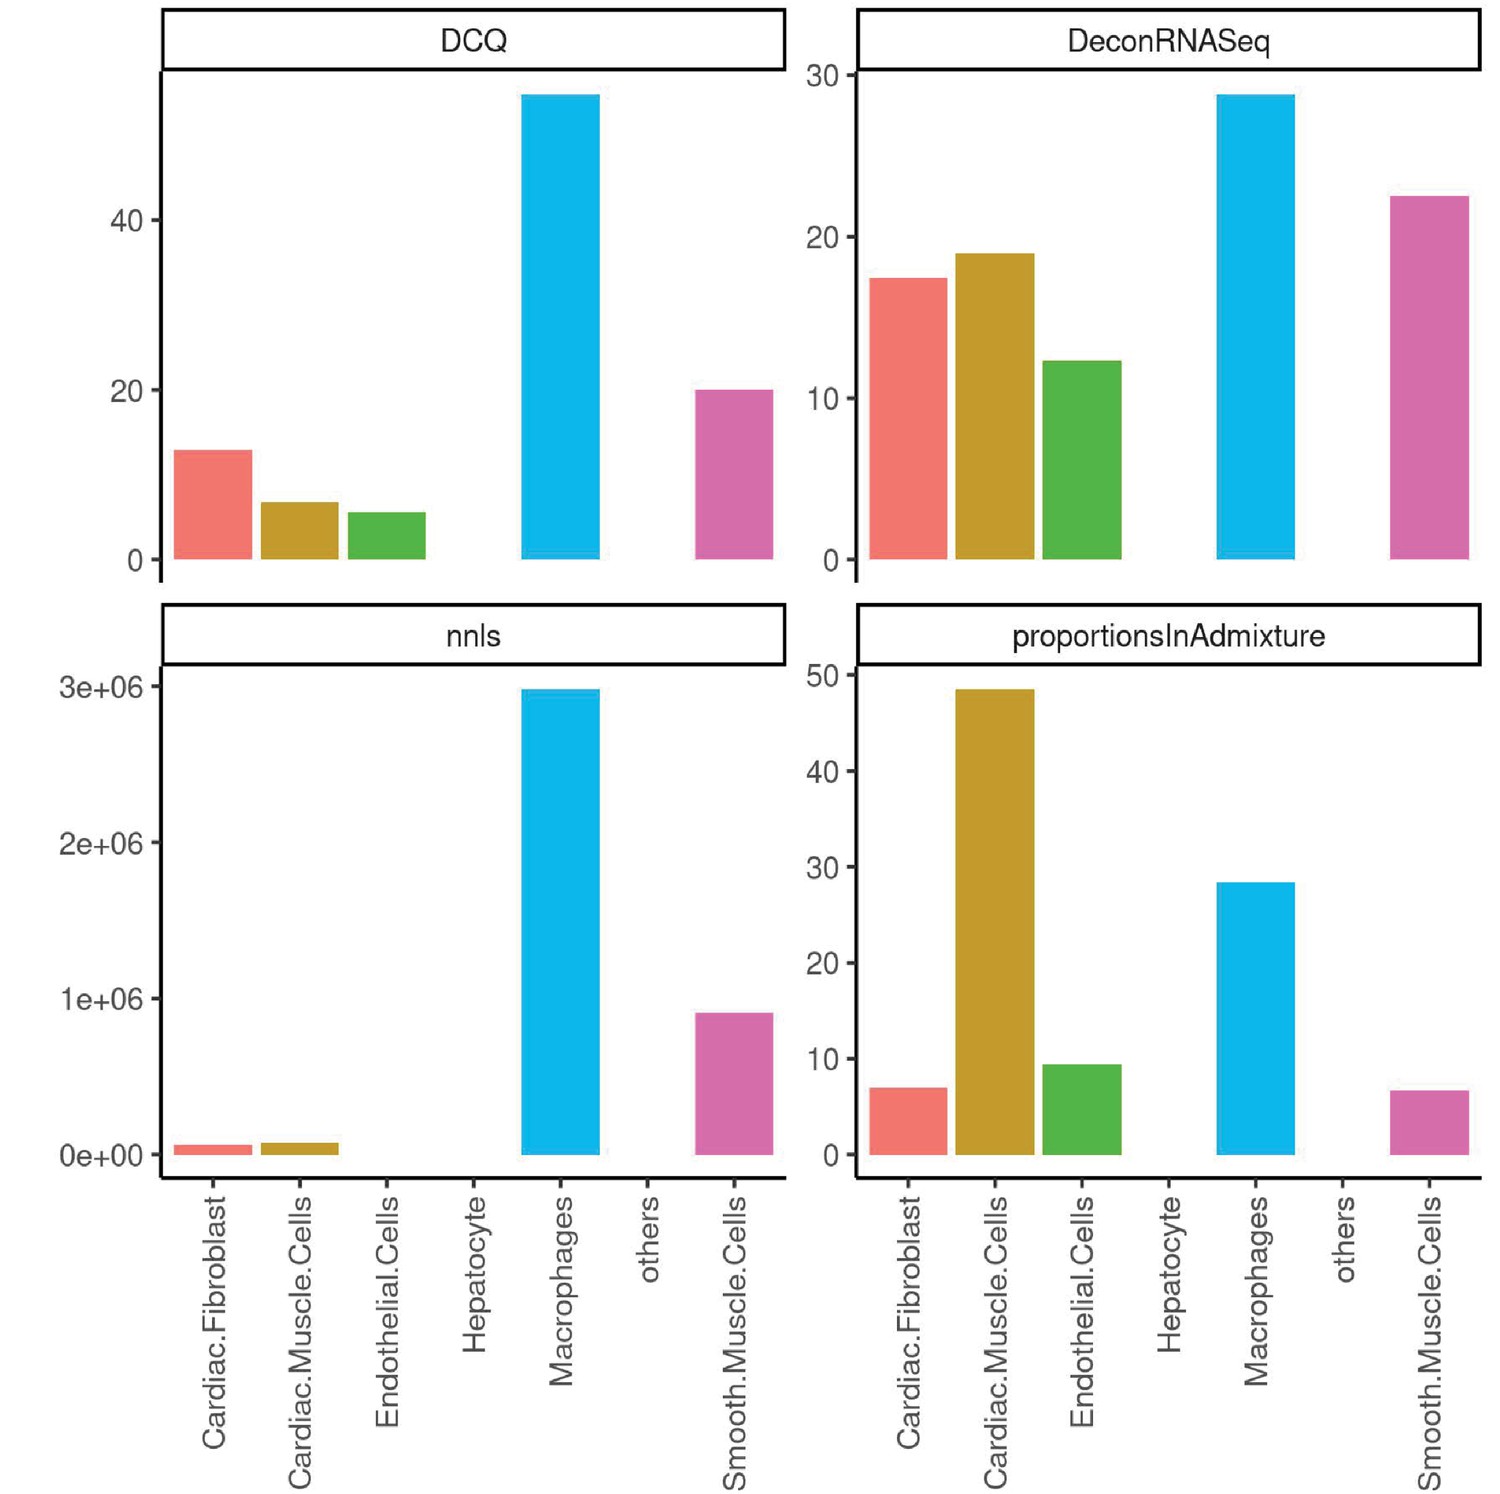
Performance across four methods of cell-type deconvolution where relative proportions of cells (y-axis) are shown for all cell types annotated in single-cell reference (x-axis) in heart.
Figure 1—figure supplement 3
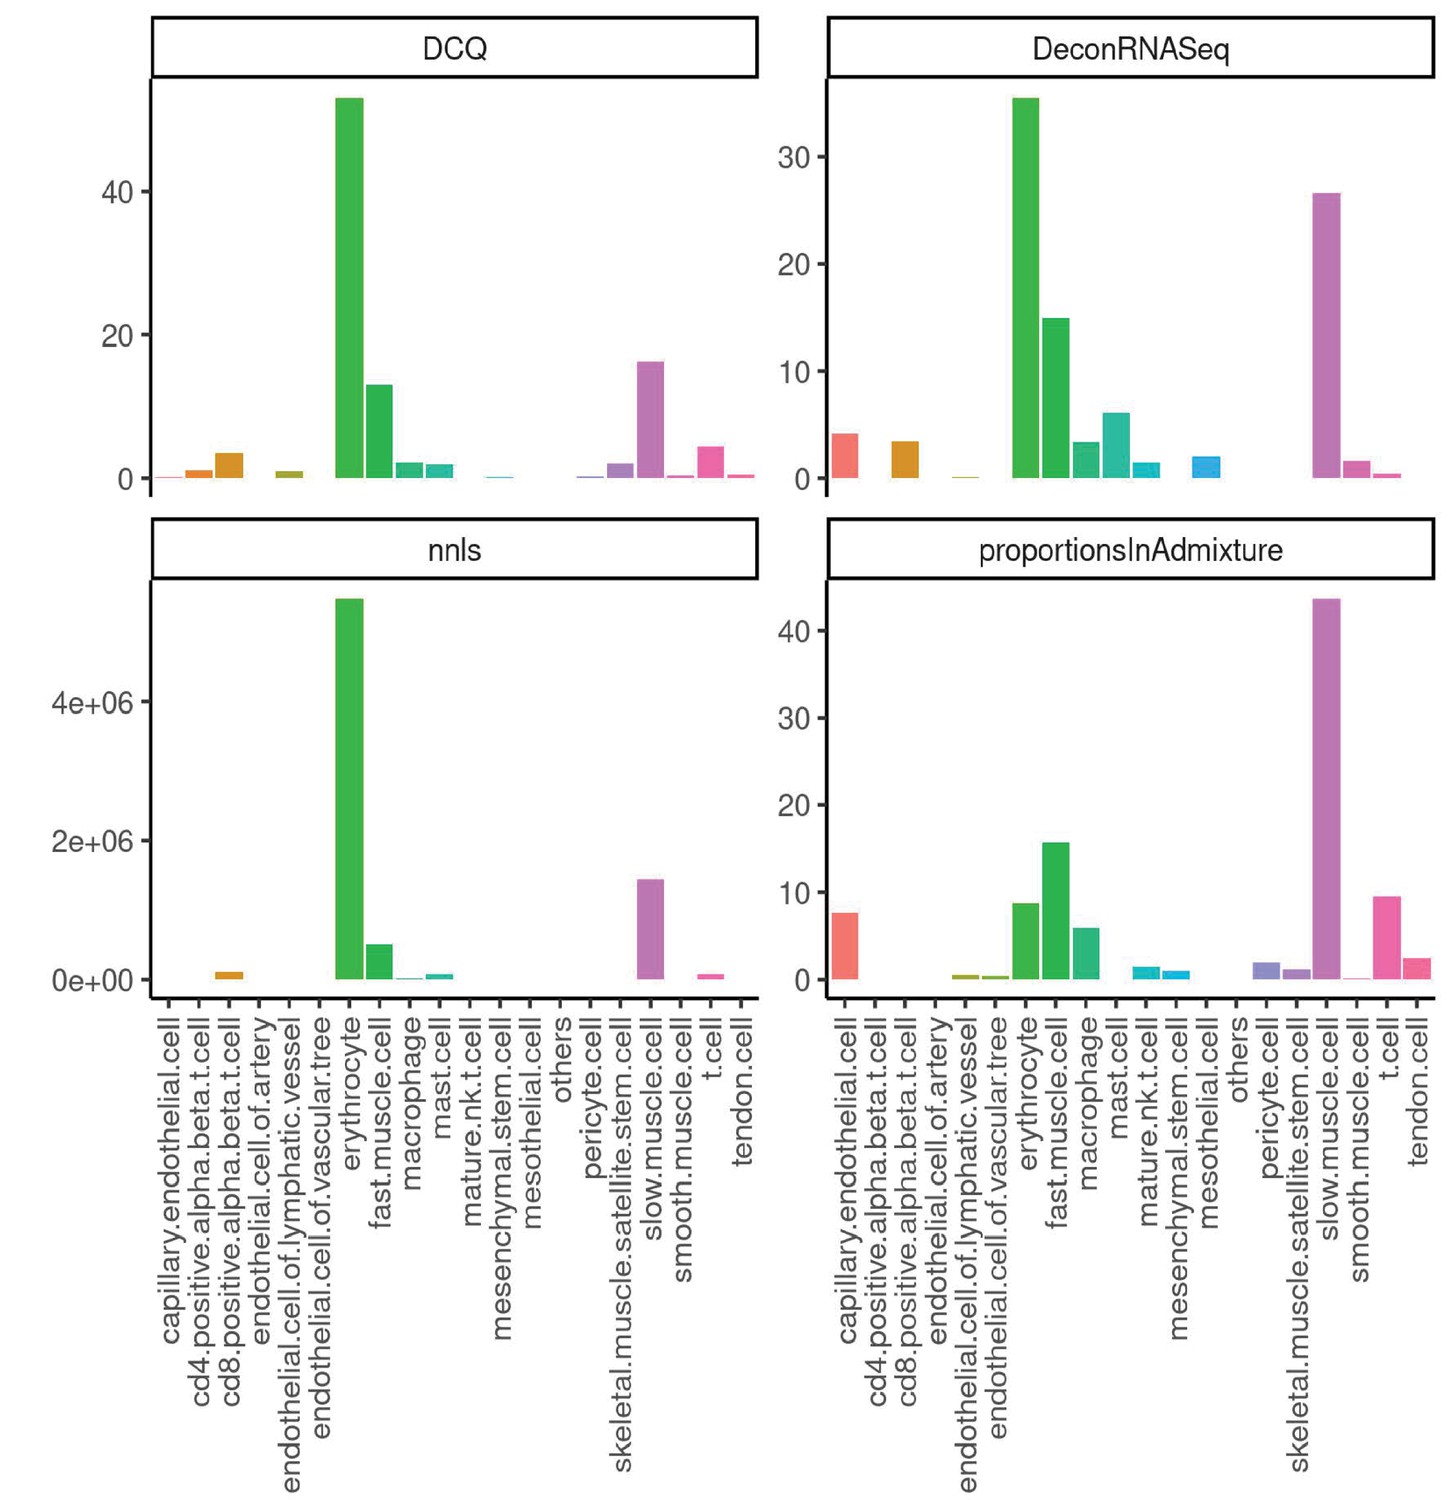
Performance across four methods of cell-type deconvolution where relative proportions of cells (y-axis) are shown for all cell types annotated in single-cell reference (x-axis) in skeletal muscle.
Figure 1—figure supplement 4
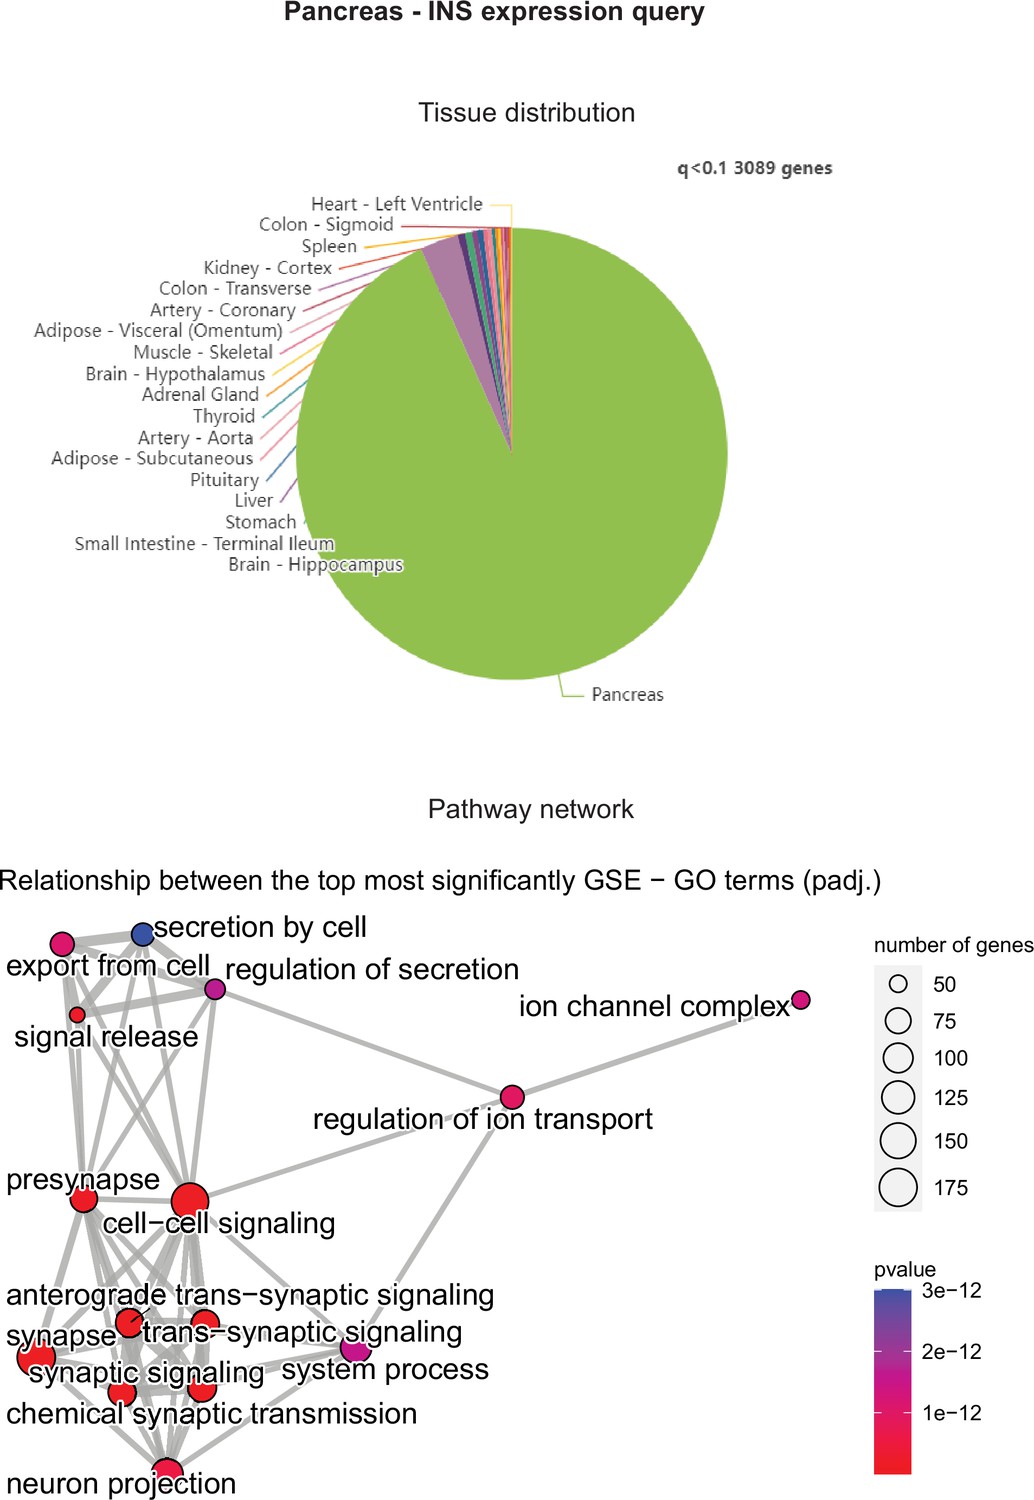
Pancreatic INS expression correlations across tissues in gene-by-tissue expression project (GTEx) were binned according to q<0.1 (top) and corresponding pancreatic gene set enrichment analysis (GSEA) network graph is shown (bottom).
Figure 2
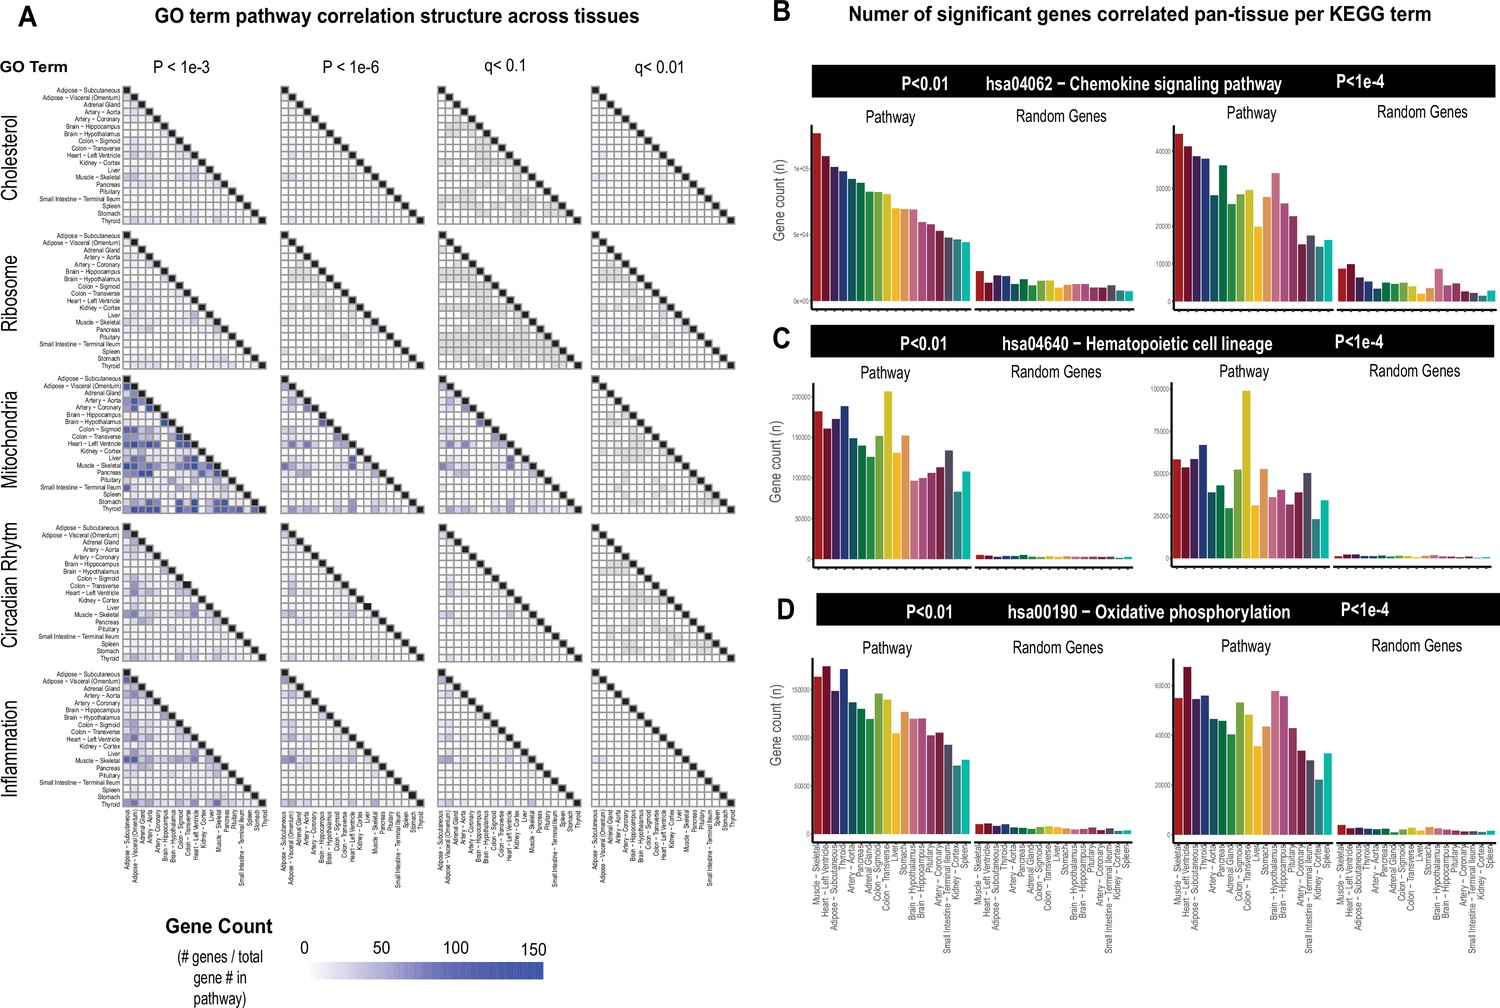
Tissue-specific contributions to pan-organ gene-gene correlation structure.
(A) Heatmap showing all the number of gene-gene correlations across tissues which achieve significance relative to total number of genes in each pathway at biweigth midcorrelation Student’s p-value <1e-3 (left column), p-value <1e-6 (left middle column) of BH-corrected q-value <0.1 (right middle column) or BH-corrected q-value <0.01 (right column). Within-tissue correlations are omitted from this analysis. (B–D) Genes corresponding to each KEGG pathway shown were correlated both within and across all other organs where the number of genes which meet each Student’s p-value threshold are shown (y-axis). Tissues (x-axis) are rank-ordered by the number of genes which correlate for hsa04062 − chemokine signaling pathway at p-value <0.01 and shown for other KEGG terms, hsa04640 − hematopoietic cell lineage (C) and hsa00190 − oxidative phosphorylation (D) and additionally p-value <1e-4 (right side).
Figure 3
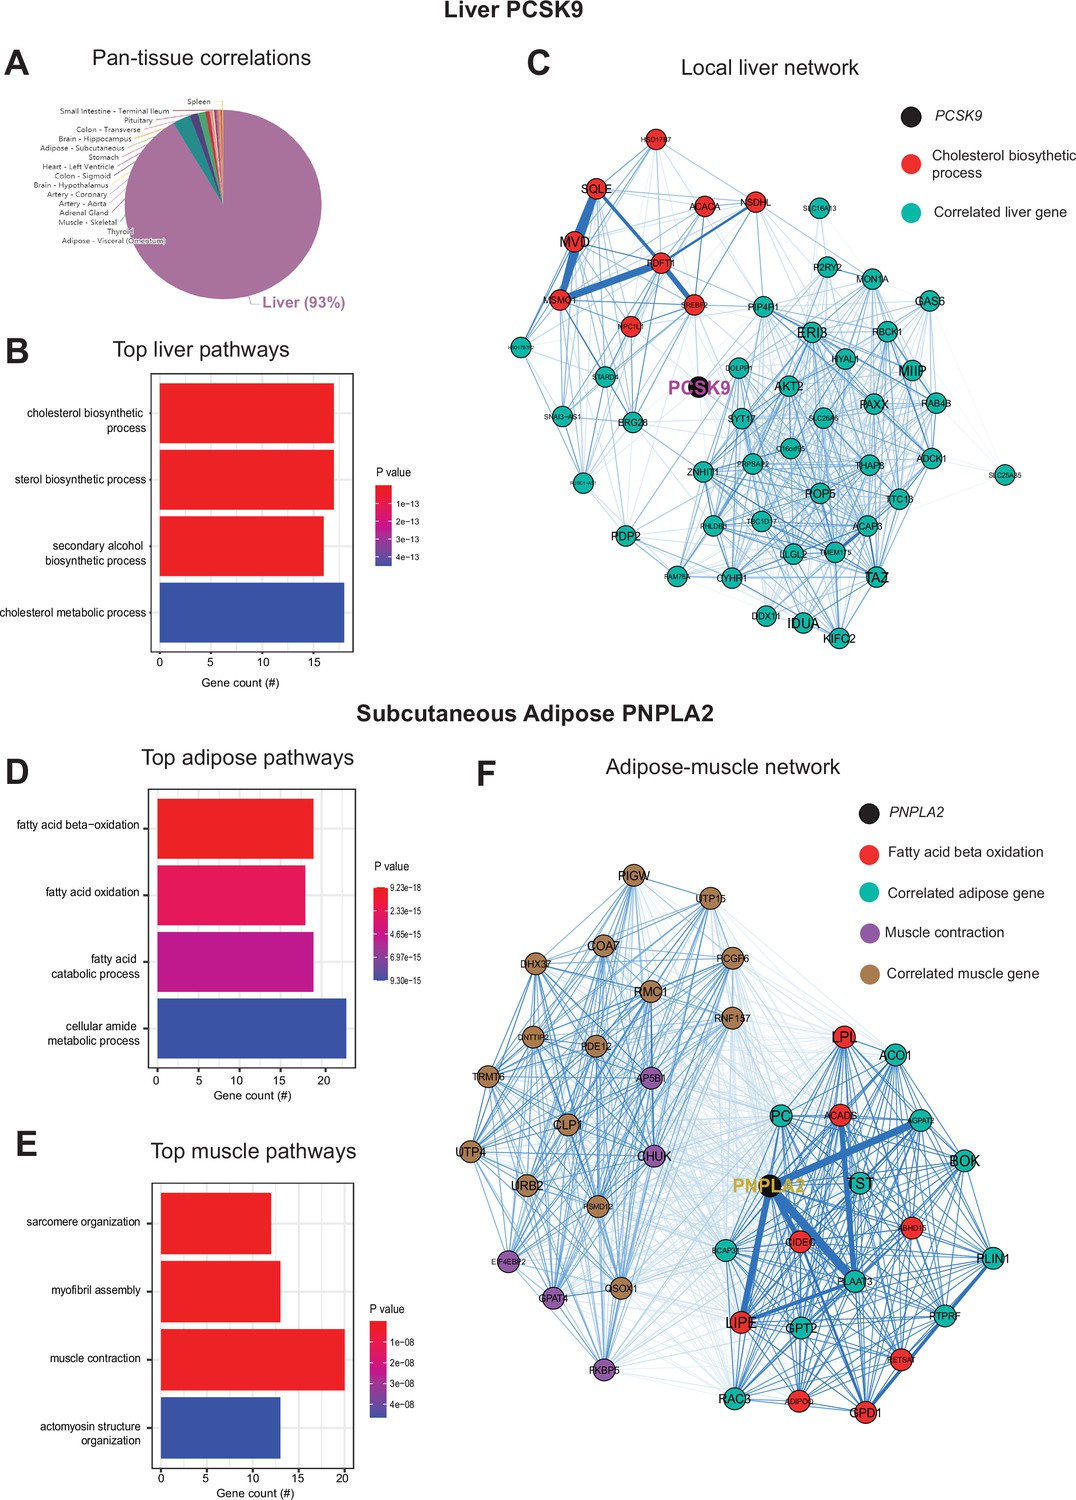
Inter-individual transcript correlation structure and network architecture of liver PCSK9 and adipose PNPLA2.
(A) Distribution of pan-tissue genes correlated with liver PCSK9 expression (q<0.1), where 93% of genes were within liver (purple). (B) Gene ontology (GO) (BP) overrepresentation test for the top 500 hepatic genes correlated with PCSK9 expression in liver. (C) Undirected network constructed from liver genes (aqua) correlated with PCSK9, where those annotated for ‘cholesterol biosynthetic process’ are colored in red. (D–E) Overrepresentation tests corresponding to the top-correlated genes with adipose (subcutaneous) PNPLA2 expression residing in adipose (D) or peripherally in skeletal muscle (E). (F) Undirected network constructed from the strongest correlated subcutaneous adipose tissue (light aqua) and muscle genes (light brown) with PNPLA2 (black), where genes corresponding to GO terms annotated as ‘fatty acid beta oxidation’ or ‘muscle contraction’ are colored purple or red, respectively. For these analyses all 310 individuals (across both sexes) were used and q-value adjustments calculated using a Benjamini-Hochberg FDR adjustment. Network graphs generated based in biweight midcorrelation coefficients, where edges are colored blue for positive correlations or red for negative correlations. Network edges represent positive (blue) and negative (red) correlations and the thicknesses are determined by coefficients. They are set for a range of bicor=0.6 (minimum to include) to bicor=0.99.
Figure 4
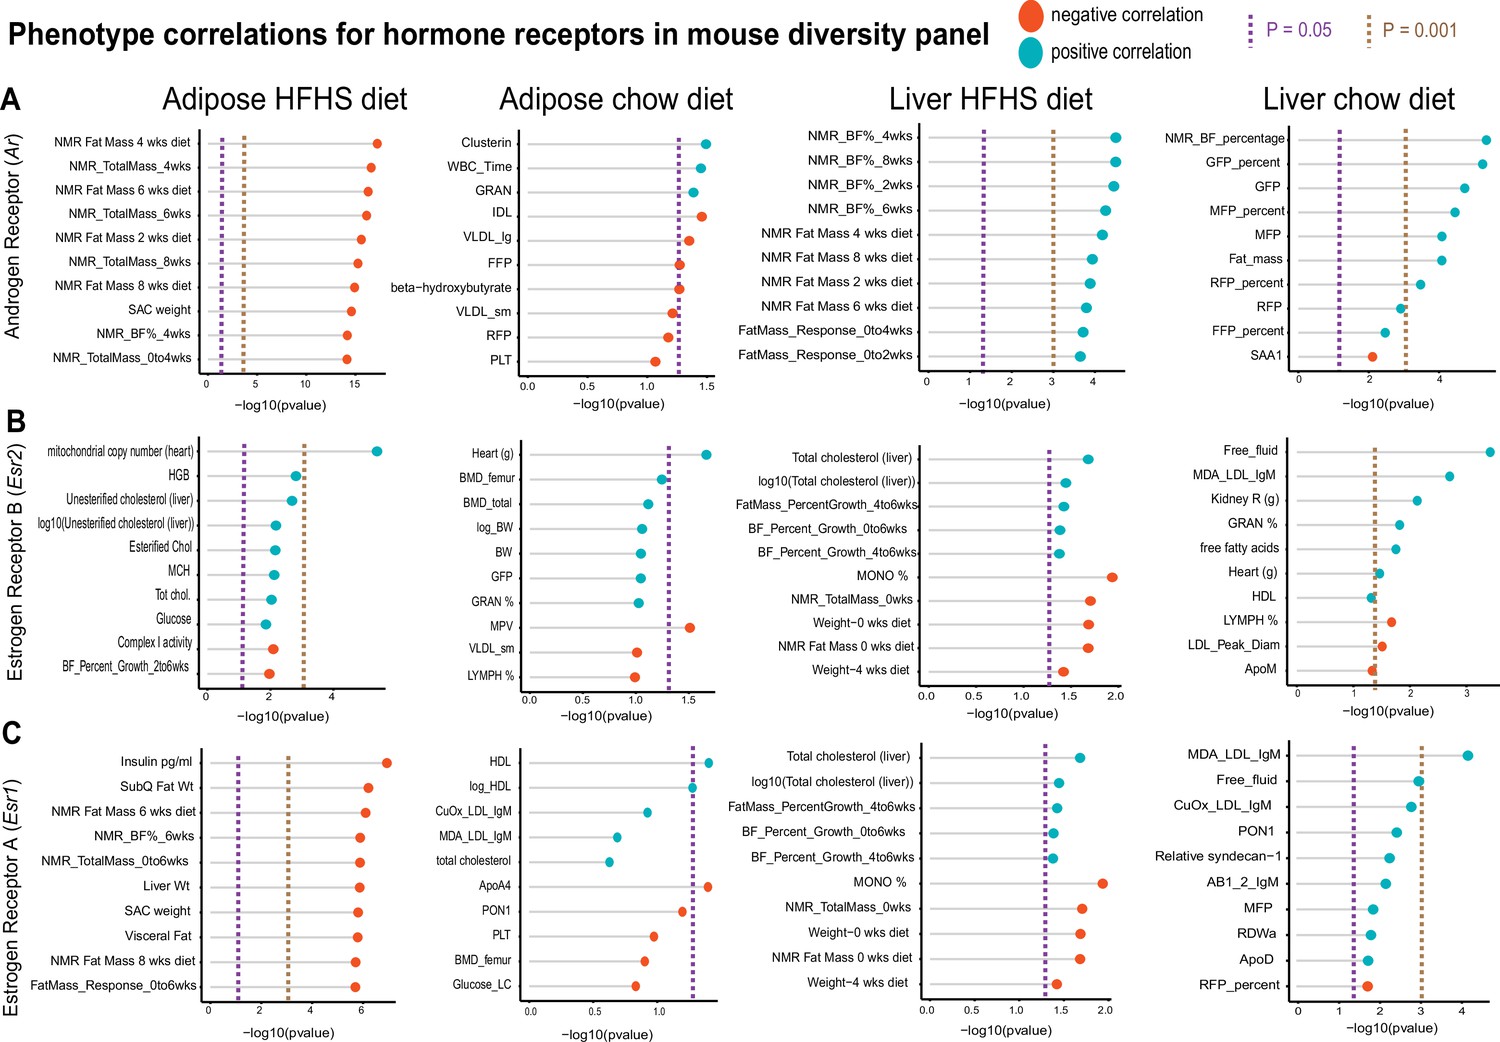
Hybrid mouse diversity panel (HMDP) tissue- and diet-specific correlations of sex hormone receptors.
The top 10 phenotypic traits are shown for correlations with expression of androgen receptor (A), estrogen receptor 1 (B), or estrogen receptor 2 (C), colored by direction in the hybrid mouse diversity panel. Positive correlations are shown in light blue and negative correlations as sunset orange, where phenotypes (y-axis) are ordered by significance (x-axis, -log10(p-value) of correlation). Correlations are segregated by whether sex hormone receptors are expressed by gonadal adipose tissue (left two columns) in ~100 HMDP strains fed a high-fat/high-sucrose (HFHS) diet (left), normal chow diet (left middle), or liver-expressed receptors fed an HFHS diet (right middle) or normal chow diet (right). Dashed lines show a Student’s correlation p-value (from bicor) of p=0.05 (purple) or p=0.001 (beige).
Additional files
Download links
A two-part list of links to download the article, or parts of the article, in various formats.
Downloads (link to download the article as PDF)
Open citations (links to open the citations from this article in various online reference manager services)
Cite this article (links to download the citations from this article in formats compatible with various reference manager tools)
Leveraging inter-individual transcriptional correlation structure to infer discrete signaling mechanisms across metabolic tissues
eLife 12:RP88863.
https://doi.org/10.7554/eLife.88863.3


