Transcriptional immune suppression and up-regulation of double-stranded DNA damage and repair repertoires in ecDNA-containing tumors
- Bioinformatics and Systems Biology Graduate Program, University of California, San Diego, United States
- Department of Biomedical Systems Informatics and Brain Korea 21 PLUS Project for Medical Science, Yonsei University College of Medicine, Republic of Korea
- Department of Computer Science and Engineering, University of California, San Diego, United States
- Center for Personal Dynamic Regulomes, Stanford University, United States
- Department of Genetics, Stanford University, United States
- Howard Hughes Medical Institute, Stanford University, United States
- Children’s Medical Center Research Institute, University of Texas Southwestern Medical Center, United States
- Sarafan Chemistry, Engineering, and Medicine for Human Health (Sarafan ChEM-H), Stanford University, United States
- Department of Pathology, Stanford University School of Medicine, United States
- Halıcıoğlu Data Science Institute, University of California, San Diego, United States
Figures
Figure 1 with 5 supplements
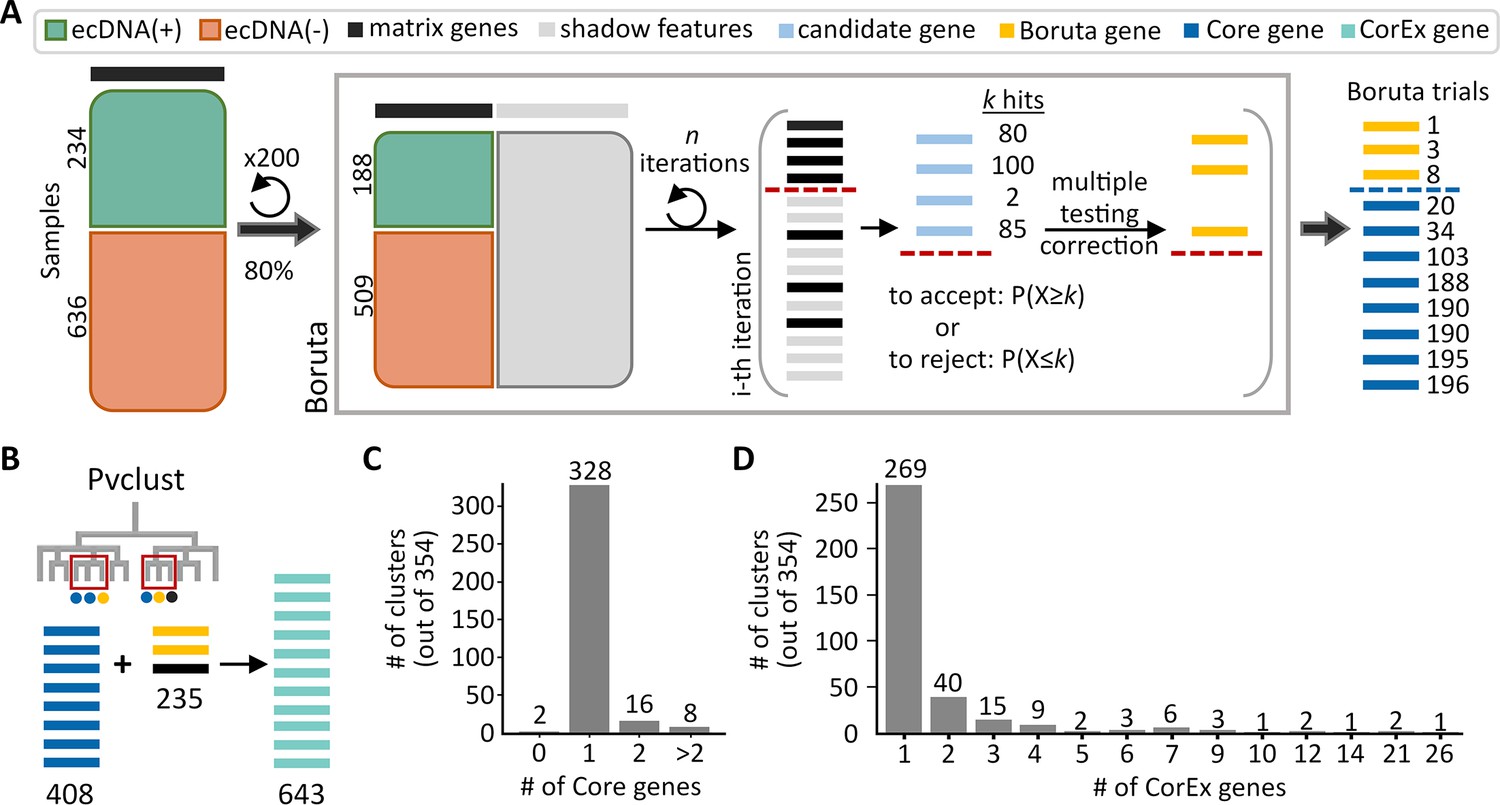
Genes predictive of extrachromosomal DNA (ecDNA) status.
(A) The feature selection algorithm, Boruta, was applied to 200 datasets of randomly selected subsets consisting of 80% of all samples. Genes selected by Boruta in at least 10 of the 200 trials were identified as the Core set of genes (408) that were predictive of ecDNA presence. (B) Identification of highly co-expressed and stable gene clusters using pvclust expanded the Core set by an additional 235 genes to the final list of 643 CorEx genes. (C) Out of 354 clusters, the majority (344) of clusters contained one or two Core genes. (D) Most clusters were small, with only seven clusters containing more than 10 genes.
Figure 1—figure supplement 1
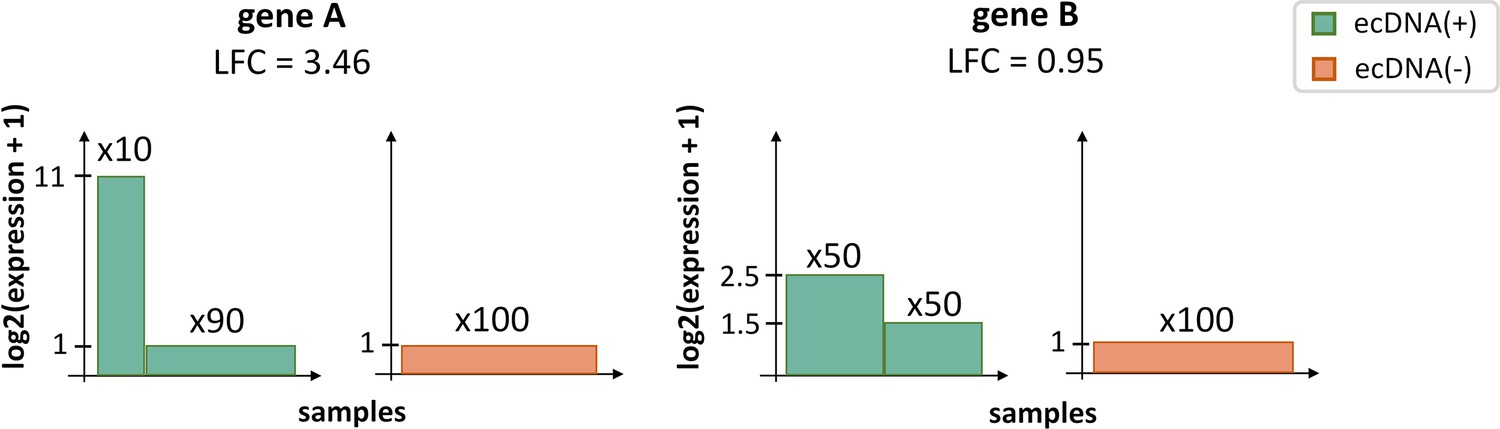
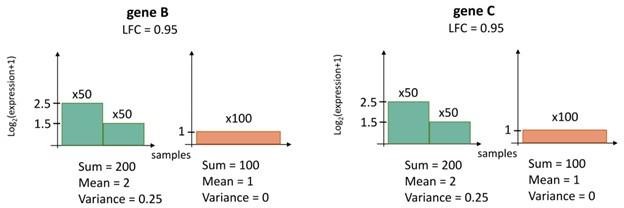
Cartoon illustration of the rationale for Boruta analysis.
A differentially expressed gene (e.g. gene A) may have a higher log-fold change (LFC) value than that of a CorEx gene (e.g. gene B), but may not be persistently over- or under-expressed in ecDNA(+) samples. Therefore, no expression value cut-off can be used to separate ecDNA(+) samples from ecDNA(-) samples using gene A expression. In contrast, gene B expression can separate the two classes perfectly.
Figure 1—figure supplement 2
Extended co-expressed cluster characterization.
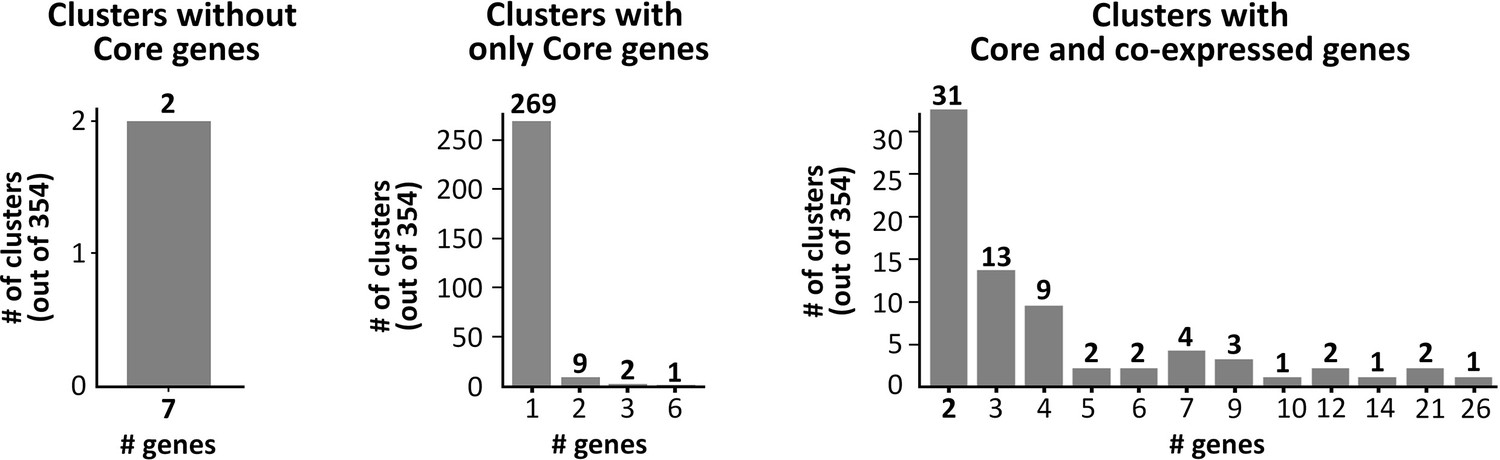
Pvclust identified 354 highly co-expressed clusters where members are selected in at least 10 out of 200 Boruta trials as a cluster. Of the 354 clusters, two did not contain any Core genes, 281 only contained Core genes, and 71 contained at least one Core and one co-expressed gene.
Figure 1—figure supplement 3
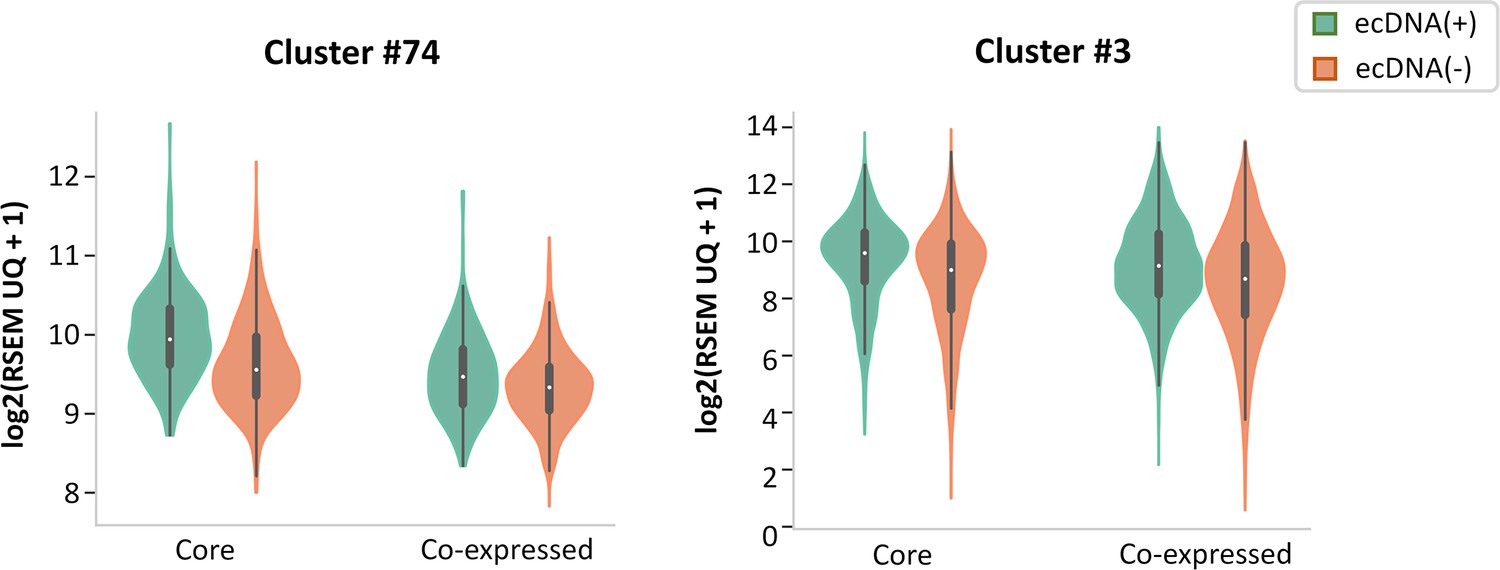
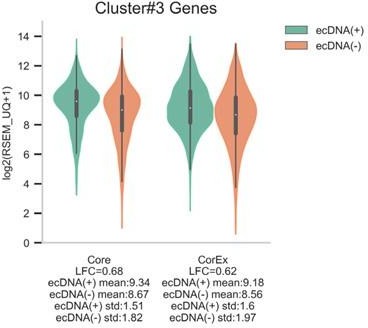
Gene expression of Core versus co-expressed genes in clusters.
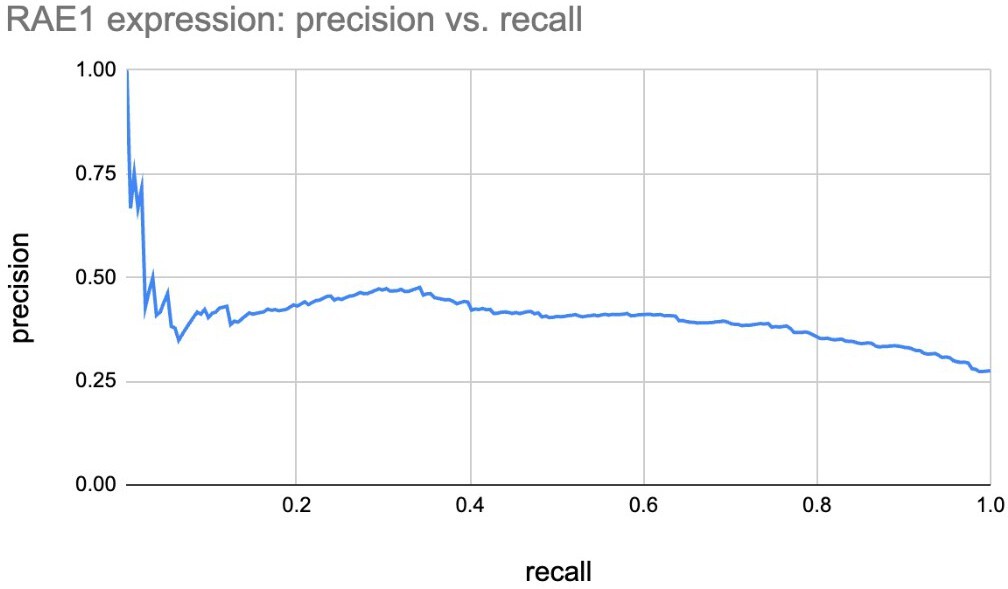
Cluster #74 contains a Core gene, RAE1, and a co-expressed gene, CSTF1. Cluster #3 contains nine Core genes and 12 co-expressed genes.
Figure 1—figure supplement 4
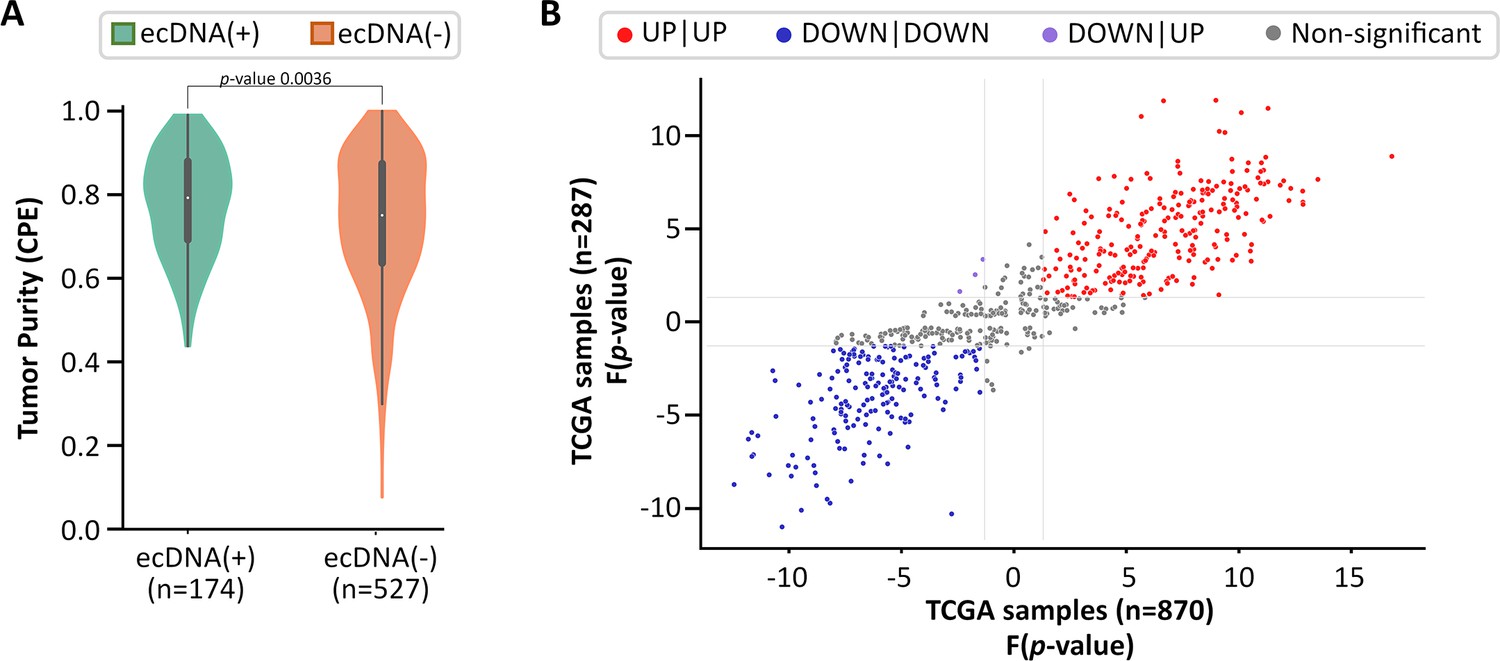
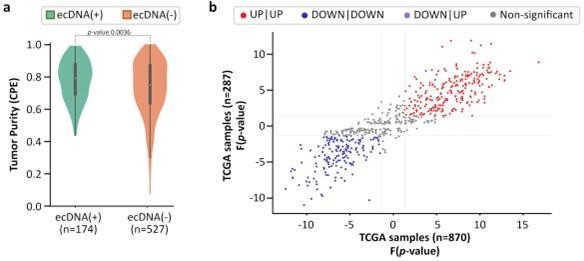
Impact of tumor purity on CorEx gene expression.
Of the 870 TCGA samples (234 ecDNA(+), 636 ecDNA(-)), 701 samples (174 ecDNA(+), 527 ecDNA(-)) were assigned a consensus measurement of purity estimation (CPE) by Aran et al., 2015. (A) ecDNA(-) samples have slightly lower purity than ecDNA(+) samples (MWU p-value 0.0036). (B) For samples with high tumor purity (CPE ≥0.8, n=287), the expression directionality of CorEx genes (i.e. based on the Mann-Whitney U test) was highly correlated with that of all samples (n=870). Among the 275 genes that had a higher expression in the ecDNA(+) samples of all samples, 243 genes also had a higher expression in the ecDNA(+) samples of high tumor purity samples (red dots). Among the 284 genes that had a lower expression in the ecDNA(+) samples of all samples, 181 genes also had a lower expression in the ecDNA(+) samples of high tumor purity samples (blue dots). Together, 424 of 559 (75.8%) CorEx genes with significant directionality were in agreement between all samples and samples with high tumor purity.
Figure 1—figure supplement 5
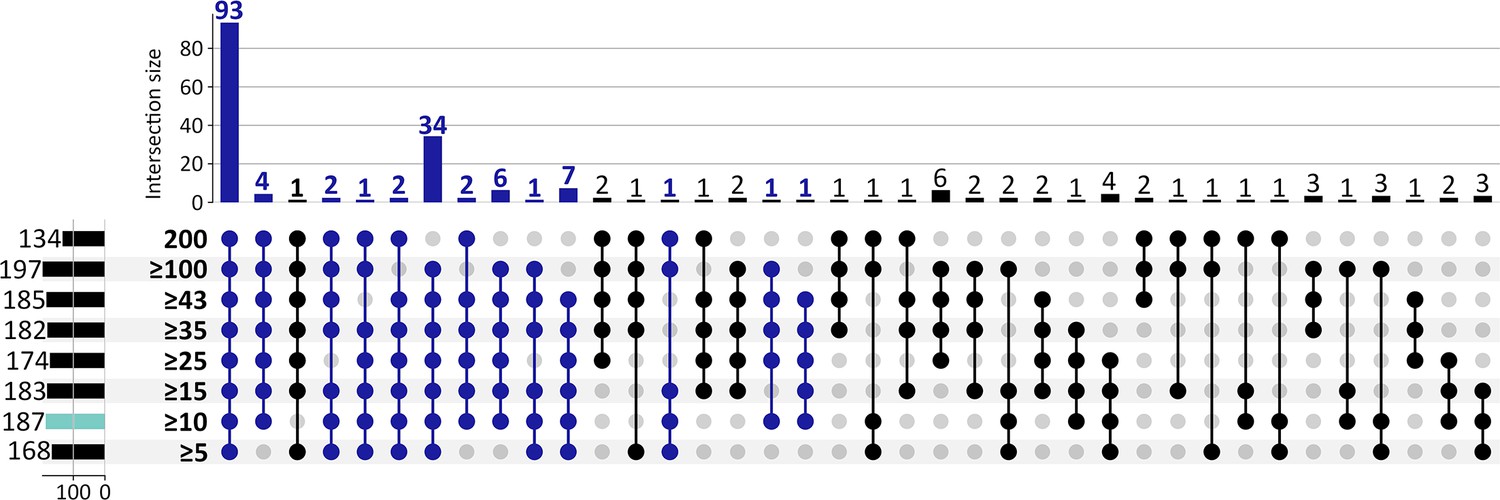
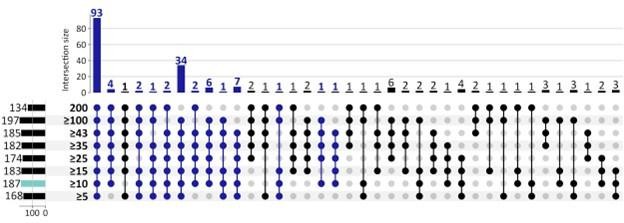
Gene Ontology (GO) biological processes enriched by up-regulated CorEx genes from eight selection criteria ranging from 5 to 200 of 200 Boruta trials.
Of the 187 GO terms (turquoise) that were enriched by 262 up-regulated CorEx genes using 10 out of 200 Boruta trials as the selection criteria, 93 terms (49.7%) were enriched for each cut-off criteria, and 155 terms (82.9%) were enriched in at least 5 of the 8 cut-off criteria (dark blue). A minimum degree of three was required when using the python UpSet plot function (upsetplot v0.8.0).
Figure 2 with 4 supplements
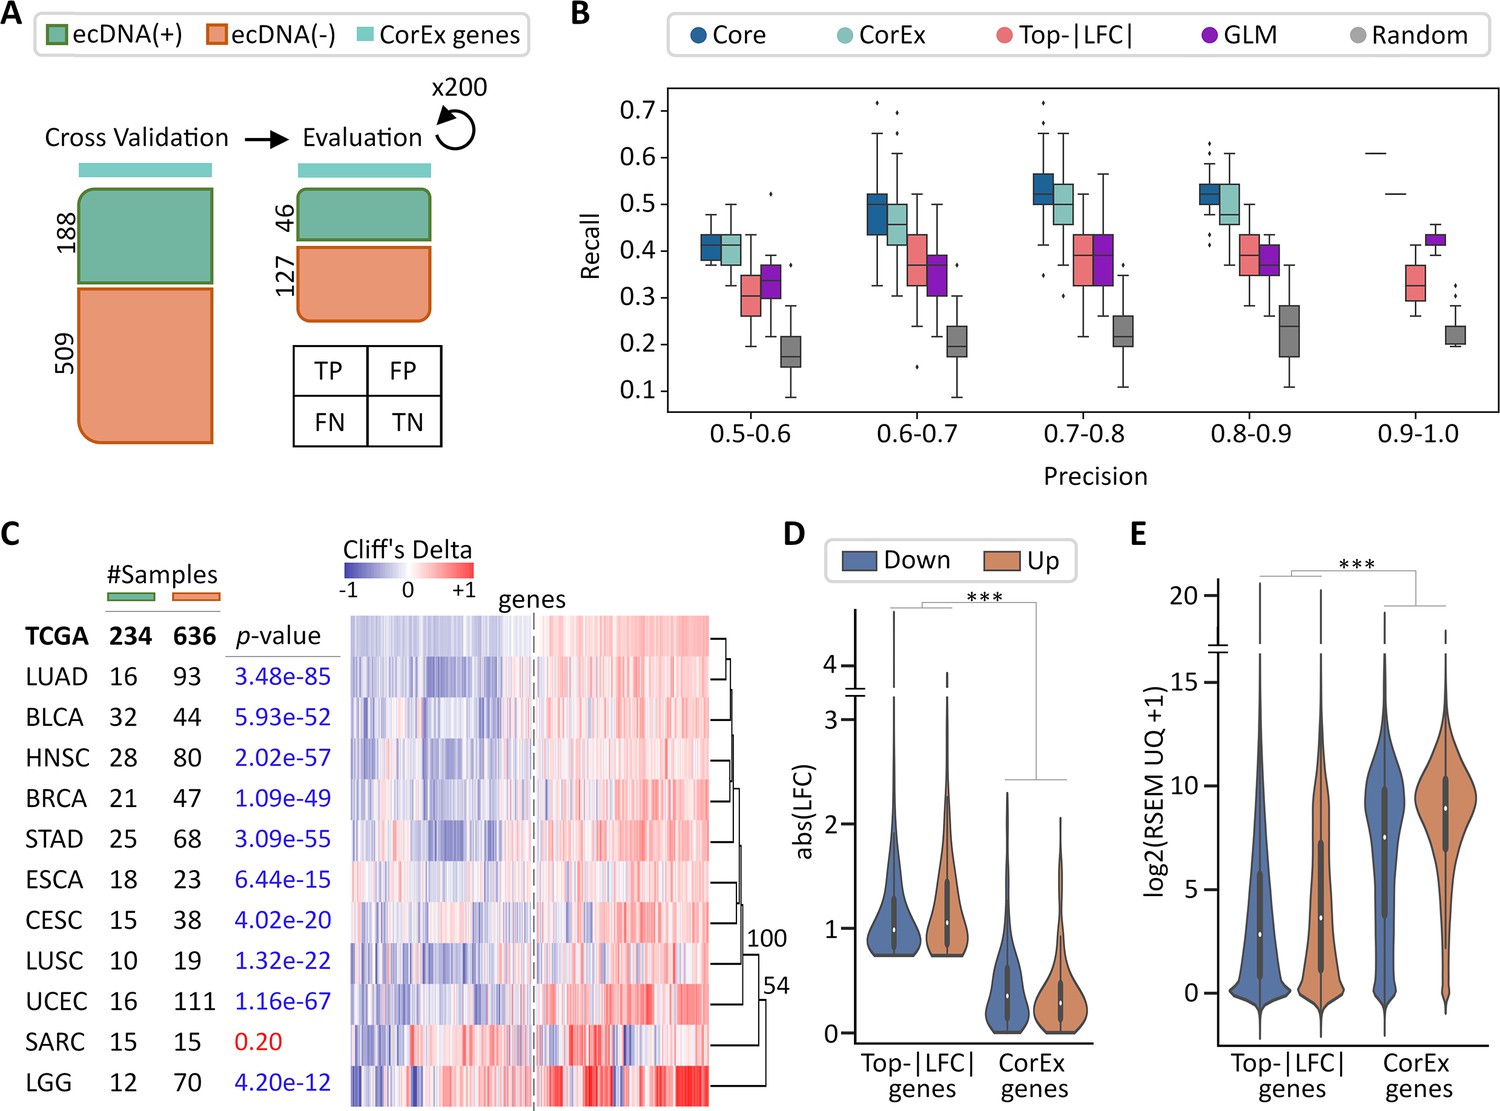
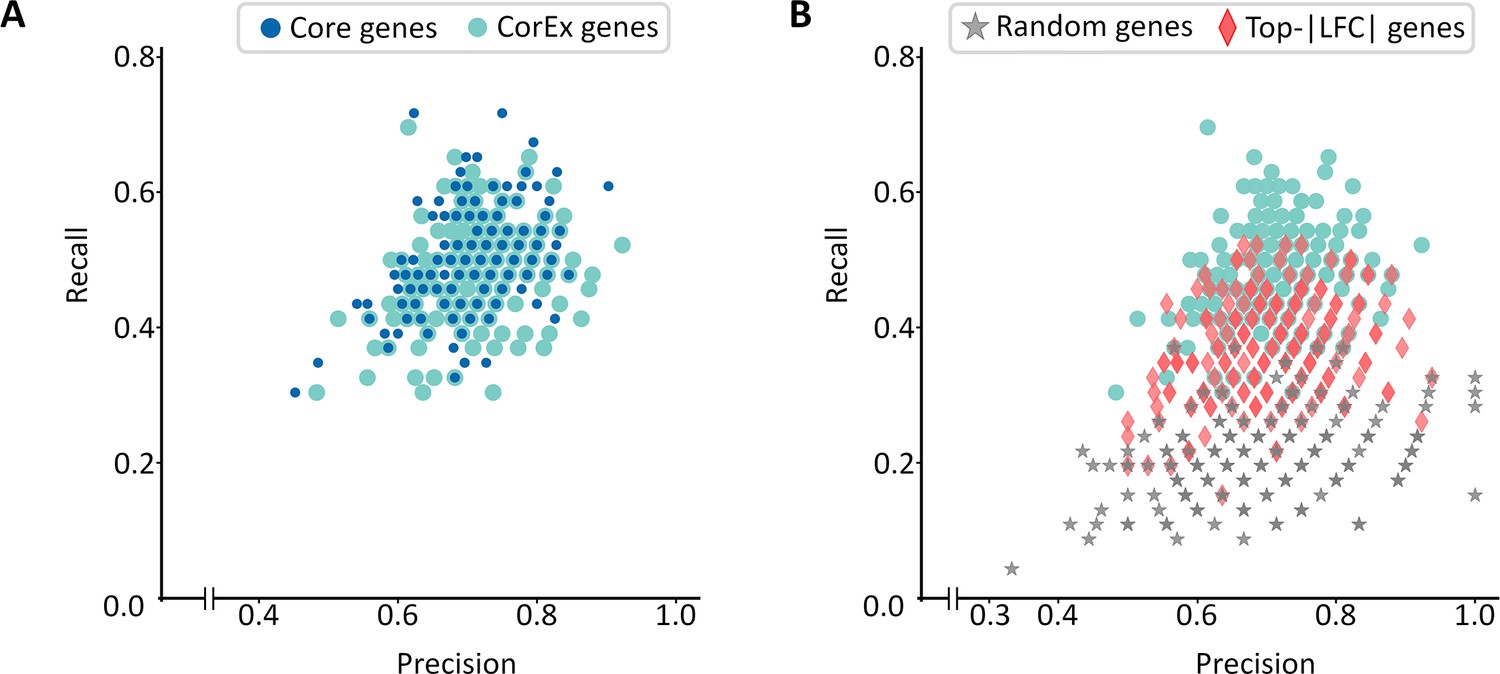
Validation of CorEx genes.
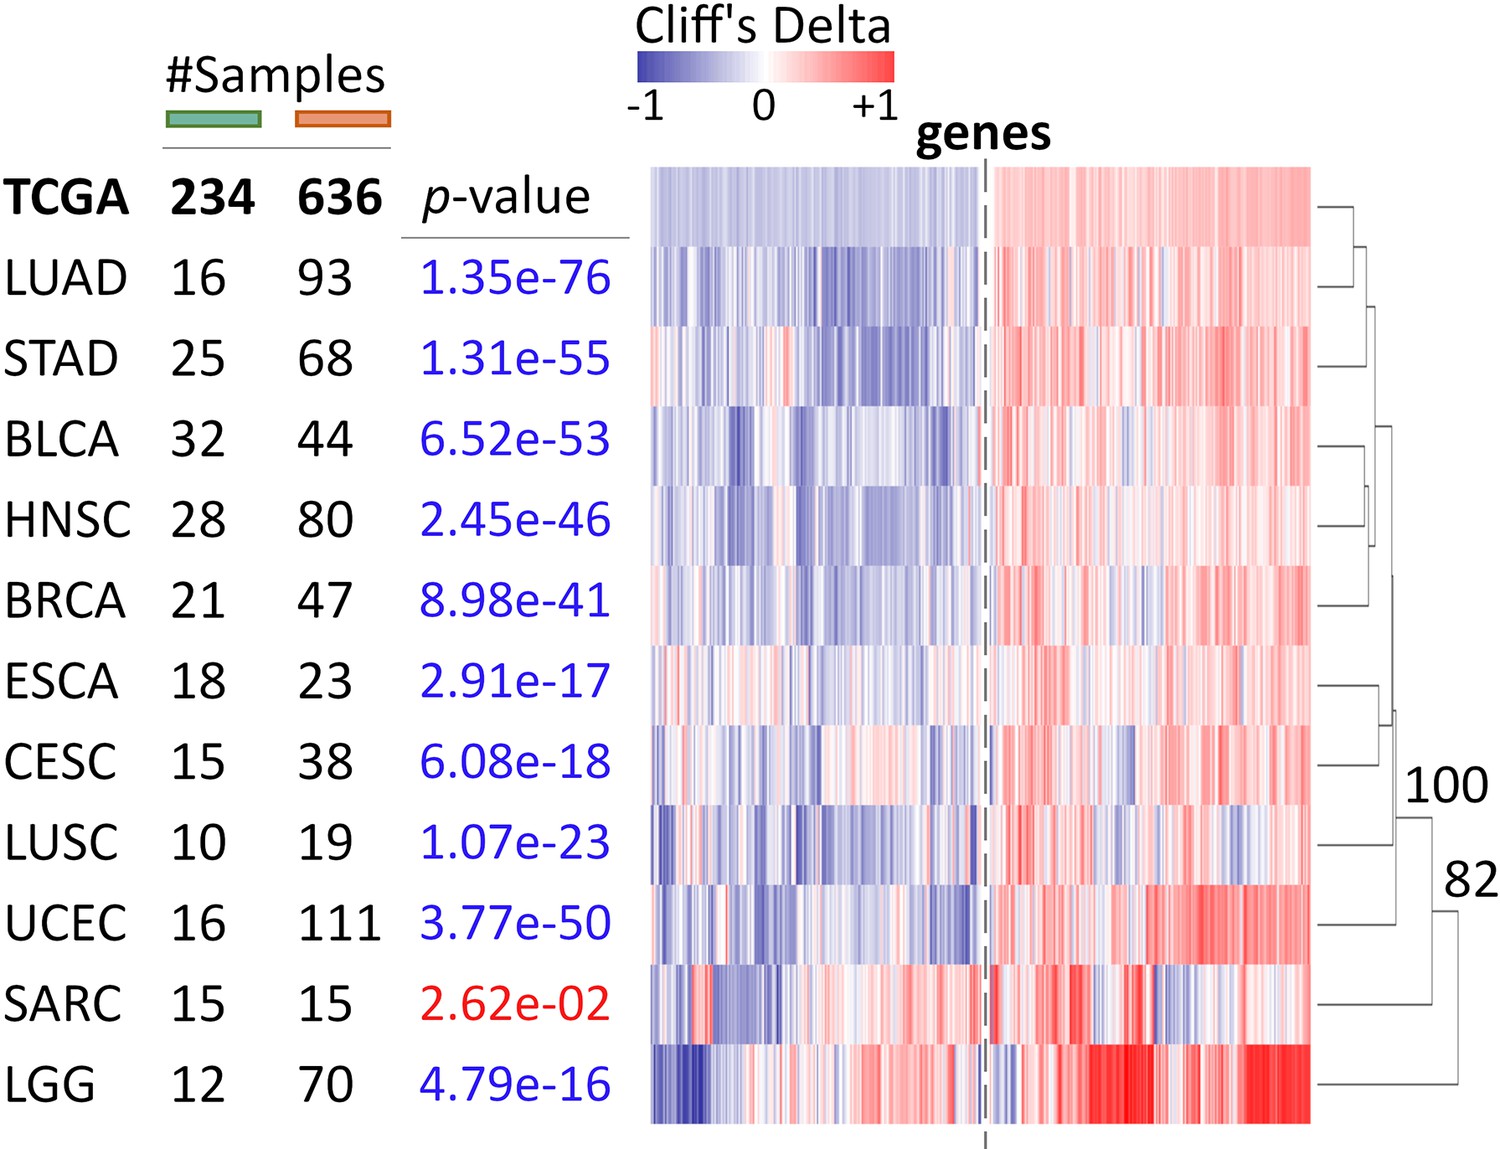
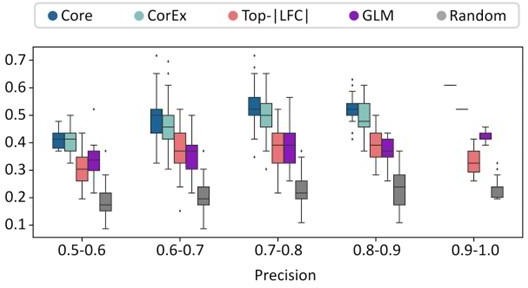
(A) Cross-validation experiments validating the predictive value of CorEx genes. Precision denotes the fraction of predicted samples that were truly ecDNA(+). Recall refers to the fraction of ecDNA(+) samples that were predicted correctly. (B) For precision windows of width 0.1 and a value of at least 0.5, recall values were plotted as boxplots. The interquartile ranges for CorEx and Core genes overlap, suggesting similar predictive power. CorEx genes have higher predictive rates compared to the top 643 differentially expressed genes based on logarithmic fold changes from a DESeq2 analysis (Top-|LFC| genes), 3012 significant genes selected from a generalized linear model (GLM), and 643 randomly selected genes. (C) CorEx genes were consistently up- or down-regulated in ecDNA(+) samples across tumor types, with the exception of Sarcoma (SARC). Approximately unbiased (AU) p-values from multiscale bootstrap resampling are shown at the dendrogram branches. (D) Of the 643 Top-|LFC| genes, 240 were up-regulated while 403 were down-regulated in ecDNA(+) samples. Of the CorEx genes, 325 were up-regulated while 318 were down-regulated. The absolute log-fold change (LFC) values of the Top-|LFC| gene set was significantly greater than that of the CorEx genes (p-value 1.83e-158). (E) The normalized gene expression values of the CorEx genes were significantly higher than that of the Top-|LFC| gene set (p-value <2e-308). ***p-value <0.001.
Figure 2—figure supplement 1
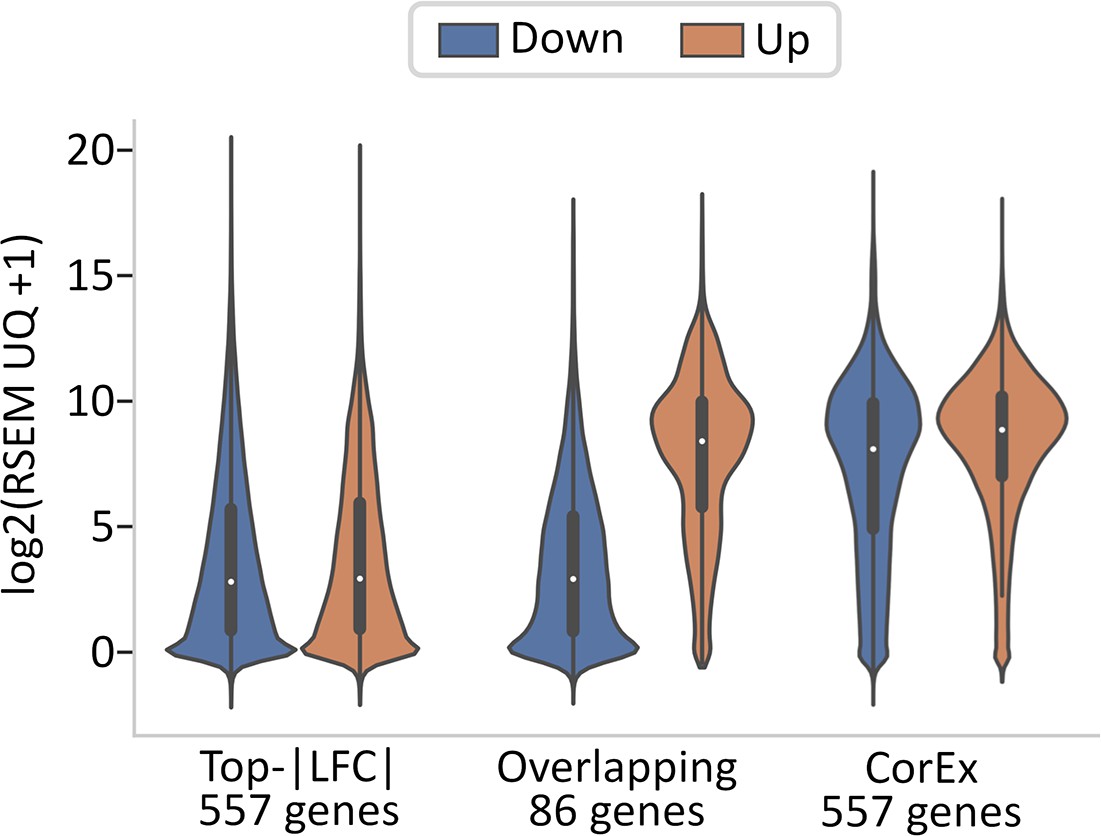
Gene expression of Top-|LFC| versus CorEx genes.
86 CorEx genes are part of the 643 Top-|LFC| gene set.
Figure 2—figure supplement 2
Extended validation of CorEx genes.
(A) Cross-validation experiments validating the predictive value of CorEx genes. Precision denotes the fraction of predicted samples that were truly ecDNA(+). Recall refers to the fraction of ecDNA(+) samples that were predicted correctly. CorEx genes have similar predictive value to Core genes. (B) CorEx genes have higher predictive rates compared to 643 randomly selected genes and the top 643 differentially expressed genes based on logarithmic fold changes from a DESeq2 analysis (Top-|LFC| genes).
Figure 2—figure supplement 3
Differential expression of Core genes by tumor type.
Core genes are also consistently up- or down-regulated in ecDNA(+) samples across tumor types, with the exception of Sarcoma (SARC), similar to CorEx genes (Figure 2C). AU p-values from multiscale bootstrap resampling are shown at the dendrogram branches.
Figure 2—figure supplement 4
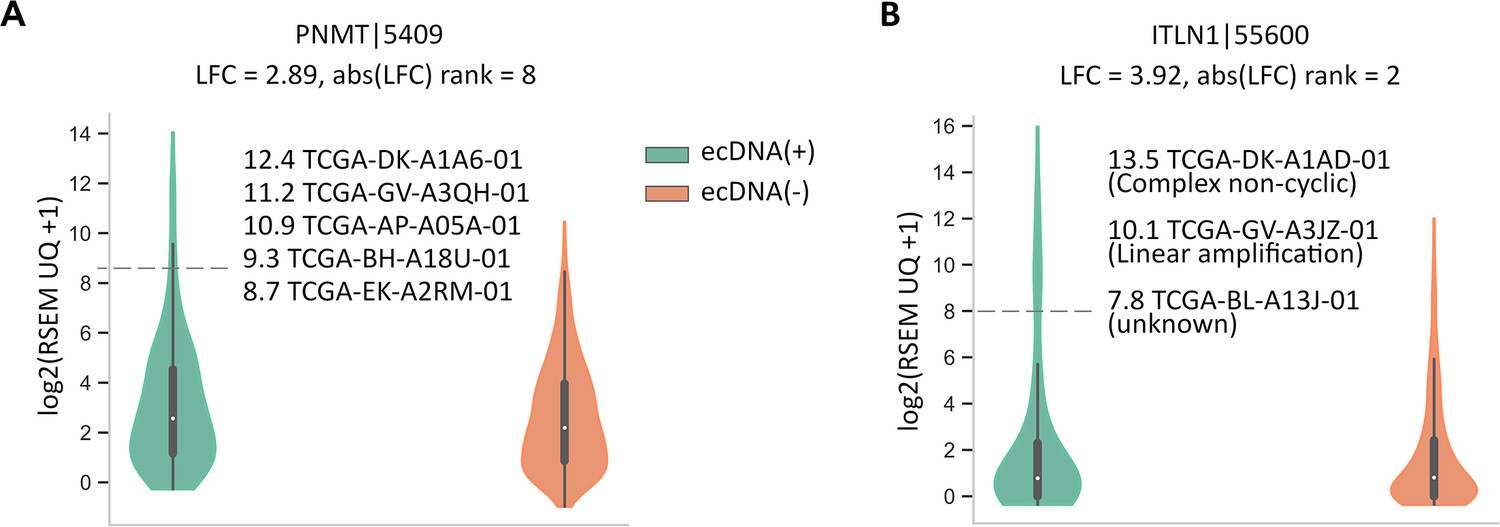
Up-regulation of CorEx genes located on amplicons.
(A) PNMT normalized gene expression in ecDNA(+) vs. ecDNA(-) samples. (B) ITLN1 normalized gene expression in ecDNA(+) vs. ecDNA(-) samples. In both cases, their up-regulation in ecDNA(+) samples is explained by their presence on a region with somatic, focal copy number amplification.
Figure 3 with 1 supplement
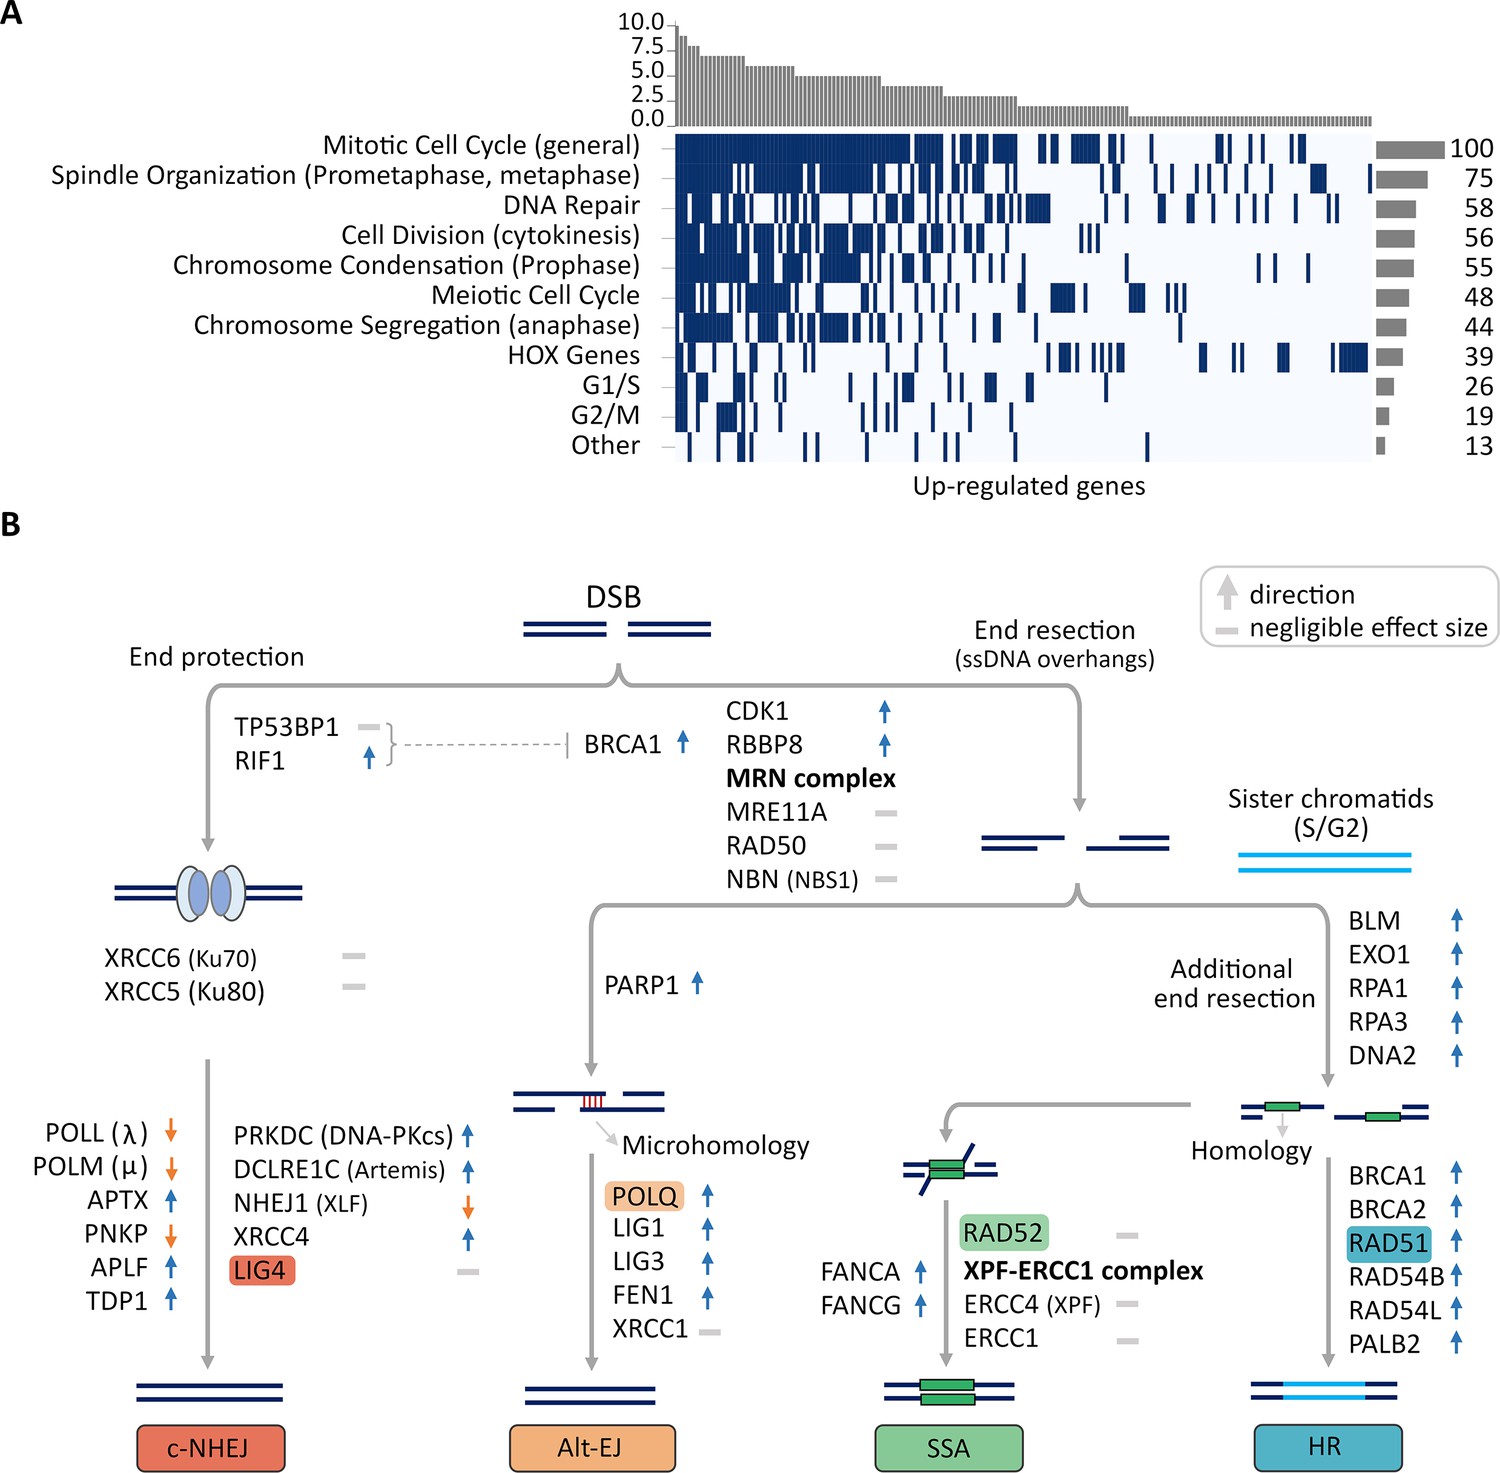
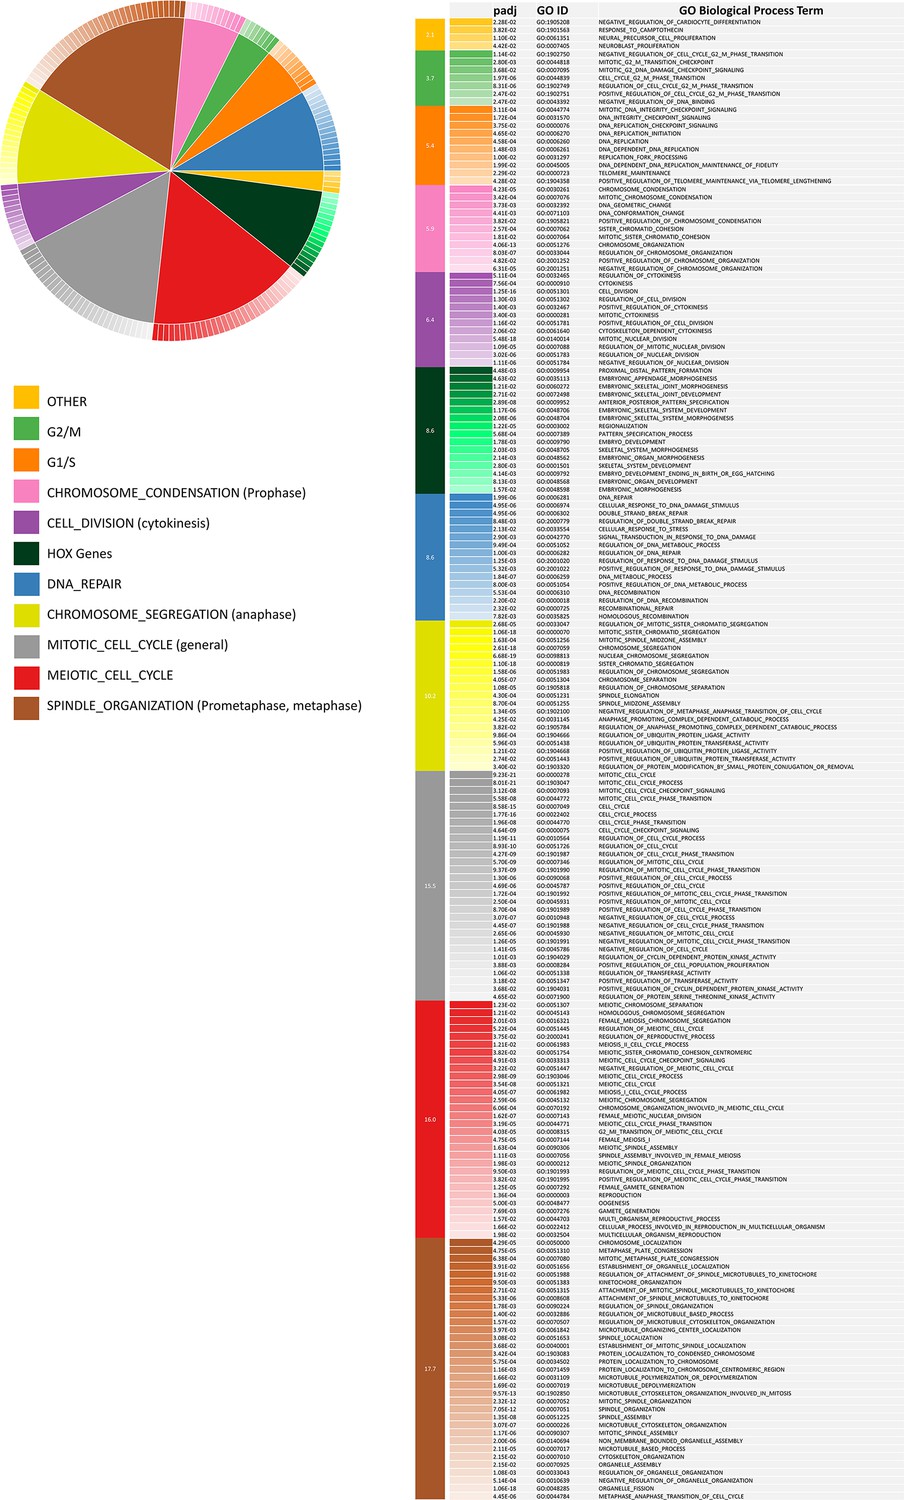
Up-regulated CorEx genes.
(A) Gene Ontology (GO) biological processes enriched in up-regulated genes were clustered into 11 broad categories. The horizontal barplot represents the number of GO biological processes belonging to each of the 11 broad categories, while the vertical barplot represents the number of broad categories that a specific GO biological process belongs to. (B) Genes up- or down-regulated in processes involved in major double-strand break (DSB) damage repair pathways. Many critical genes in the classical non-homologous end-joining (c-NHEJ) pathway were down-regulated in ecDNA(+) samples relative to ecDNA(-) samples.
Figure 3—figure supplement 1
Biological process categories enriched in up-regulated CorEx genes.
187 enriched Gene Ontology Biological Process (GOBP) terms represented by 169 up-regulated CorEx genes. The enriched biological processes cluster into 11 categories, which in turn can be grouped into cell-cycle regulation, Mitotic cell division, double-strand break DNA Damage response, and the HOX gene cluster.
Figure 4 with 2 supplements
Down-regulated CorEx genes.
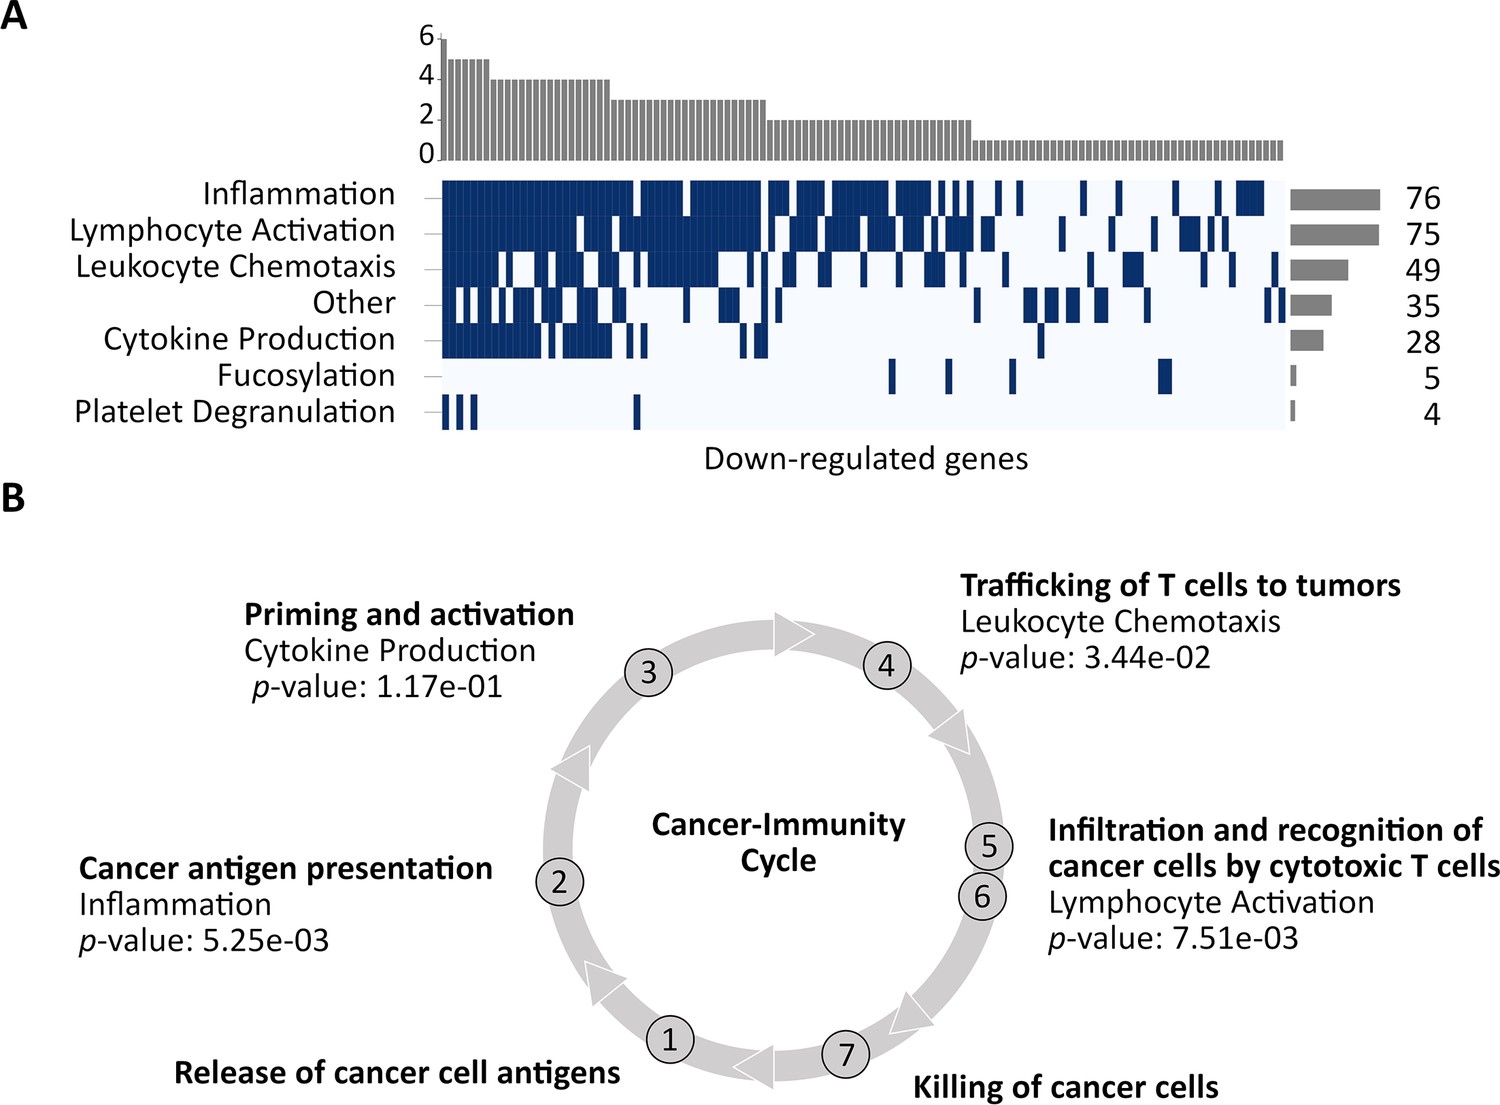
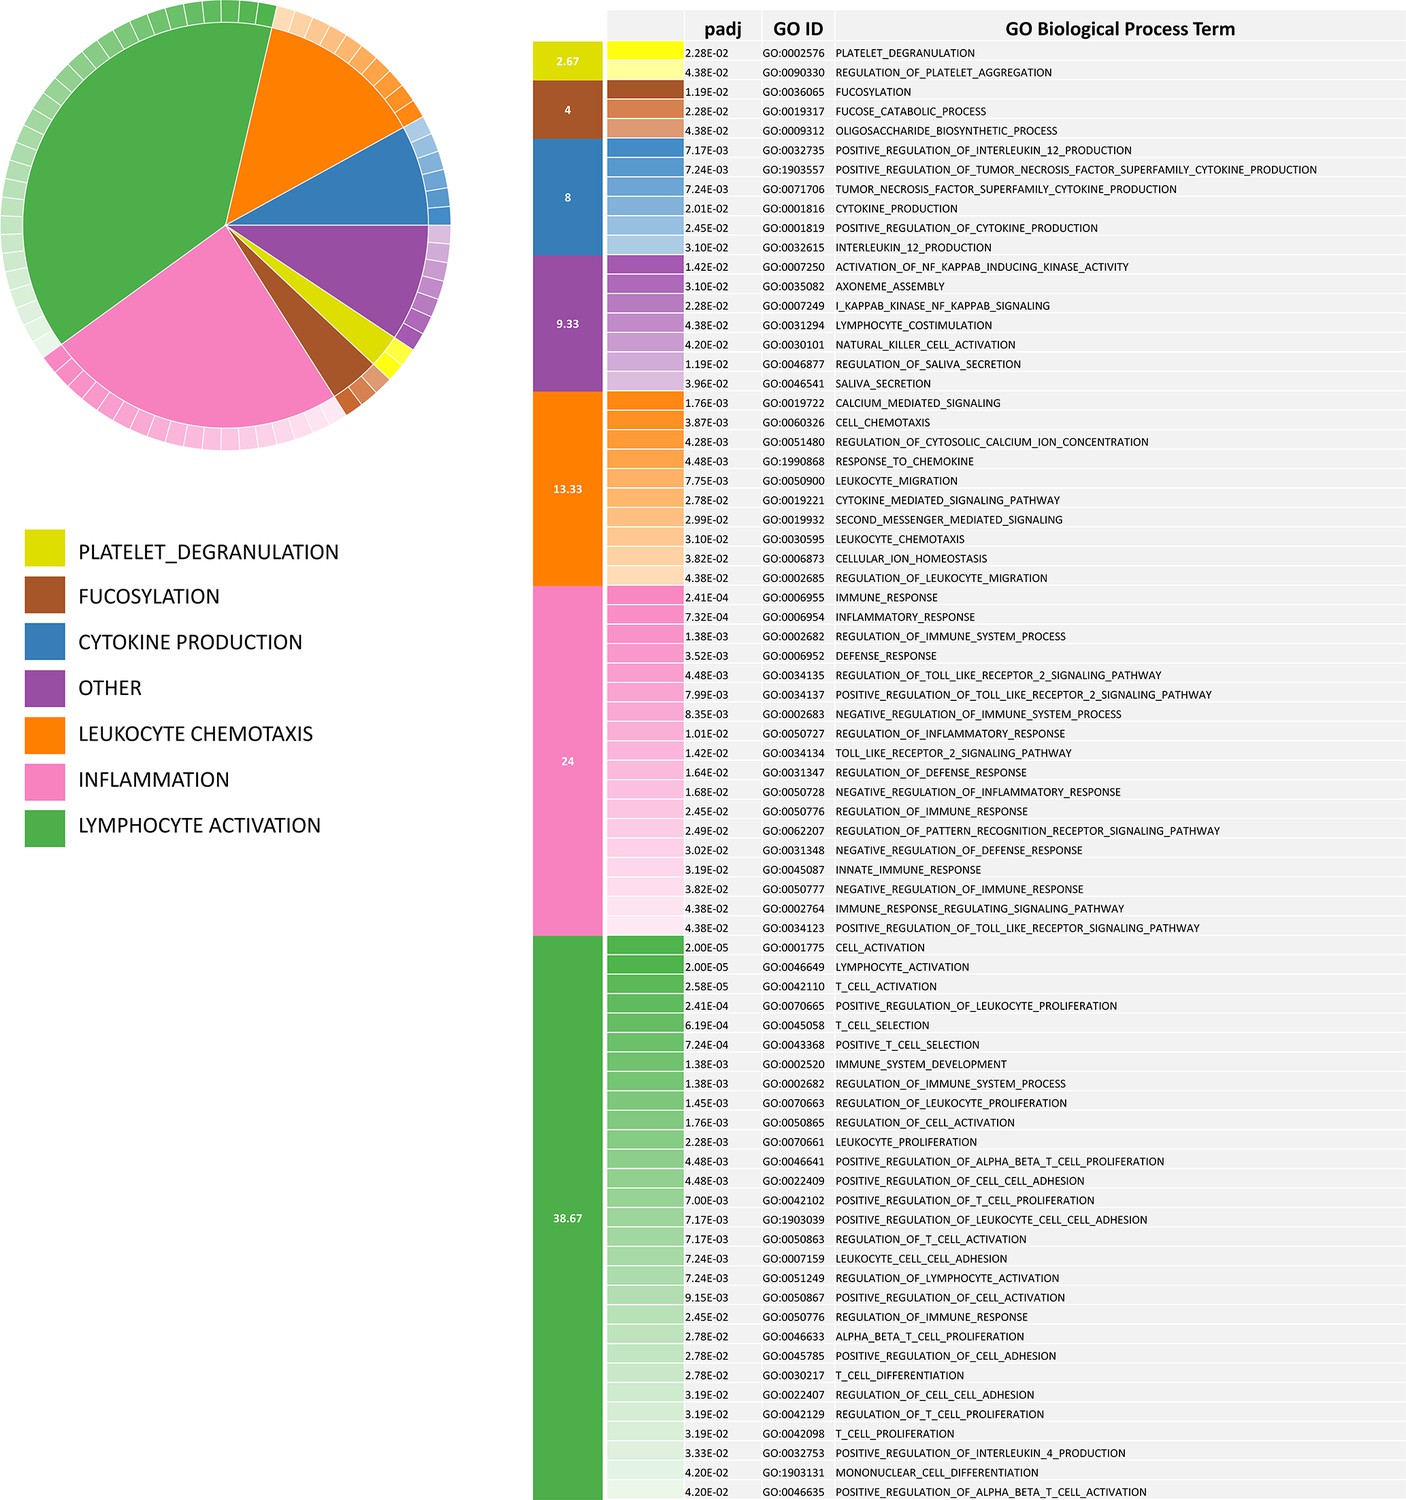
(A) Gene Ontology (GO) biological processes enriched in down-regulated genes were clustered into seven broad categories. The horizontal barplot represents the number of GO biological processes belonging to each of the seven broad categories, while the vertical barplot represents the number of broad categories that a specific GO biological process belongs to. (B) Four of these categories map to steps in the cancer-immunity cycle. CorEx genes in three of the four categories were significantly down-regulated compared to all genes (Fisher’s exact test).
Figure 4—figure supplement 1
Biological process categories enriched in down-regulated CorEx genes.
73 enriched GOBP terms represented by 119 down-regulated CorEx genes. The enriched biological processes can be clustered into 7 categories, 6 of which are related to immune response, suggesting a broad-based deregulation.
Figure 4—figure supplement 2
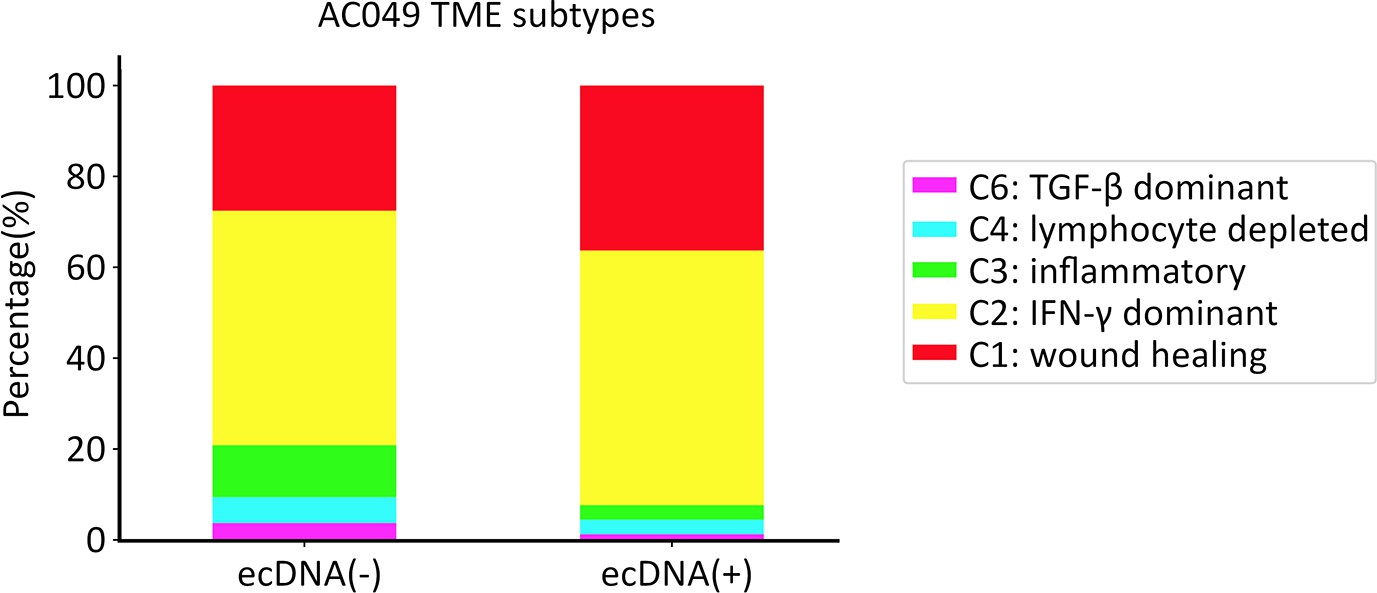
Tumor microenvironment (TME) subtypes in extrachromosomal DNA (ecDNA)-containing tumors.
TME sub-typing of The Cancer Genome Atlas (TCGA) samples classified as ecDNA(+) or ecDNA(-) (Amplicon Classifier ver. 0.4.9) based on the immune subtypes provided by Thorsson et al., 2018.
Figure 5 with 5 supplements
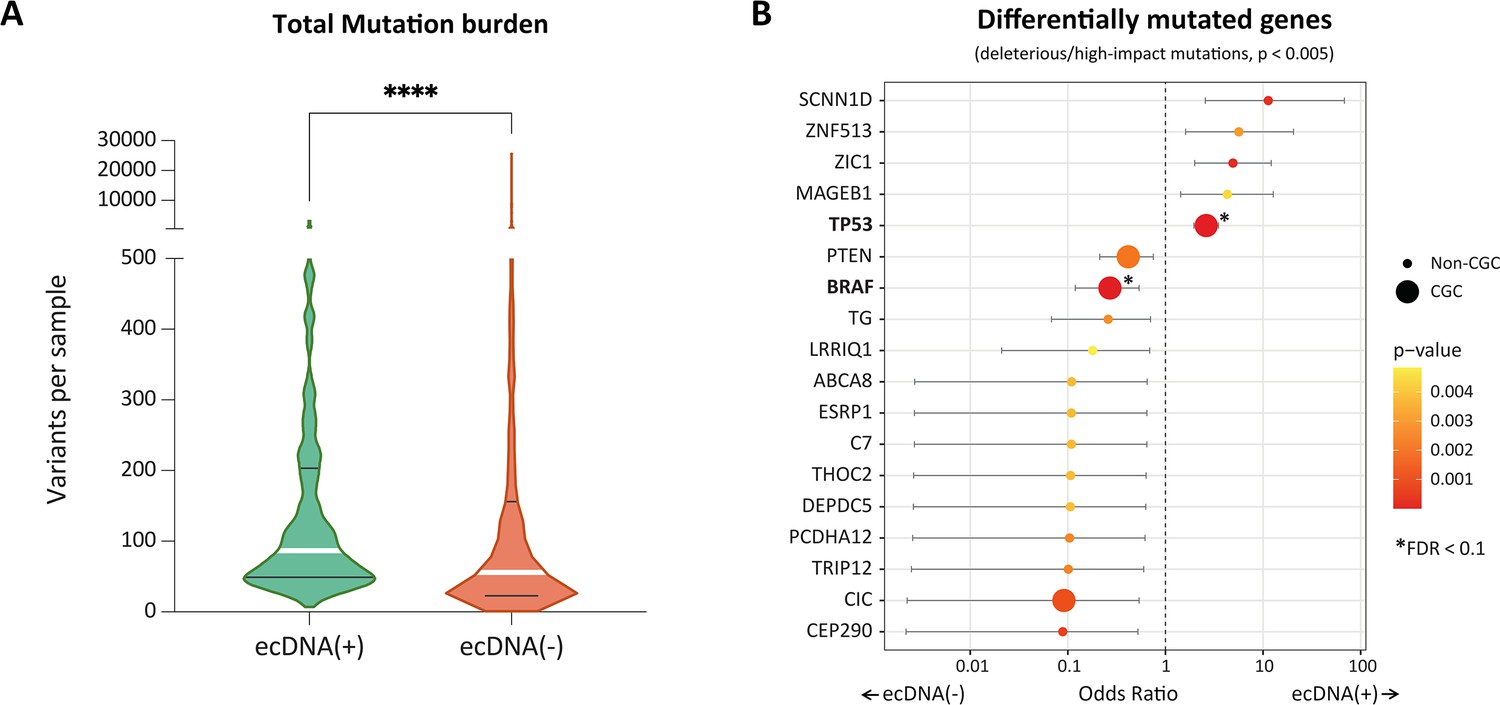
Mutational characteristics of extrachromosomal DNA (ecDNA)-containing tumors.
(A) Total mutation burden of ecDNA(+) and ecDNA(-) samples. ecDNA(+) samples have significantly higher mutation burden than the ecDNA(-) samples (p-value <0.0001, Mann Whitney test). (B) Odds ratios of differentially mutated genes in ecDNA(+) and ecDNA(-) (p-value <0.005). The size of the dot indicates whether the corresponding gene belongs to the Cancer Gene Census (CGC) or not (Non-CGC). Only TP53 and BRAF showed significance at the level of FDR <0.1 (Benjamini-Hochberg).
Figure 5—figure supplement 1
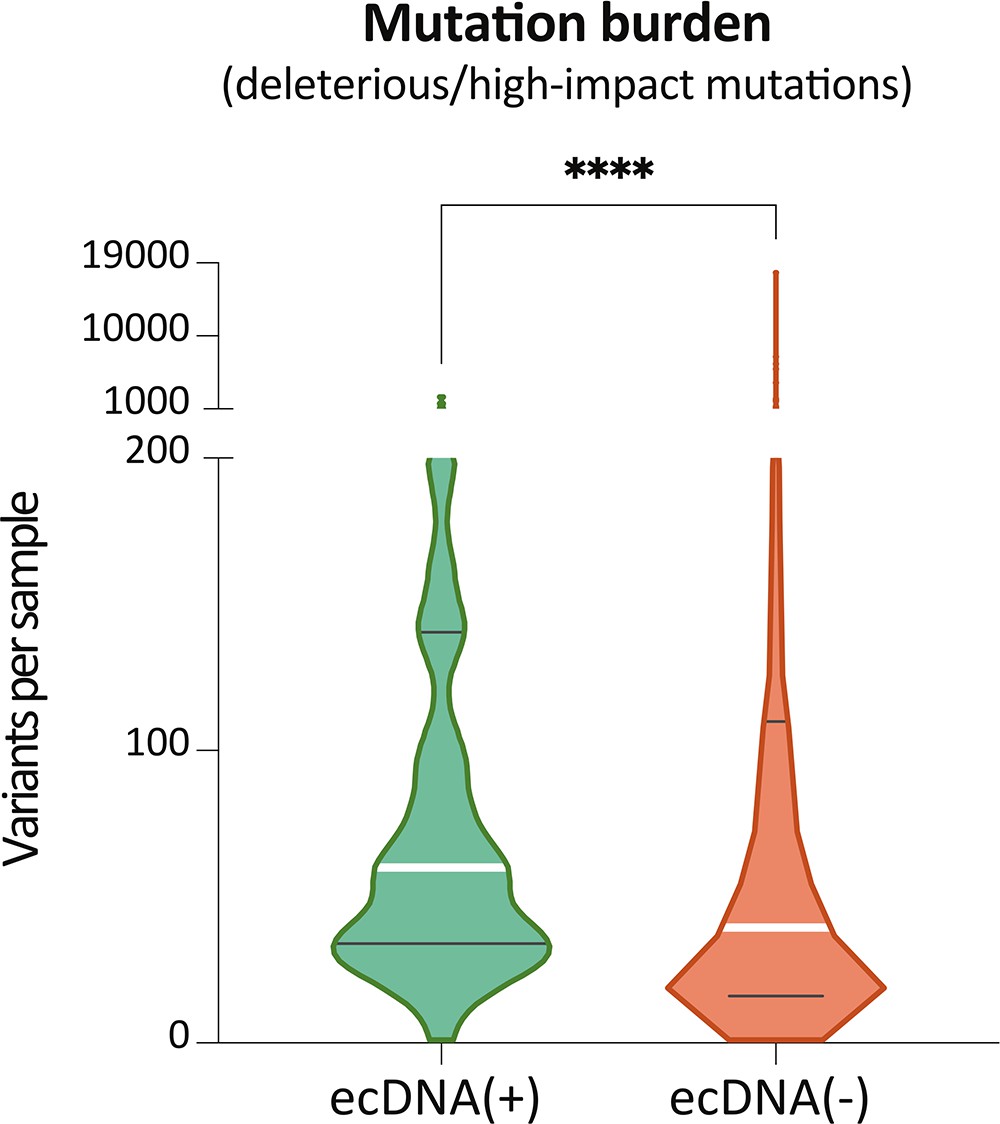
Mutation burden based on damaging mutations.
Mutation burden of ecDNA(+) and ecDNA(-) calculated only with damaging mutations (deleterious SNVs predicted with SIFT or PolyPhen2, frameshift INDELs).
Figure 5—figure supplement 2
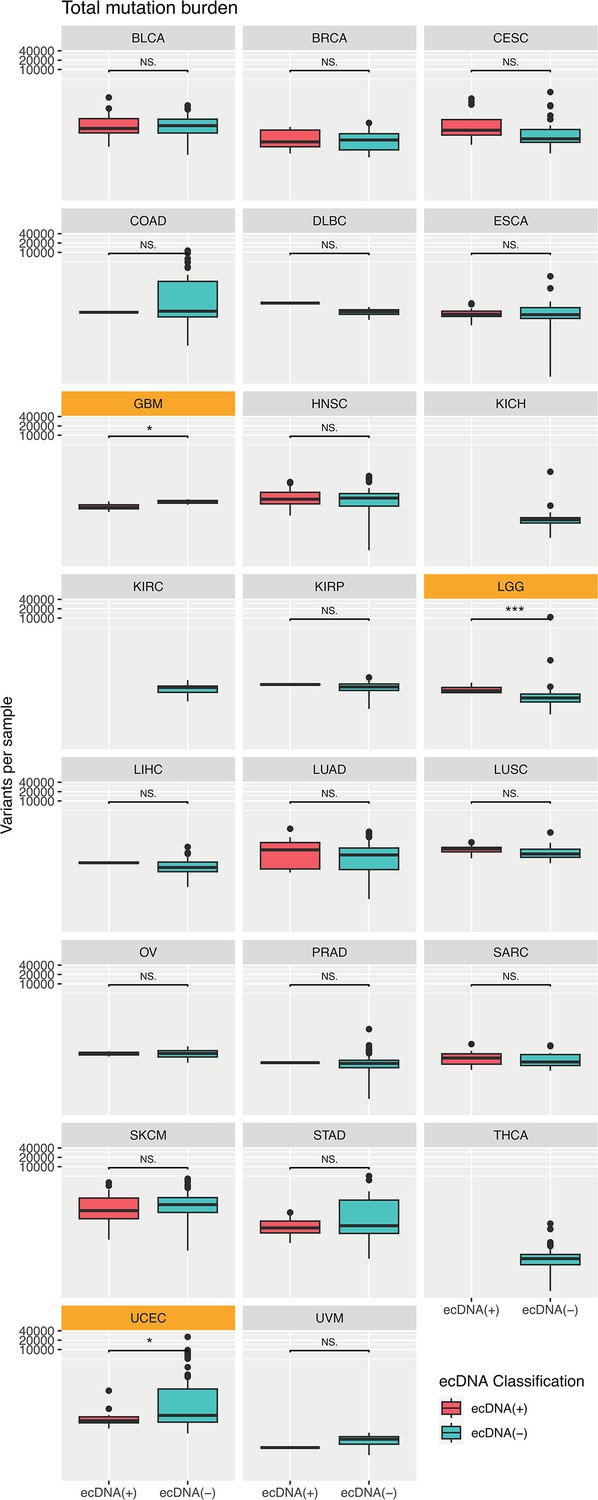
Mutation burden by tumor type.
Only mutation burdens of glioblastoma (GBM), low-grade gliomas (LGG), and uterine corpus endometrial carcinoma (UCEC) were significantly different between ecDNA(+) and ecDNA(-).
Figure 5—figure supplement 3
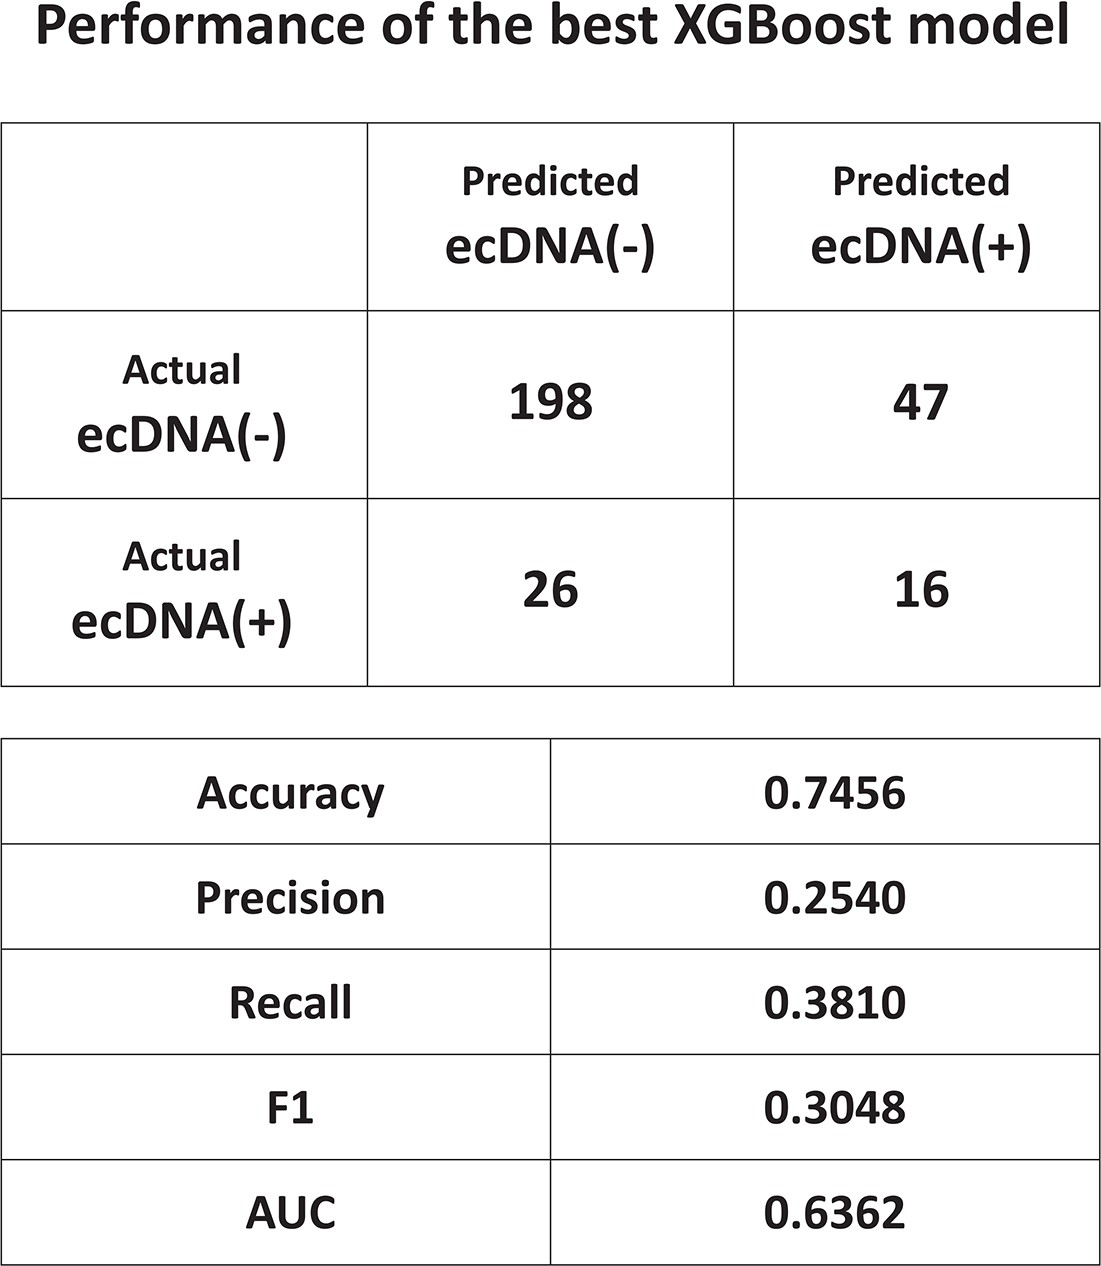
Performance of XGBoost model.
Performance evaluation of the best XGBoost model selected by HyperOpt.
Figure 5—figure supplement 4
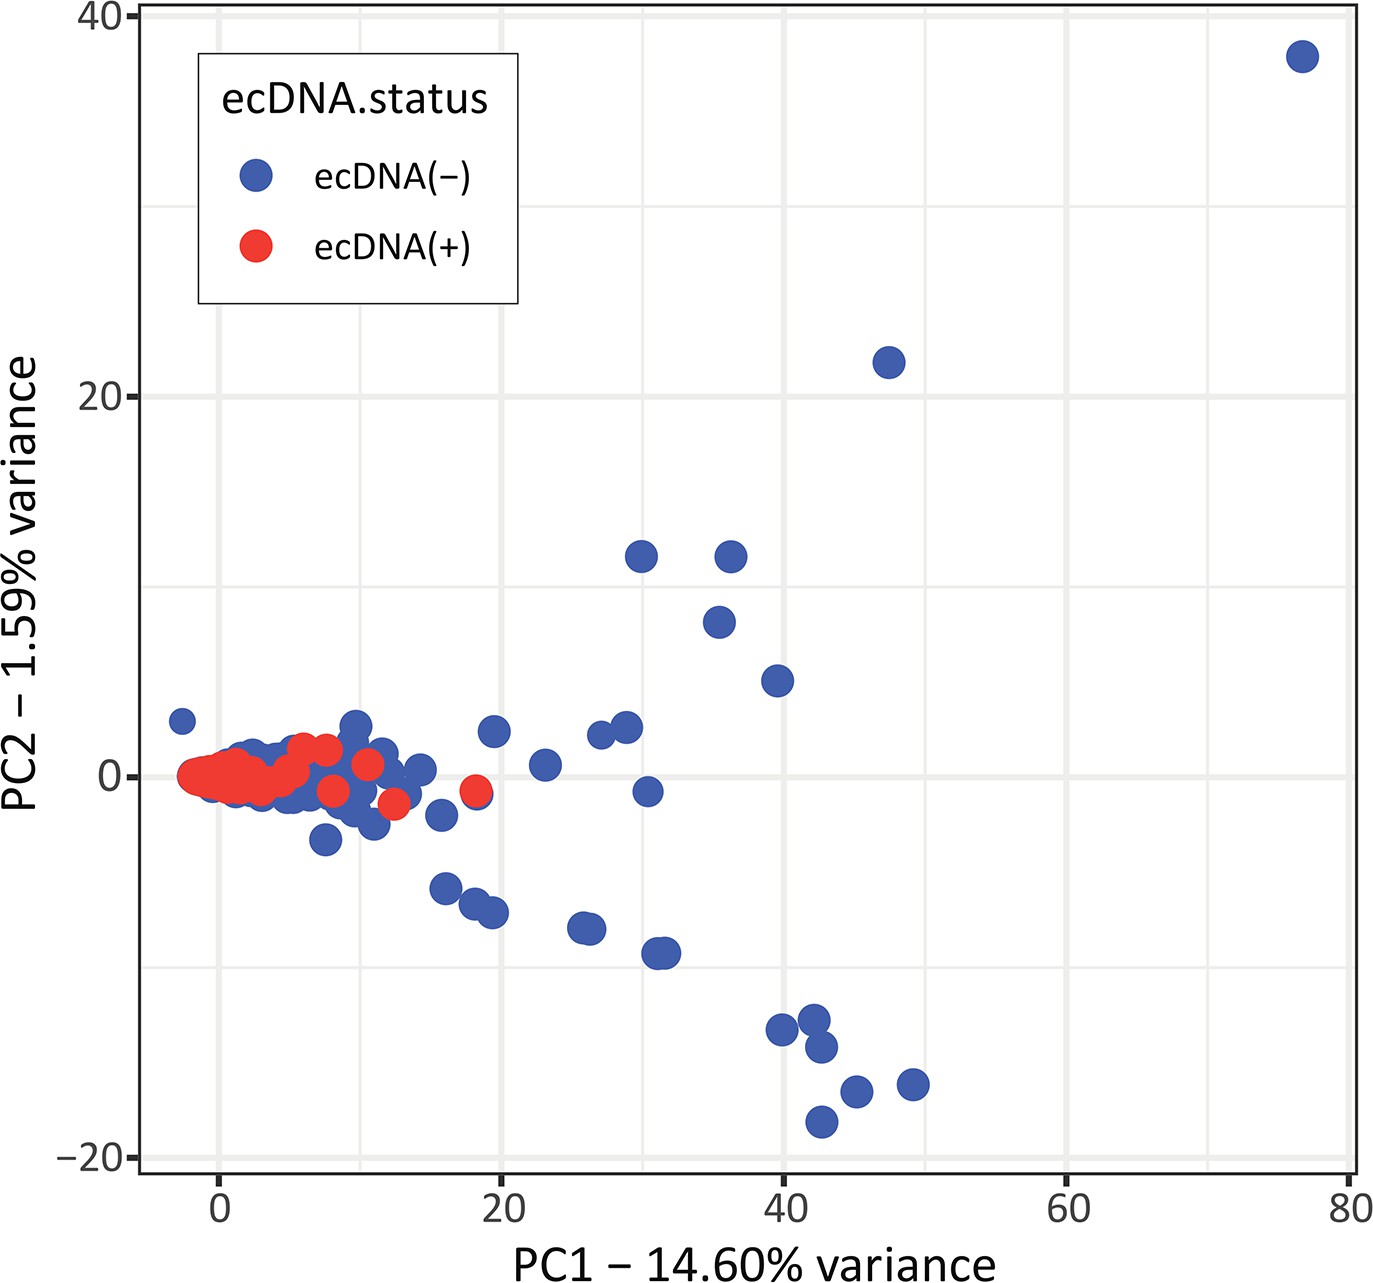
Unsupervised principal component analysis on gene mutations.
PCA result performed with a binary mutational matrix of all mutated genes.
Figure 5—figure supplement 5
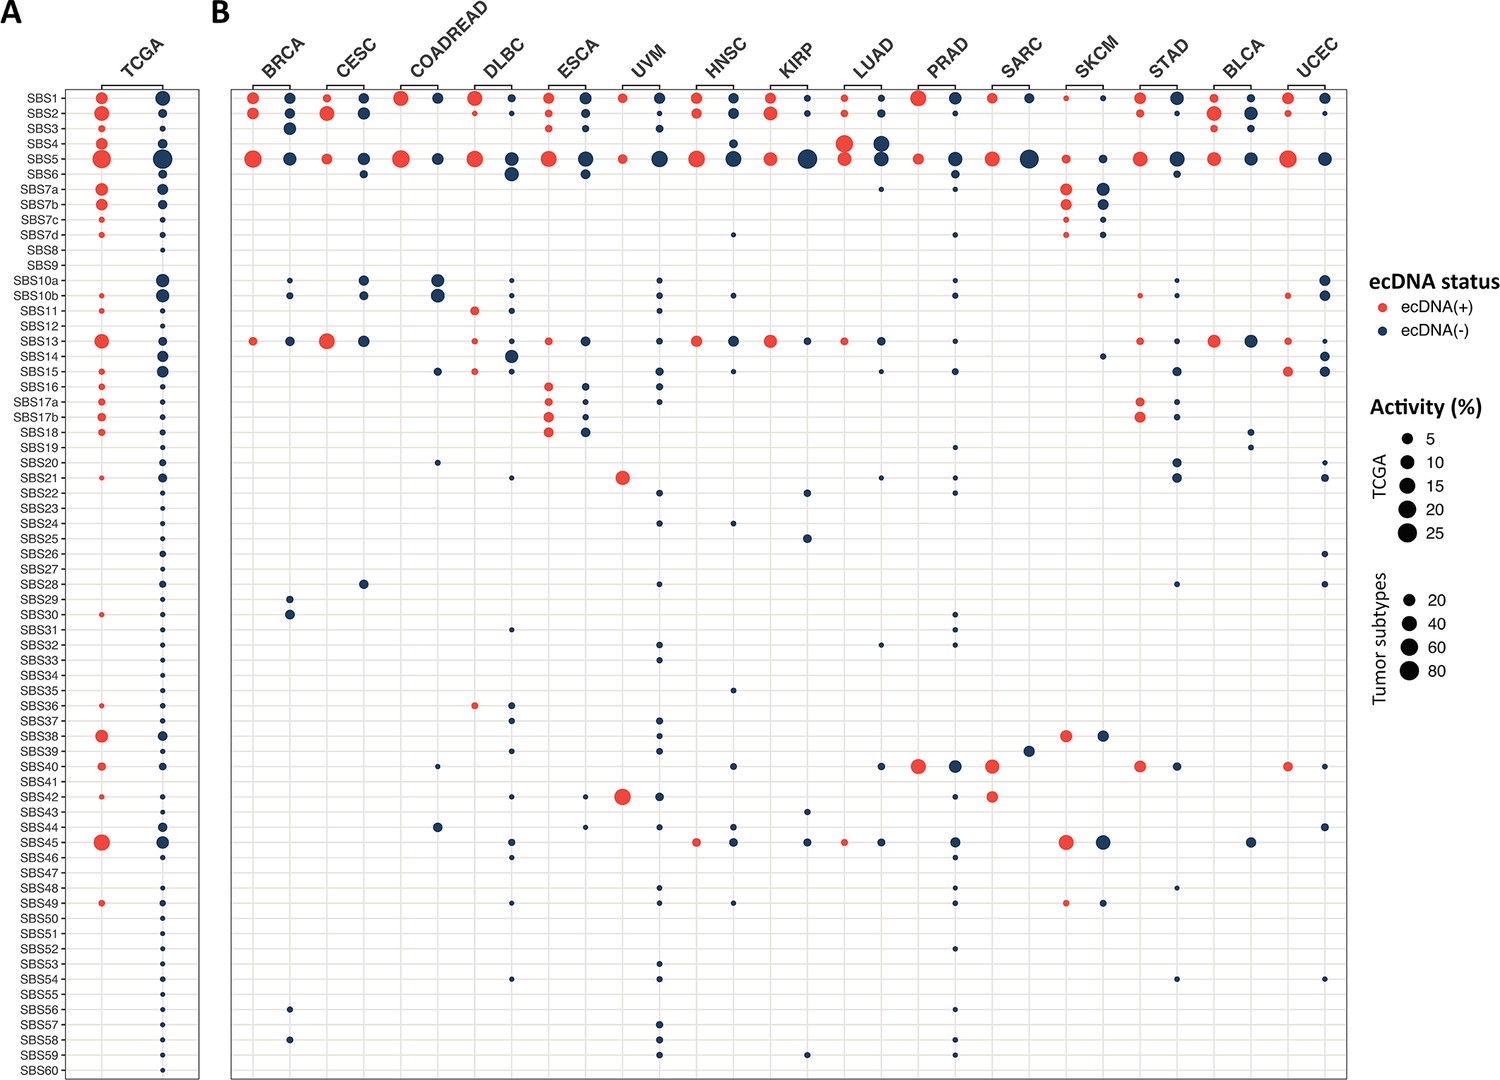
Single base substitution (SBS) signatures in The Cancer Genome Atlas (TCGA) samples by extrachromosomal DNA (ecDNA) status.
The activities of SBS signatures 1–60 in ecDNA(+) (orange) and ecDNA(-) (blue) samples (A) measured across 1440 TCGA samples and (B) separated by tumor types with at least one ecDNA(+) sample each. Activity refers to the estimated relative contribution of a specific mutational signature, and is calculated as follows: (number of variants that are attributed to a specific signature in a group)/(total number of variants in a group).
Author response image 1
Author response image 2

Author response image 3

Author response image 4
Author response image 5
Author response image 6
Author response image 7
Author response image 8
Author response image 9

Author response image 10
Author response image 11
Tables
Key resources table
| Reagent type (species) or resource | Designation | Source or reference | Identifiers | Additional information |
|---|---|---|---|---|
| Software, algorithm | Amplicon Classifier | https://github.com/jluebeck/AmpliconClassifier; Luebeck et al., 2024 | v0.4.9 | |
| Software, algorithm | Boruta | https://github.com/scikit-learn-contrib/boruta_py; Homola et al., 2024 | 6.21.2021 | Modified to allow for early termination based on stagnant tentative counts. |
| Software, algorithm | Cliff’s delta | https://github.com/neilernst/cliffsDelta: copy archived at Ernst, 2021 | ||
| Software, algorithm | DESeq2 | https://www.bioconductor.org/packages/release/bioc/html/DESeq2.html | v1.36.0 | |
| Software, algorithm | generalized linear model | glm() function in R stats package | v4.2.0 | |
| Software, algorithm | pvclust | https://github.com/shimo-lab/pvclust; Suzuki et al., 2019 | v2.2–0 | Suzuki and Shimodaira, 2006 |
| Software, algorithm | CorEx | https://github.com/miinslin/ecDNA_Gene_Expression, copy archived at Lin, 2024 |
Additional files
-
Supplementary file 1
Supplementary Tables.
(A) CorEx genes. (B) Extrachromosomal DNA (ecDNA) status of 870 The Cancer Genome Atlas (TCGA) samples across 14 tumor types. (C) Highly co-expressed gene clusters identified using multiscale bootstrap resampling. (D) Cluster #3 and #74 members. (E) Cliff’s delta values of 643 CorEx genes in TCGA samples, and in 11 tumor types with at least 10 ecDNA(+) and 10 ecDNA(-) samples each. (F) Top-|LFC| genes: 643 most significantly differentially expressed genes based on logarithmic fold changes from a DESeq2 analysis. (G) Up-/down-regulated genes in 870 TCGA samples. (H) Gene Ontology (GO) biological processes enriched in up-regulated CorEx genes. (I) Clustering of GO biological processes enriched in up-regulated CorEx genes into 11 broad categories. (J) GO biological processes enriched in Cluster #3 genes. (K) Up-regulated CorEx genes unique to biological process categories. (L) Hand-curated list of 129 genes involved in DSB repair pathways. (M) ecDNA status of 1440 TCGA samples across 24 tumor types. (N) Up-/down-regulated genes in 1,440 TCGA samples. (O) GO biological processes enriched in down-regulated CorEx genes. (P) Clustering of GO biological processes enriched in down-regulated CorEx genes into seven broad categories. (Q) Down-regulated CorEx genes in NF-κB signaling (GO:0007249) involved in pro-apoptotic caspase activation. (R) Differentially mutated genes in ecDNA(+) and ecDNA(-) samples and their odds ratios.
- https://cdn.elifesciences.org/articles/88895/elife-88895-supp1-v1.xlsx
-
MDAR checklist
- https://cdn.elifesciences.org/articles/88895/elife-88895-mdarchecklist1-v1.docx
Download links
A two-part list of links to download the article, or parts of the article, in various formats.
Downloads (link to download the article as PDF)
Open citations (links to open the citations from this article in various online reference manager services)
Cite this article (links to download the citations from this article in formats compatible with various reference manager tools)
Transcriptional immune suppression and up-regulation of double-stranded DNA damage and repair repertoires in ecDNA-containing tumors
eLife 12:RP88895.
https://doi.org/10.7554/eLife.88895.3


