Functional ultrasound imaging of stroke in awake rats
- Neuro-Electronics Research Flanders, Belgium
- Vlaams Instituut voor Biotechnologie, Belgium
- Interuniversity Microelectronics Centre, Belgium
- Department of Neurosciences, KU Leuven, Belgium
Figures
Figure 1
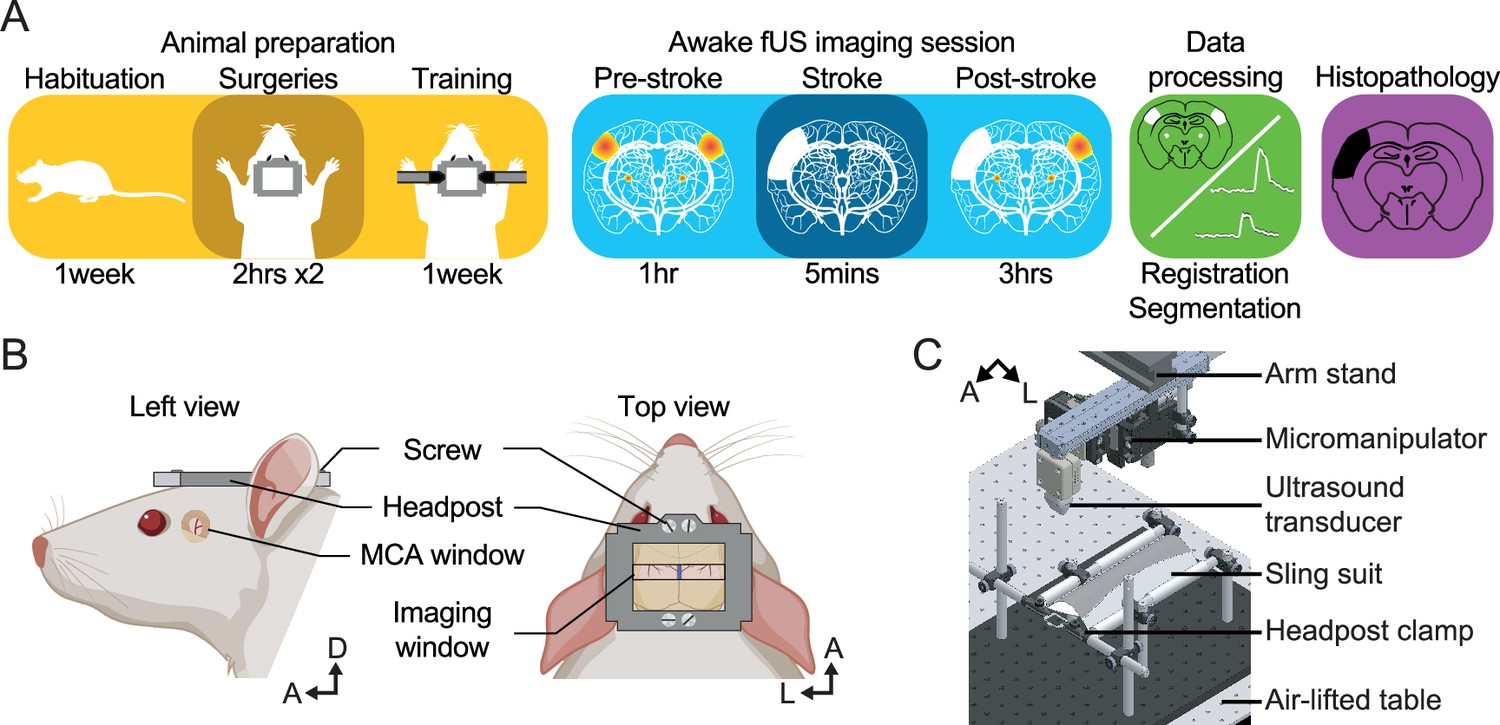
Experimental procedure.
(A) Workflow for brain imaging of awake head-fixed rats including, from left to right: animal preparation (habituation to the bench, implantation of cranial windows, training), functional ultrasound (fUS) imaging of stroke induction and brain functions, data processing, and histopathology. (B) Overview of the headpost implantation and cranial windows developed for combined MCAo (left) and brain imaging (right) under awake conditions. (C) Computer-aided design of the experimental apparatus where the animal is placed and secured in a suspended sling suit and the head fixed by the means of clamps holding the headpost implanted to the rat skull. A, Anterior; D, Dorsal; L, Left.
Figure 2 with 1 supplement
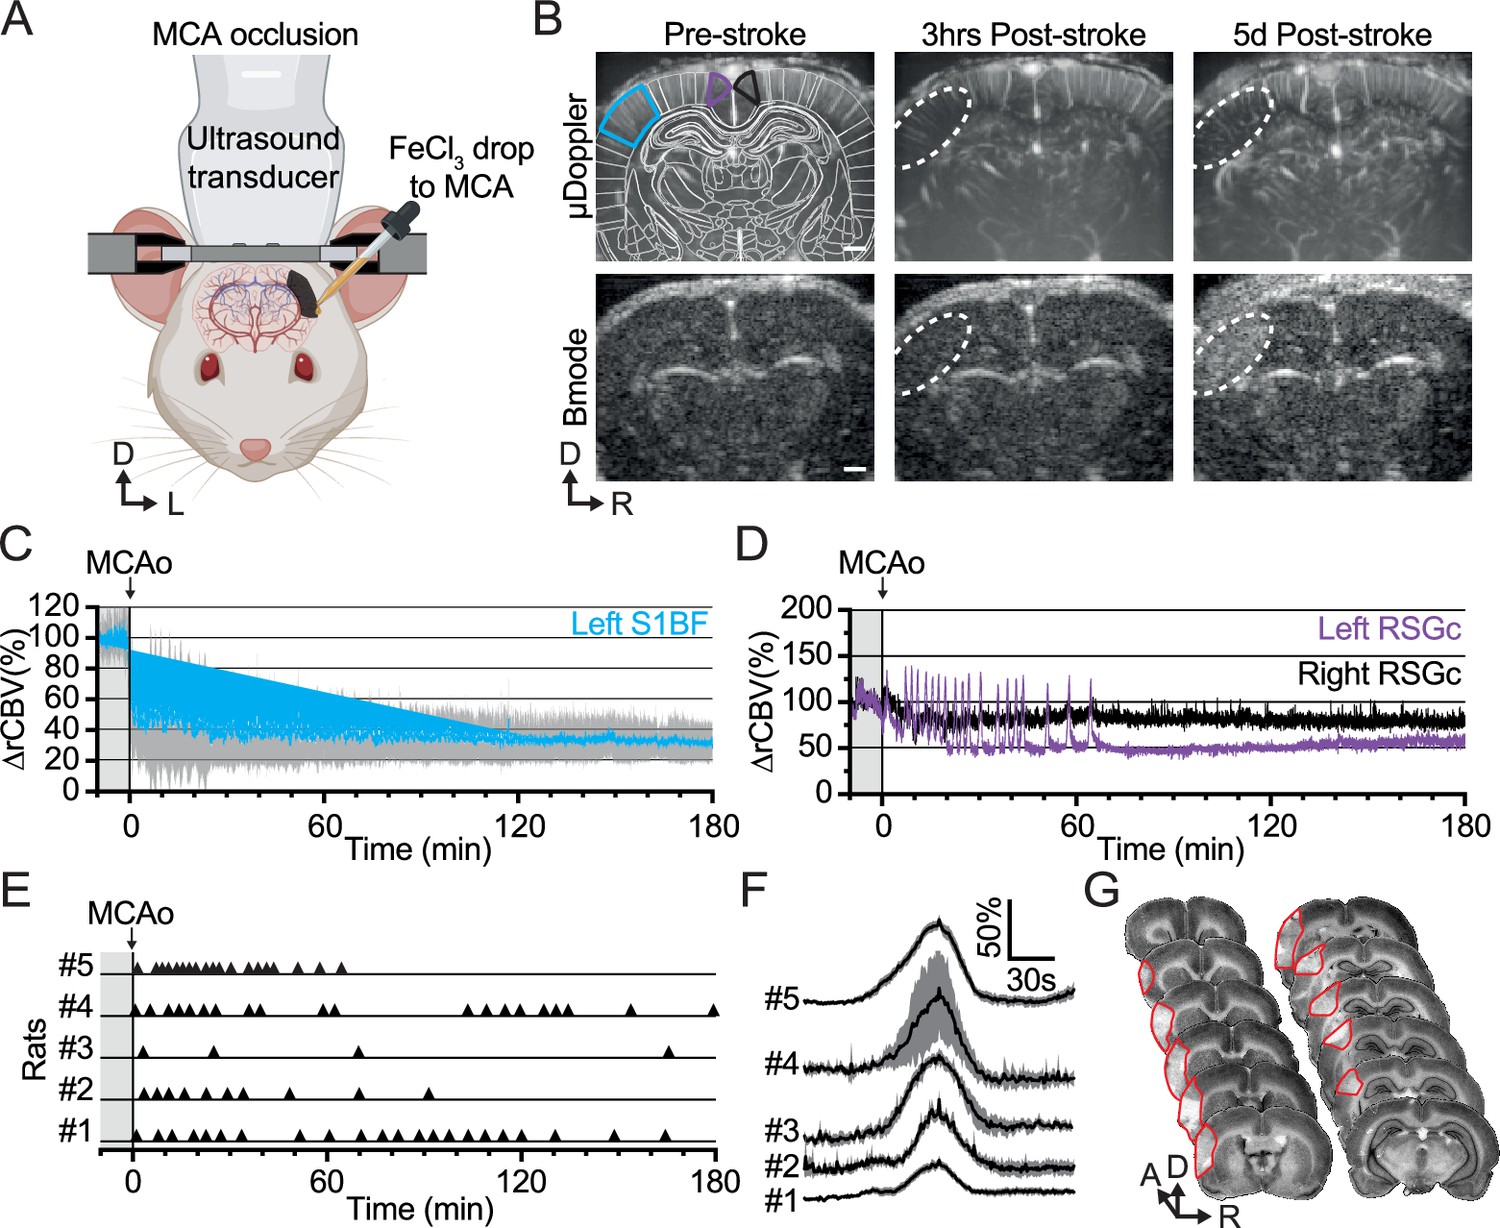
Ferric chloride (FeCl3)-stroke induction under awake conditions.
(A) Front view representation of functional ultrasound (fUS) imaging during live chemo-thrombosis of the left middle cerebral artery (MCA) with FeCl3 in awake head-fixed rats. (B) Set of typical coronal µDoppler images of the brain microvasculature (top row) and morphological Bmode images (bottom row) before stroke (left), 3 hr (middle), and 5d after stroke onset (right) from the same animal. µDoppler images (top left) were registered and segmented based on a digital version of the rat brain atlas (white outlines). Colored outlines (cyan, purple, and black) delineate regions of interest plotted in (C) and (D). The white dotted region of interest highlights the ischemia in µDoppler images (Top row) and tissue hyper-echogenicity in Bmode (Bottom row). (C) Temporal plot of the average signal (∆rCBV (%), mean ± 95% CI, n=5) in the barrel-field primary somatosensory cortex (S1BF, cyan) from the left hemisphere, affected by the MCA occlusion (MCAo). (D) Temporal plots of the average signal (∆rCBV (%)) in the retrosplenial granular cortex (RSGc) from the affected (purple) and non-affected hemisphere (black) from the same animal. (E) Occurrence of spreading depolarizations after MCAo. Each horizontal line represents one rat; each triangle marker depicts the occurrence of one spreading depolarization. (F) Temporal plots of the average signal change (∆rCBV (%), mean ± 95% CI, respectively black line and gray band) of hemodynamic events associated with spreading depolarizations (centered on the peak) for each rat (#1–5). (G) Typical rat brain cross-sections stained by cresyl violet to evaluate the tissue infarction at 24 hr after FeCl3-induction occlusion of MCA. The infarcted territory is delineated in red. Scale bars: 1 mm. D: Dorsal; L: left; R: right.
Figure 2—figure supplement 1
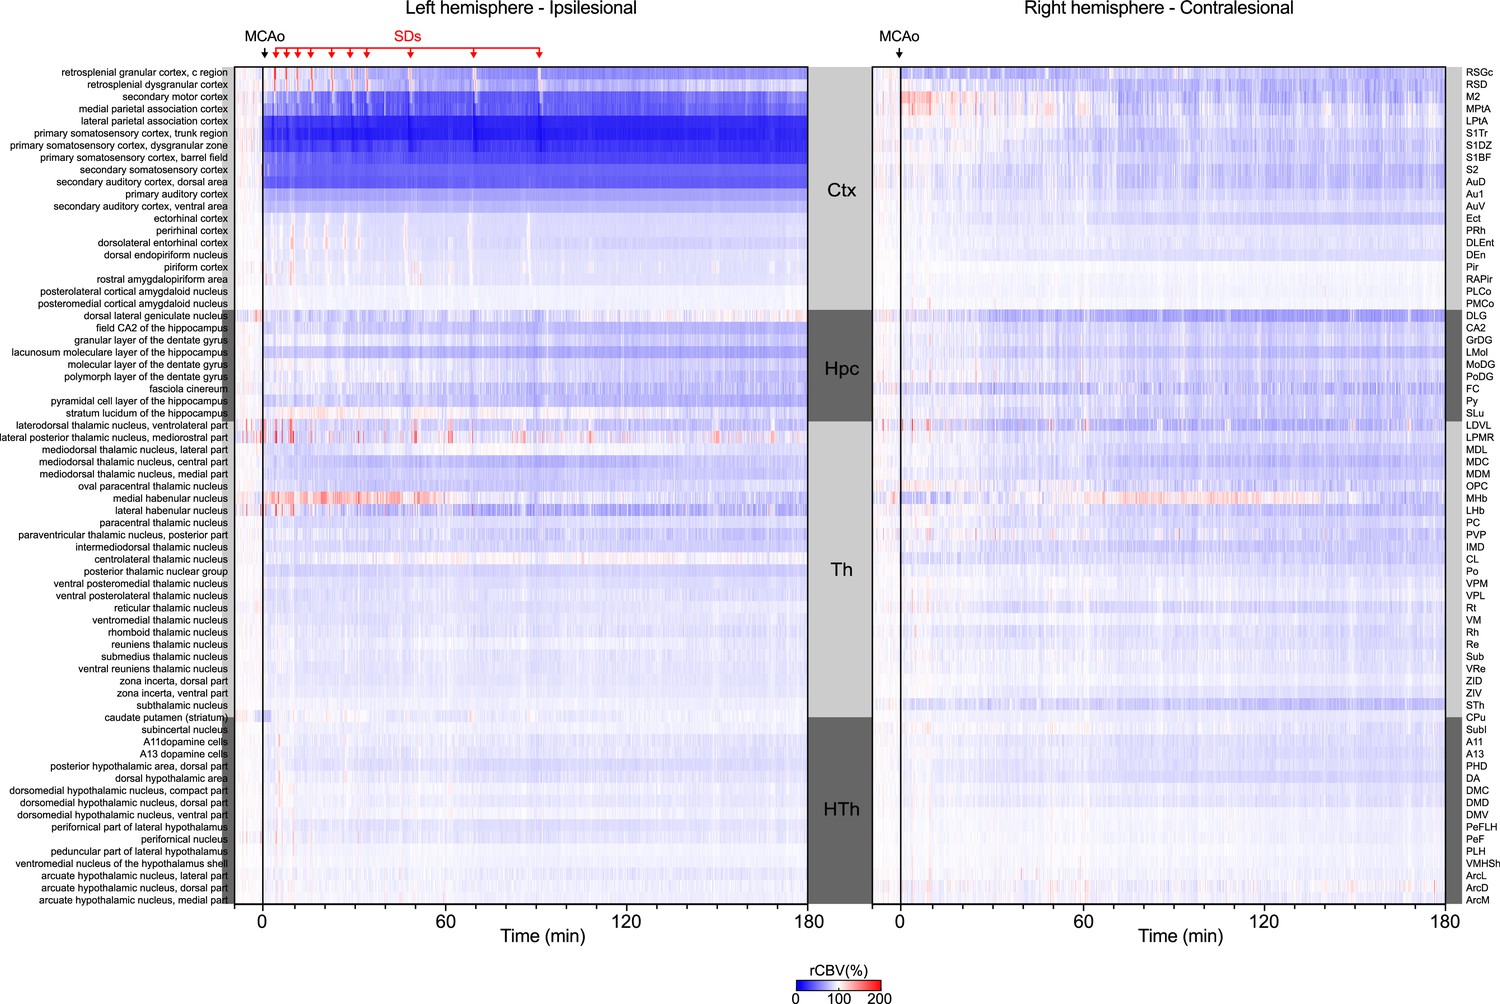
Hemodynamic changes (relative cerebral blood volume (rCBV) in %) induced by MCA occlusion (MCAo) in 69 regions located in the ipsilesional (left panel) and contralesional hemisphere (right panel) of the imaged coronal cross-section.
Regions are organized by main anatomical structures (see Supplementary file 2). SDs stands for hemodynamic events associated with spreading depolarizations.
Figure 3 with 4 supplements
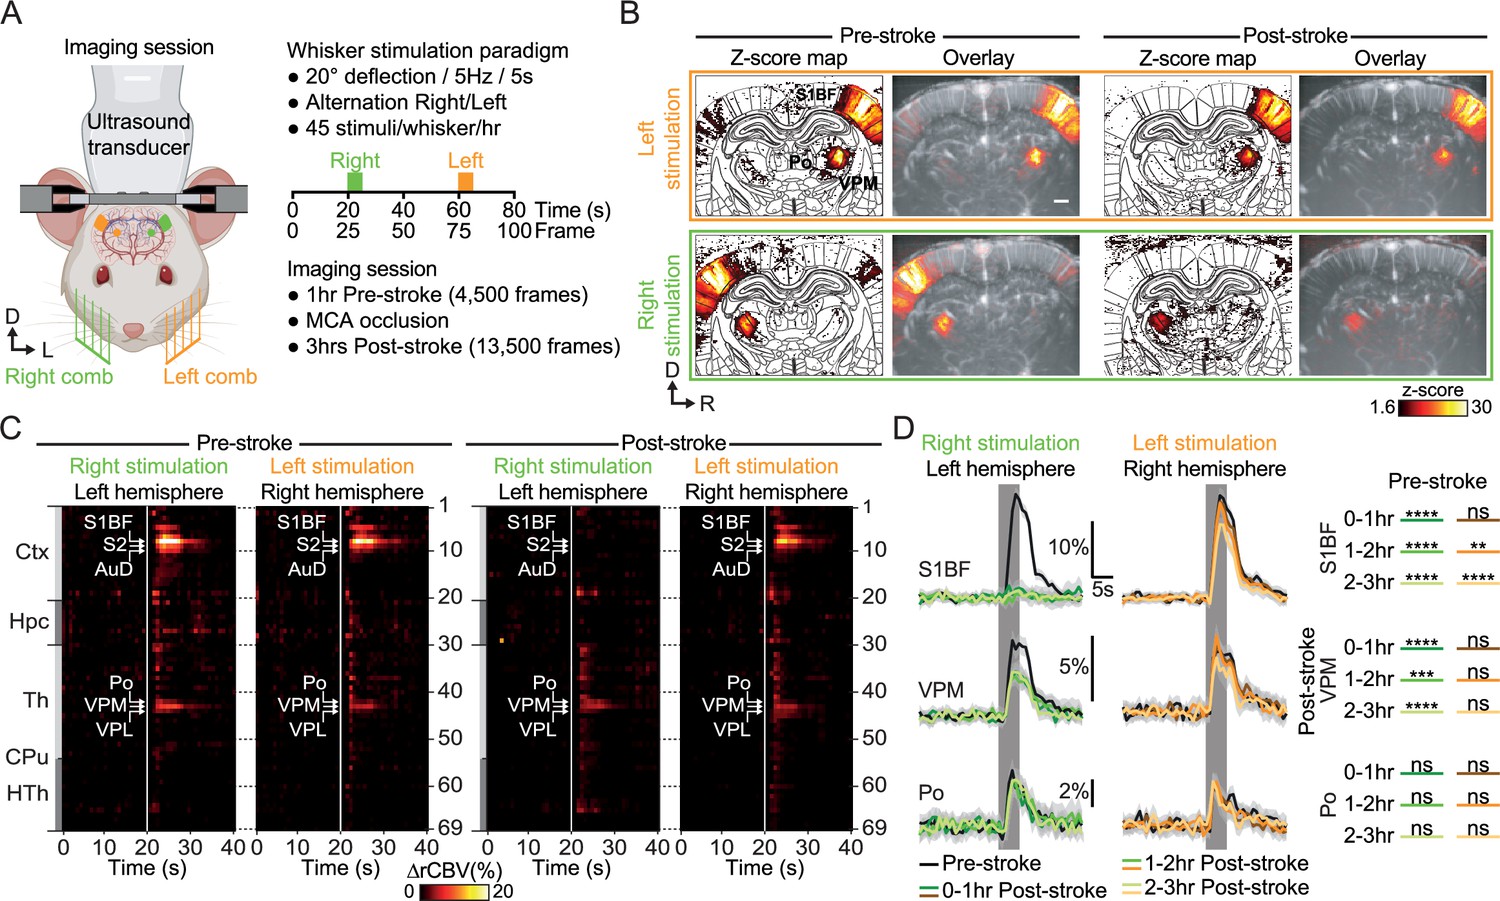
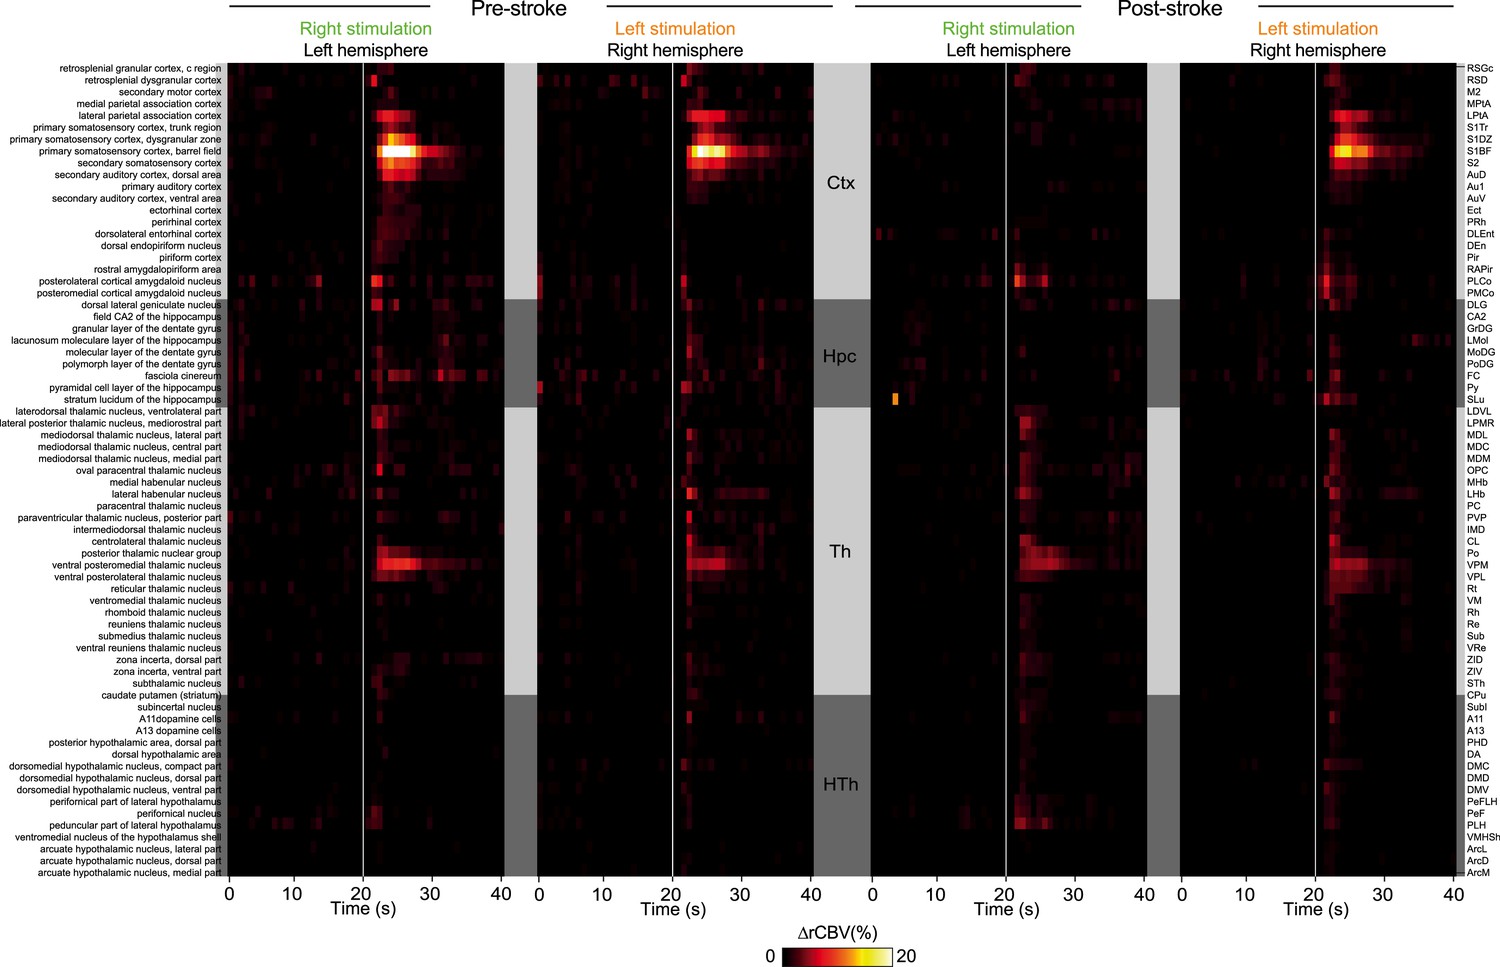
Early post-stroke alteration of whisker-to-barrel thalamocortical circuit.
(A) Front view representation of functional ultrasound (fUS) imaging during repetitive stimulation of the left (orange) or right whisker pad (green) with a mechanical comb in awake head-fixed rats. Whisker stimulations were delivered alternately between left and right whisker pads before and early after MCA occlusion (MCAo). Each rat receives 45 stimuli per whisker pad each hour of imaging. (B) Average activity maps (z-score) from one rat depicting evoked functional responses to either left (orange) or right whisker pads stimulation (green) registered with a digital version of the rat Paxinos atlas (white outlines) and overlaid with the corresponding coronal µDoppler image, before (left; Pre-stroke, average of 45 trials) and after stroke induction in the left hemisphere (right; Post-stroke, average of 125 trials). (C) Region-time traces of the average hemodynamic changes (∆rCBV (%)) in response to right (green) or left whisker stimulation (orange) extracted from the contralateral hemisphere (left and right, respectively) before (left; Pre-stroke, n=5, 45 trials/rat) and after stroke induction in the left hemisphere (right; Post-stroke, n=5, 135 trials/rat). Brain regions are ordered by major anatomical structures (see Supplementary file 2). The vertical line represents the stimulus start. S1BF, S2, AuD, VPM, VPL, and Po regions are brain regions significantly activated (all pvalue <0.01; GLM followed by t-test). A larger version of panel C is provided in Figure 3—figure supplement 2. (D) Left, Average response curves from the S1BF, the VPM, and Po regions before (Pre-stroke, black, n=5, 45 trials/rat), and from first to third hour after stroke induction (0–1 hr, 1–2 hr, 2–3 hr Post-stroke, orange and green, n=5, 45 trials/hr/rat). Data are mean ± 95% CI. The vertical bar represents the whisker stimulus. Right, Statistical comparison of the area under the curve (AUC) between pre-stroke and post-stroke response curves for S1BF, VPM, and Po regions (Non-parametric Kruskal-Wallis test corrected with Dunn’s test for multiple comparisons; ns: non-significant; *p<0.05; **p<0.01; ***p<0.001; ****p<0.0001. See also Figure 3—figure supplement 3). Scale bars: 1 mm. D: Dorsal; L: left; R: right; Ctx: Cortex; Hpc: Hippocampus; Th: Thalamus; CPu: Caudate Putamen; HTh: Hypothalamus; S1BF: barrel-field primary somatosensory cortex; S2: Secondary somatosensory cortex; AuD: Dorsal auditory cortex; VPM: Ventral posteromedial nucleus of the thalamus; VPL: Ventral postero-lateral nucleus of the thalamus; Po: Posterior nucleus of the thalamus.
Figure 3—figure supplement 1
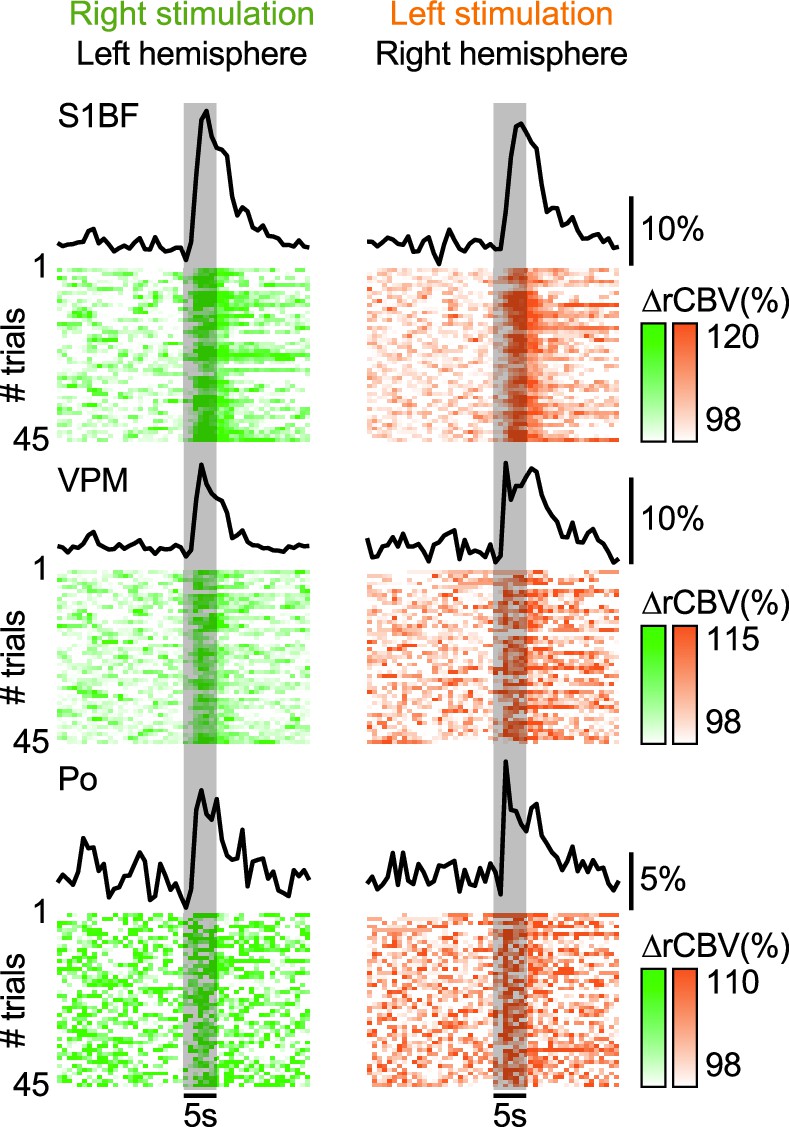
Averaged hemodynamic response curves (∆rCBV in %) of 45 consecutive right (green) or left whisker stimulation (orange; 1 hr recording) extracted in the contralateral S1BF, VPM, and Po regions (top to bottom).
The corresponding individual trials presented below confirmed the stability across the recording. Vertical gray bar, the period of whisker stimulation.
Figure 3—figure supplement 2
Close-up view of Figure 3C.
Figure 3—figure supplement 3
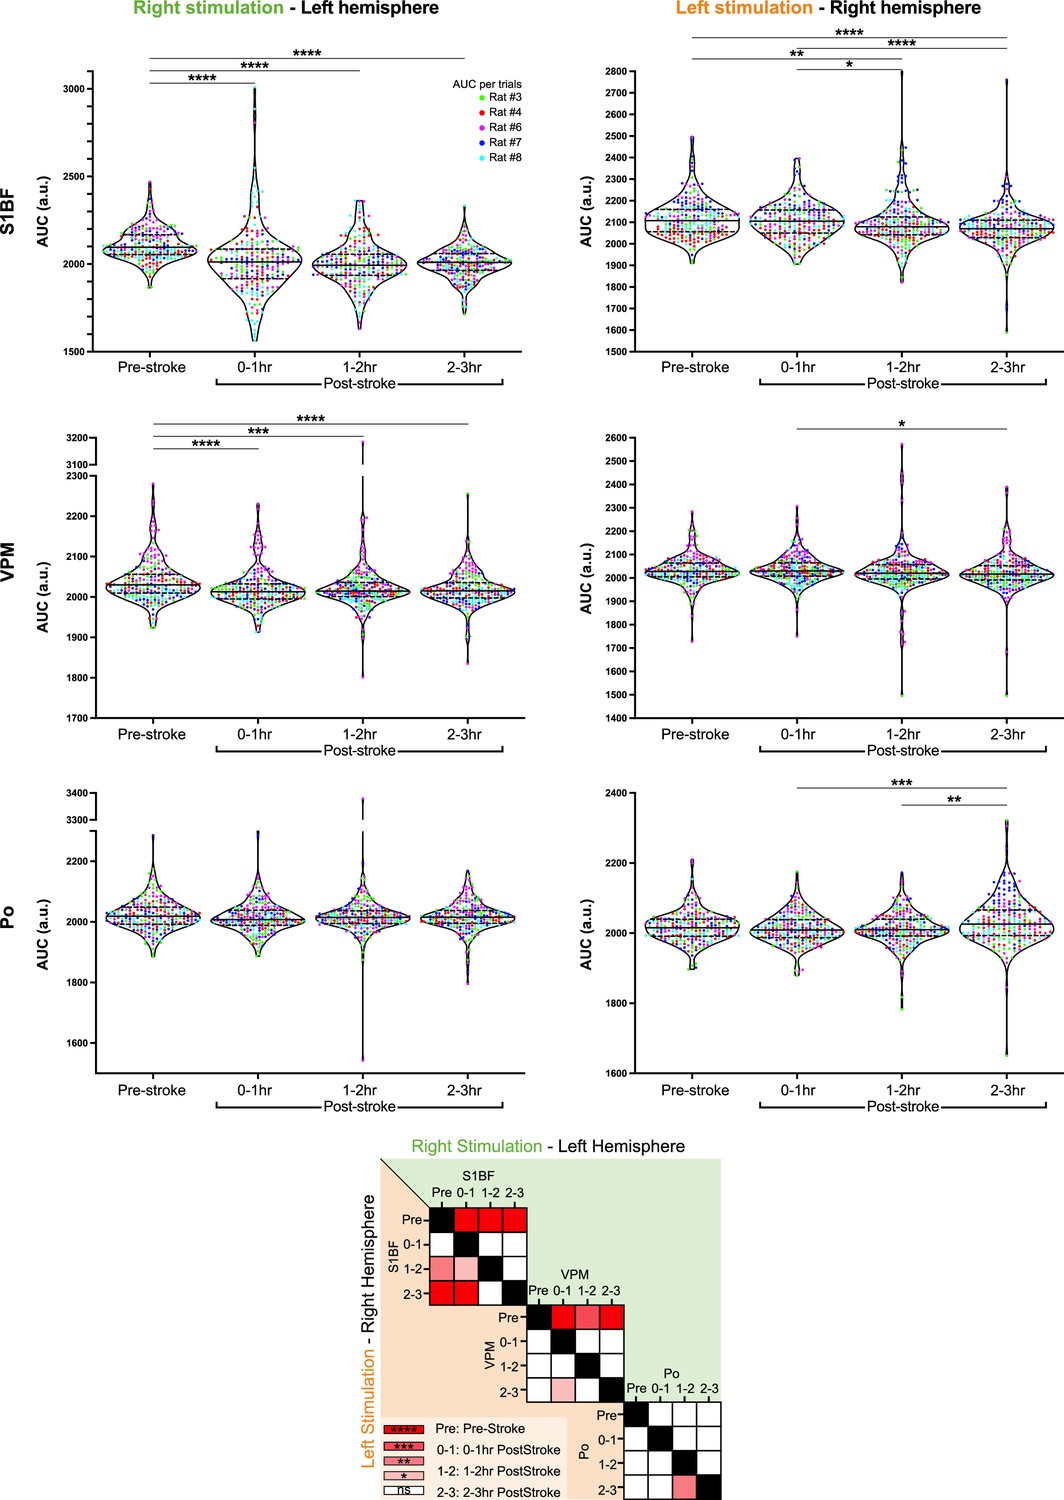
Top Panel – Violin plots showing the distribution of the area under the curve (AUC) extracted from hemodynamic response time-courses of individual trials in S1BF (top row), VPM (middle row), and Po regions (bottom row), for stimulation delivered either to the right (left column) or left whisker pad (right column) along all the periods of the recording (Pre-Stroke, 0–1 hr Post-stroke, 1–2 hr Post-Stroke, 2–3 hr Post-Stroke).
Each dot represents an individual trial, each color depicts a rat.
Bottom Panel – Matrix comparing AUC from S1BF, VPM, and Po for right (green - top right diagonal) or left stimulation (orange - bottom left diagonal) at Pre-Stroke, 0–1 hr Post-stroke, 1–2 hr Post-Stroke, and 2–3 hr Post-Stroke timepoints. AUC were compared and analyzed using a non-parametric Kruskal-Wallis test corrected for multiple comparison using a Dunn’s test.
Figure 3—figure supplement 4
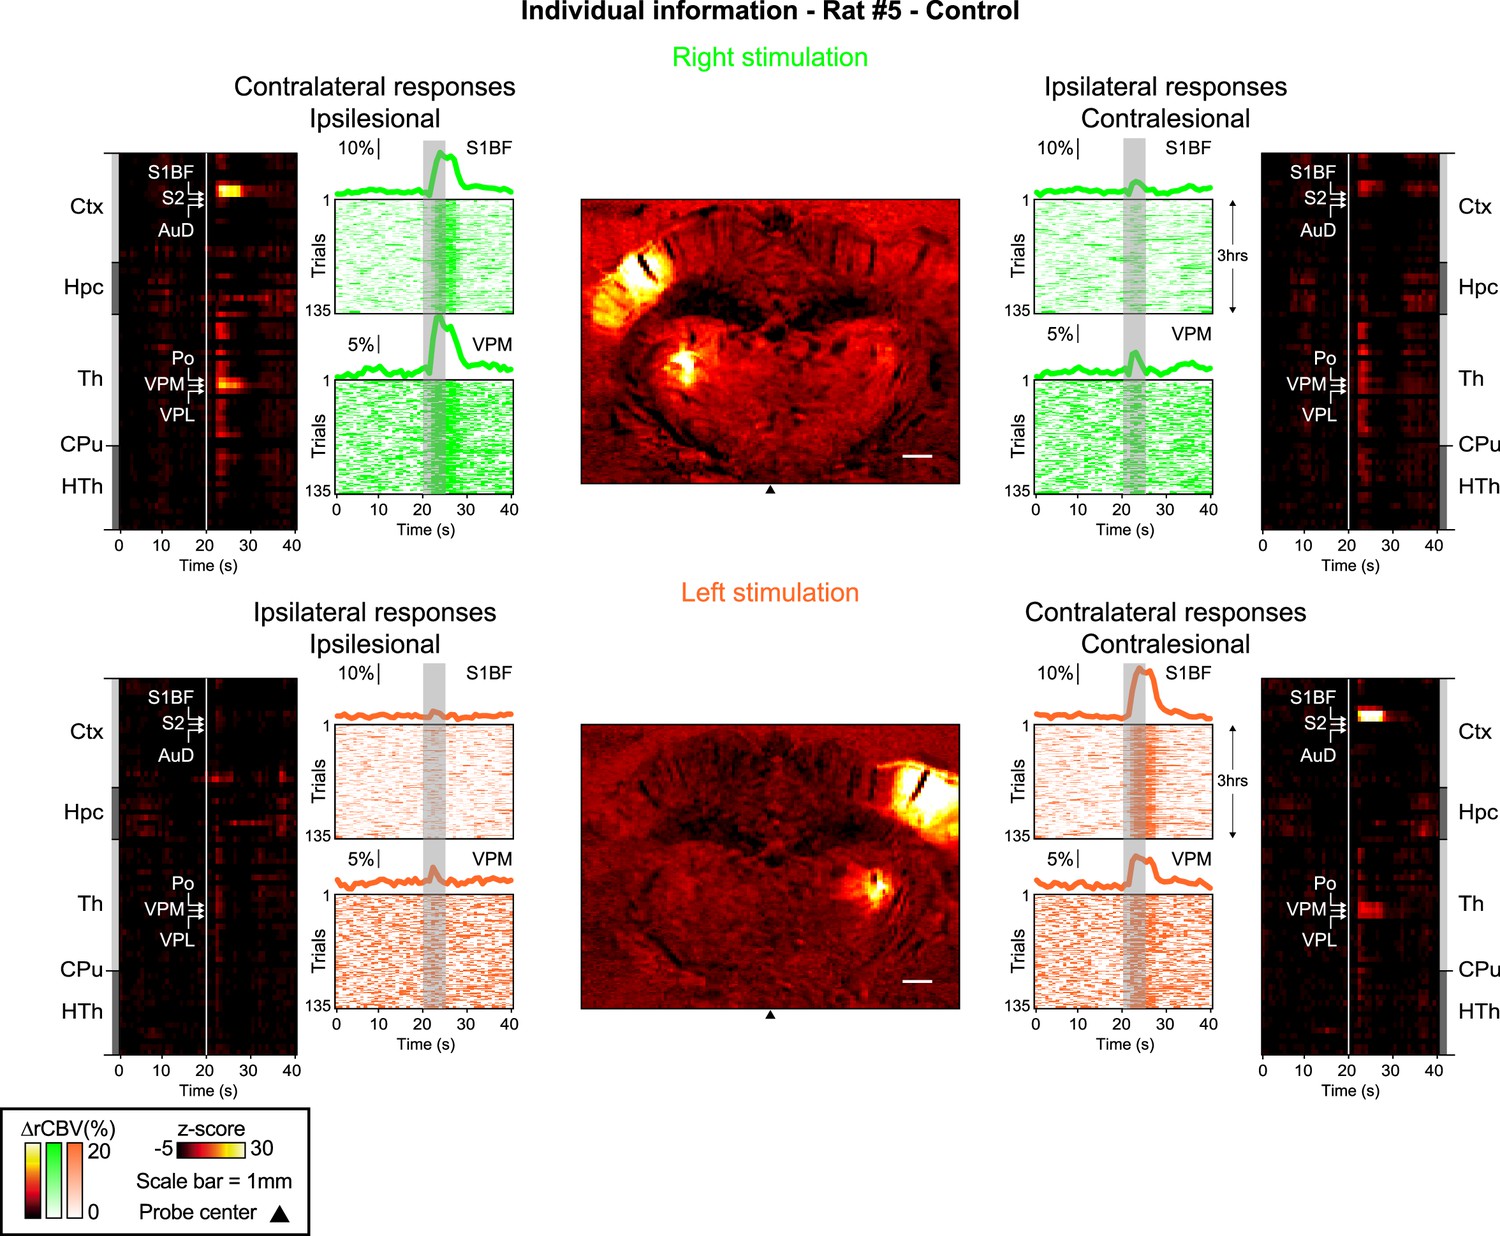
Activity maps, region-time traces of the 69 brain regions imaged, mean and individual time-courses for all trials (left and right stimuli - including contra- and ipsilateral traces) and imaging timepoints (Control, Pre-Stroke, Post-Stroke) for all the rats included in this work.
Figure 4
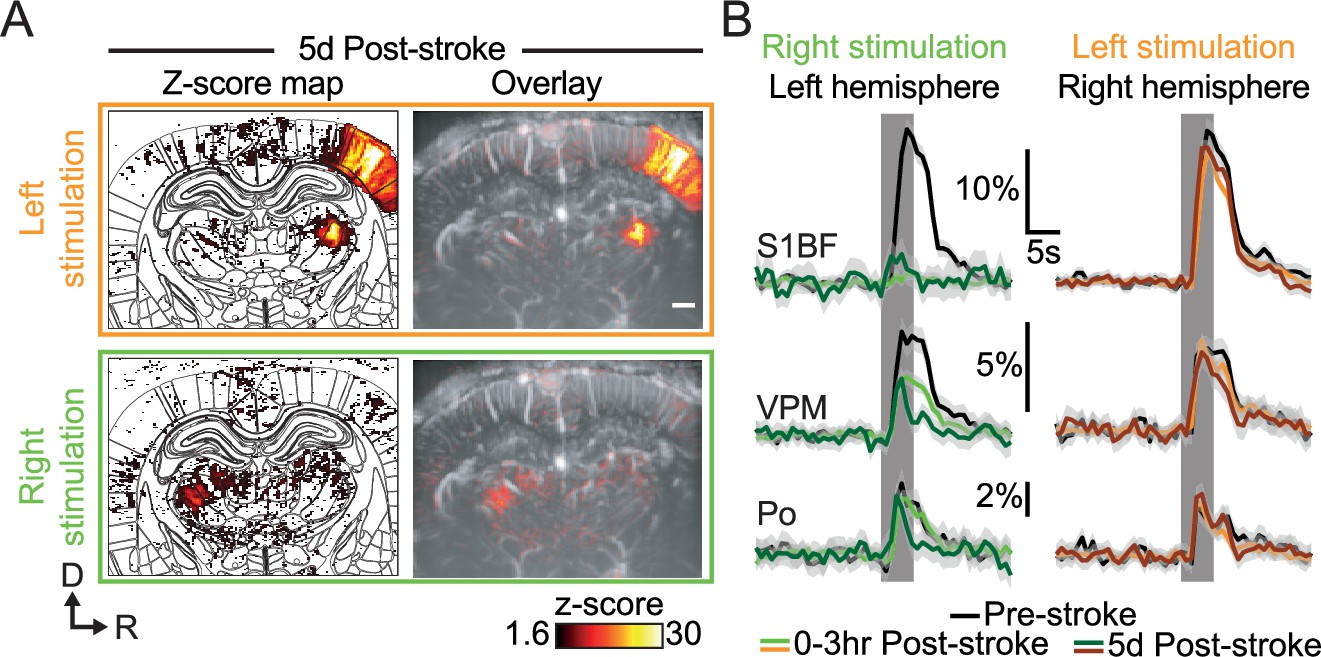
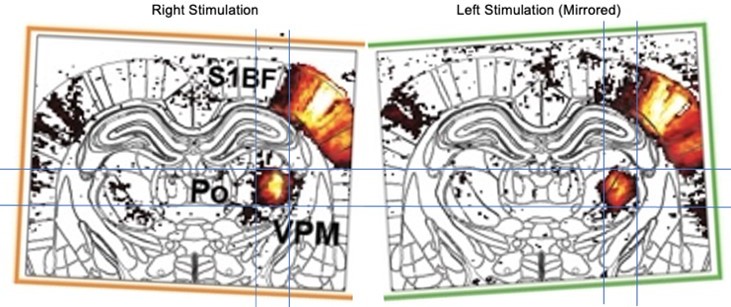
Late post-stroke alteration of whisker-to-barrel thalamocortical circuit.
(A) Activity maps (z-score; average of 45 trials) depicting evoked functional responses to left (orange) or right whisker pads stimulation (green) 5d after stroke induction. Z-score maps are registered with the Paxinos atlas (white outlines; Left) and overlaid with the corresponding coronal µDoppler image (Right). (B) Left; Average response curves to left and right whisker stimulation (orange and green; respectively) extracted from S1BF, VPM, and Po before (Pre-stroke, black, n=2, 45 trials/rat), 0–3 hr (0–3 hr Post-Stroke; light orange/green, n=2, 45 trials/hr/rat) and 5d after stroke induction (5d Post-stroke, dark orange/green, n=2, 45 trials/rat). Data are mean ± 95% CI. The vertical bar represents the whisker stimulus. Scale bars: 1 mm. D: Dorsal; R: right; S1BF: barrel-field primary somatosensory cortex; VPM: Ventral posteromedial nucleus of the thalamus; Po: Posterior nucleus of the thalamus.
Author response image 1
Videos
Video 1
Movie of hemodynamic changes induced by middle cerebral artery (MCA) occlusion using ferric chloride (FeCl3) in awake head-fixed rats.
Raw images.
Video 2
Movie of thalamocortical functional responses to left and right whisker stimulation before and 3 hr after stroke onset.
Tables
Author response table 1
Comparing with the sequences used in references 26 and 28, we have the following timing parameters.
| Sequence | Frequency (Hz) | N Compound | Acquisition time (s) | Pause (s) | Frame rate (Hz) | |
|---|---|---|---|---|---|---|
| Macé et al., | High sensibility | 500 | 200 | 0.4 | 0.2 | 1.7 |
| Neuron, 2018 | High speed | 500 | 50 | 0.1 | 0.1 | 10 |
| Brunner et al., | High sensibility | 500 | 250 | 0.5 | 0 | 2 |
| Nat Prot, 2021 | High speed | 500 | 50 | 0.1 | 0 | 10 |
| This study | 500 | 250 | 0.5 | 0.3 | 1.25 |
Additional files
-
Supplementary file 1
Reporting on animal use, experimentation, exclusion criteria, and figure association.
- https://cdn.elifesciences.org/articles/88919/elife-88919-supp1-v1.xlsx
-
Supplementary file 2
List of the 69 brain regions/hemispheres from the coronal cross-section µDoppler imaged in each rat organized by main anatomical structures.
Adapted from the Paxinos rat brain atlas (Paxinos, 2014).
- https://cdn.elifesciences.org/articles/88919/elife-88919-supp2-v1.xlsx
-
MDAR checklist
- https://cdn.elifesciences.org/articles/88919/elife-88919-mdarchecklist1-v1.docx
Download links
A two-part list of links to download the article, or parts of the article, in various formats.
Downloads (link to download the article as PDF)
Open citations (links to open the citations from this article in various online reference manager services)
Cite this article (links to download the citations from this article in formats compatible with various reference manager tools)
Functional ultrasound imaging of stroke in awake rats
eLife 12:RP88919.
https://doi.org/10.7554/eLife.88919.3


