Glycan-shielded homodimer structure and dynamical features of the canine distemper virus hemagglutinin relevant for viral entry and efficient vaccination
- Laboratory of Biomolecular Science and Center for Research and Education on Drug Discovery, Faculty of Pharmaceutical Sciences, Hokkaido University, Japan
- Division of Pathogen Structure, Research Center for Zoonosis Control, Hokkaido University, Japan
- Medical Institute of Bioregulation, Kyushu University, Japan
- Department of Virology, Faculty of Medicine, Kyushu University, Japan
- Institute for Enzyme Research, University of Tokushima, Japan
- Department of Microbiology, Graduate School of Medicine and Faculty of Medicine, The University of Tokyo, Japan
- Global Station for Biosurfaces and Drug Discovery, Hokkaido University, Japan
- Institute for Vaccine Research and Development (HU-IVReD), Hokkaido University, Japan
- Core Research for Evolutional Science and Technology, Japan Science and Technology Agency, Japan
Figures
Figure 1 with 1 supplement
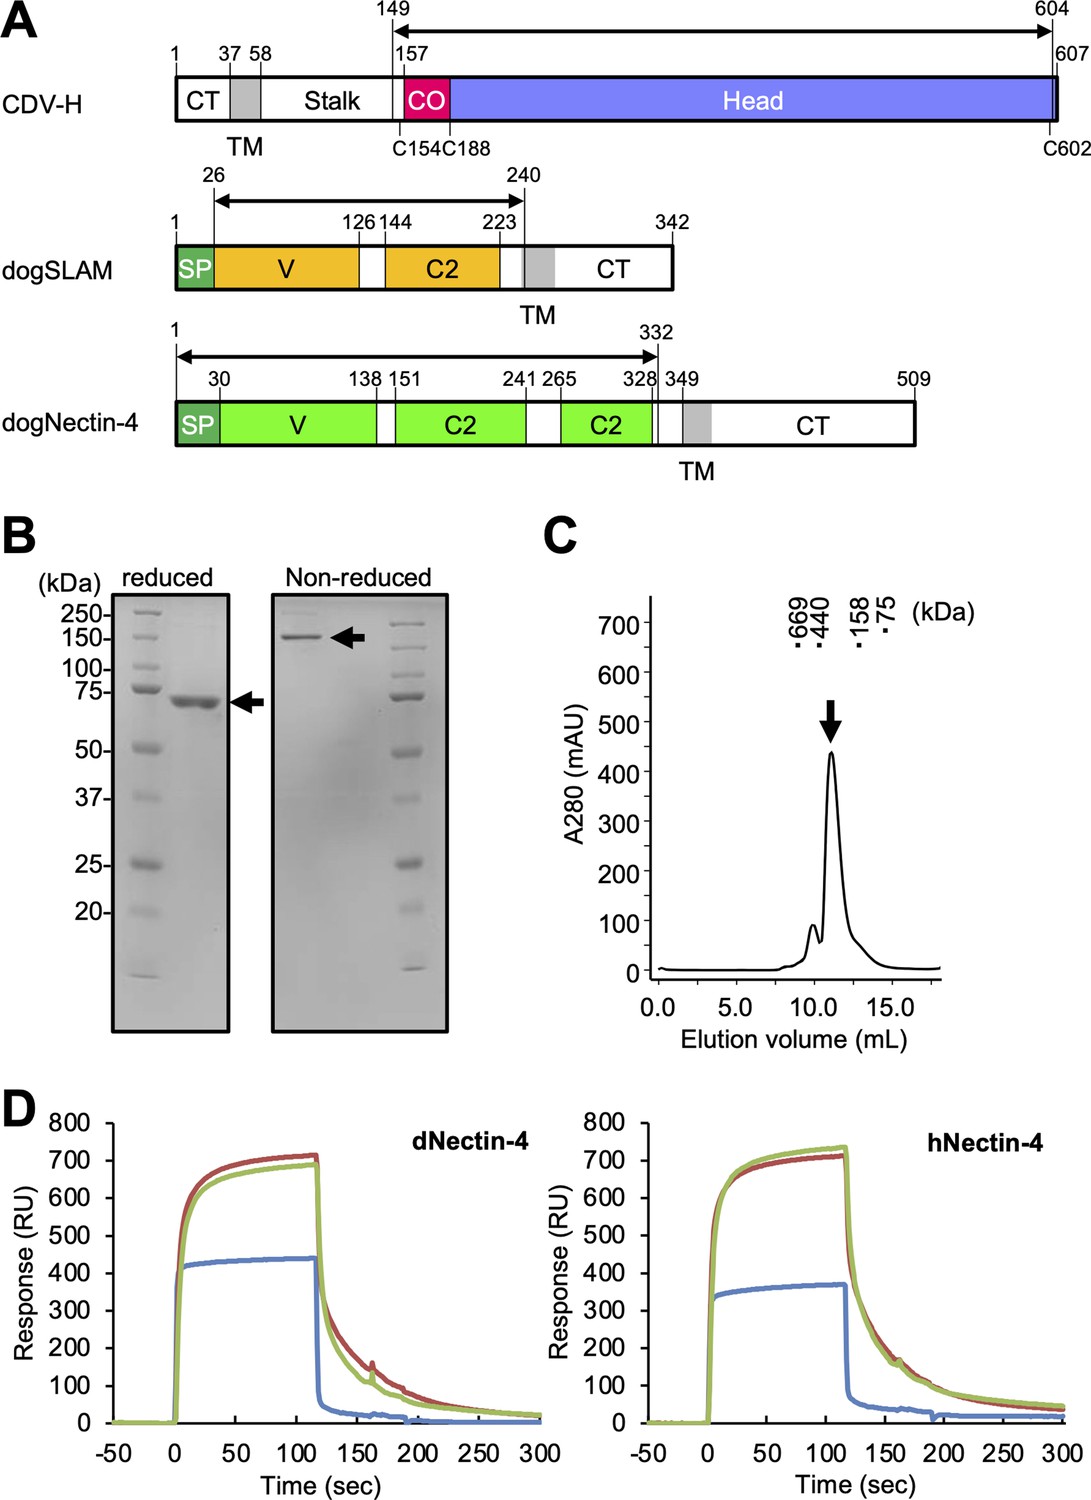
Protein preparation and Nectin-4 binding to CDV-H.
(A) Schematic images for expression region of CDV-H globular domain (top), dog signaling lymphocyte activation molecule (SLAM) ectodomain (middle), and dog Nectin-4 (bottom). CT, cytoplasmic tail; TM, transmembrane; CO, connector region; SP, signal peptide. (B) Sodium dodecyl sulfate–polyacrylamide gel electrophoresis (SDS–PAGE) for CDV-H protein in reducing (left) and non-reducing (right) conditions. The arrows indicate monomer (left) and disulfide-linked dimer (right) of CDV-H. (C) Gel filtration chromatogram of CDV-H using Superdex 200 column. The arrow indicates the peak of CDV-H (Ve = v12.2 ml). (D) Surface plasmon resonance analysis for the interactions between CDV-H and Nectin-4 receptors: dog (left) and human (right) Nectin-4. The green, red, and blue lines indicate CDV-Hwt, CDV-Hvac, and β2 microglobulin as a negative control, respectively.
Figure 1—figure supplement 1
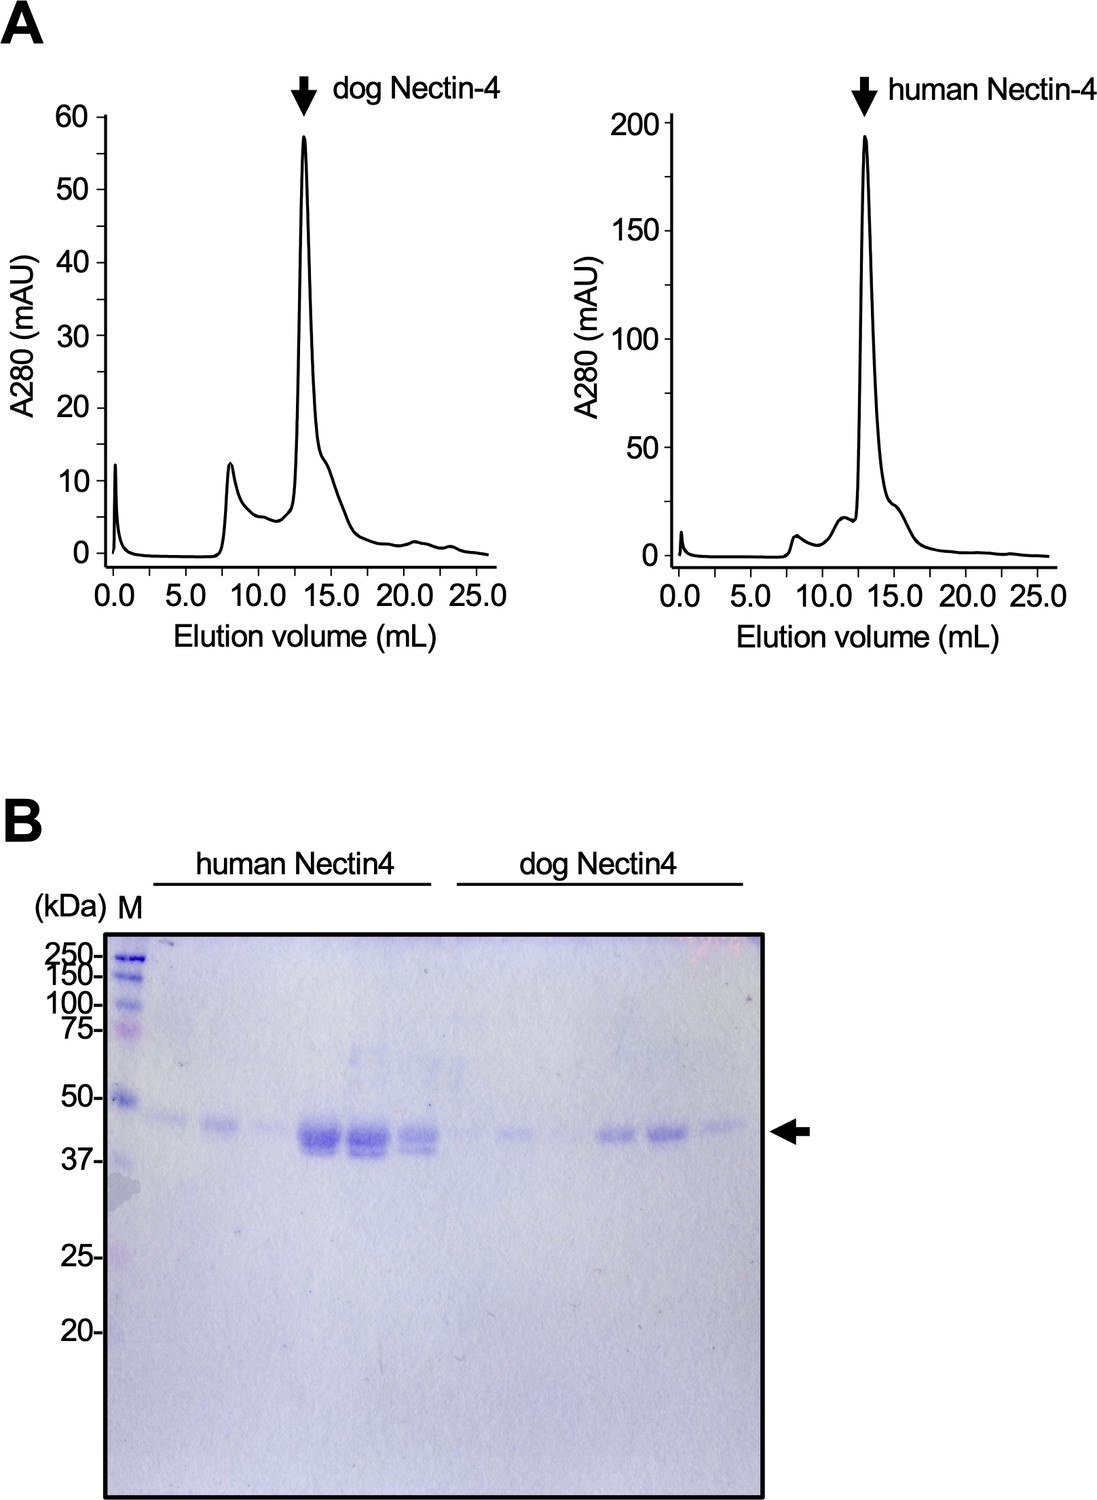
Purification of dog and human soluble Nectin-4.
(A) Gel filtration chromatogram of dog (left) and human (right) Nectin-4 using Superdex 200 column. The arrow indicates the peak of each Nectin-4. (B) Sodium dodecyl sulfate–polyacrylamide gel electrophoresis (SDS–PAGE) for human and dog Nectin-4 in reducing conditions. The arrow indicates the band of each Nectin-4.
Figure 2 with 1 supplement
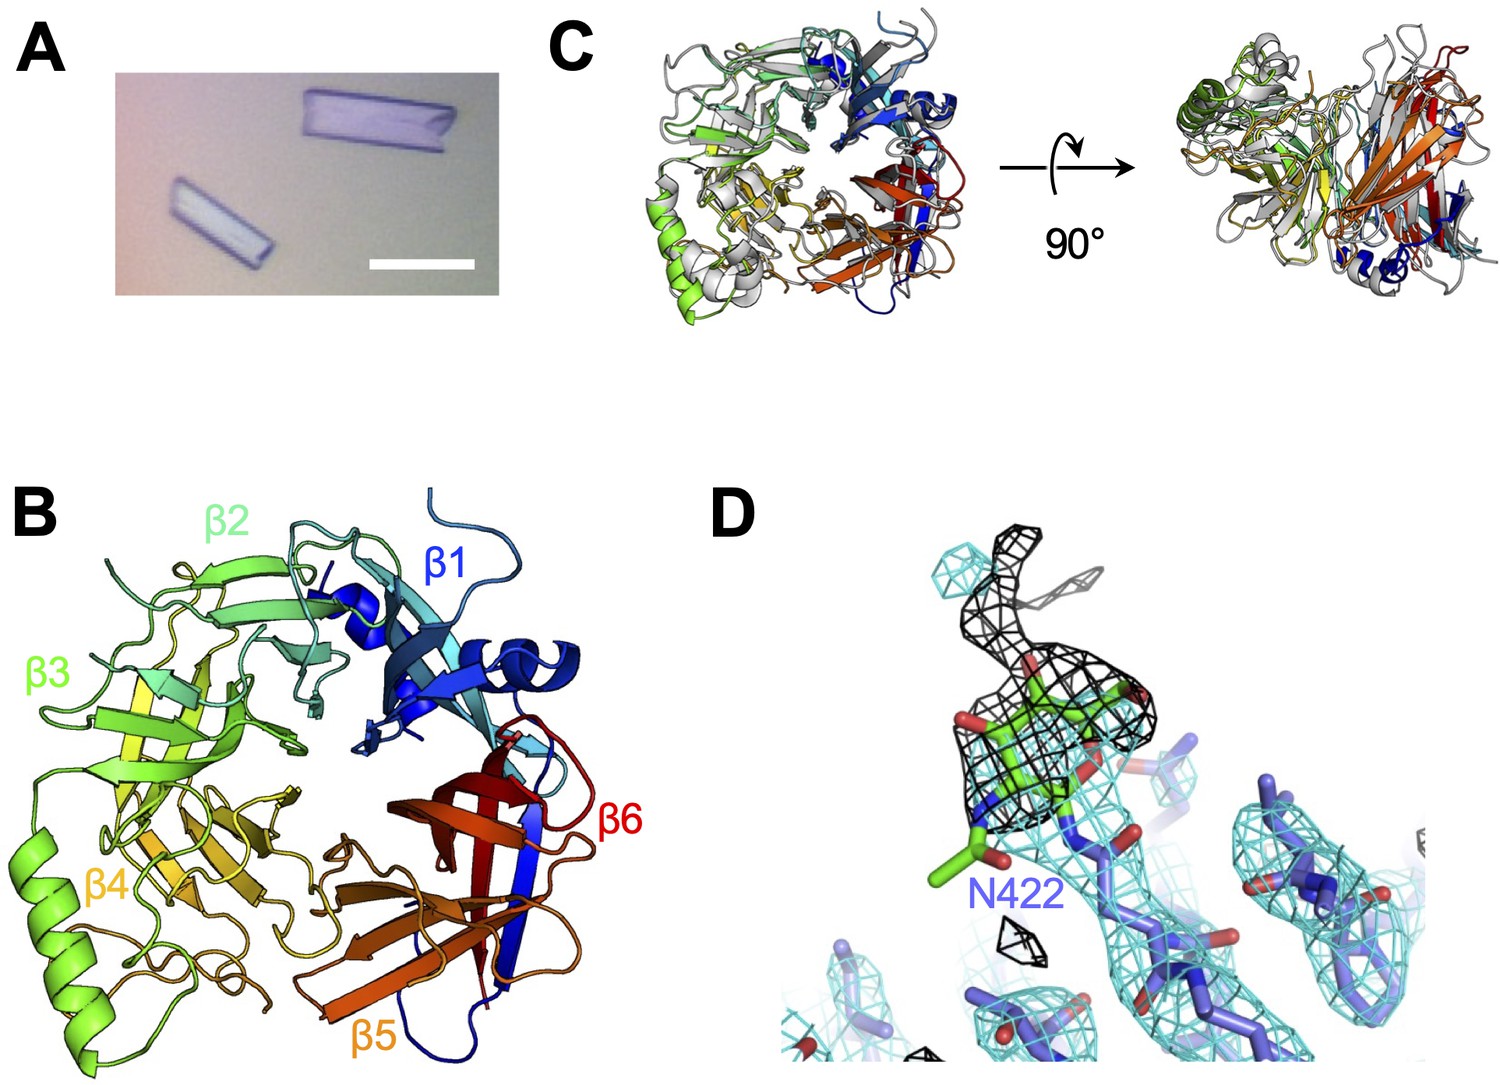
Crystal structure of CDV-H.
(A) Micrograph of CDV-H head domain crystal. Scale bar indicates 0.1 mm. (B) Overall structure of CDV-H with secondary structures in cartoon model, colored gradually from blue (N-terminus) to red (C-terminus). (C) Structural comparison of CDV-H (rainbow color) and MeV-H (PDB ID: 2ZB6, gray). (D) Electron density map (2.5 σ omit map shown in black mesh) around Asn422 of CDV-H attached with N-glycan.
Figure 2—figure supplement 1
Electron density maps of CDV-H chains A and B.
Electron density maps (1.0 σ 2Fo−Fc map shown in magenta mesh) are shown with cyan-based stick models of chains A (left) and B (right).
Figure 3 with 1 supplement
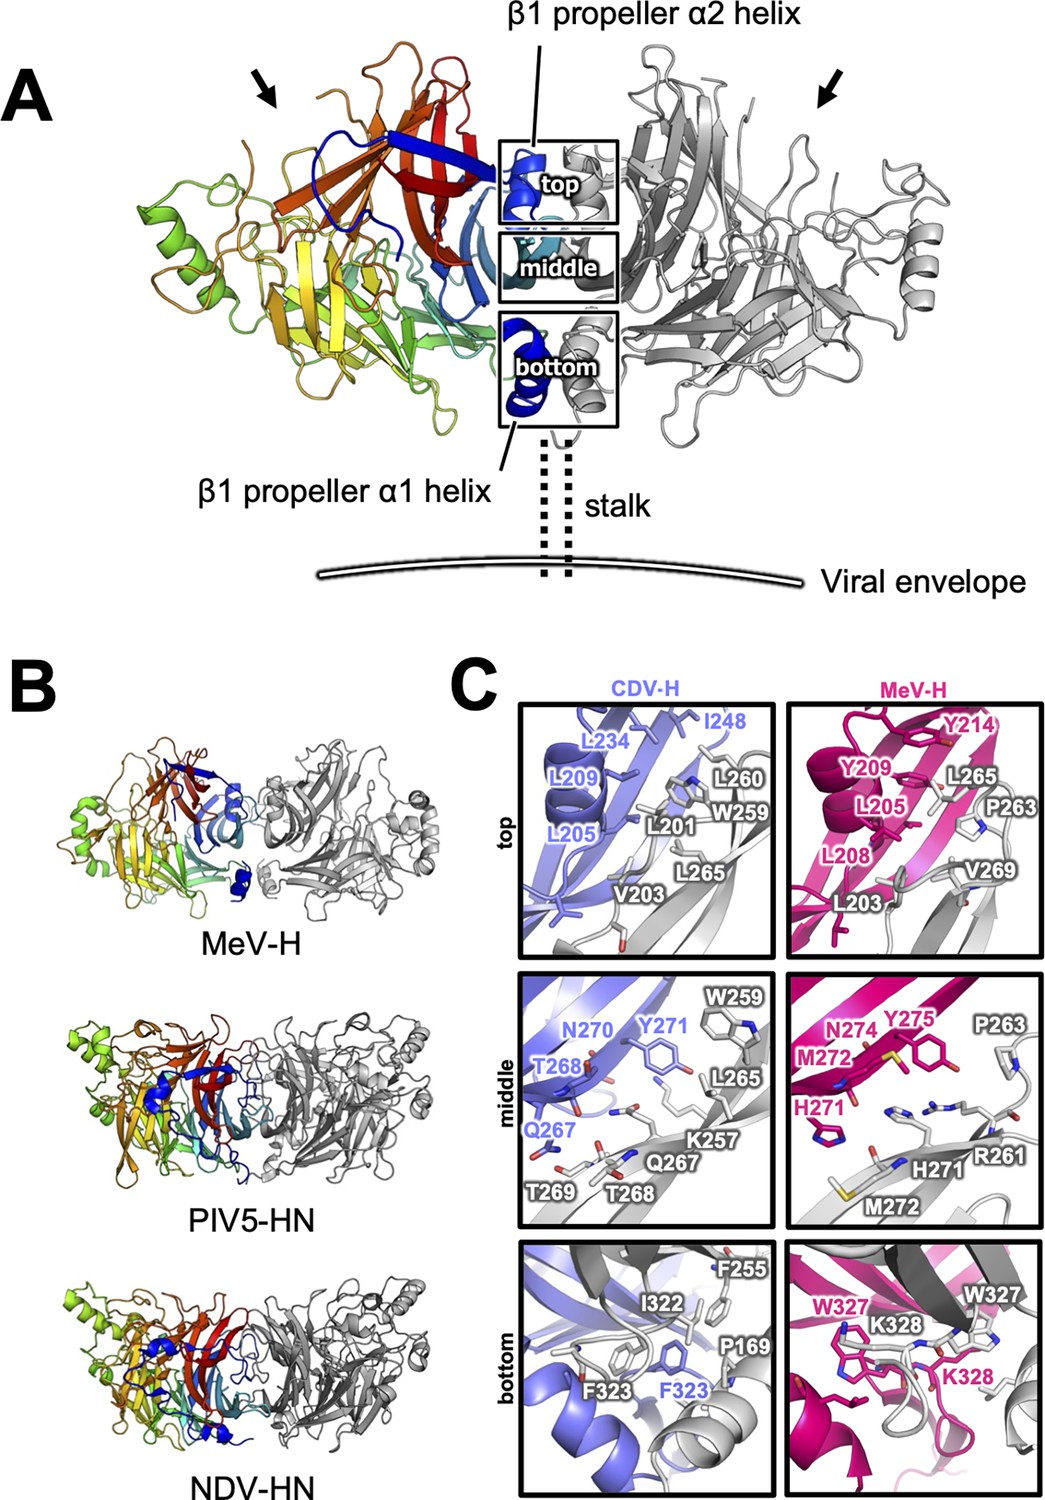
Homodimer structure and its interface of CDV-H.
(A) Homodimer structure of CDV-H with secondary structures in cartoon model as the same as Figure 2B (rainbow: chain A and gray: chain B). The black arrows indicate the receptor-binding sites. (B) Structural comparison of CDV-H with other paramyxovirus hemagglutinin dimers. MeV-H (top, PDB code: 2ZB6), PIV5-HN (middle, PDB code: 4JF7), and NDV-HN (bottom, PDB code: 3T1E) are shown in similar direction with CDV-H of A. (C) The closed-up images for three sites at the homodimer interface. One of the CDV-H dimer is shown in slate, asymmetric unit in gray. One of the MeV-H dimer is colored hot pink.
Figure 3—figure supplement 1
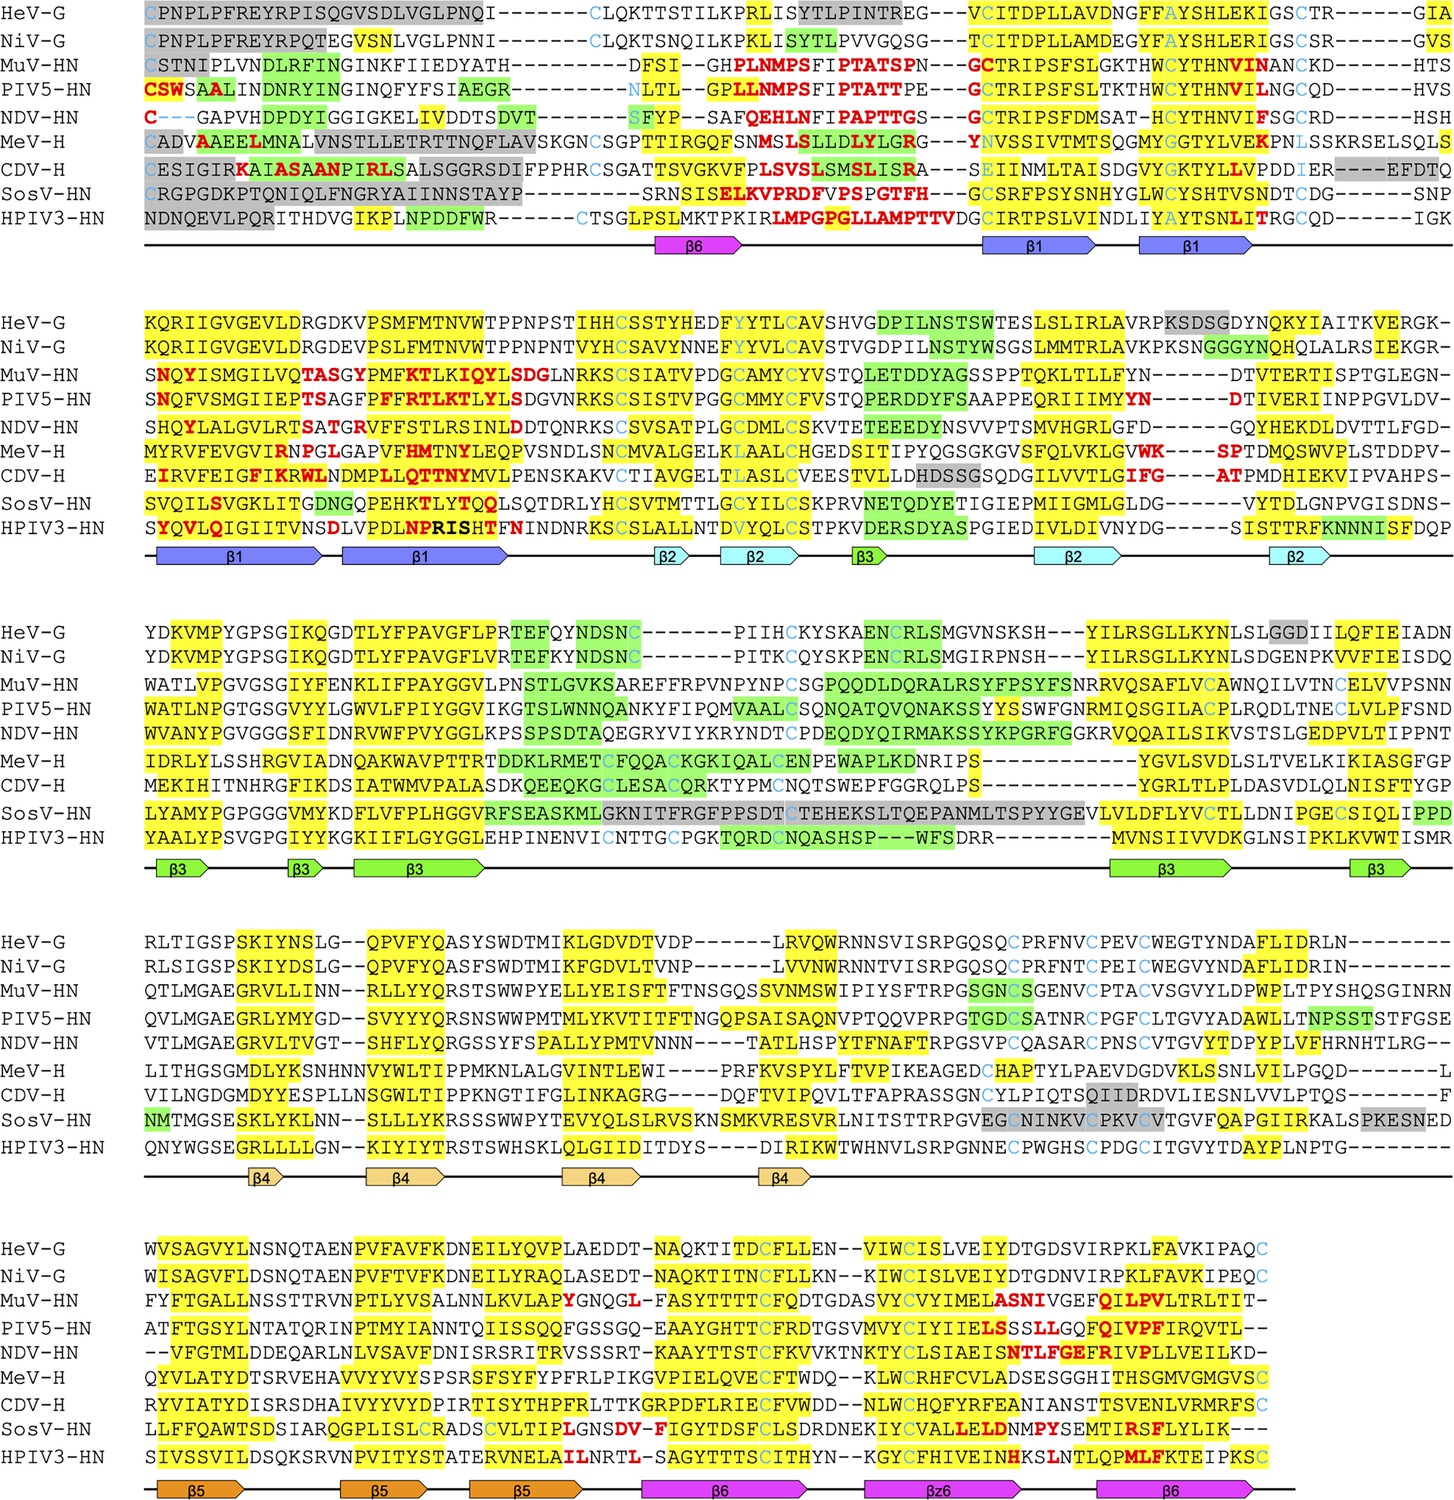
Structure-based alignment of receptor-binding glycoproteins from various paramyxoviruses.
Attachment glycoproteins were aligned with the CDV-H structure. G proteins of Hendra virus; HeV (PDB code: 2VSK) and Nipah virus; NiV (PDB code: 3D12), HN proteins from Mumps virus; MuV (PDB code: 5B2C), Parainfluenza virus 5; PIV5 (PDB code: 4JF7), Newcastle disease virus; NDV (PDB code: 3T1E), Sosuga virus; SosV (PDB code: 6SG8), and human parainfluenza virus 3; hPIV3 (PDB code: 1V2I), H protein of measles virus (MeV; PDB code: 2ZB6). Green, yellow, and gray boxes indicate α-helices, β-sheets, and disordered regions in the structure, respectively. Red letters indicate the residues involved in homodimer formation. The positions of the secondary structures of the six-bladed β-propeller CDV-H are shown underneath the alignment.
Figure 4 with 1 supplement
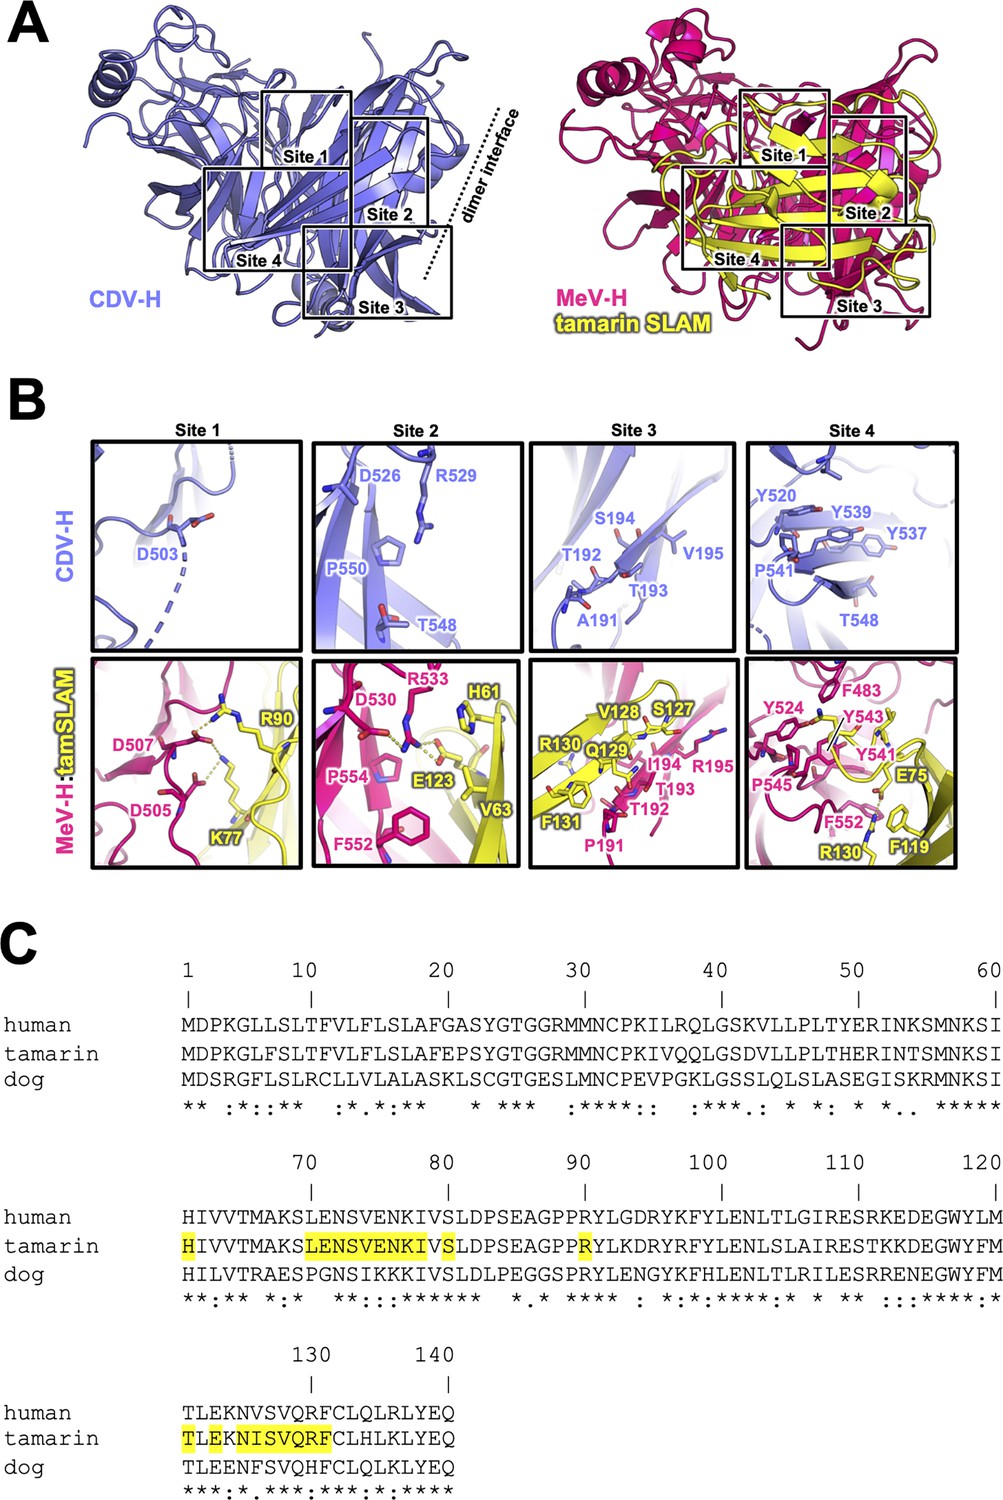
Putative signaling lymphocyte activation molecule (SLAM)-binding site on CDV-H.
(A) Structures of CDV-H with putative SLAM-binding sites (left, slate) and SLAM complex of MeV-H (right, hot pink) are shown. (B) The residues that are involved in SLAM receptor binding revealed by mutagenesis studies are shown in stick model on CDV-H (top) and MeV-H (bottom). (C) Amino acid sequence alignment of v-type domains of SLAMs. Asterisks (*) indicate fully conserved residues. A colon (:) indicates conservation between groups of strongly similar properties. A period (.) indicates conservation between groups of weakly similar properties. Interacting with hemagglutinin residues (<4.0 Å) are indicated in yellow-colored boxes.
Figure 4—figure supplement 1

The superposition of CDV-H onto the MeV-H complex structure.
The superposition of CDV-H onto the MeV-H–tamarin signaling lymphocyte activation molecule (SLAM) complex (left), and onto MeV-H–hNectin-4 complex (right). Coloring is the same as that in Figures 4A and 5A.
Figure 5
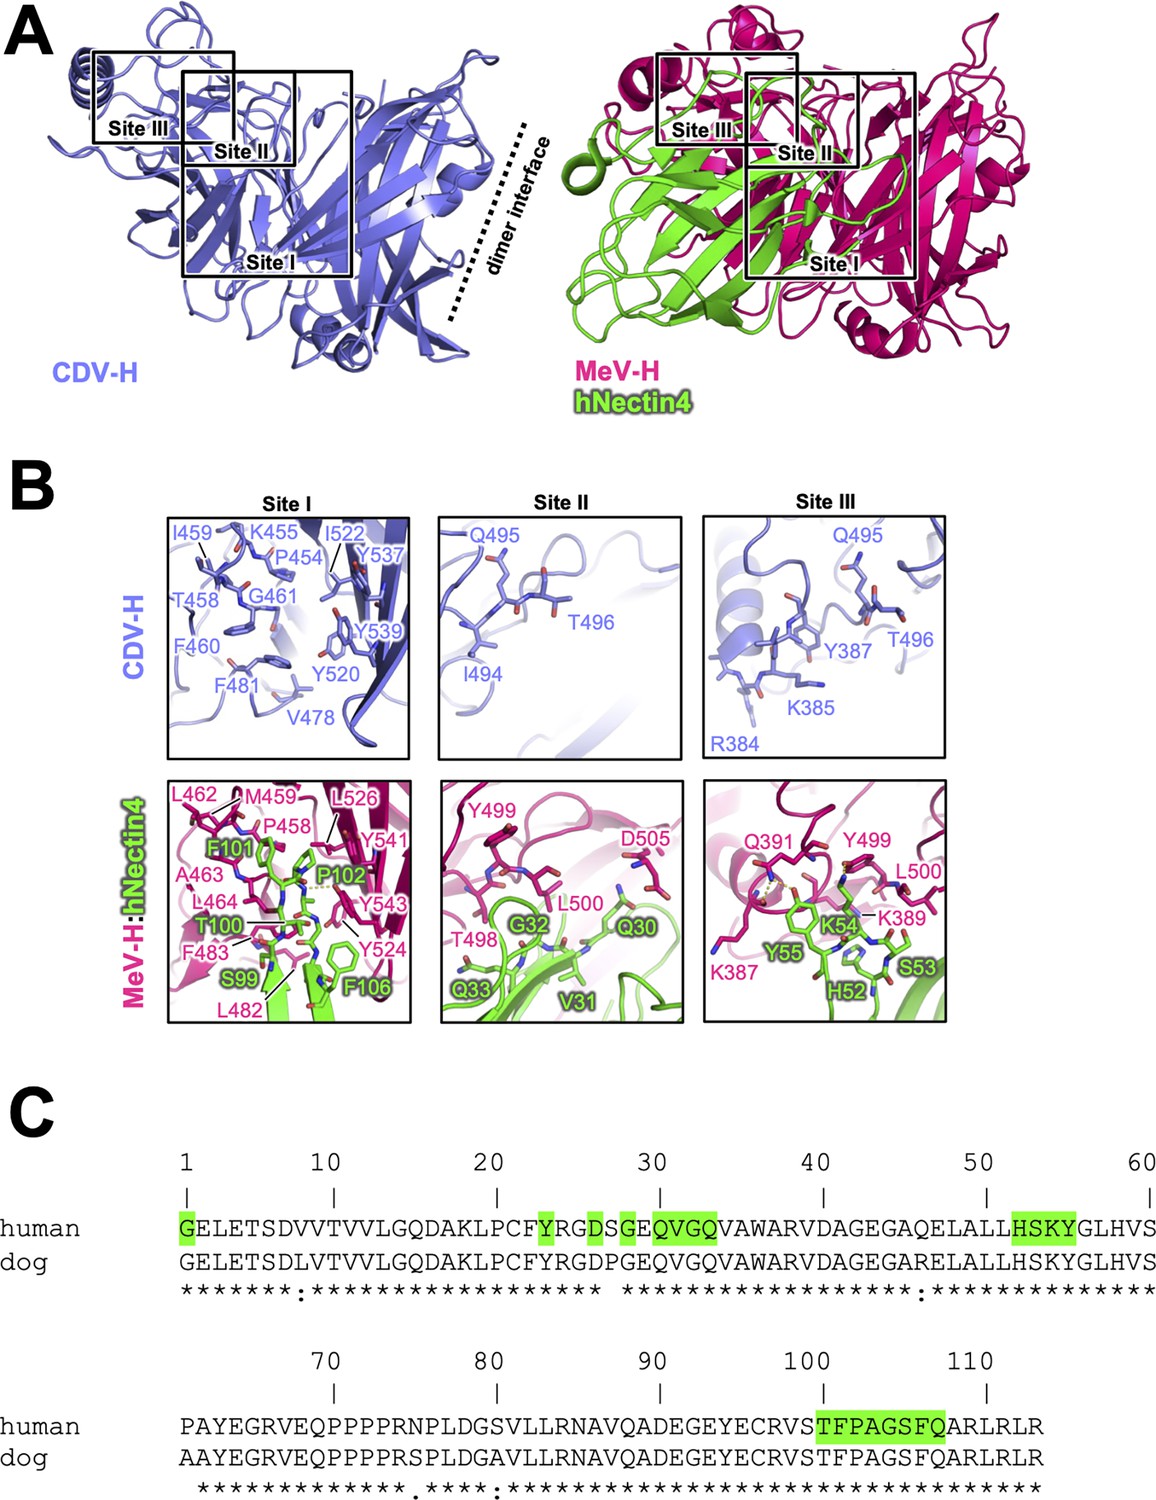
Putative Nectin-4-binding site on CDV-H.
(A) Structures of CDV-H with putative Nectin-4-binding sites (left, slate) and Nectin-4 complex of MeV-H (right, hot pink) are shown. (B) The residues that are involved in Nectin-4 receptor binding revealed by mutagenesis studies are shown in stick model on CDV-H (top) and MeV-H (bottom). (C) Amino acid sequence alignment of v-type domains of Nectin-4s. Abbreviations and green-colored boxes are shown in the same manner with Figure 4C.
Figure 6 with 1 supplement
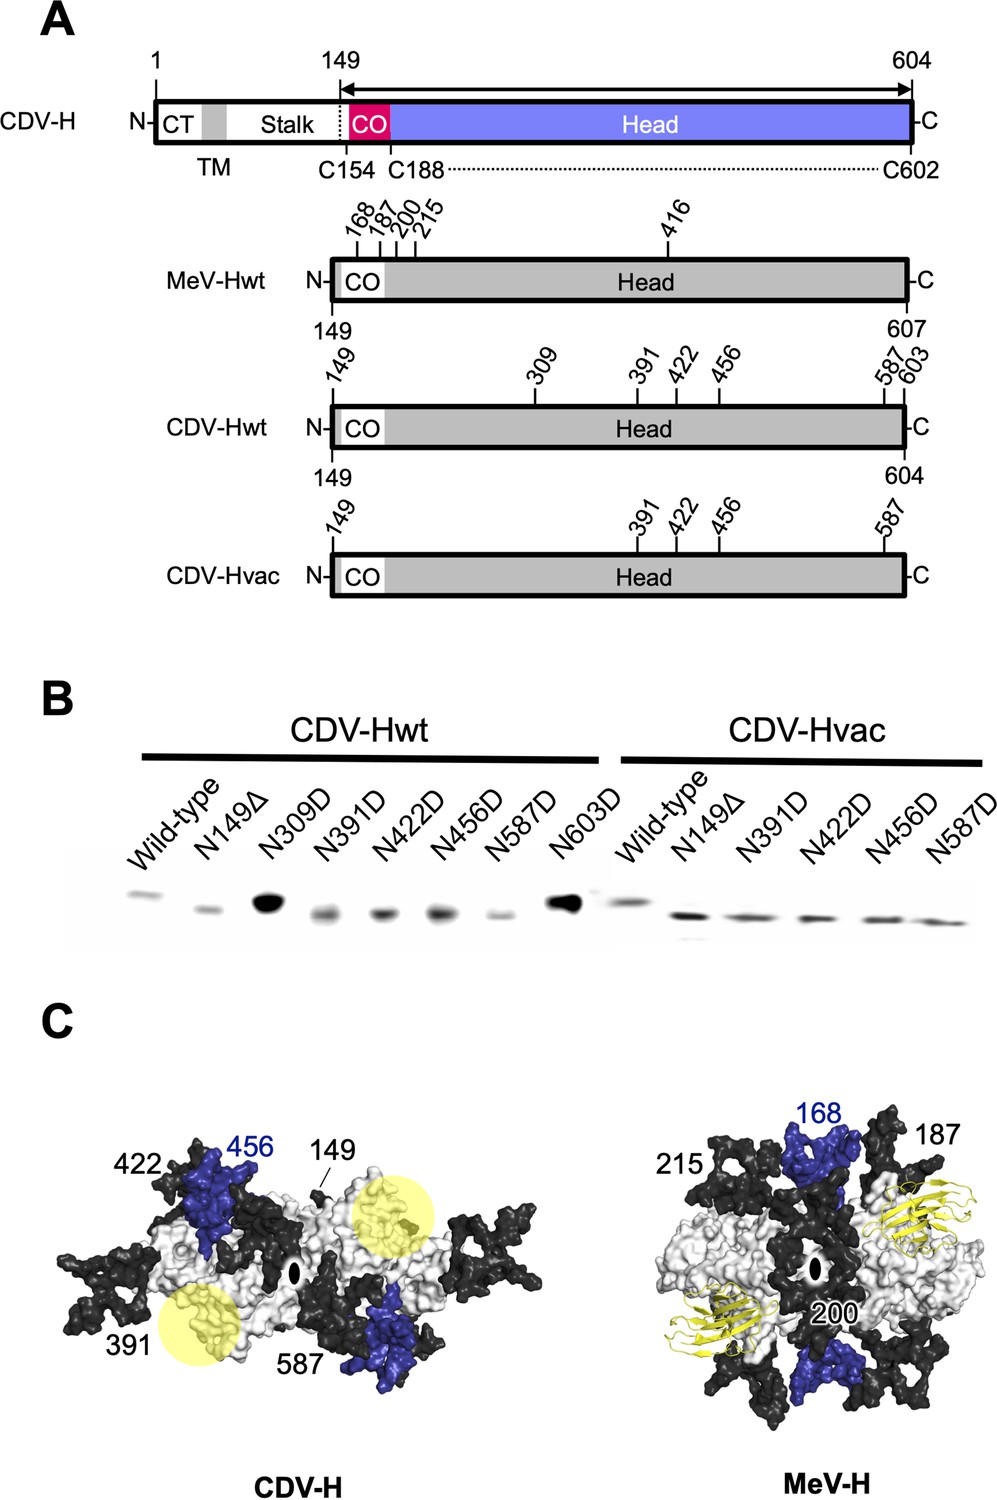
Glycan shield of CDV-H.
(A) Schematic images of full-length and expression constructs of ectodomain of CDV-Hs (wild-type and vaccine strains), together with that of MeV-H. (B) Mutagenesis studies for all potential glycan modification revealed to show that N390D and N630D showed clear western blot data. (C) Differences in glycan shields. Glycosylation sites on the surface of CDV-H (left) and MeV-H (right) dimers shown in white, with common N-linked glycans modeled in black and deep blue. Receptor-binding sites were shown in yellow circle on the CDV-H dimer. Tamarin signaling lymphocyte activation molecules (SLAMs) bound to the MeV-H dimer were shown in yellow. Twofold symmetry axis was shown as black ellipse.
Figure 6—figure supplement 1
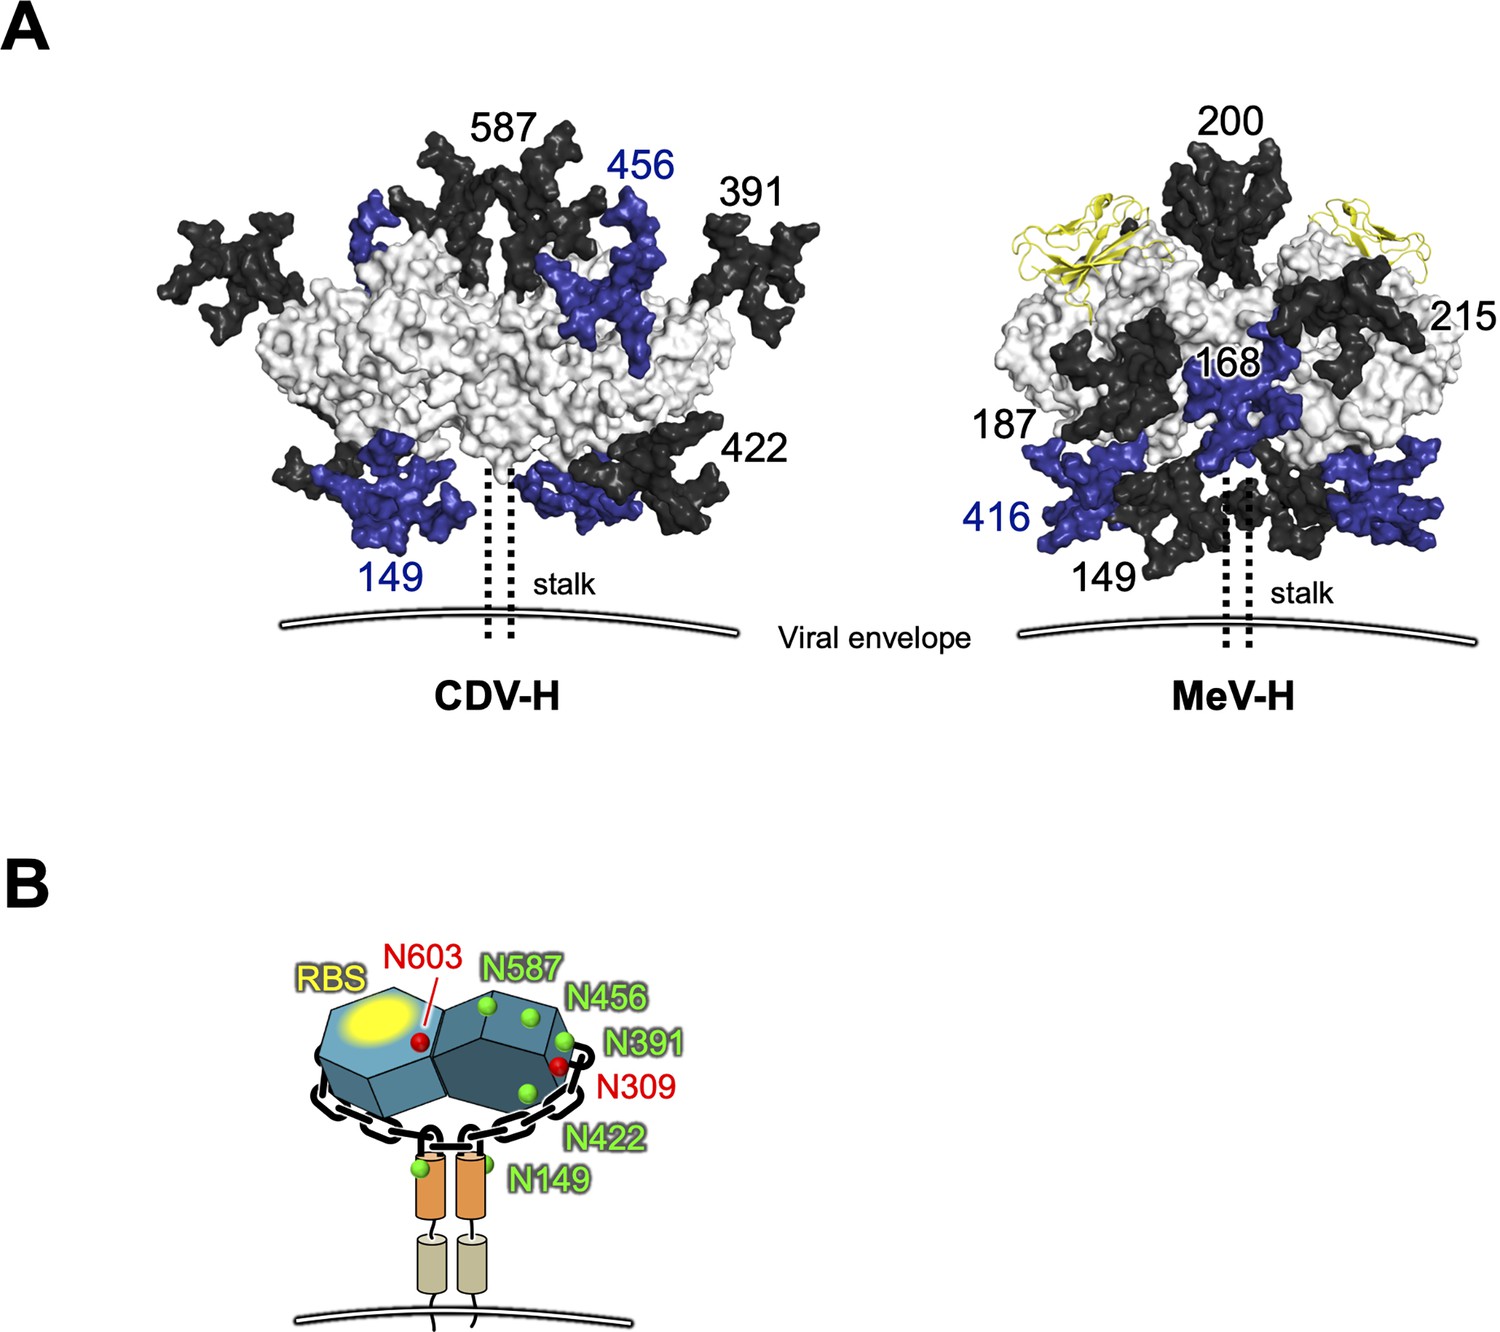
Glycan modifications onto CDV-H and MeV-H–signaling lymphocyte activation molecule (SLAM) complex.
(A) Side view of glycan models (five residues) mapped on the surface presentation of CDV-H (left) and MeV-H–SLAM complex structure (right) was represented in the same manner with Figure 6C. (B) Schematic representation of CDV-H dimer showing the locations of glycosylated (green) and unglycosylated (red) asparagine. Receptor-binding sites (RBSs) were shown in yellow.
Figure 7
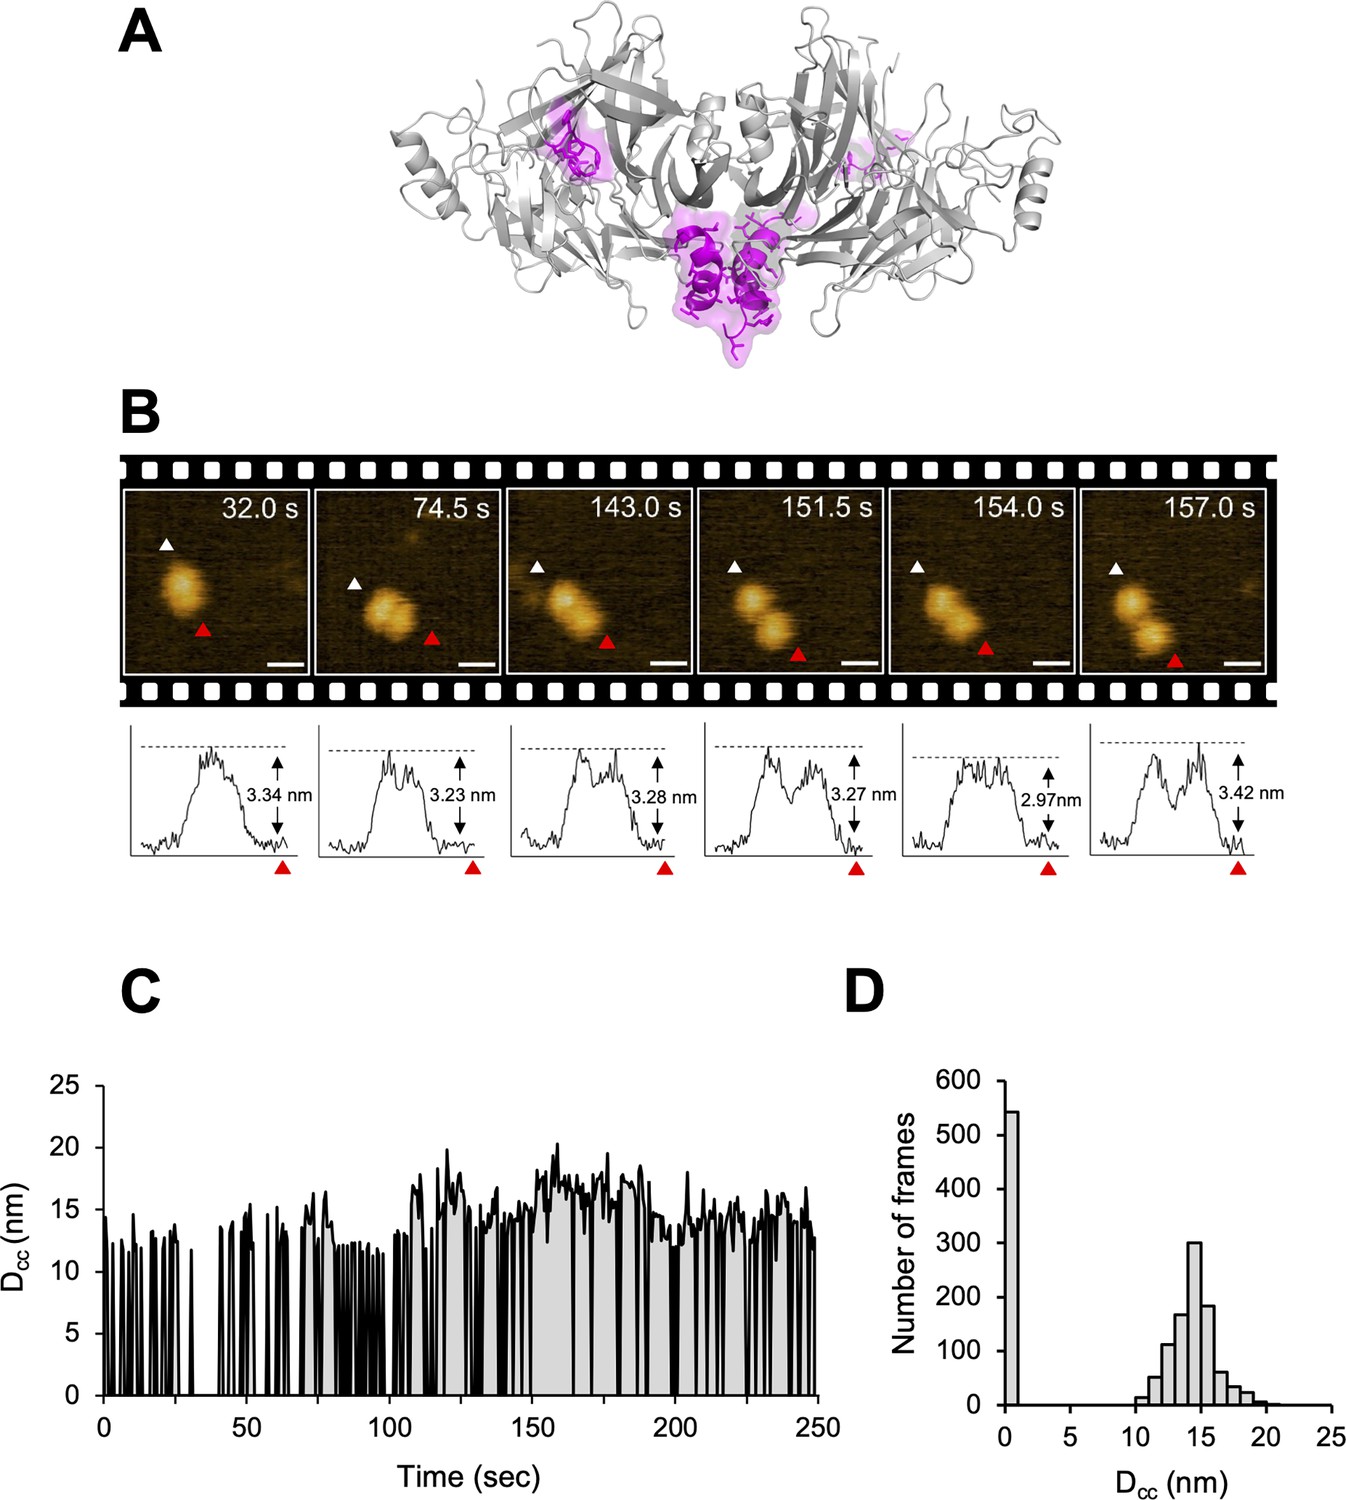
Structural dynamics of CDV-H analyzed by high-speed atomic force microscopy (HS-AFM).
(A) Homodimeric structure of CDV-H with a part of stalk region (residues 149–604). The globular head domain (gray) and the stalk region (magenta) are shown in cartoon model. (B) Serial HS-AFM images of CDV-H homodimer at 2 fps are shown. Scale bar indicates 20 nm length. Graphs under each HS-AFM image indicate the z-axis parameter between red and white triangle. (C) The distances between signal centers (Dcc) of representative homodimer were monitored at time scales. (D) The numbers of CDV-H homodimers are classified as several distances.
Figure 8
Proposed model of membrane fusion at canine distemper virus (CDV) entry.
The homodimer dimers have stalk regions (colored orange) attached to fusion proteins. Each H protein dimer is bridged by disulfide bond (shown in red bar) at ‘neck’ region. Step 1: Binding of receptor (signaling lymphocyte activation molecule [SLAM] or Nectin-4) to the head domains. Steps 2 and 3: Receptor pulling causes the head domains to dissociate a dimer of homodimers and completely collapse to individual domains. Steps 4 and 5: Fusion proteins are allowed to access the membrane of target cells and complete fusion.
Videos
Video 1
AFM image of CDV-H.
CDV_H, 100 × 100 nm. 5 fps, 5 frames per second, 100 × 100 nm scale, 200 × 200 pixel, scale bar: 20 nm.
Video 2
AFM image of CDV-H.
CDV_H, 100 × 100 nm. 10 fps, 10 frames per second, 100 × 100 nm scale, 200 × 200 pixel, scale bar: 20 nm.
Video 3
AFM image of CDV-H.
CDV_H, 500 × 500 nm. 5 fps, 5 frames per second, 500 × 500 nm scale, 200 × 200 pixel, scale bar: 100 nm.
Tables
Table 1
Kinetics of Nectin-4 against MeV-H and CDV-H.
| SPR results | ||||
|---|---|---|---|---|
| dNectin-4 | hNectin-4 | |||
| KA [M−1] | KD [M] | KA [M−1] | KD [M] | |
| MeV-Hwt | 7.39 × 10⁵ | 1.35 × 10⁻⁶ | 1.48 × 10⁶ | 6.74 × 10⁻⁷ |
| MeV-Hvac | 9.50 × 10⁵ | 1.05 × 10⁻⁶ | 1.50 × 10⁶ | 6.66 × 10⁻⁷ |
| CDV-Hwt | 3.96 × 10⁵ | 2.53 × 10⁻⁶ | 3.97 × 10⁵ | 9.48 × 10⁻⁷ |
| CDV-Hvac | 1.06 × 10⁶ | 9.42 × 10⁻⁷ | 1.05 × 10⁶ | 2.52 × 10⁻⁶ |
-
The values of dissociation and association constants (KD and KA) were determined by SPR analysis.
Table 2
Data collection and refinement statistics.
| CDV-H | |
|---|---|
| Data collection | |
| Space group | P43212 |
| Cell dimensions | |
| a = b, c (Å) | 86.84, 303.51 |
| Resolution (Å)* | 34.8–3.1 (3.2–3.1) |
| Rmerge | 0.153 (0.914) |
| I/σI | 11.2 (3.0) |
| Wilson B-factor | 69.86 |
| CC1/2 | −0.808 |
| Completeness (%) | 99.6 (100) |
| Redundancy | 6.1 (6.3) |
| Refinement | |
| Resolution (Å) | 34.8–3.1 (3.2–3.1) |
| No. reflections | 21,519 (2131) |
| Rwork/Rfree | 0.2645 (0.3532)/0.3092 (0.4064) |
| No. atoms | |
| Protein | 6564 |
| B-factors | |
| Protein | 70.56 |
| R.m.s. deviations | |
| Bond lengths (Å) | 0.003 |
| Bond angles (°) | 0.72 |
| Ramachandran plot† | |
| Favored | 94% |
| Allowed | 6% |
| Outliers | 0.73% |
-
*
Highest resolution shell is shown in parenthesis.
-
†
Analyzed by Molprobity (Harder et al., 1996).
Additional files
Download links
A two-part list of links to download the article, or parts of the article, in various formats.
Downloads (link to download the article as PDF)
Open citations (links to open the citations from this article in various online reference manager services)
Cite this article (links to download the citations from this article in formats compatible with various reference manager tools)
Glycan-shielded homodimer structure and dynamical features of the canine distemper virus hemagglutinin relevant for viral entry and efficient vaccination
eLife 12:RP88929.
https://doi.org/10.7554/eLife.88929.3


