A stochastic world model on gravity for stability inference
- Department of Psychological and Cognitive Sciences & Tsinghua Laboratory of Brain and Intelligence, Tsinghua University, China
Figures
Figure 1 with 7 supplements
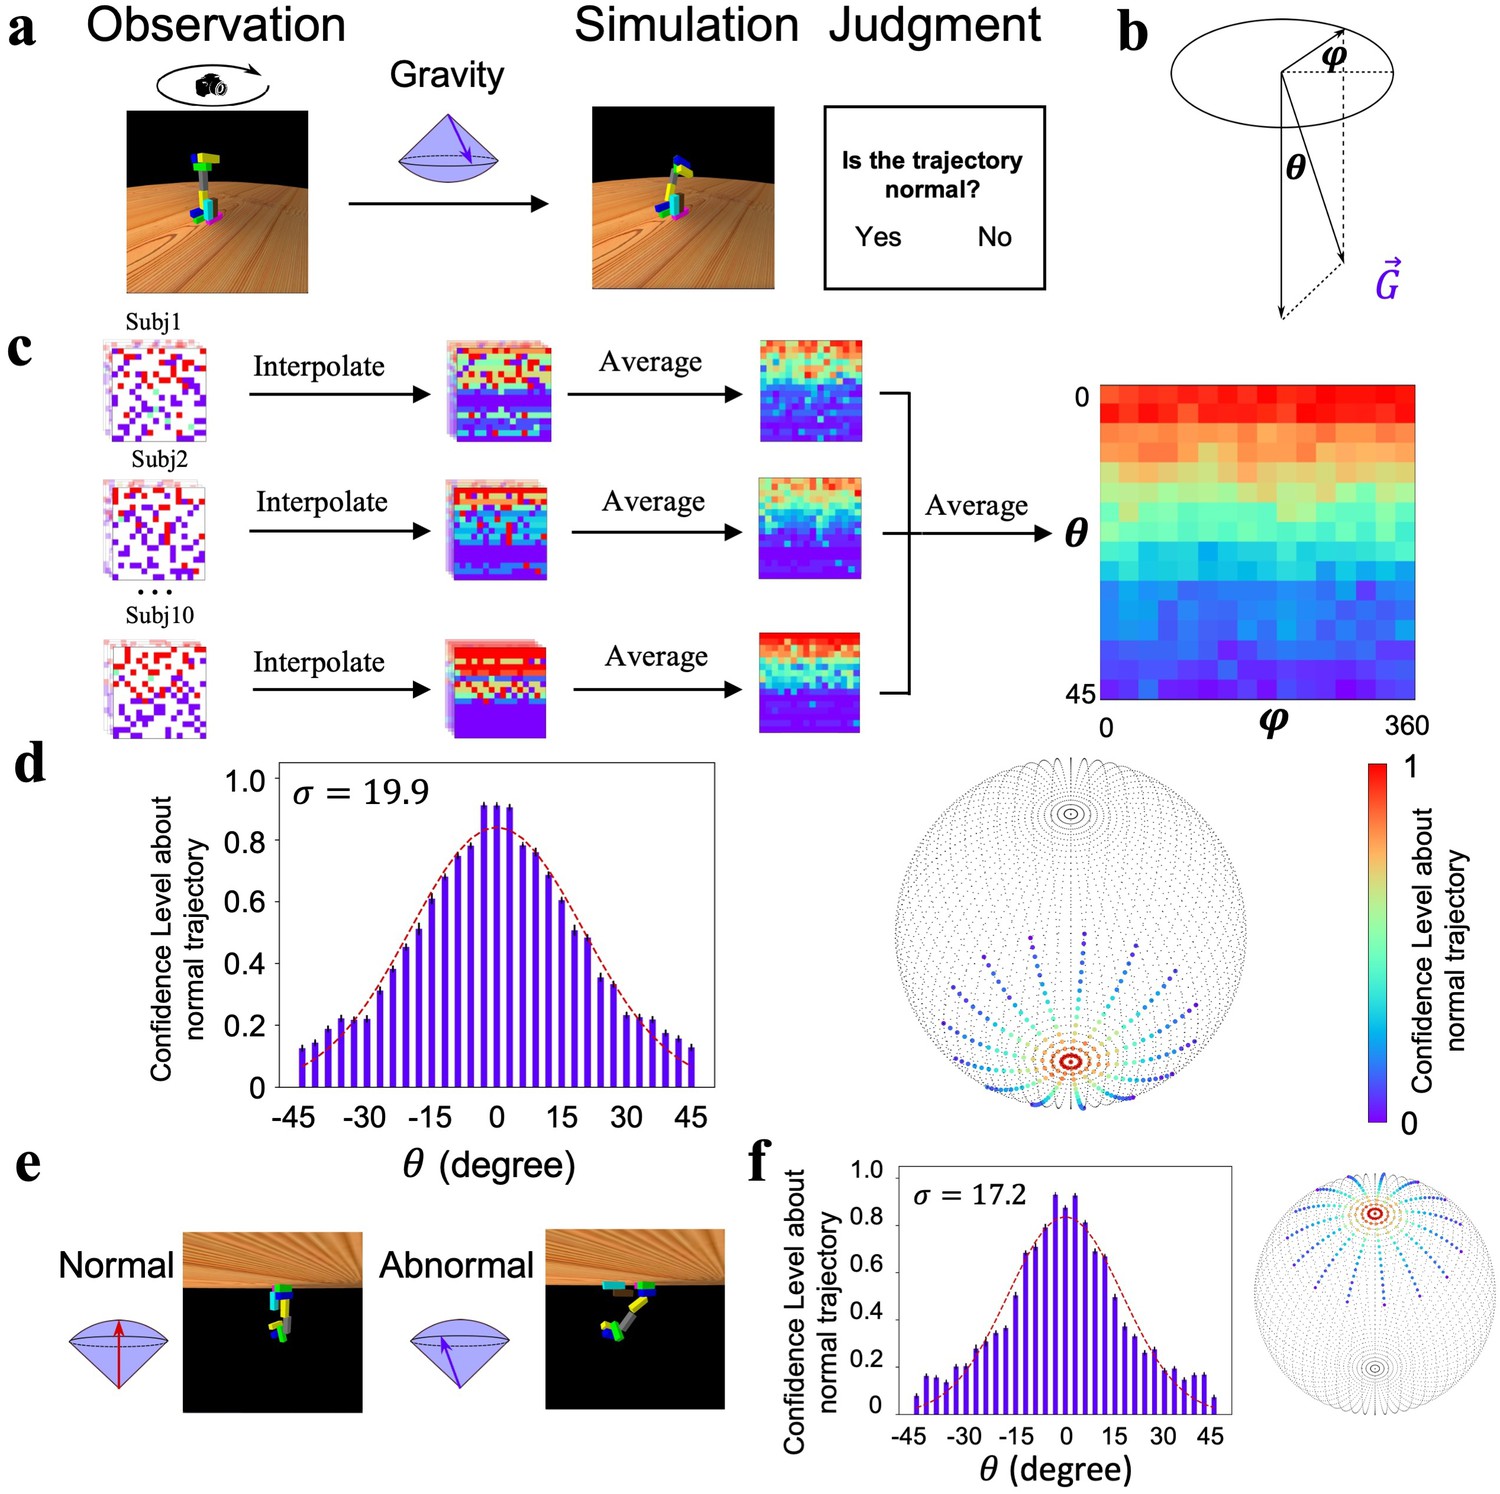
Gravity’s direction in the world model.
(a) The design of the behavioral experiment. Left: a rotating camera was used to rotate a stack 360° to display the three-dimensional appearance of the configuration. Middle: gravity’s direction was randomly sampled from a spherical surface. Right: the physics simulator simulated the collapse trajectory of the stack under this selected direction, and participants reported whether the collapse trajectory was normal. (b) The spherical surface of gravity’s direction was determined by two parameters and . (c) The procedure of calculating participants’ confidence level about normal trajectory as the function of angle pairs. Left: each cell represents the response of normal trajectory for an angle pair within a run. Middle: responses for unsampled pairs were interpolated with the averaged responses along . Right: the confidence level for each angle pair was calculated by averaging responses across runs and participants. (d) Left: gravity’s direction encoded in the world model follows a Gaussian distribution with the vertical direction as the maximum likelihood. Note that the confidence level for > 0 was sampled from , and for < 0 was sampled from . Right: the sphere represents the space of gravity’s direction, with two poles pointing upward and downward, respectively. Each dot in the sphere represents one angle pair, and the color on a dot indicates the likelihood that the collapse trajectory under this gravity direction was judged normal. (e) In a new setting, gravity’s direction is reversed. Left: an example collapse trajectory when gravity’s direction was upward. Right: a trajectory when the direction was away from the vertical upward. (f) Gravity’s direction encoded in the world model when gravity’s direction in the physical world was reversed. Error bar: standard error, sample size=10.
Figure 1—figure supplement 1

Construction of stacks with different configurations.
(a) Illustration of the block-stacking procedure to create stacks in different configurations. A configuration was constructed by placing multiple blocks within a designated area. If there was no positioned block in the area, a new block was placed on the ground; otherwise, it was placed on top of the positioned block. (b) Three types of blocks with an aspect ratio of 3:1:1. (c) This procedure can create a large number of stacks with different configurations within designated areas. Note that in small areas, the height of stacks was taller. (d) The lower bound of configurations’ possible number and the number of blocks in a stack followed an exponential relationship with a base of 10. The procedure can create at least 1.14 × 1050 configurations for stacks consisting of 10 blocks. See the for the estimation.
Figure 1—figure supplement 2

Differentiating subjectivity from objectivity.
In both experiments 1 (a) and 2 (b), participants were instructed to determine which shape appeared most stable. Objectively, in the absence of external forces, all shapes possess equal stability. Yet, participants typically perceived the shape on the left as the most stable because of its larger base area. The discrepancy between objective realities and subjective feelings, as we propose, is attributed to the human mind representing gravity’s direction as a Gaussian distribution, rather than as a singular value pointing directly downward.
Figure 1—figure supplement 3

The stochastic world model on gravity of each participant.
Participants’ confidence level about normal trajectory in angles followed a Gaussian distribution, with the variance ranging from 11.1 to 37.1. No stochastic characteristic was observed in .
Figure 1—figure supplement 4
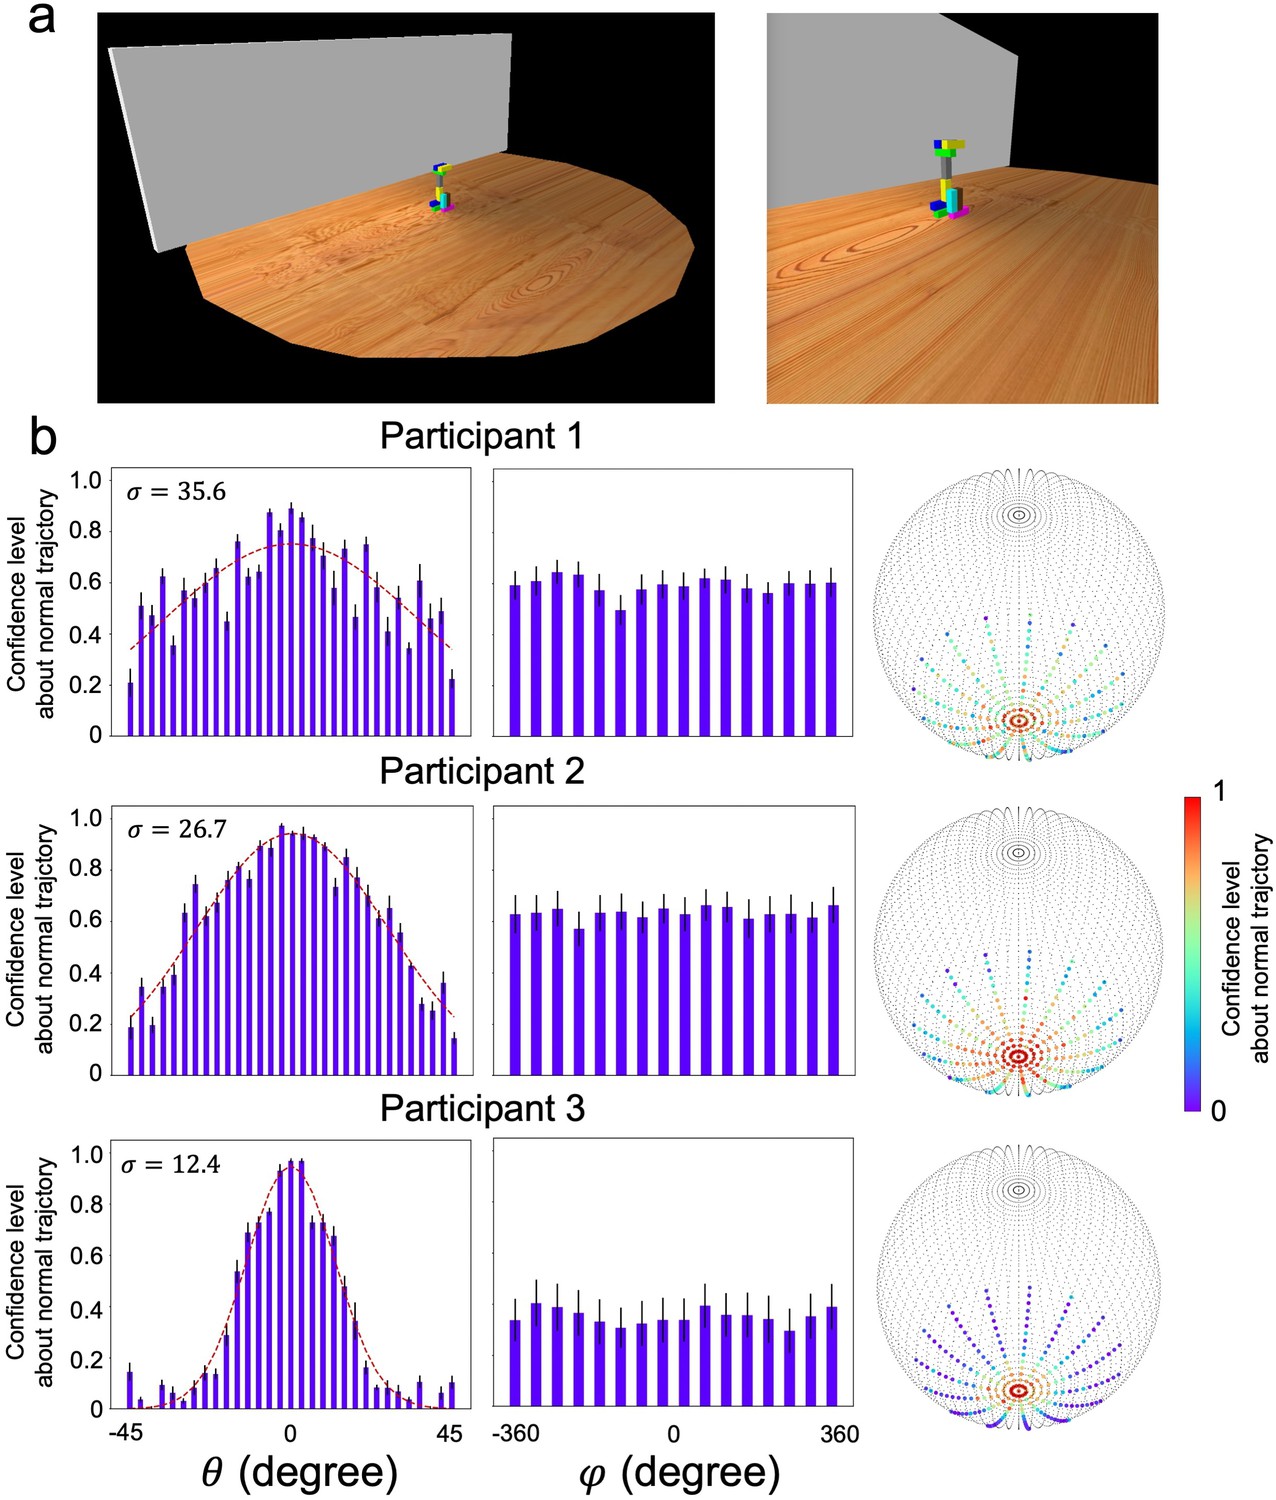
Wall experiment to test the impact of external forces on the measurement of stochastic gravity.
(a) Experimental setting. We replicated the original setup with the addition of a wall implemented on one side. Left: the overall experimental scene; right: the scene shown to participants. (b) Human behaviors. Three participants conducted this experiment, and their responses consistently showed normal distributions without any skewness, suggesting that their judgments were not affected by the presence of the wall. These results support our claim that humans’ judgments on stability were not affected by potential concerns regarding external forces.
Figure 1—figure supplement 5

The stochastic world model on gravity of each participant when gravity’s direction was inverted.
Participants’ confidence level about normal trajectory in angles also followed a Gaussian distribution, with the variance ranging from 9.1 to 28.4, and no stochastic characteristic was observed along .
Figure 1—video 1
Collapse simulation under normal or abnormal gravity in an upright perspective.
Figure 1—video 2
Collapse simulation under normal or abnormal gravity in an upright perspective.
Figure 2 with 2 supplements
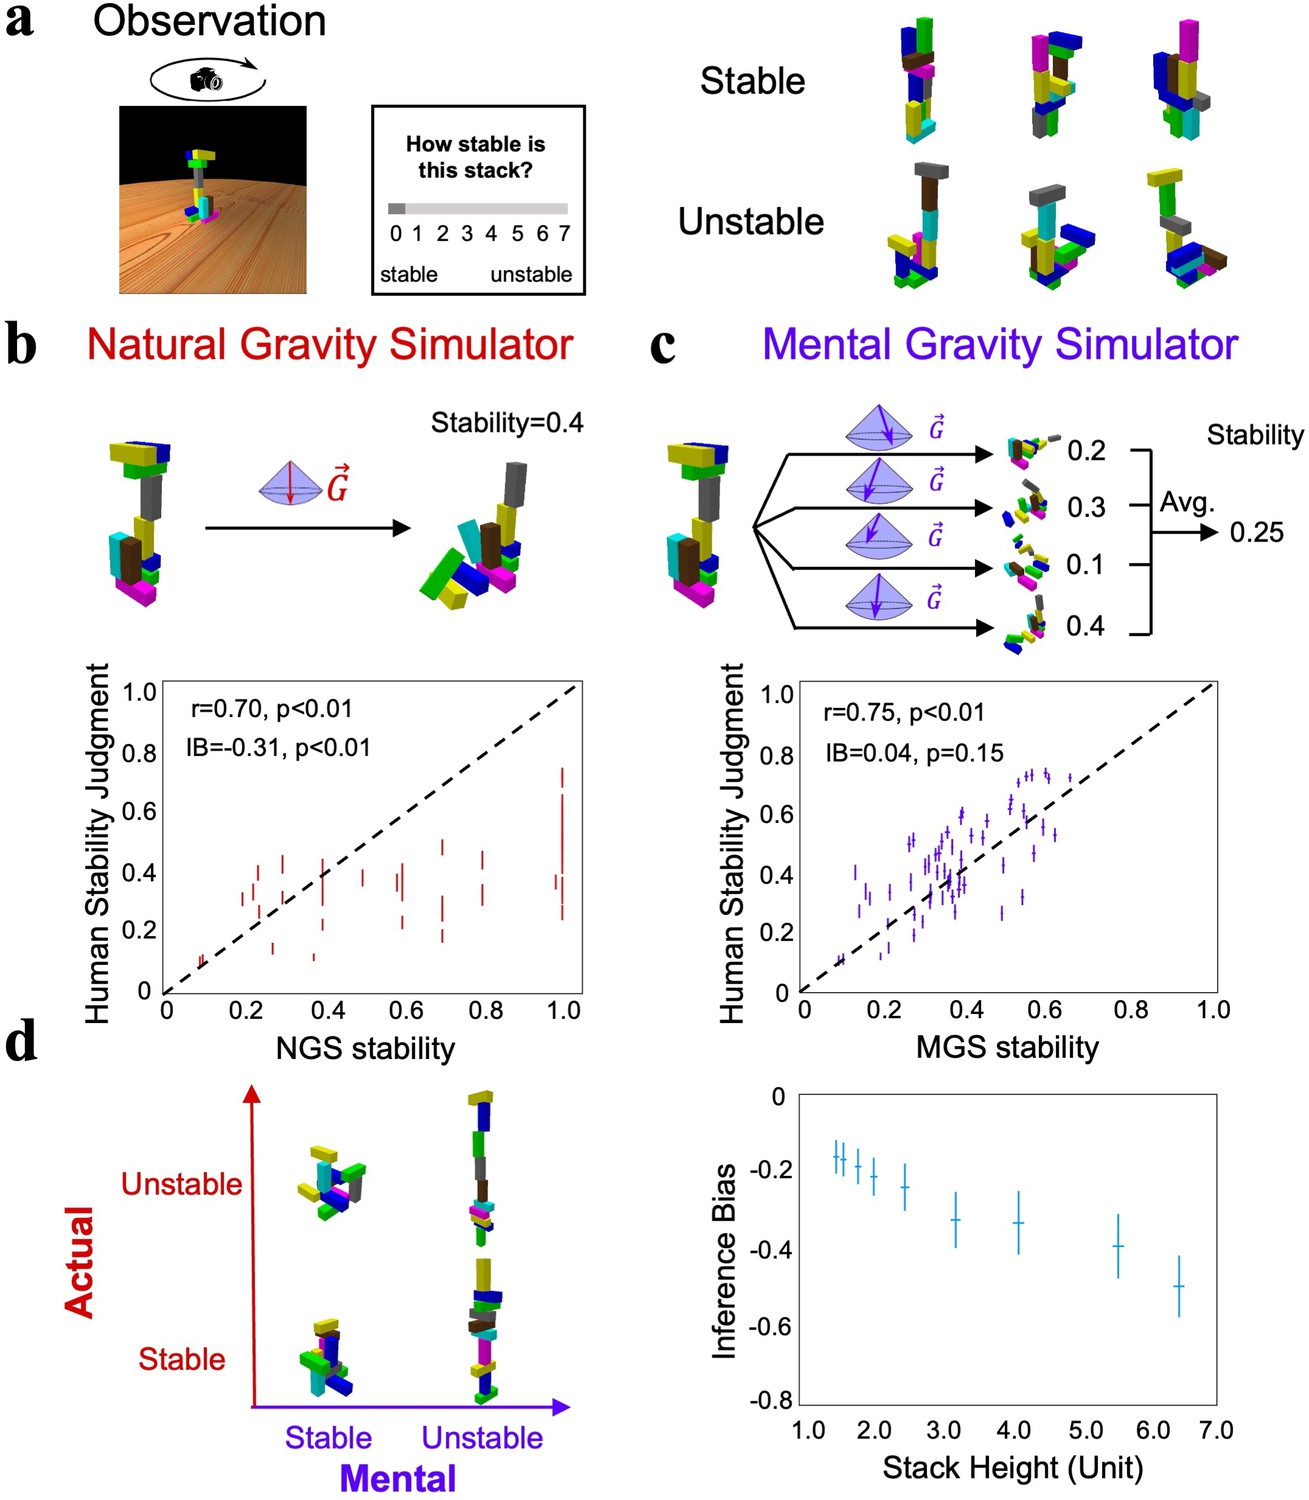
Stability inference by the world model on gravity.
(a) An experiment to rate the stability of stacks, half of which were stable and the other half unstable. (b) Top: the procedure of the natural gravity simulator (NGS) to estimate the actual stability of stacks by simulation, and for unstable stacks the stability was indexed by the proportion of displaced blocks. Bottom: the correlation between the stability estimates of the participant and those of the NGS. Each dot represents one stack, and the lines denote the standard errors. (c) Top: the procedure of the mental gravity simulator (MGS), where the stability of a stack was estimated by averaging the estimated stabilities from multiple simulations with different gravity directions sampled from the Gaussian distribution. Bottom: the correlation between the stability estimates of the participant and those of the MGS. (d) Left: the illusion that taller objects are perceived as more unstable than shorter ones. Right: the inference bias was indexed by the difference between the stability estimated by the MGS and that estimated by the NGS. The larger the negative values, the more likely stacks were unstable. The x-axis denotes the height of a stack containing ten blocks, where the height, length, and width of each block were 1.2, 0.4, and 0.4, respectively. IB: inference bias. Error bar: standard error.
Figure 2—figure supplement 1

Relation between the stability estimated by the mental gravity simulator (MGS) stability and that by participants when the world model was implemented with different Gaussian functions.
Only when the world model embodied Gaussian functions with intermediate variance (i.e., ) did the stability estimated by the MGS match participants’ stability inference. On the other hand, when the variance was small, most points were positioned below the diagonal line, indicating the model considered stacks more stable in general as compared to participants’ judgment. When the variance was large, the model considered stacks less stable. Note that all models showed high correlation coefficients regardless of the bias. In other words, the magnitude of the correlation is not the sole indicator to evaluate the fitness of the model. IB: inference bias.
Figure 2—figure supplement 2
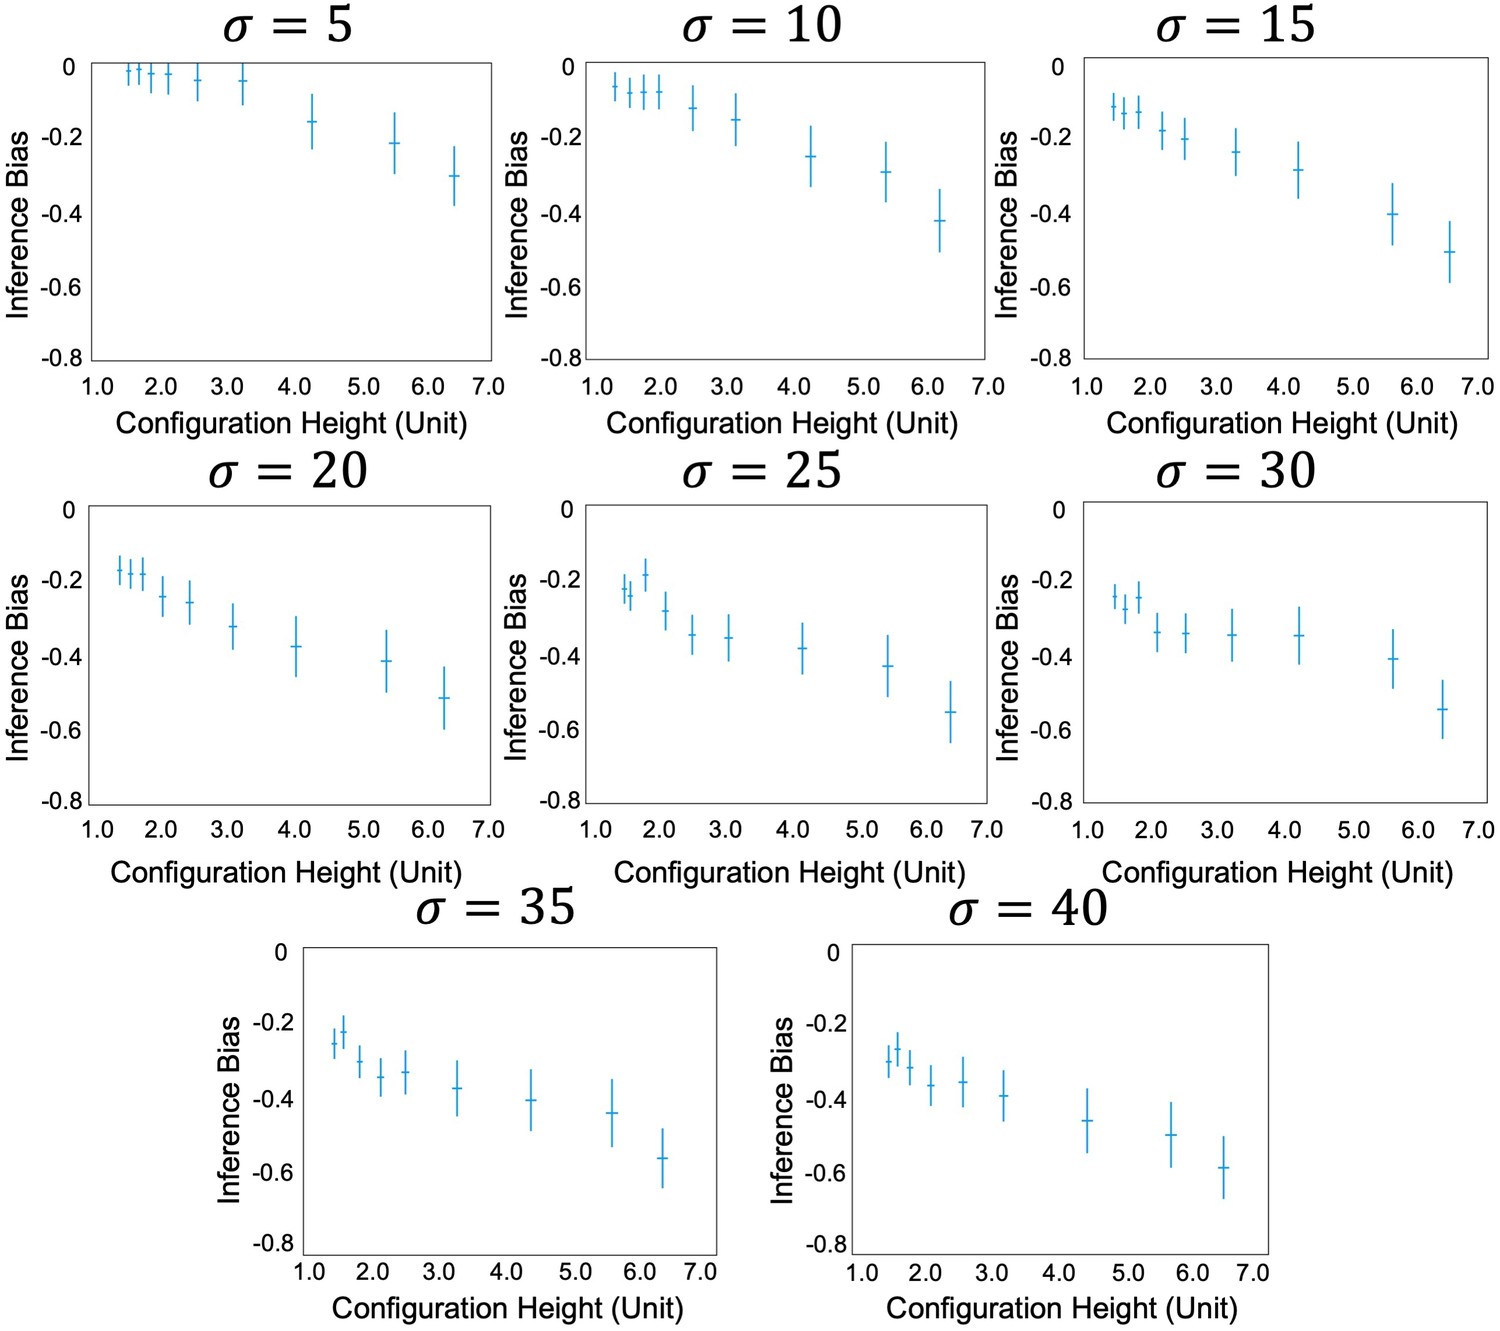
Height illusion of stability inference when the world model was implemented with different Gaussian functions.
The illusion that tall objects are considered more unstable than short ones manifests at all levels of variances of Gaussian functions, with larger variance leading to a stronger illusion.
Figure 3 with 2 supplements
The origin of the stochastic feature of gravity’s direction.
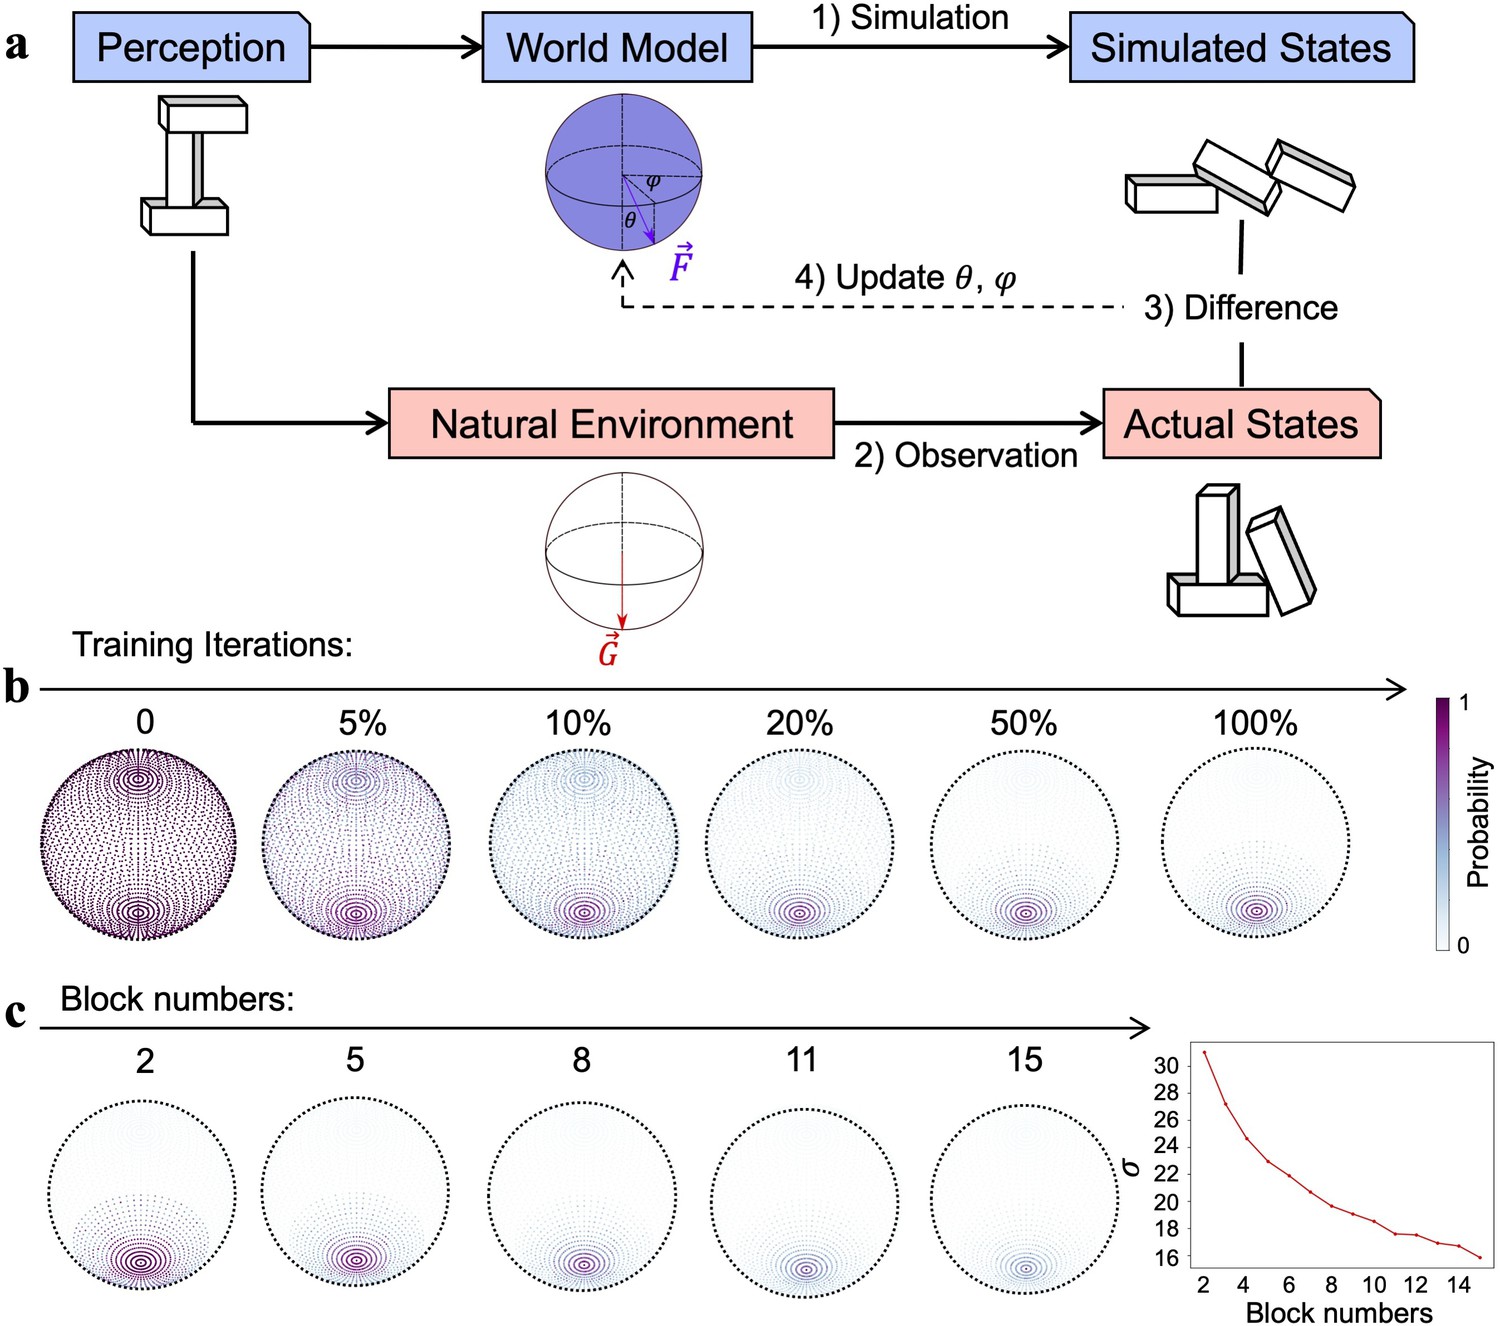
(a) The reinforcement learning framework, which updated gravity’s direction of the world model by minimizing the difference between the expectation from the internal simulation (i.e., simulated states) and the observation from the physical world (i.e., actual states). (b) Gravity’s directions, which were uniformly distributed on the spherical surface, gradually converged downward as the training progressed and eventually stabilized in a Gaussian distribution with the vertical direction as the maximum likelihood. Color denotes the probability of a parameter pair being adopted as gravity’s direction. (c) Left: world models constructed by reinforcement learning when stacks in the physical world were composed of different numbers of blocks ranging from 2 to 15. Right: the variance of the Gaussian distribution, illustrated by the width of the distribution of gravity’s direction on a spherical surface, monotonically decreased as the number of blocks in the stacks increased.
Figure 3—figure supplement 1

The developmental trajectory of (top) and (bottom) angles.
Sampling probabilities of angles gradually decreased during reinforcement learning, with the probabilities from smaller angles having a lower decrement tendency. The probability of without any deviation (i.e., ) keeps unchanged. Probabilities of all angles finally reached convergence after about 50% training progress. Different from angles, sampling probabilities of the angles dropped evenly.
Figure 3—figure supplement 2

The world models developed in the world containing stacks with different numbers of blocks.
The number of blocks ranged from 2 to 15, and in all the worlds gravity’s direction was in Gaussian distributions with the vertical direction as the maximum likelihood. Note that the world with stacks consisting of more block numbers led to smaller variances in the Gaussian function.
Figure 4 with 2 supplements
The ecological advantage of the stochastic feature.
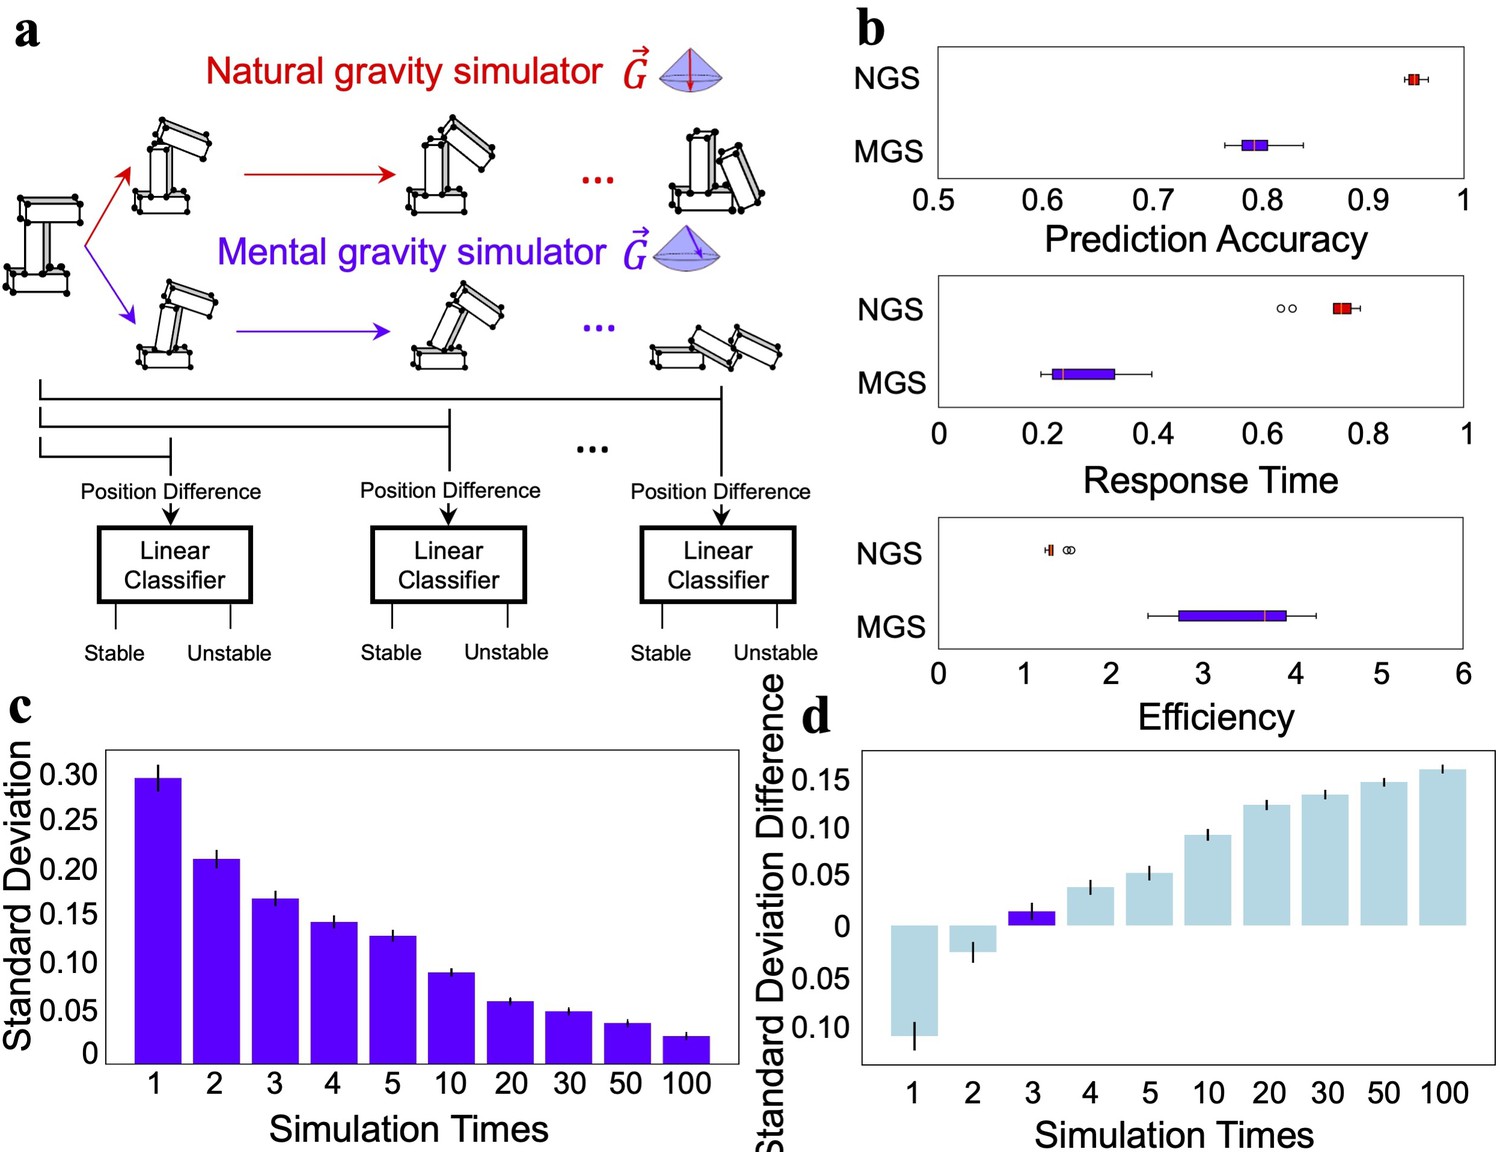
(a) Illustration that modeled humans’ decision-making behavior at different stages of the mental simulation using the natural gravity simulator (NGS) and mental gravity simulator (MGS). (b) The decision of the linear classifier based on the simulation of the MGS was less accurate than that of the NGS (top), but the decision was made faster in the MGS than in the NGS (middle). The MGS was more efficient than the NGS in combining accuracy and speed (bottom). (c) The relationship between the number of simulations and the variance of the estimated stability. (d) The difference in the variance of the estimated stability between the participants and the MGS. The difference was minimal when the MGS ran the simulation three times. Error bar: standard error.
Figure 4—figure supplement 1

Ecological advantage of the world model embodied with different Gaussian functions.
(a) Prediction accuracy decreased when the variance of the Gaussian function increased, and reached an asymptote of 0.75. (b) Response time decreased as the variance increased and reached an asymptote of 0.20. (c) The prediction accuracy and response time were combined as a measurement for efficiency, which gradually increased monotonically as the function of the variance until an asymptote of 4. Red box: the world model embodied no stochastic characteristic (i.e., the deterministic model); Blue box: the world model with different levels of variances. Error bar: standard error.
Figure 4—figure supplement 2
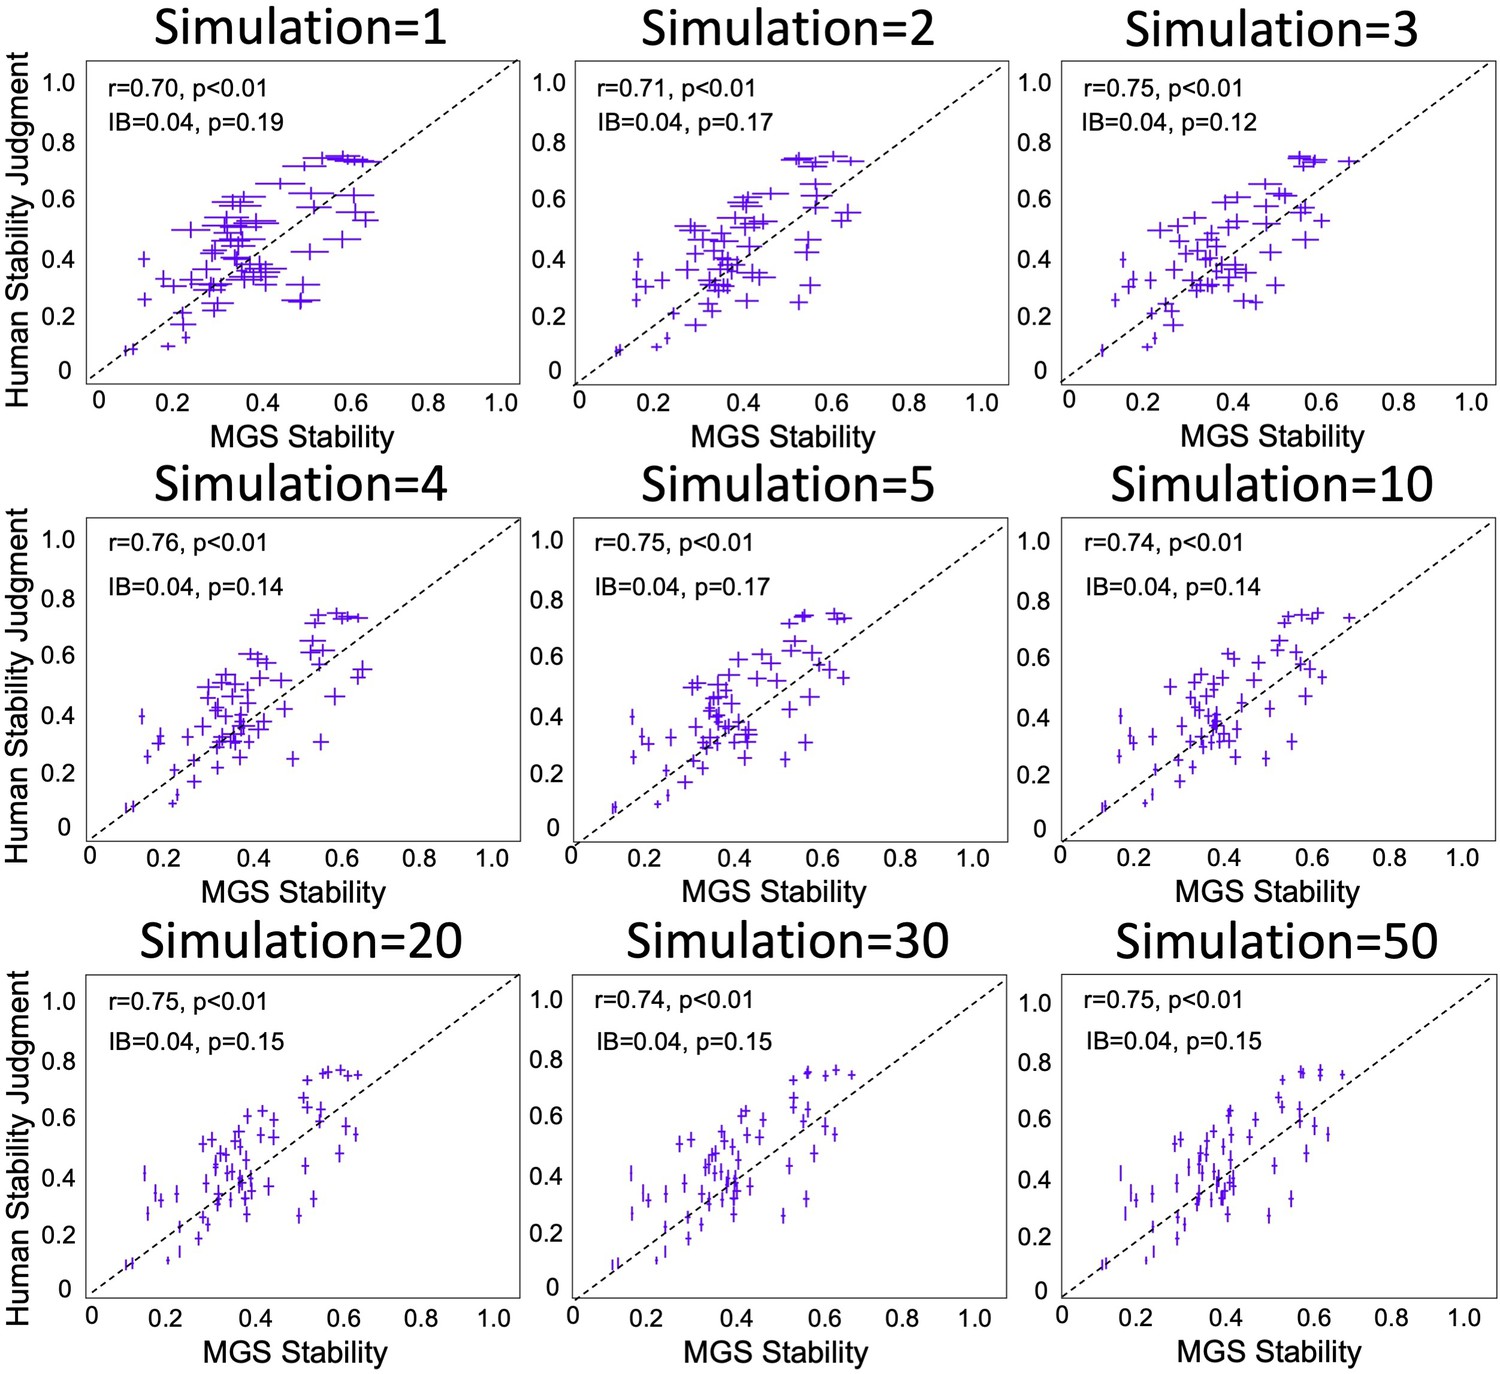
The relation between the number of simulations and the variance of stability inference.
The simulation showed that the variance of stability inference decreased with the number of simulations. Note that the variance in the world model observed in participants best matched the variance when the simulation of the mental gravity simulator (MGS) was conducted three times.
Appendix 1—figure 1
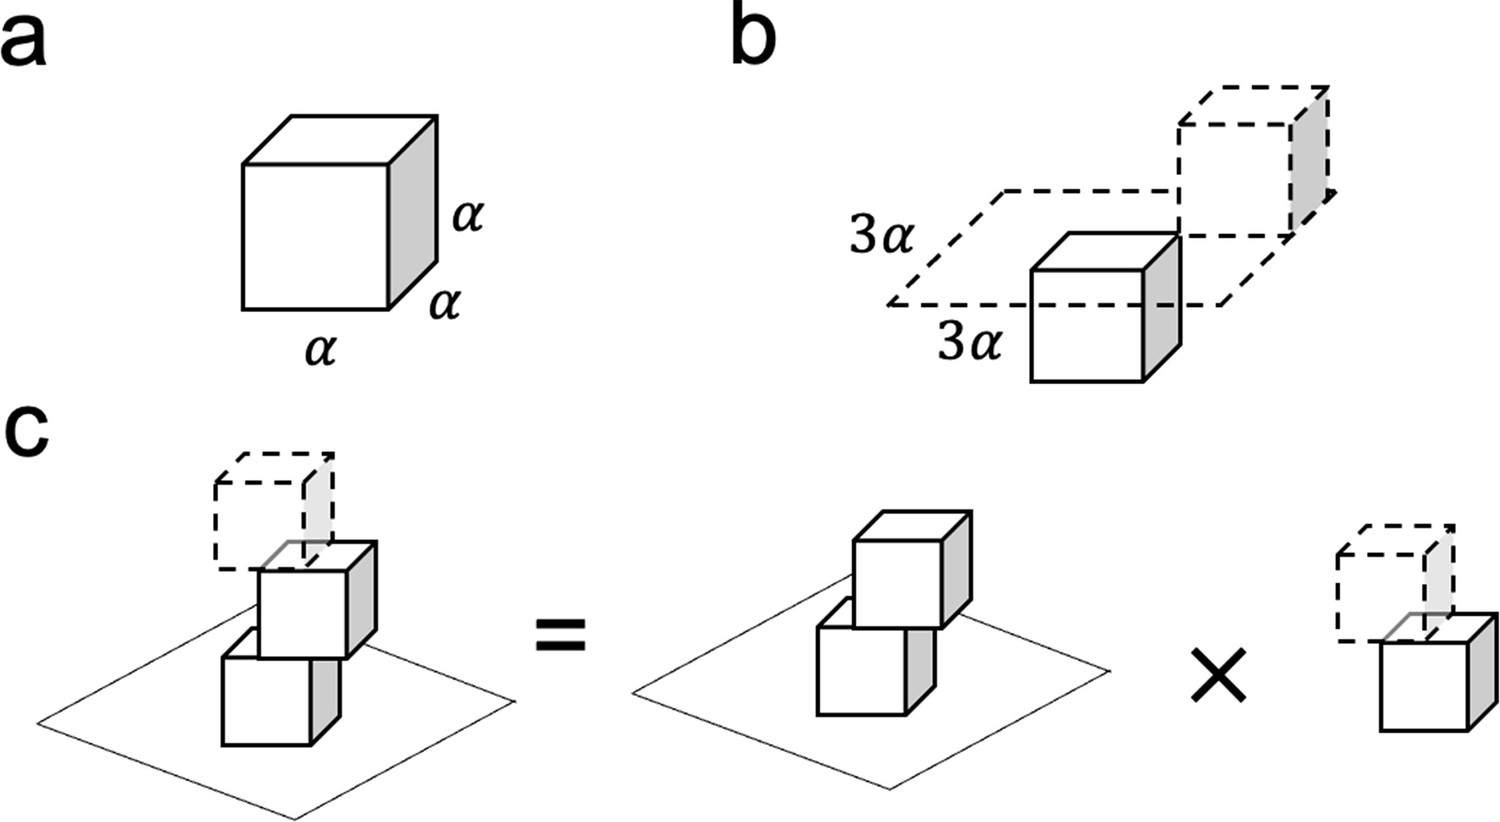
An illustration of the procedure to estimate the possible number of configurations when blocks have an aspect ratio of .
(a) The cubic block with the length, width and height are . (b) Constructing a configuration by stacking two cubic blocks. The upper block could only be placed within a area to guarantee contact with the lower block. (c) A three-block configuration can be viewed as stacking a cubic block on a two-block configuration.
Appendix 1—figure 2

An illustration of the procedure to estimate the possible number of configurations when blocks have the aspect ratio of .
(a) Three types of rectangular blocks with an aspect ratio of . (b) There are nine possible two-block configurations when combining blocks with an aspect ratio of . (c) A three-block configuration could be viewed as stacking a cubic block on a two-block configuration.
Author response image 1

Wall experiment to test the impact of external forces on the measurement of stochastic gravity.
(a) Experimental setting. We replicated the original setup with the addition of a wall implemented on one side. Left: the overall experimental scene; Right, the scene shown to participants. (b) Human behaviors. Three participants conducted this experiment, and their responses consistently showed normal distributions without any skewness, suggesting that their judgments were not affected by the presence of the wall. These results support our claim that humans’ judgments on stability were not affected by potential concerns regarding external forces.
Author response image 2

Trajectory experiment to test the stochastic nature of gravity represented in the mind.
(a) Experiment design. In this experiment, participants were required to use a mouse to determine the landing point of a parabolic trajectory (marked by the green dot), obscured by a grey rectangle. Note that the parabolic trajectory was determined only by gravity, and no external disturbances were introduced. The parameters used in this experiment are detailed in the upper right corner. (b) Predictive errors from three participants. The predictive errors from all three participants conform to Gaussian distributions with non-negligible variances. These results suggest the notion of an inherent stochastic property of gravity represented in the mind.
Author response image 3

RL learning curves as a function of θ angle with different sampling densities and learning rates.
Learning rates were adjusted to low (a), intermediate (b) and high (c) settings, while sampling densities were chosen at four levels: 5x5, 11x11, 31x31, and 61x61 shown from the left to the right. Two key observations emerged from the simulations as the reviewer predicted. First, higher learning rates resulted in a more rapid decline in learning curves but introduced larger variances. Second, increased sampling density necessitated more iterations for convergence. Note that in all simulations, we limited the iterations to 1,000 times (as opposed to 100,000 times reported in the manuscript) to demonstrate the trend without excessive computational demands.
Author response image 4

Wall experiment to test the impact of external forces on the measurement of stochastic gravity.
(a) Experimental setting. We replicated the original setup with the addition of a wall implemented on one side. Left: the overall experimental scene; Right, the scene shown to participants. (b) Human behaviors. Three participants conducted this experiment, and their responses consistently showed normal distributions without any skewness, suggesting that their judgments were not affected by the presence of the wall. These results support our claim that humans’ judgments on stability were not affected by potential concerns regarding external forces.
Author response image 5

Differentiating Subjectivity from Objectivity.
In both Experiment 1 (a) and Experiment 2 (b), participants were instructed to determine which shape appeared most stable. Objectively, in the absence of external forces, all shapes possess equal stability. Yet, participants typically perceived the shape on the left as the most stable because of its larger base area. The discrepancy between objective realities and subjective feelings, as we propose, is attributed to the human mind representing gravity’s direction as a Gaussian distribution, rather than as a singular value pointing directly downward.
Author response image 6

Wall experiment to test the impact of external forces on the measurement of stochastic gravity.
(a) Experimental setting. We replicated the original setup with the addition of a wall implemented on one side. Left: the overall experimental scene; Right, the scene shown to participants. (b) Human behaviors. Three participants conducted this experiment, and their responses consistently showed normal distributions without any skewness, suggesting that their judgments were not affected by the presence of the wall. These results support our claim that humans’ judgments on stability were not affected by potential concerns regarding external forces.
Author response image 7

Trajectory experiment to test the stochastic nature of gravity represented in the mind.
(a) Experiment design. In this experiment, participants were required to use a mouse to determine the landing point of a parabolic trajectory (marked by the green dot), obscured by a grey rectangle. Note that the parabolic trajectory was determined only by gravity, and no external disturbances were introduced. The parameters used in this experiment are detailed in the upper right corner. (b) Predictive errors from three participants. The predictive errors from all three participants conform to Gaussian distributions with non-negligible variances. These results suggest the notion of an inherent stochastic property of gravity represented in the mind.
Author response image 8

Perception Uncertainty in 3D stacks structures.
(a) Experimental design. A pair of two stacks with similar placements of blocks were presented sequentially to participants, who were instructed to judge whether the stacks were identical and to rate their confidence in this judgment. Each stack was presented on the screen for 2 seconds. (b) Behavior Performance. Three participants (2 males, age range: 24-30) were recruited to the experiment. The confidence in determining whether a pair of stacks remained unchanged rapidly decreased when each block had a very small displacement, suggesting humans could keenly perceive trivial changes in configurations. The x-axis denotes the difference in block placement between stacks, with the maximum value (0.4) corresponding to the length of a block’s short side. The Y-axis denotes humans’ confidence in reporting no change. The red curve illustrates the average confidence level across 4 runs, while the yellow curve is the confidence level of each run.
Additional files
Download links
A two-part list of links to download the article, or parts of the article, in various formats.
Downloads (link to download the article as PDF)
Open citations (links to open the citations from this article in various online reference manager services)
Cite this article (links to download the citations from this article in formats compatible with various reference manager tools)
A stochastic world model on gravity for stability inference
eLife 12:RP88953.
https://doi.org/10.7554/eLife.88953.3


