Absence of electron-transfer-associated changes in the time-dependent X-ray free-electron laser structures of the photosynthetic reaction center
- Department of Applied Chemistry, The University of Tokyo, Japan
- Research Center for Advanced Science and Technology, The University of Tokyo, Japan
Figures
Figure 1

Electron-transfer pathways along the L- and M-branches in PbRC from B. viridis.
The PbRC is composed of the L (red), M (blue), H (gold), and C (yellow) subunits. [PLPM]: BChlb pair; BL and BM: accessory BChlb; HL and HM: BPheob; QA: primary quinone (menaquinone); Fe: non-heme Fe complex.
Figure 2 with 1 supplement

Em profiles in the XFEL structures for dataset a.
(a) 0 ps. (b) 5 ps. (c) 300 ps.
Figure 2—figure supplement 1
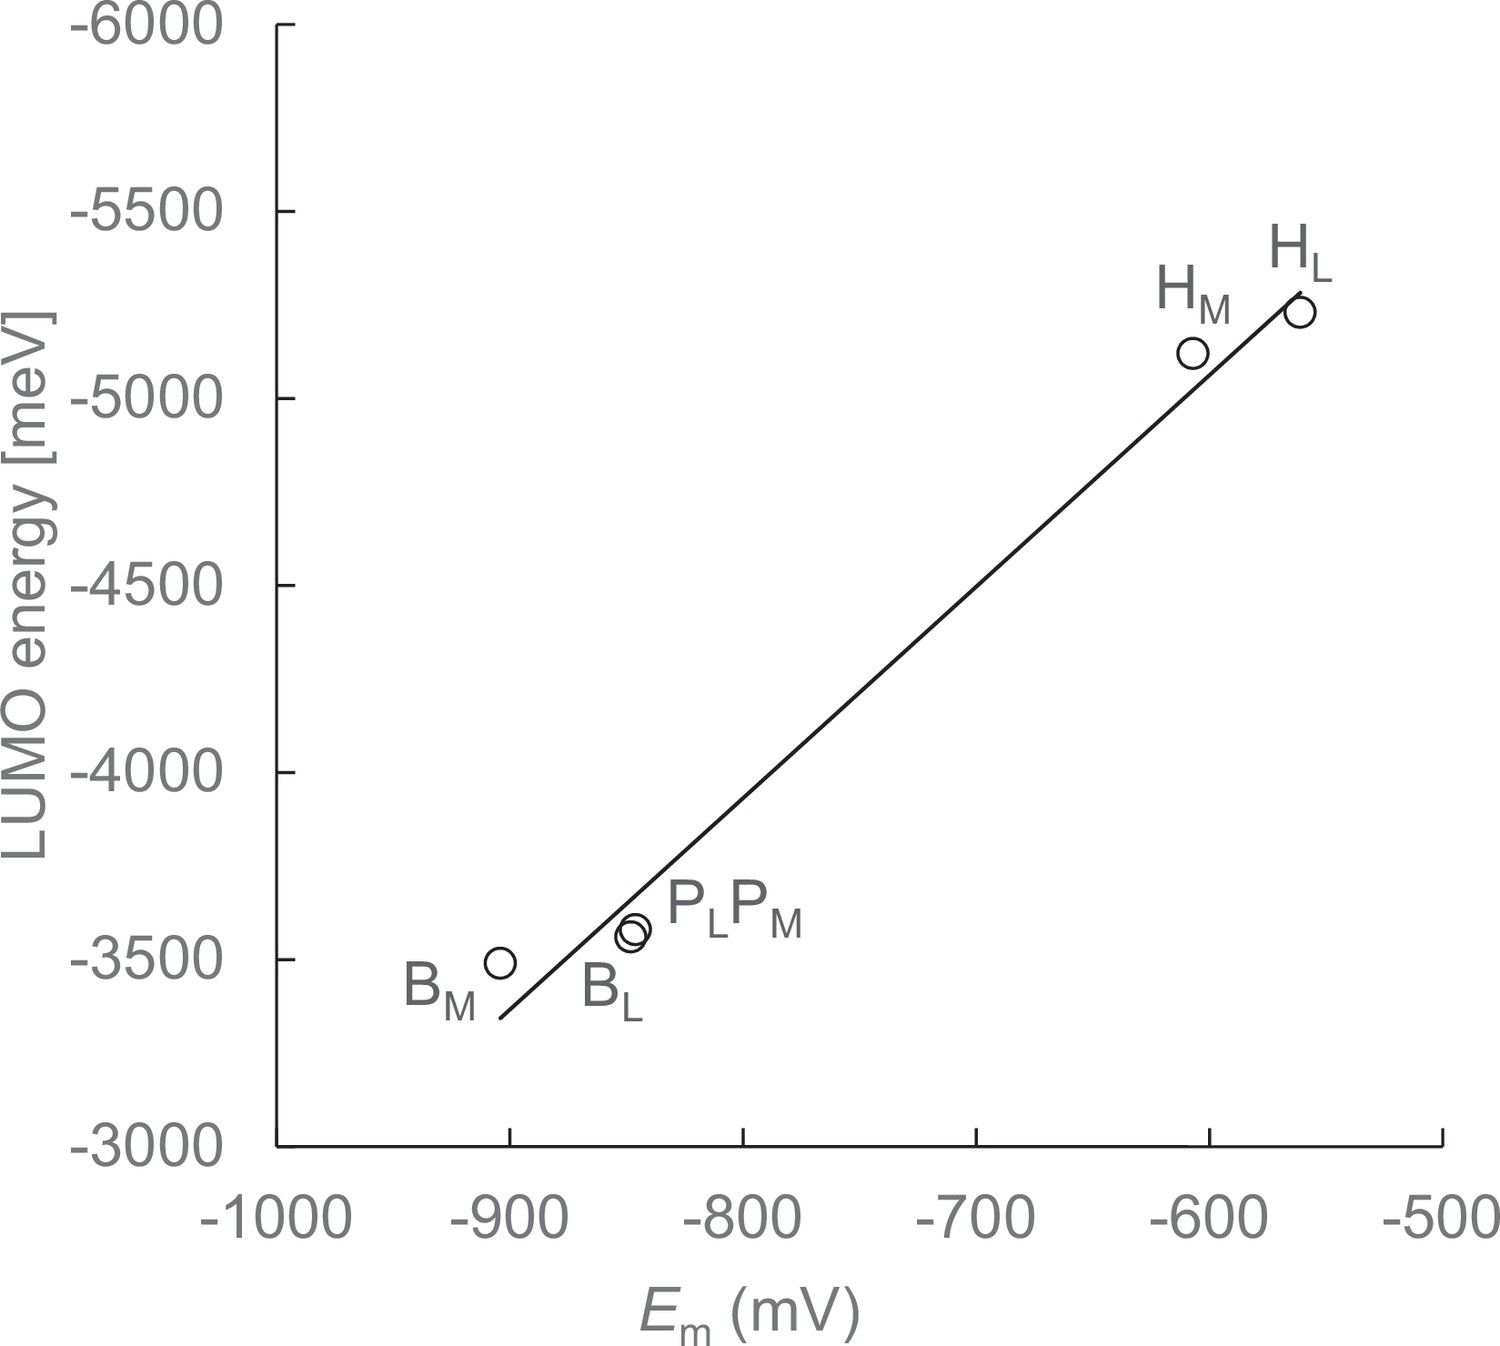
Em values calculated solving the linear Poisson-Boltzmann equation and LUMO energy levels calculated using a QM/MM approach in the dark-state structure.
-
Figure 2—figure supplement 1—source data 1
Numerical source data for Figure 2—figure supplement 1.
- https://cdn.elifesciences.org/articles/88955/elife-88955-fig2-figsupp1-data1-v1.zip
Figure 3

Em profiles in the XFEL structures for dataset b.
(a) 0 ps. (b) 1 ps. (c) 5 ps. (d) 20 ps. (e) 300 ps. (f) 8 μs.
Figure 4

Residue pairs that are responsible for Em(BL)>Em(BM).
Figure 5

Residue pairs that are responsible for Em(HL)>Em(HM).
Figure 6

Time-dependent Em changes for BChlb and BPheob in the XFEL structures.
(a) Dataset a. (b) Dataset b. ΔEm denotes the Em shift with respect to the dark-state structure. Black solid lines: PL; black dotted lines: PM; blue solid lines BL; blue dotted lines: BM; red solid lines: HL; red dotted lines: HM.
-
Figure 6—source data 1
Numerical source data for Figure 6.
- https://cdn.elifesciences.org/articles/88955/elife-88955-fig6-data1-v1.zip
Figure 7

Time-dependent changes in the lowest frequency out-of-plane modes of the chlorin rings in the XFEL structures (dataset a). (a) PL. (b) PM. (c) BL. (d) BM. (e) HL. (f) HM. (g) Typical lowest frequency out-of-plane modes of the chlorin rings.
Sad: saddling (red); ruf: ruffling (blue); dom: doming (green); wav(x, y): waving (x, y) (gray, dark blue); pro: propellering (orange). Solid and dotted lines indicate L- and M-branches, respectively. See Supplementary file 1 for the absolute values in the dark state for dataset a.
-
Figure 7—source data 1
Numerical source data for Figure 7.
- https://cdn.elifesciences.org/articles/88955/elife-88955-fig7-data1-v1.zip
Figure 8

Time-dependent changes in the lowest frequency out-of-plane modes of the chlorin rings in the XFEL structures (dataset b). (a) PL. (b) PM. (c) BL. (d) BM. (e) HL. (f) HM.
Sad: saddling (red); ruf: ruffling (blue); dom: doming (green); wav(x, y): waving (x, y) (gray, dark blue); pro: propellering (orange). Solid and dotted lines indicate L- and M-branches, respectively. See Supplementary file 2 for the absolute values in the dark state for dataset b Figure 8—source data 1.
-
Figure 8—source data 1
Numerical source data for Figure 8.
- https://cdn.elifesciences.org/articles/88955/elife-88955-fig8-data1-v1.zip
Figure 9

Time-dependent Em changes for QA in the XFEL structures.
(a) Dataset a. (b) Dataset b. ΔEm denotes the Em shift with respect to the dark-state structure. Note that the calculated Em(QA) values for dataset a and dataset b in the dark structure are –223 mV and –209 mV, respectively, which are comparable to experimentally measured values of –150 mV for PbRC from B. viridis (menaquinone) (Prince et al., 1976) and –180 mV for PbRC from R. sphaeroides (ubiquinone) (Prince and Dutton, 1976).
-
Figure 9—source data 1
Numerical source data for Figure 9.
- https://cdn.elifesciences.org/articles/88955/elife-88955-fig9-data1-v1.zip
Tables
Table 1
Contributions of the L/M residue pairs that are responsible for Em(BL)>Em(BM) (more than 10 mV) in the dark-state structure (mV).
Difference: [contribution of subunit L to Em(BL)] + [contribution of subunit M to Em(BL)] – [contribution of subunit L to Em(BM)] – [contribution of subunit M to Em(BM)].
| Subunit L | Em(BL) | Em(BM) | Subunit M | Em(BL) | Em(BM) | Difference |
|---|---|---|---|---|---|---|
| Phe-L181 | 0 | 17 | Tyr-M208 | 39 | –3 | 25 |
| His-L144 | –8 | –2 | Glu-M171 | –14 | –45 | 25 |
| Asn-L158 | 5 | –6 | Thr-M185 | –3 | –4 | 12 |
Table 2
Contributions of the L/M residue pairs that are responsible for Em(HL)>Em(HM) (more than 10 mV) in the dark-state structure (mV).
Difference: [contribution of subunit L to Em(HL)] + [contribution of subunit M to Em(HL)] – [contribution of subunit L to Em(HM)] – [contribution of subunit M to Em(HM)].
| Subunit L | Em(HL) | Em(HM) | Subunit M | Em(HL) | Em(HM) | Difference |
|---|---|---|---|---|---|---|
| Ala-L120 | –4 | 0 | Asn-M147 | 0 | –42 | 38 |
| Asp-L218 | –2 | –22 | Trp-M252 | 1 | 0 | 20 |
| Arg-L103 | 77 | 3 | Arg-M130 | 3 | 59 | 17 |
| Ala-L237 | –2 | 0 | Ser-M271 | 3 | –16 | 16 |
| Lys-L110 | 17 | 2 | Ala-M137 | 0 | 3 | 14 |
| Val-L219 | 1 | 5 | Thr-M253 | 17 | 1 | 11 |
| His-L211 | 1 | 0 | Arg-M245 | 14 | 4 | 11 |
Table 3
Residues that shift Em(HL) most significantly during putative electron transfer in the XFEL structures (dataset a) (mV).
The same residues are highlighted in the same colors for clarity.
| Dataset a | Shift | Shift | ||
|---|---|---|---|---|
| 0–5 ps | Ser-L176 | 5 | Cys-M210 | 4 |
| Thr-M220 | –7 | BL | –5 | |
| 5–300 ps | BL | 7 | Gly-M209 | 3 |
| Gly-M211 | –11 | Leu-M212 | –8 |
Table 4
Residues that shift Em(HL) most significantly during putative electron transfer in the XFEL structures (dataset b) (mV).
The same residues are highlighted in the same colors for clarity.
| Dataset b | Shift | Shift | ||
|---|---|---|---|---|
| 0–1 ps | Ser-L238 | 8 | Ser-L176 | 7 |
| BL | –7 | Leu-M213 | –3 | |
| 1–5 ps | Gly-M211 | 6 | Leu-M213 | 5 |
| Ser-L238 | –6 | Thr-M253 | –5 | |
| 5–20 ps | BL | 12 | Thr-M253 | 7 |
| Leu-M213 | –4 | PM | –3 | |
| 20–300 ps | Ser-L238 | 3 | Gly-M211 | 2 |
| BL | –10 | Glu-L212 | –4 | |
| 300 ps to 8 μs | Glu-L212 | 4 | Leu-M213 | 4 |
| BL | –6 | Gly-M211 | –5 |
Table 5
Induced out-of-plane distortion of HL and HM in the PbRC protein environment of the dark structure for dataset a in response to the reduction (Å).
| Saddling | Ruffling | Doming | Waving | Propellering | ||
|---|---|---|---|---|---|---|
| B2u | B1u | A2u | Eg(x) | Eg(y) | A1u | |
| HL | 0.18 | 0.35 | –0.10 | 0.13 | –0.11 | 0.13 |
| HL•– | 0.24 | 0.35 | –0.09 | 0.12 | –0.12 | 0.13 |
| (PL•+HL•–) | (0.22) | (0.36) | (–0.07) | (0.13) | (–0.13) | (0.13) |
| HL/HL•– difference | 0.06 | 0.00 | 0.01 | –0.01 | –0.01 | 0.00 |
| HM | 0.06 | 0.40 | –0.20 | 0.37 | 0.12 | 0.19 |
| HM•– | 0.12 | 0.38 | –0.22 | 0.33 | 0.09 | 0.22 |
| (PL•+HM•–) | (0.14) | (0.38) | (–0.22) | (0.33) | (0.10) | (0.22) |
| HM/HM•– difference | 0.06 | –0.02 | –0.02 | –0.04 | –0.03 | 0.03 |
-
Table 5—source data 1
Numerical source data for Table 5.
- https://cdn.elifesciences.org/articles/88955/elife-88955-table5-data1-v1.zip
Table 6
Induced out-of-plane distortion of HL and HM in the PbRC protein environment of the dark structure for dataset b in response to the reduction (Å).
| Saddling | Ruffling | Doming | Waving | Propellering | ||
|---|---|---|---|---|---|---|
| B2u | B1u | A2u | Eg(x) | Eg(y) | A1u | |
| HL | 0.13 | 0.35 | –0.13 | 0.07 | –0.09 | 0.20 |
| HL•– | 0.25 | 0.34 | –0.02 | 0.12 | –0.16 | 0.13 |
| (PL•+HL•–) | (0.23) | (0.34) | (–0.03) | (0.12) | (–0.16) | (0.12) |
| HL/HL•– difference | 0.12 | –0.01 | 0.11 | 0.05 | –0.07 | –0.07 |
| HM | 0.08 | 0.57 | –0.11 | 0.16 | 0.20 | 0.32 |
| HM•– | 0.16 | 0.36 | –0.19 | 0.36 | 0.18 | 0.21 |
| (PL•+HM•–) | (0.16) | (0.36) | (–0.20) | (0.36) | (0.18) | (0.21) |
| HM/HM•– difference | 0.08 | –0.21 | –0.08 | 0.20 | –0.02 | –0.11 |
-
Table 6—source data 1
Numerical source data for Table 6.
- https://cdn.elifesciences.org/articles/88955/elife-88955-table6-data1-v1.zip
Additional files
-
Supplementary file 1
Out-of-plane distortions in the PbRC protein environment of the dark structure for dataset a (Å).
- https://cdn.elifesciences.org/articles/88955/elife-88955-supp1-v1.docx
-
Supplementary file 2
Out-of-plane distortions in the PbRC protein environment of the dark structure for dataset b (Å).
- https://cdn.elifesciences.org/articles/88955/elife-88955-supp2-v1.docx
-
Supplementary file 3
Atomic charges of BChlb and BPheob.
- https://cdn.elifesciences.org/articles/88955/elife-88955-supp3-v1.docx
-
MDAR checklist
- https://cdn.elifesciences.org/articles/88955/elife-88955-mdarchecklist1-v1.docx
Download links
A two-part list of links to download the article, or parts of the article, in various formats.
Downloads (link to download the article as PDF)
Open citations (links to open the citations from this article in various online reference manager services)
Cite this article (links to download the citations from this article in formats compatible with various reference manager tools)
Absence of electron-transfer-associated changes in the time-dependent X-ray free-electron laser structures of the photosynthetic reaction center
eLife 12:RP88955.
https://doi.org/10.7554/eLife.88955.4


