Analysis of NIH K99/R00 awards and the career progression of awardees
- Department of Medical Social Sciences, Feinberg School of Medicine, Northwestern University, United States
- Department of Biology, Tufts University, United States
- Department of Health, Nutrition, and Food Sciences, Florida State University, United States
- Section of Genetic Medicine, Department of Medicine, University of Chicago, United States
- Department of Systems Pharmacology and Translational Therapeutics, University of Pennsylvania, United States
- Division of Molecular and Cellular Pathology, Department of Pathology, Heersink School of Medicine, University of Alabama at Birmingham, United States
Figures
Figure 1

Rate of K99 and R00 awards and conversion by year.
(A) Total extramural K99 awards and R00 awards made by year. (B) Annual rolling conversion rate of R00 award activation compared to the number of K99 awards activated in the prior year. The formula is: (X/(Y − 1)) × 100, where X is the number of R00 awards made in a year and Y is the number of K99 awards made in a year. Average rolling retention rate (81.8%) from 2008 to 2022 shown in dashed line. (C) Annual rolling conversion rate of R00 award activation compared to the number of K99 awards activated in the prior year stratified by whether the R00 was activated at the same or different institution as the K99 award. Average retention rates for R00 at different institution (93.9%) and the same institution (69.4%) are shown in dashed lines. (D) Total number of extramural R00 awards per year at the same institution or different institution. (E) Annual stacked bar plots showing the percentage of R00 awards and whether they were at the same institution or different institution. (F) Within the K99 to R00 conversions at the same institution, annual stacked bar plots showing the percentage of R00 awards and whether they were at the same department or different department.
-
Figure 1—source data 1
Source data for the number of K99 and R00 awards, and rolling conversion rate.
- https://cdn.elifesciences.org/articles/88984/elife-88984-fig1-data1-v1.xlsx
Figure 2
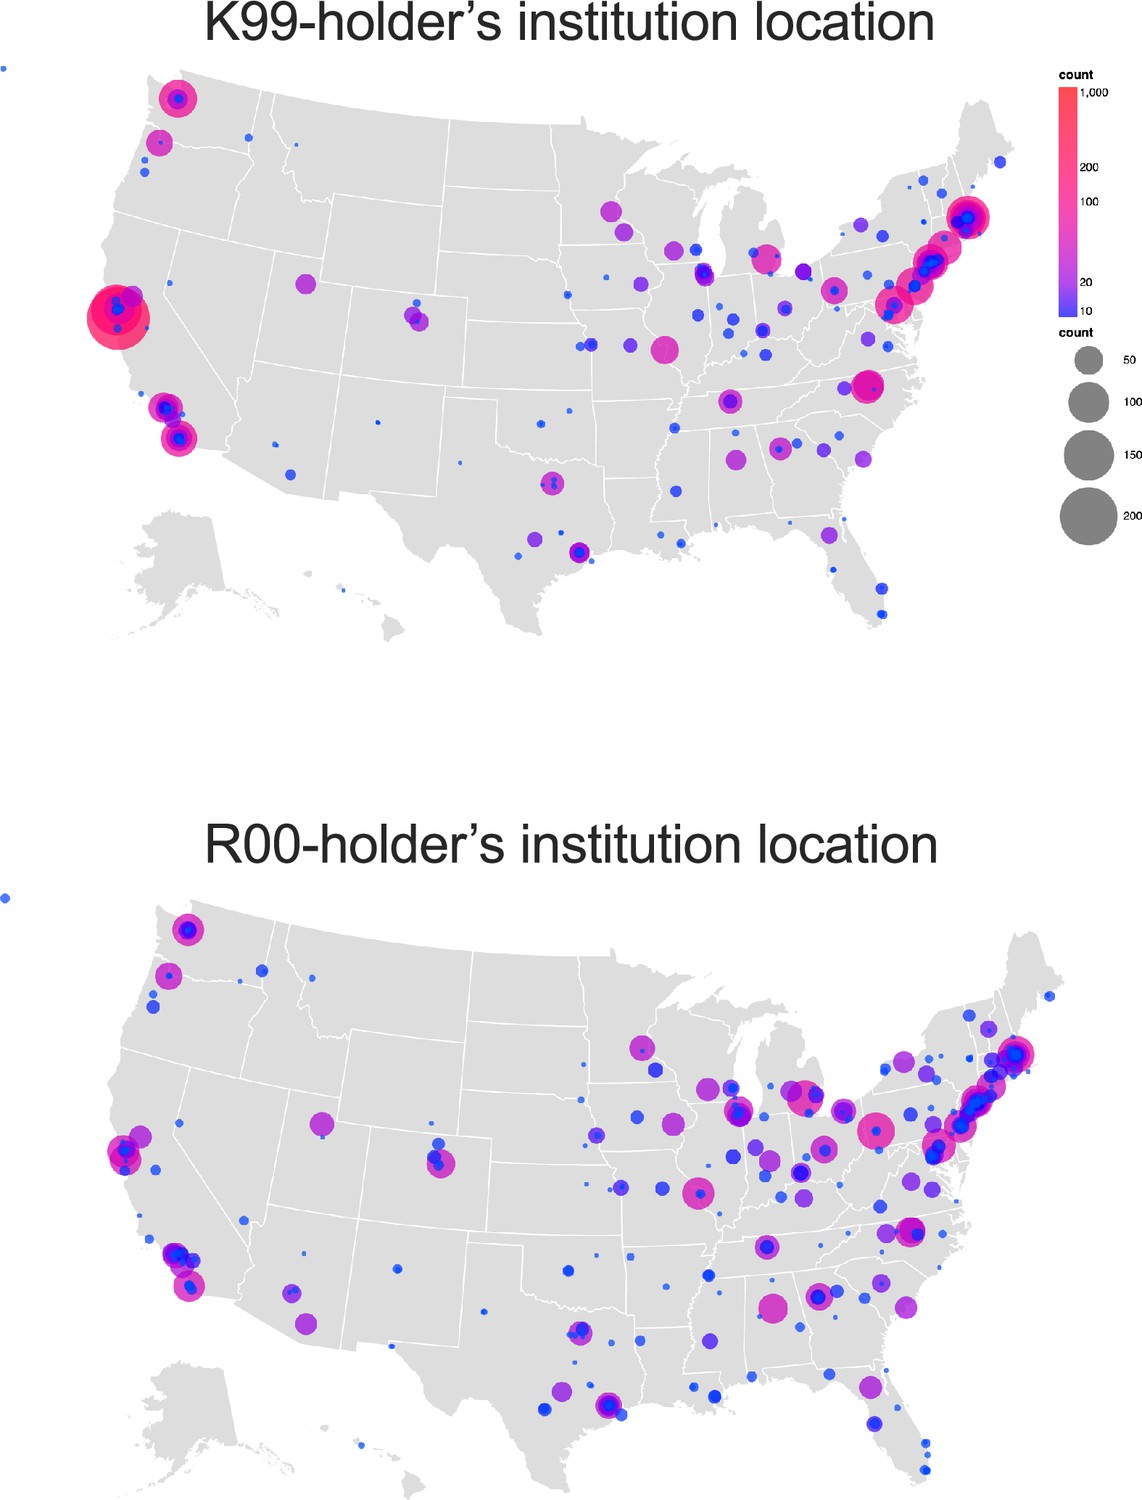
Cartographic representation of the number of K99 and R00 awards by institutional location and state from 2007 to 2008 through 2021–2022.
Note no individual award or grant is counted more than 1 time.
-
Figure 2—source data 1
Source data containing the list of K99 and R00 awards and the location coordinates used to generate the map figure.
- https://cdn.elifesciences.org/articles/88984/elife-88984-fig2-data1-v1.xlsx
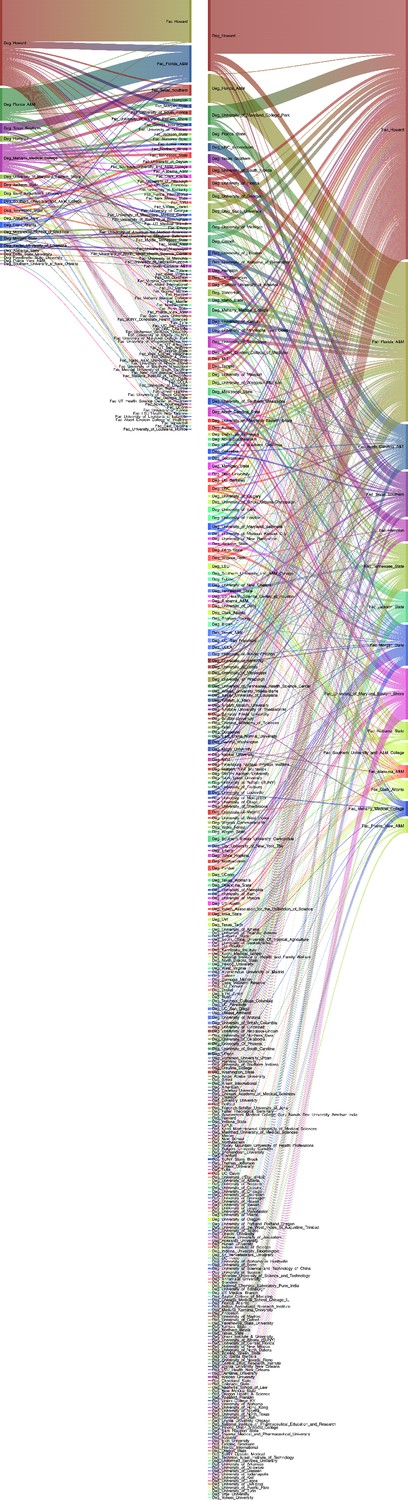
Figure 3

Sankey diagram of all successful K99 to R00 award transfers from 2007 to 2022 with the K99 institution on the left and R00 institution on the right.
An interactive version of this figure can be found at: Interactive Sankey diagram can be found at: https://k99tor00.shinyapps.io/K99-R00_Sankey/. Source data for Figure 3 are in Supplementary file 3.
Figure 4
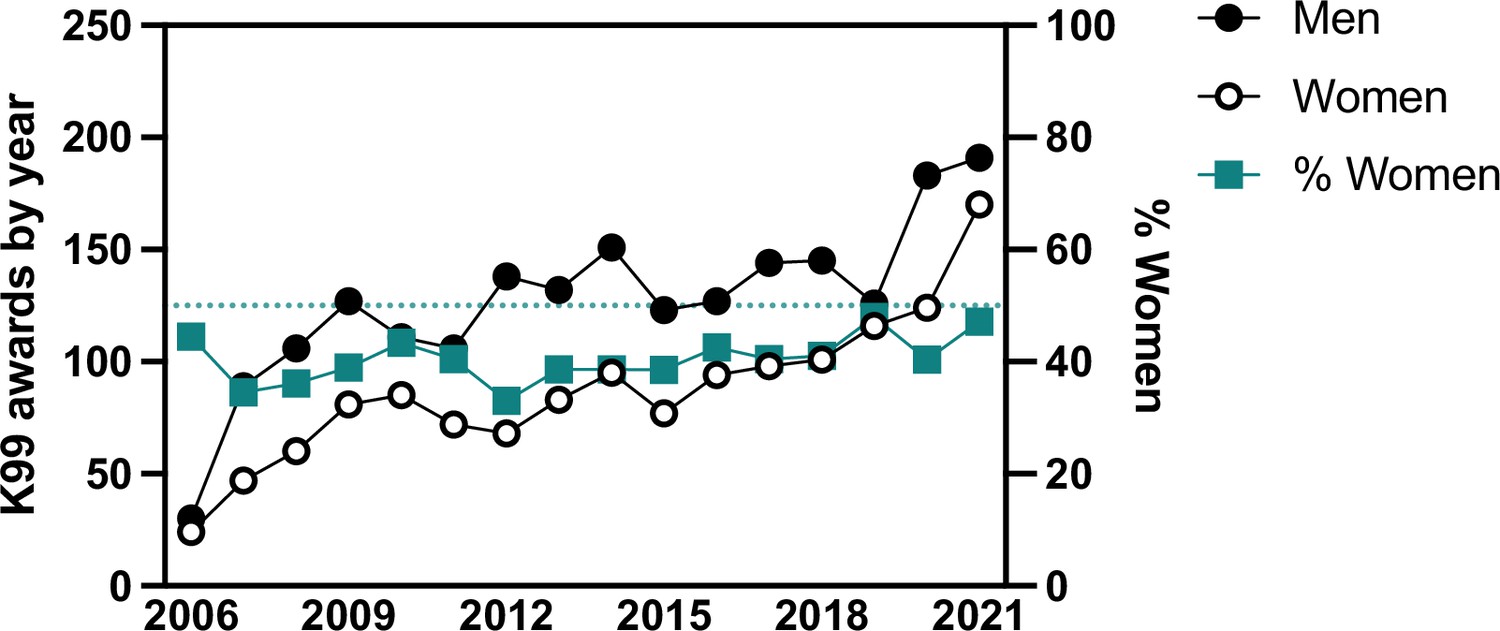
Number of K99 awards per year to either men or women (left Y-axis) and the percentage of K99 awardees that are women (right Y-axis).
-
Figure 4—source data 1
Source data of the number of K99 awards by year stratified by men or women.
- https://cdn.elifesciences.org/articles/88984/elife-88984-fig4-data1-v1.xlsx
Figure 5
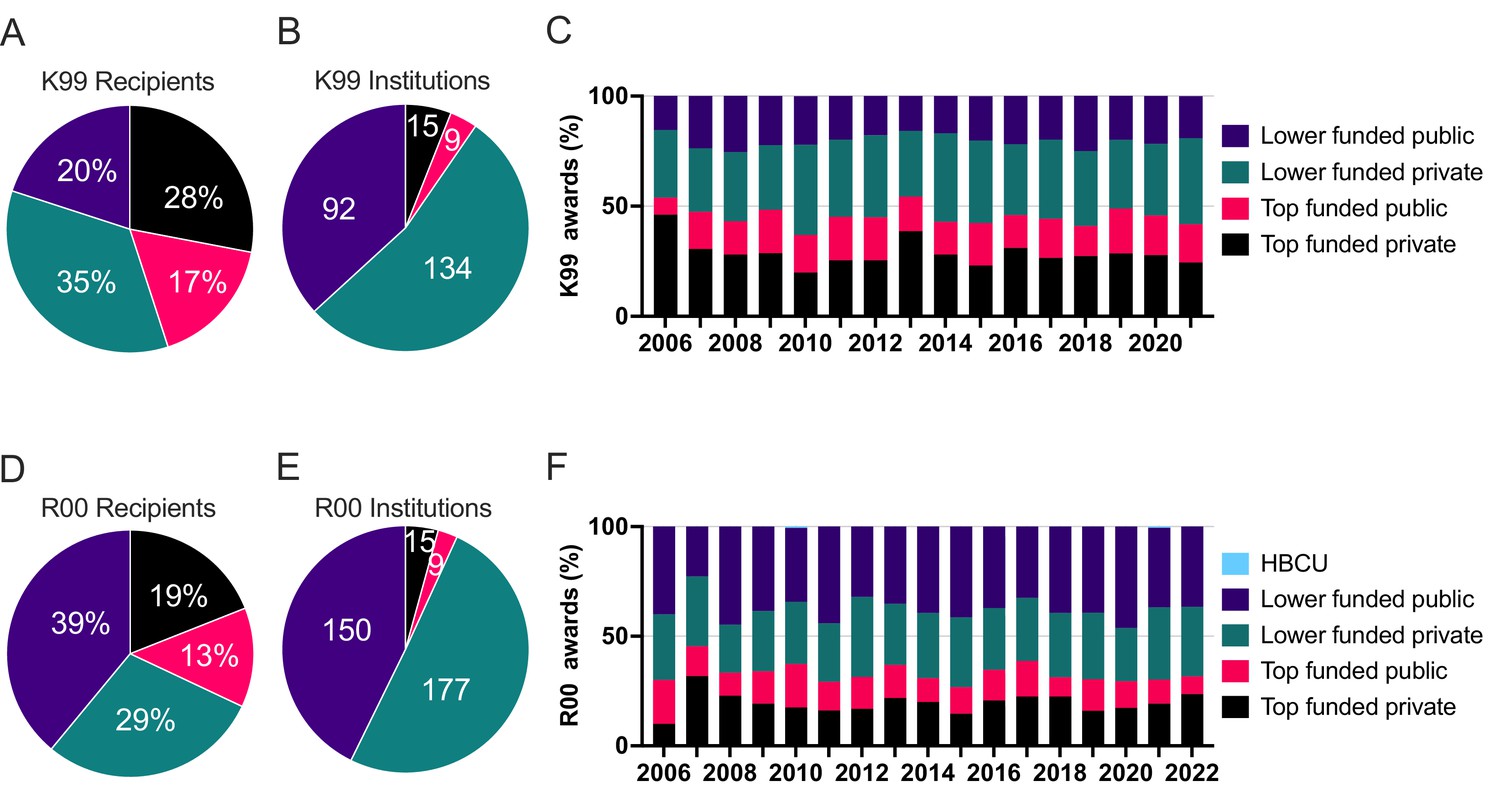
The percentage of recipients by the institution type for K99 (A) and R00 (D) and the number of different institutions within institution type that has received K99 (B) and R00 (E) awards from 2006 to 2022.
The percentage of institution types receiving K99 (C) and R00 (F) awards by year from 2006 to 2022.
-
Figure 5—source data 1
Source data of the number of K99 and R00 awards made at each institution type per year.
- https://cdn.elifesciences.org/articles/88984/elife-88984-fig5-data1-v1.xlsx
Figure 6
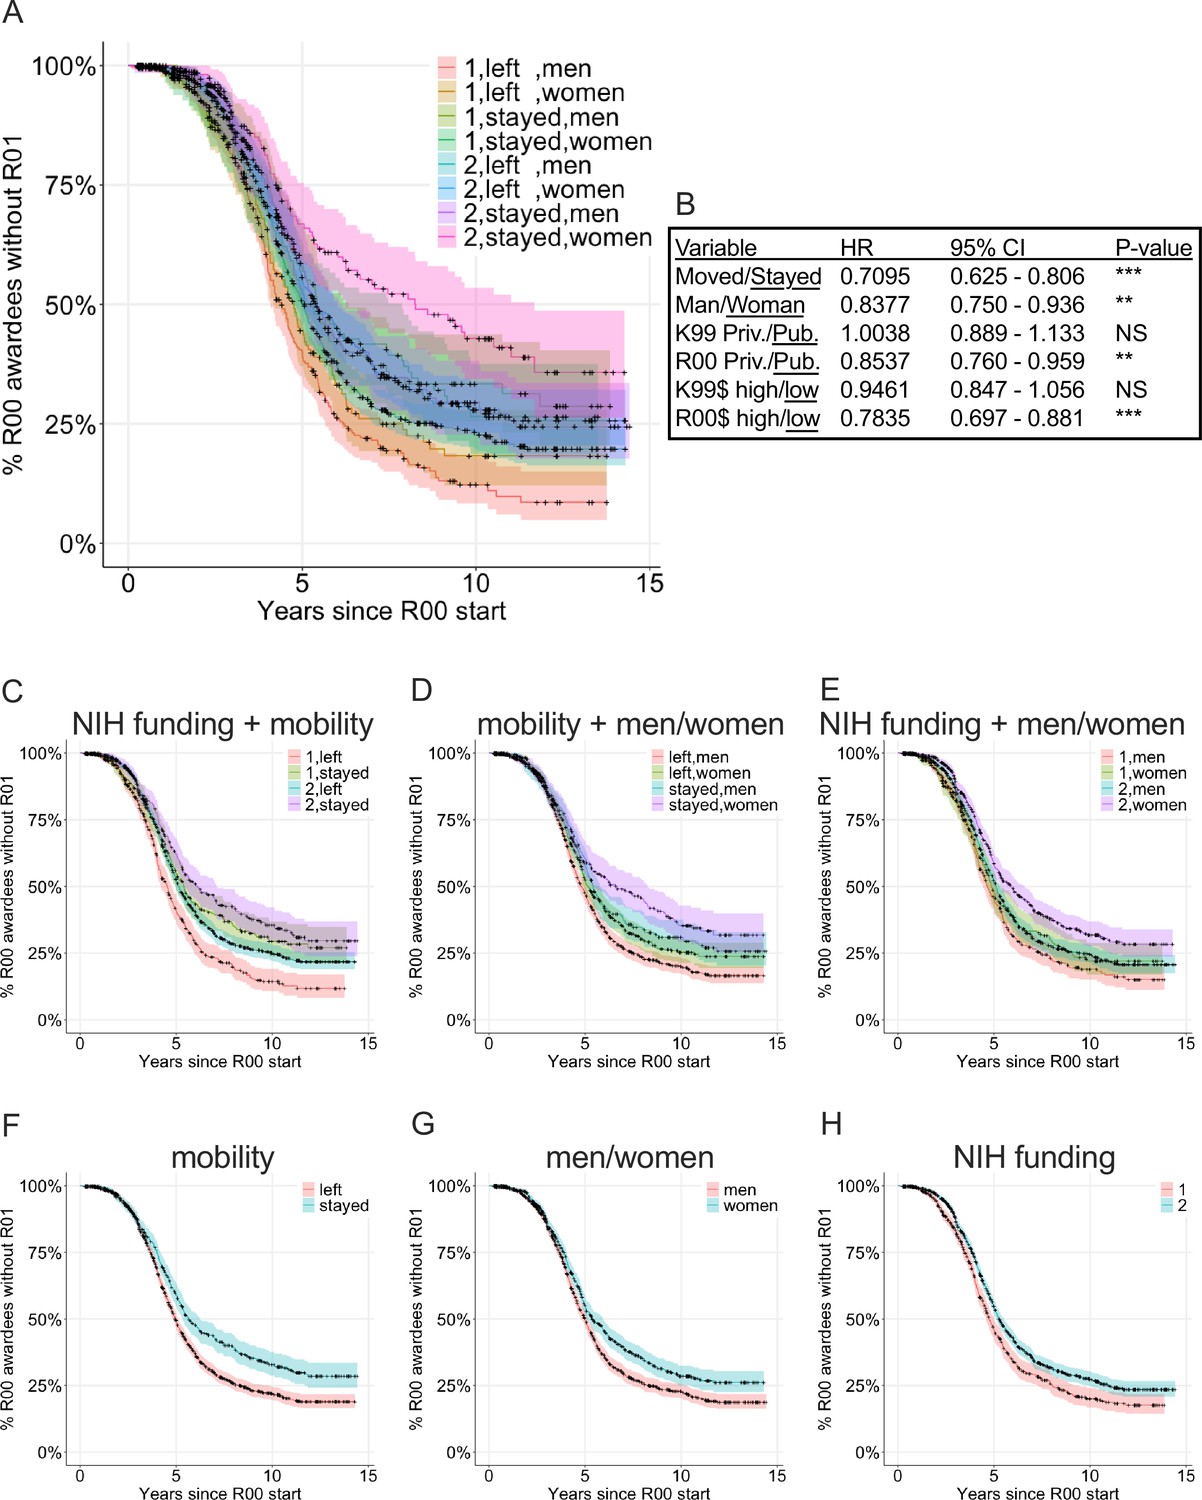
Cox proportional hazard model examining K99/R00 awardees success at receiving subsequent major extramural National Institutes of Health (NIH) awards by mobility, classified as women or men, and R00 institutional NIH funding level.
Mobility is classified whether the K99 awardee moved to a new institution for the R00 award activation or stayed at the same institution. Classification of women or men was determined by name (see Methods for description and limitations). R00 institution funding level is classified as: 1: 25 highest NIH-funded institutions in 2022 and 2: all other institutions. (A) Survival curve demonstrating all eight possible classifications. (B) Cox proportional hazard model hazard ratio, 95% confidence interval, and p-value. Survival plots showing the individual components of the full model including (C) NIH funding + mobility, (D) mobility + women/men, (E) NIH funding + women/men, (F) mobility, (G) women/men, and (H) NIH funding.
-
Figure 6—source data 1
The source data used to calculate the hazard ratio including whether R00 awardees received a future award, were men or women, were at private or public K99 institution, were at private or public R00 institution, were at high or lower funded K99 institution, were at high or lower funded R00 institution, and whether they moved to a new institution for the R00 award phase.
- https://cdn.elifesciences.org/articles/88984/elife-88984-fig6-data1-v1.xlsx
Figure 7 with 2 supplements
Sankey diagram of HBCU doctoral degrees and where those degree holders are faculty members and of HBCU faculty and where they received their doctoral degrees from.
(A) Sankey diagram of faculty members that received doctoral degrees from HBCUs (on left) and the faculty institution they moved to (on right). (B) Sankey diagram of faculty members at HBCUs (on right) and where they received their doctoral degrees (on left). Interactive versions of these figures can be found at: https://dantyrr.github.io/K99-R00-analysis/HBCU_deg.html for A and https://dantyrr.github.io/K99-R00-analysis/HBCU_faculty.html for B. Source data for Figure 7 are from Wapman et al. and are available on Zenodo at https://doi.org/10.5281/zenodo.6941651 (Wapman et al., 2022).
Figure 7—figure supplement 1

Pie charts showing where faculty from biology, biomedical, health, and related fields from 32 select institutions received their doctoral degrees (from 2010 to 2020) by percentage.
Colors used were selected as a colorblind safe color scheme.
-
Figure 7—figure supplement 1—source data 1
Source data of where faculty members received their terminal doctoral degree from 2010 to 2020.
- https://cdn.elifesciences.org/articles/88984/elife-88984-fig7-figsupp1-data1-v1.xlsx
-
Figure 7—figure supplement 1—source data 2
Source data of the institution type of doctoral degree for faculty at each institution from 2010 to 2020.
- https://cdn.elifesciences.org/articles/88984/elife-88984-fig7-figsupp1-data2-v1.xlsx
Figure 7—figure supplement 2

Pie charts showing the type of institution that faculty from biology, biomedical, health, and related fields from 32 select institutions received their doctoral degrees (from 2010 to 2020) by percentage.
Colors used were selected as a colorblind safe color scheme.
Tables
Table 1
Number and frequency of R00 faculty hires from specific types of K99 institutions from 2006 to 2022.
Note, each column sums to 100%. *Excluding self-hires to the same institution.
| Top NIH funding, private R00 n (%) | Top NIH funding, public R00 n (%) | Not top NIH funding, private R00 n (%) | Not top NIH funding, public R00 n (%) | |
|---|---|---|---|---|
| Top NIH funding, private K99 | 295 (56.0%) 105 (31.2%)* | 71 (20.3%) | 179 (22.5%) | 196 (19.0%) |
| Top NIH funding, public K99 | 47 (8.9%) | 152 (43.5%) 44 (18.3%)* | 94 (11.8%) | 174 (16.9%) |
| Not top NIH funding, private K99 | 157 (29.8%) | 95 (27.2%) | 437 (55.0%) 252 (41.3%)* | 251 (24.3%) |
| Not top NIH funding, public K99 | 28 (5.3%) | 31 (8.9%) | 85 (10.7%) | 411 (39.8%) 220 (26.2%)* |
| Column total | 527 (100%) | 349 (100%) | 795 (100%) | 1032 (100%) |
Table 2
Number and frequency of men and women receiving K99 and R00 awards and whether they successfully converted K99 to R00 awards from 2006 to 2022.
| N | % | |
|---|---|---|
| K99 recipients | 3474 | 100 |
| Men | 2028 | 58 |
| Women | 1395 | 40 |
| Unknown | 51 | 1 |
| R00 recipients | 2843 | 100 |
| Men | 1655 | 58 |
| Women | 1142 | 40 |
| Unknown | 46 | 1 |
| Successful K99–R00 transition | 2703 | 100 |
| Men | 1575 | 58 |
| Women | 1090 | 40 |
| Unknown | 38 | 1 |
Table 3
The number and frequency of K99 and R00 awardees by institution type.
Successful K99–R00 transitions show the K99 award institution from 2006 to 2022. The 2842 R00 recipients includes recipients of National Institutes of Health (NIH) intramural K99 awards.
| N | % | |
|---|---|---|
| K99 recipient institution | 3473 | 100 |
| Top funded private | 990 | 28.5 |
| Top funded public | 582 | 16.8 |
| Lower funded private | 1212 | 34.9 |
| Lower funded public | 689 | 19.8 |
| R00 recipient institution | 2842 | 100 |
| Top funded private | 549 | 19.3 |
| Top funded public | 368 | 12.9 |
| Lower funded private | 831 | 29.2 |
| Lower funded public | 1094 | 38.5 |
| Successful K99–R00 transition K99 institution | 2703 | 100 |
| Top funded private | 741 | 27.4 |
| Top funded public | 467 | 17.3 |
| Lower funded private | 940 | 34.8 |
| Lower funded public | 555 | 20.5 |
Table 4
Number and frequency of institution type that received K99 and R00 awardees from 2006 to 2022.
| N | % | |
|---|---|---|
| K99 recipient institution | 250 | 100 |
| Top funded private | 15 | 6.0 |
| Top funded public | 9 | 3.6 |
| Lower funded private | 134 | 53.6 |
| Lower funded public | 92 | 36.8 |
| R00 recipient institution | 351 | 100.0 |
| Top funded private | 15 | 4.3 |
| Top funded public | 9 | 2.6 |
| Lower funded private | 177 | 50.4 |
| Lower funded public | 150 | 42.7 |
Additional files
-
Supplementary file 1
Curated NIH Reporter dataset of K99 recipients from 2006 to 2022.
- https://cdn.elifesciences.org/articles/88984/elife-88984-supp1-v1.csv
-
Supplementary file 2
Curated NIH Reporter dataset of R00 recipients from 2006 to 2022.
- https://cdn.elifesciences.org/articles/88984/elife-88984-supp2-v1.csv
-
Supplementary file 3
Curated NIH Reporter dataset of matched K99 and R00 recipients from 2006 to 2022.
- https://cdn.elifesciences.org/articles/88984/elife-88984-supp3-v1.csv
-
MDAR checklist
- https://cdn.elifesciences.org/articles/88984/elife-88984-mdarchecklist1-v1.docx
Download links
A two-part list of links to download the article, or parts of the article, in various formats.
Downloads (link to download the article as PDF)
Open citations (links to open the citations from this article in various online reference manager services)
Cite this article (links to download the citations from this article in formats compatible with various reference manager tools)
Analysis of NIH K99/R00 awards and the career progression of awardees
eLife 12:RP88984.
https://doi.org/10.7554/eLife.88984.4


