The Alk receptor tyrosine kinase regulates Sparkly, a novel activity regulating neuropeptide precursor in the Drosophila central nervous system
- Department of Medical Biochemistry and Cell Biology, Institute of Biomedicine, University of Gothenburg, Sweden
- Department of Experimental Pathology, Immunology and Microbiology, Faculty of Medicine, American University of Beirut, Lebanon
- Julius-Maximilians-Universität Würzburg, Rudolf-Virchow-Center, Center for Integrative and Translational Bioimaging, Germany
- Department of Zoology, Stockholm University, Sweden
- Julius-Maximilians-Universität Würzburg, Biocenter, Theodor-Boveri-Institute, Neurobiology and Genetics, Germany
Figures
Figure 1 with 1 supplement
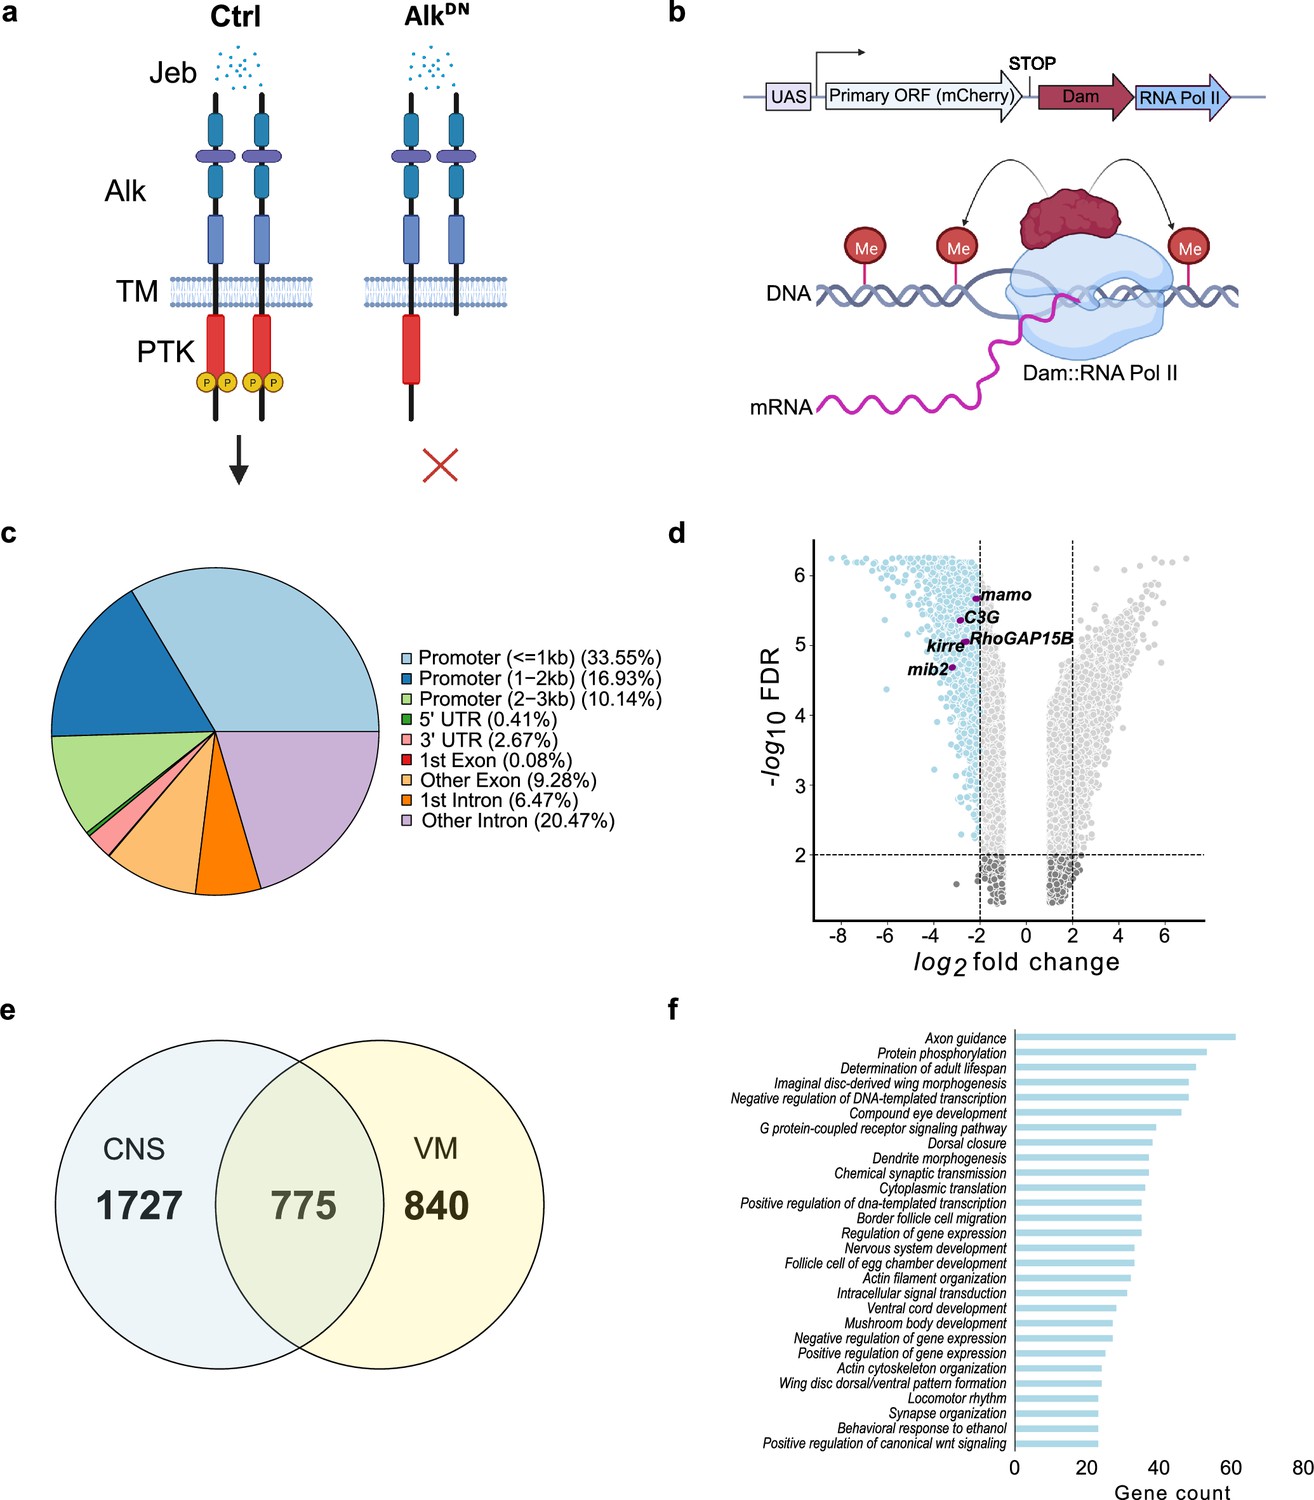
Targeted DamID (TaDa)-seq identifies novel Alk-regulated genes in the Drosophila larval central nervous system (CNS).
(a) Schematic overview of experimental conditions comparing wild-type Alk (Ctrl) with Alk dominant-negative (AlkDN) conditions. The Drosophila Alk receptor tyrosine kinase (RTK) is comprised of extracellular, transmembrane and intracellular kinase (red) domains. Upon Jelly belly (Jeb, blue dots) ligand stimulation the Alk kinase domain is auto-phosphorylated (yellow circles) and downstream signaling is initiated. In AlkDN experimental conditions, Alk signaling is inhibited due to the overexpression of the Alk extracellular domain. (b) The TaDa system (expressing Dam::RNA Pol II) leads to the methylation of GATC sites in the genome, allowing transcriptional profiling based on RNA Pol II occupancy. (c) Pie chart indicating the distribution of TaDa peaks on various genomic features such as promoters, 5’ UTRs, 3’ UTRs, exons, and introns. (d) Volcano plot of TaDa-positive loci enriched in AlkDN experimental conditions compared to control loci exhibiting log2FC≥2, p≤0.05 are shown in blue. Alk-associated genes such as mamo, C3G, Kirre, RhoGAP15B, and mib2 are highlighted in purple. (e) Venn diagram indicating Alk-dependent TaDa downregulated genes from the current study compared with the previously identified Alk-dependent TaDa loci in the embryonic VM (Mendoza-Garcia et al., 2021). (f) Enrichment of Gene Ontology (GO) terms associated with significantly downregulated genes in AlkDN experimental conditions. Illustrations in Figure 1a and a portion of Figure 1b were created with BioRender.com, and published using a CC BY-NC-ND license with permission.
© 2024, BioRender Inc. Figure 1a and part of 1b were created using BioRender, and is published under a CC BY-NC-ND 4.0. Further reproductions must adhere to the terms of this license.
Figure 1—figure supplement 1
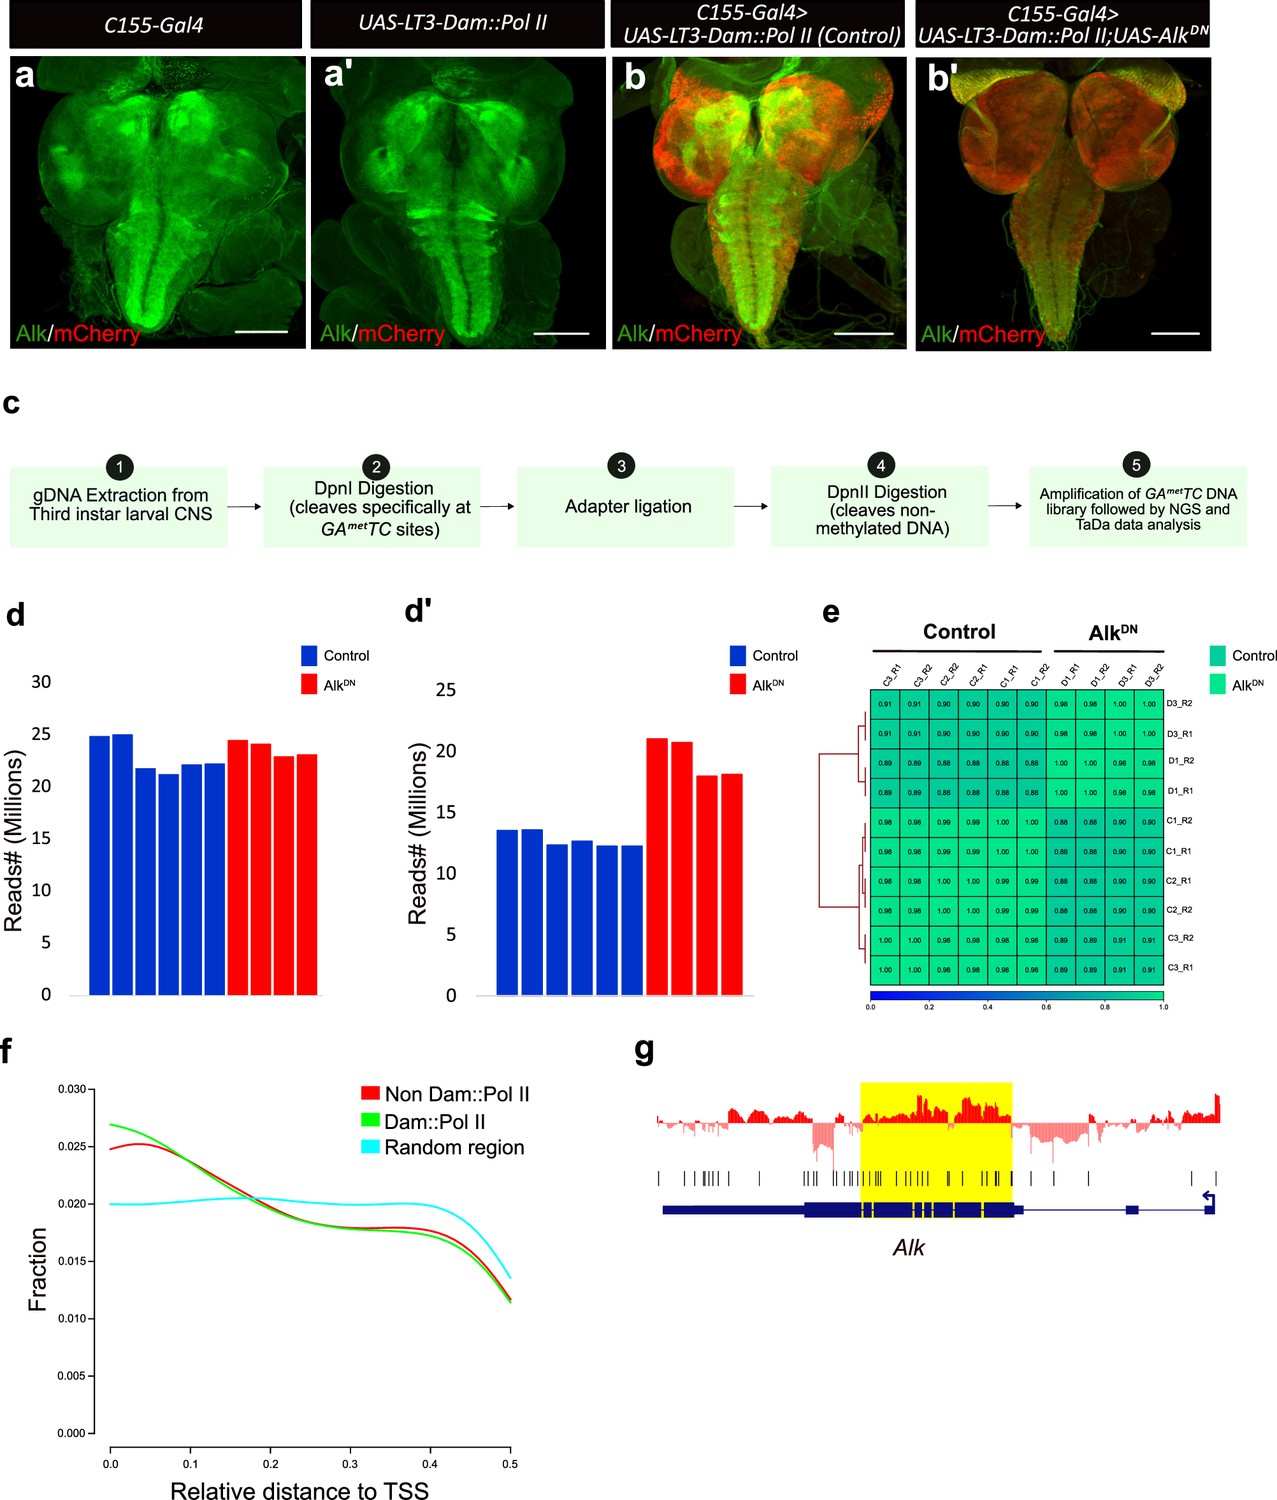
Targeted DamID (TaDa) third instar larval central nervous system (CNS) sample validation and additional data analysis.
(a–b’) Expression of mCherry in the larval CNS reflects Dam-Pol II expression. Third instar larval brains were stained for Alk (in green) and mCherry (in red) confirming expression of Dam-Pol II in the TaDa system. Scale bars: 100 μm. (c) Schematic overview of the TaDa analysis experimental workflow. Brains from third instar wandering larvae were dissected, and methylated DNA digested with Dpn1 restriction endonuclease. The resulting DNA fragment library was amplified, sequenced, and analyzed through TaDa bioinformatics pipelines. (d) Bar graph showing total number of reads in each replicate of the TaDa dataset. (d’) Bar graph showing percentage of reads aligned to Drosophila genome in each replicate. (e) Correlation plot of samples (control and AlkDN) and replicates shows no significant intra-replicate differences. (f) Line graph indicating the relative distance to transcription start sites (TSS) of different samples compared to random regions. (g) Pol ll occupancy profile of Alk in AlkDN compared to control indicates a higher Pol II occupancy in exons 1 to exon 7, in agreement with the expression of the AlkDN transgene.
Figure 2 with 2 supplements
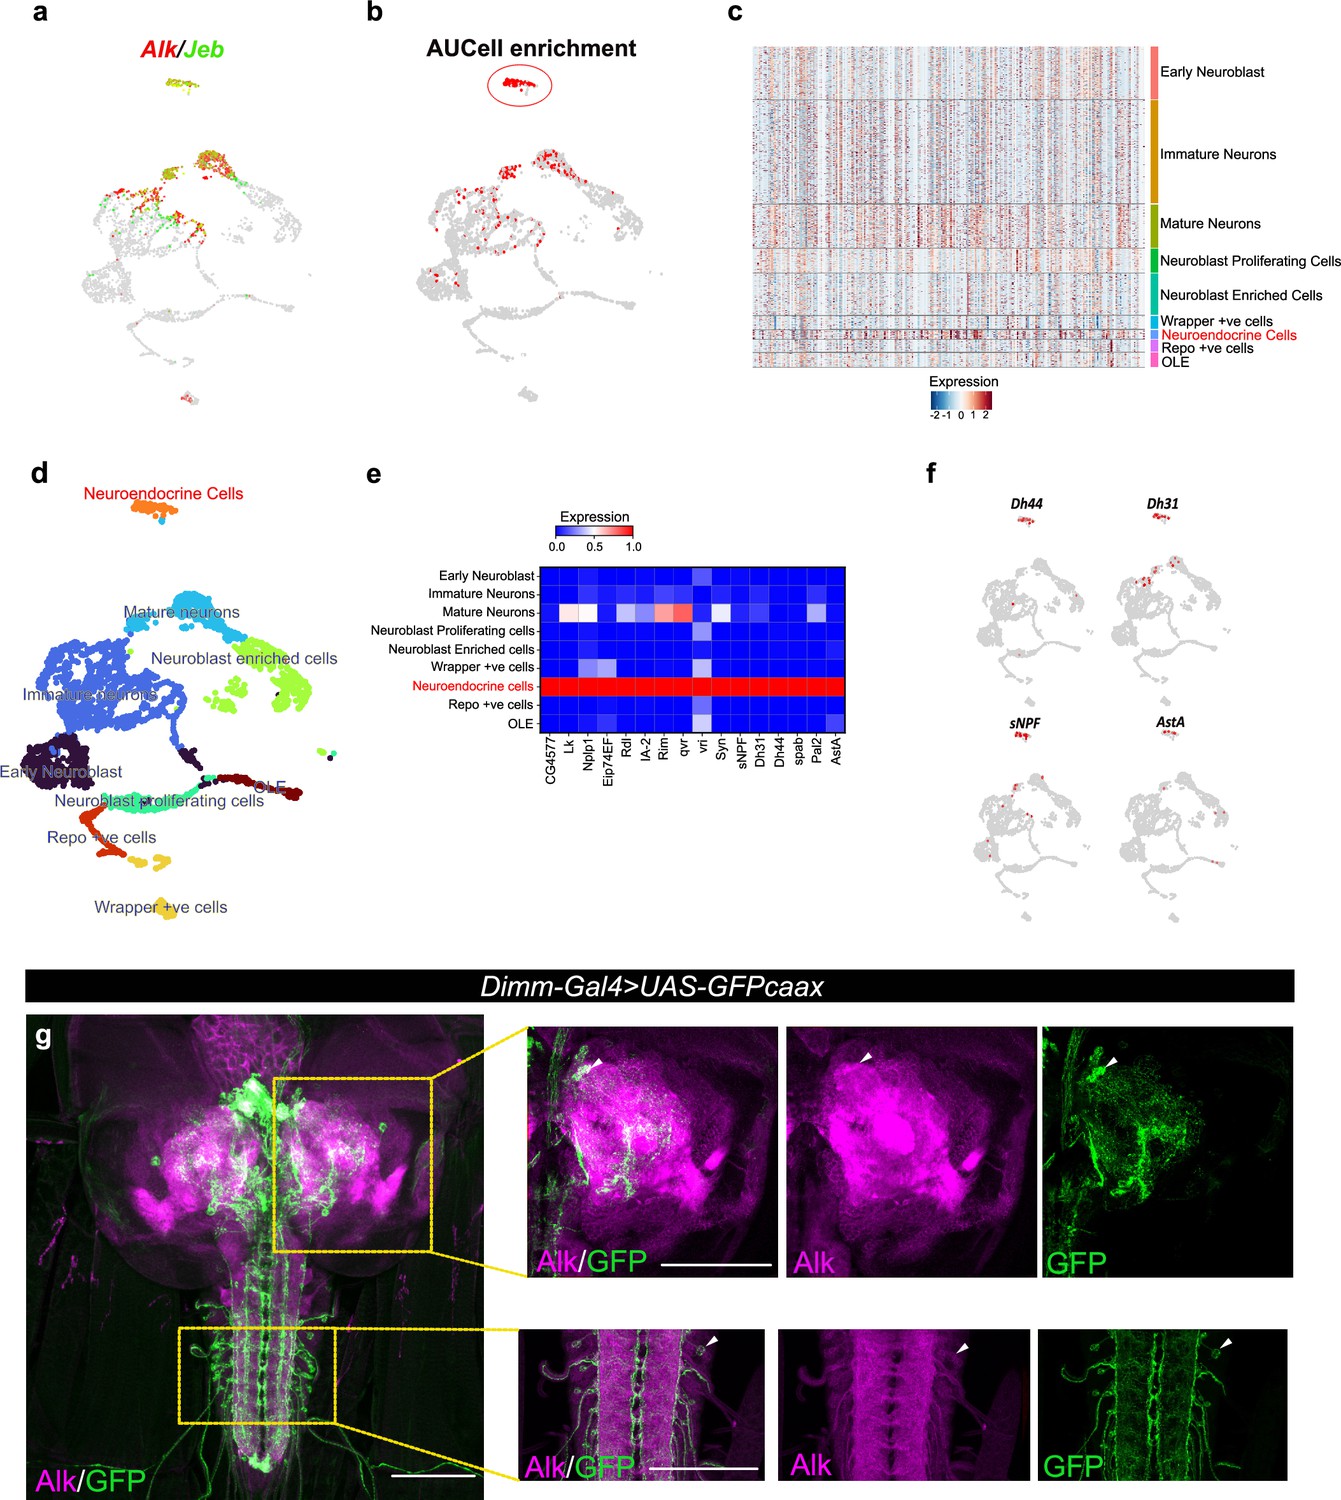
Integration of Targeted DamID (TaDa) data with scRNA-seq identifies an enrichment of Alk-regulated genes in neuroendocrine cells.
(a) Uniform Manifold Approximation and Projection (UMAP) feature plot indicating Alk (in red) and Jeb (in green) mRNA expression in a control (w1118) third instar larval central nervous system (CNS) scRNA-seq dataset (Pfeifer et al., 2022). (b) UMAP visualizing AUCell enrichment analysis of the top 500 TaDa downregulated genes in the third instar larval CNS scRNA-seq dataset. Cells exhibiting an enrichment (threshold>0.196) are depicted in red. One highly enriched cell cluster is highlighted (red circle). (c) Heatmap representing expression of the top 500 genes downregulated in TaDa AlkDN samples across larval CNS scRNA-seq clusters identifies enrichment in neuroendocrine cells. (d) UMAP indicating third instar larval CNS annotated clusters (Pfeifer et al., 2022), including the annotated neuroendocrine cell cluster (in orange). (e) Matrix plot displaying expression of canonical neuroendocrine cell markers. (f) UMAPs visualizing mRNA expression of Dh44, Dh31, sNPF, and AstA neuropeptides across the scRNA population. (g) Alk staining in Dimm-Gal4>UAS-GFPcaax third instar larval CNS confirms Alk expression in Dimm-positive cells. Alk (in magenta) and GFP (in green), close-ups indicated by boxed regions and arrows indicating overlapping cells in the central brain and ventral nerve cord. Scale bars: 100 μm.
Figure 2—figure supplement 1
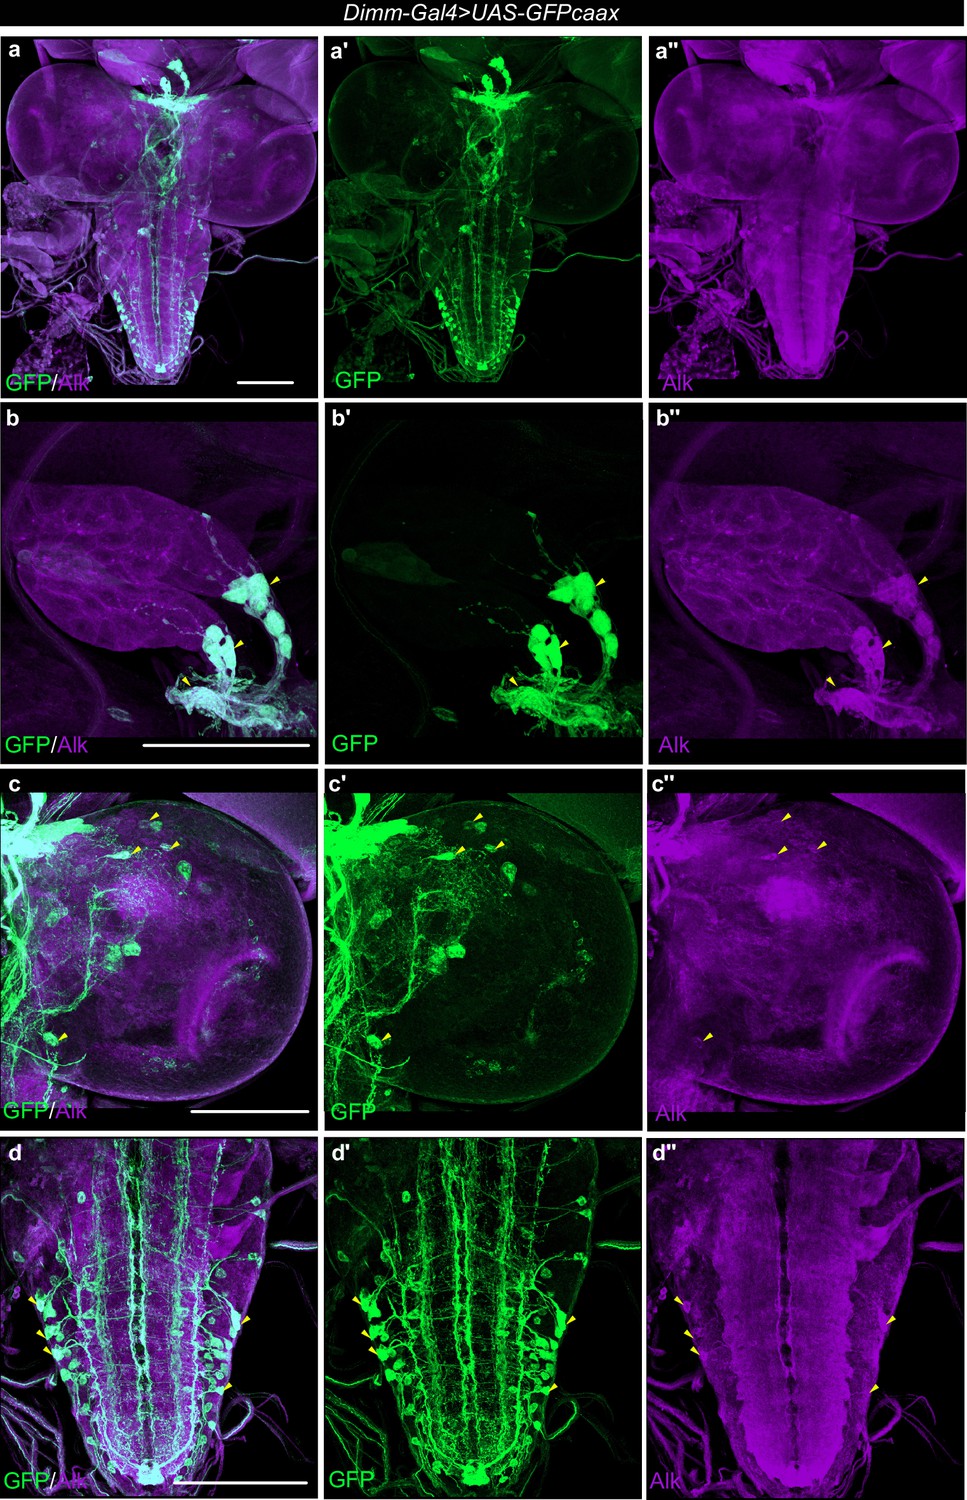
Alk is expressed in Dimm-Gal4>UAS-GFPcaax positive cells of the third instar larval CNS.
(a–a’’) Alk staining in Dimm-Gal4>UAS-GFPcaax third instar larval central nervous system (CNS) confirms Alk expression in Dimm-positive cells. Alk (in magenta) and GFP (in green), close-ups indicating overlapping cells (indicated by yellow arrowheads) in the larval ring gland corpora cardiaca cells (b–b’’), central brain (c–c’’), and ventral nerve cord (d–d’’). Scale bars: 100 μm.
Figure 2—figure supplement 2
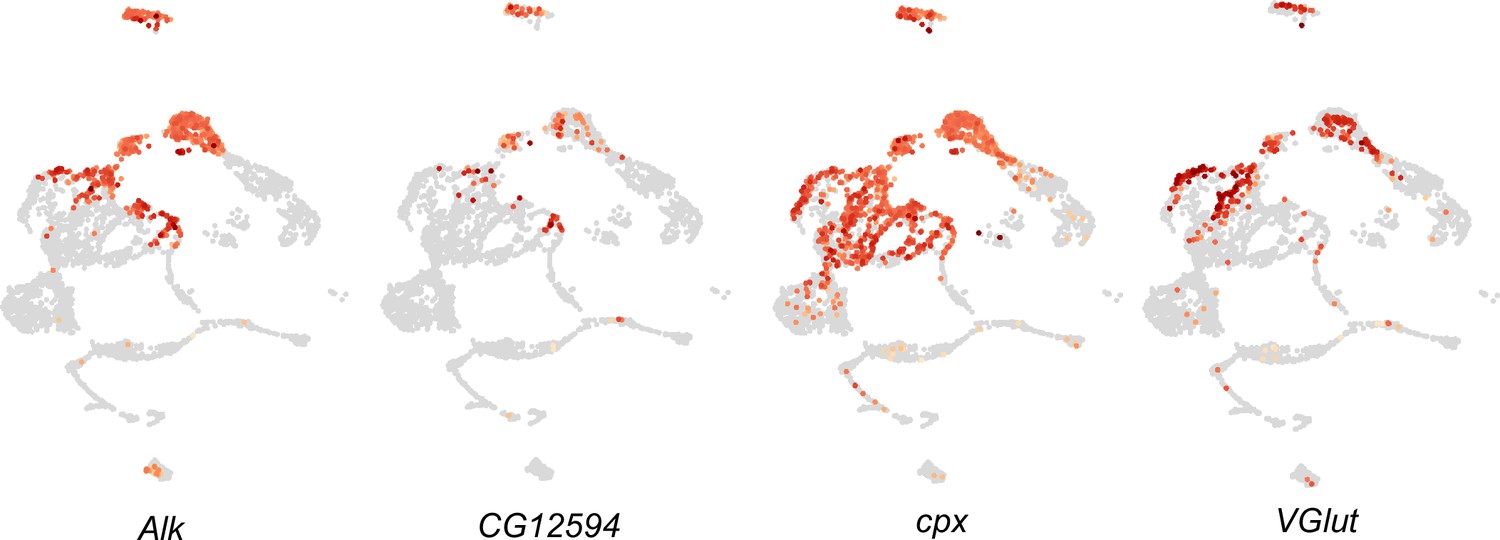
Feature plots visualizing expression of Targeted DamID (TaDa)-identified genes expressed in neuroendocrine cells in scRNA-seq from third instar larval central nervous system (CNS) (Pfeifer et al., 2022).
TaDa candidates CG12594, cpx, and VGlut are shown.
Figure 3 with 2 supplements
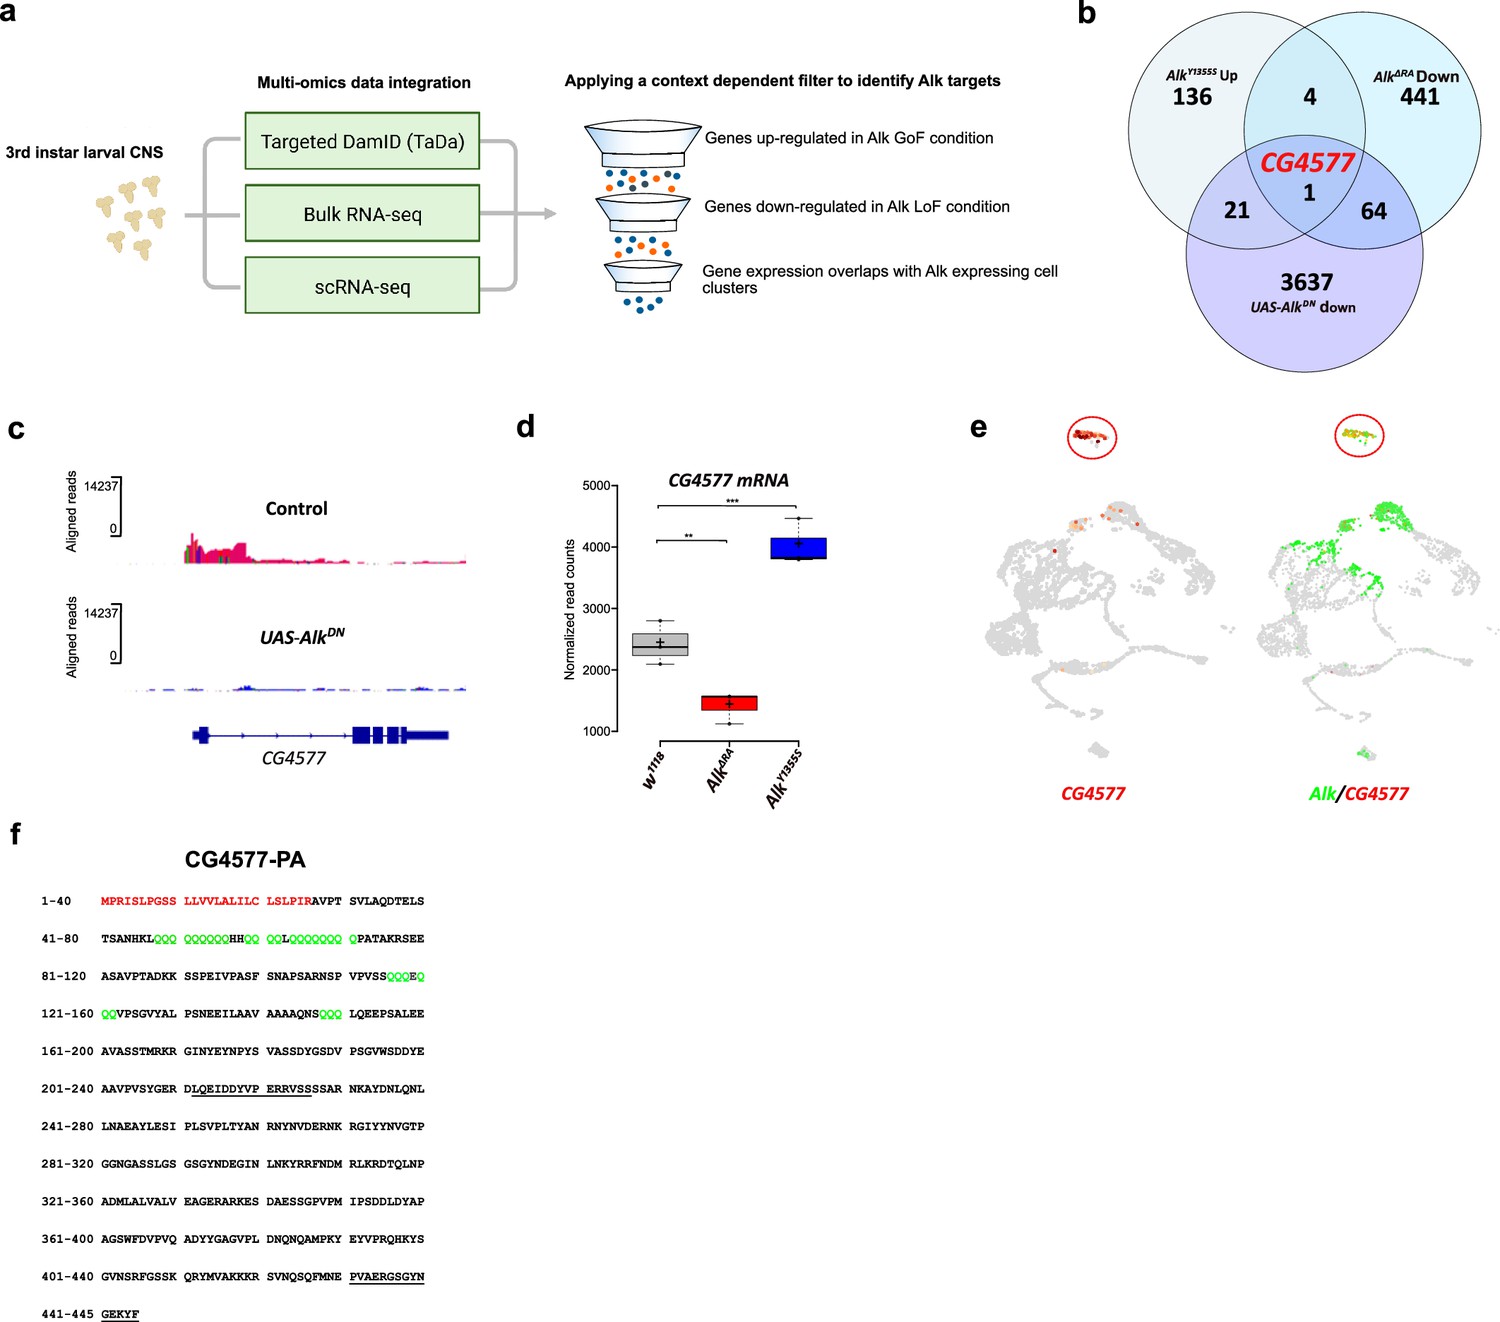
Targeted DamID (TaDa) and RNA-seq identifies CG4577 as a novel Alk-regulated neuropeptide.
(a) Flowchart representation of the multi-omics approach employed in the study and the context-dependent filter used to integrate TaDa, bulk RNA-seq, and scRNA-seq datasets. (b) Venn diagram comparing bulk RNA-seq (log2FC>1.5, p≤0.05) and TaDa datasets (log2FC≥2, p≤0.05). A single candidate (CG4577/Spar) was identified as responsive to Alk signaling. (c) TaDa Pol II occupancy of CG4577/Spar shows decreased occupancy in AlkDN experimental conditions compared to control. (d) Expression of CG4577/Spar in w1118 (control), AlkΔRA (Alk loss-of-function allele), and AlkY1355S (Alk gain-of-function allele) larval central nervous system (CNS). Boxplot with normalized counts, **p<0.01, ***p<0.001. (e) Uniform Manifold Approximation and Projections (UMAPs) showing mRNA expression of CG4577/Spar and Alk in third instar larval CNS scRNA-seq data. Neuroendocrine cluster is highlighted (red circle). (f) CG4577/Spar-PA amino acid sequence indicating the signal peptide (amino acids 1–26, in red), glutamine repeats (in green), and the anti-CG4577/Spar antibody epitopes (amino acids 211–225 and 430–445, underlined). Center lines in boxplots indicate medians; box limits indicate the 25th and 75th percentiles; crosses represent sample means; whiskers extend to the maximum or minimum.
Figure 3—figure supplement 1
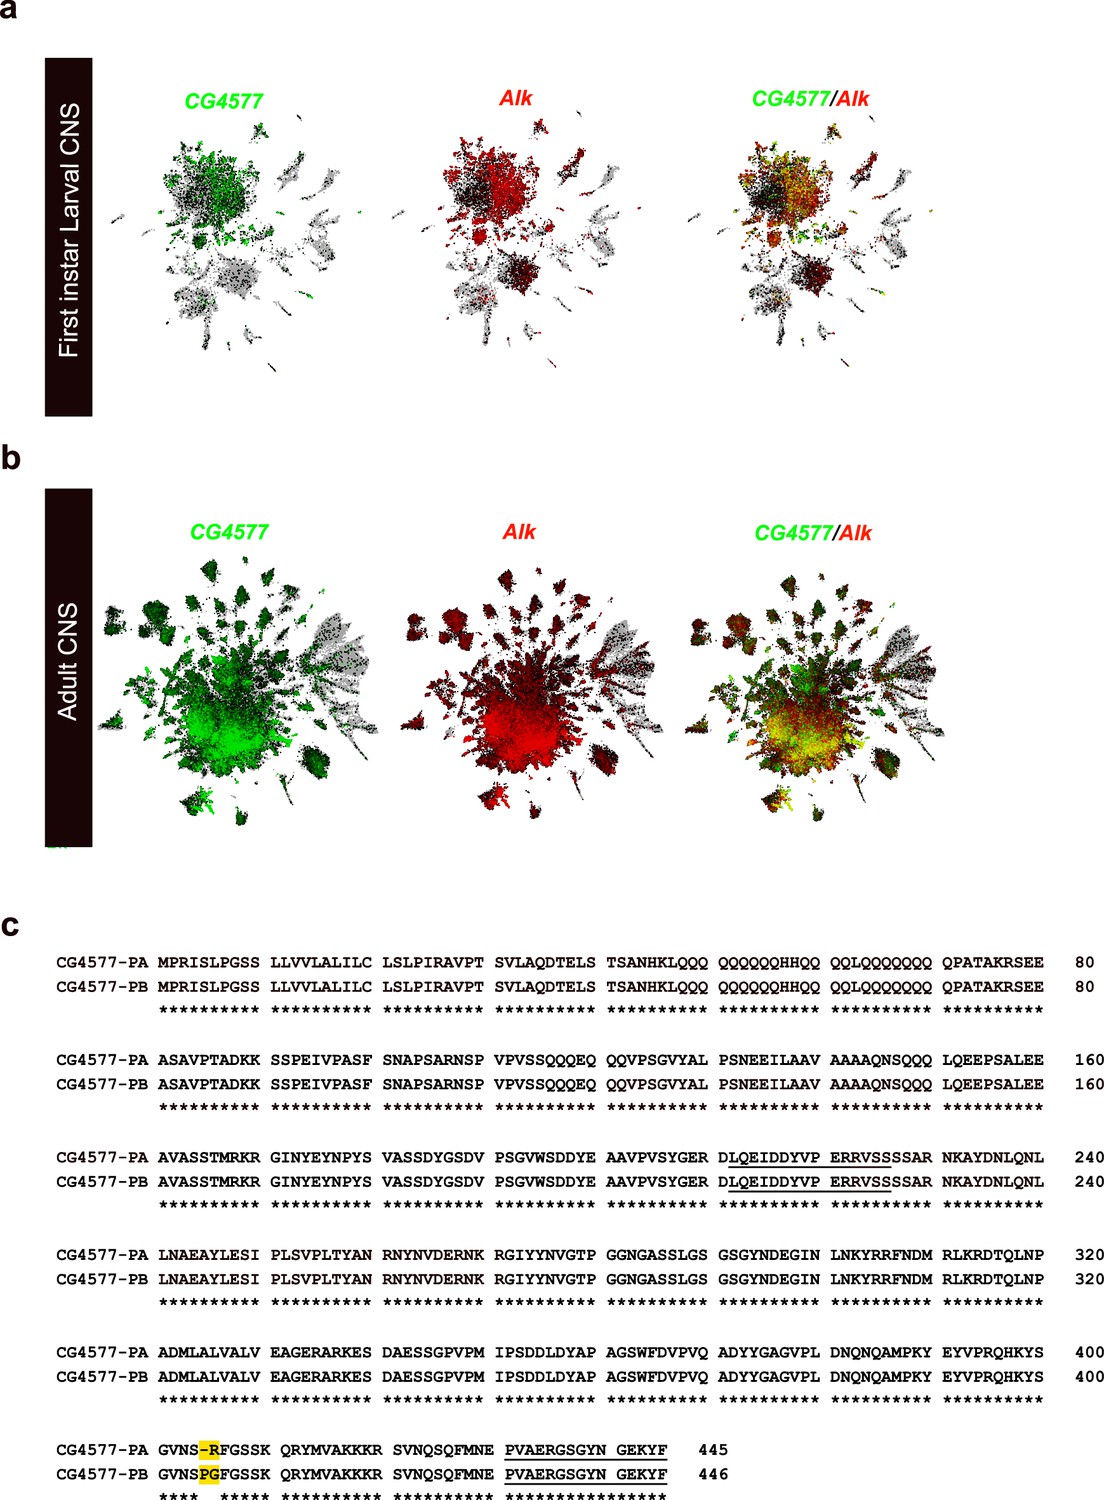
Co-expression of Alk and Spar in publicly available Drosophila central nervous system (CNS) scRNA-seq datasets.
UMAPs showing co-expression of Alk and CG4577 in different cell clusters in publicly available scRNA-seq datasets (Brunet Avalos et al., 2019) from first instar larval CNS (a) and (b) adult CNS (Davie et al., 2018). (c) Pairwise alignment of CG4577-PA and CG4577-PB showing isoform-specific differences at amino acid positions 405 and 406 (highlighted in yellow).
Figure 3—figure supplement 2
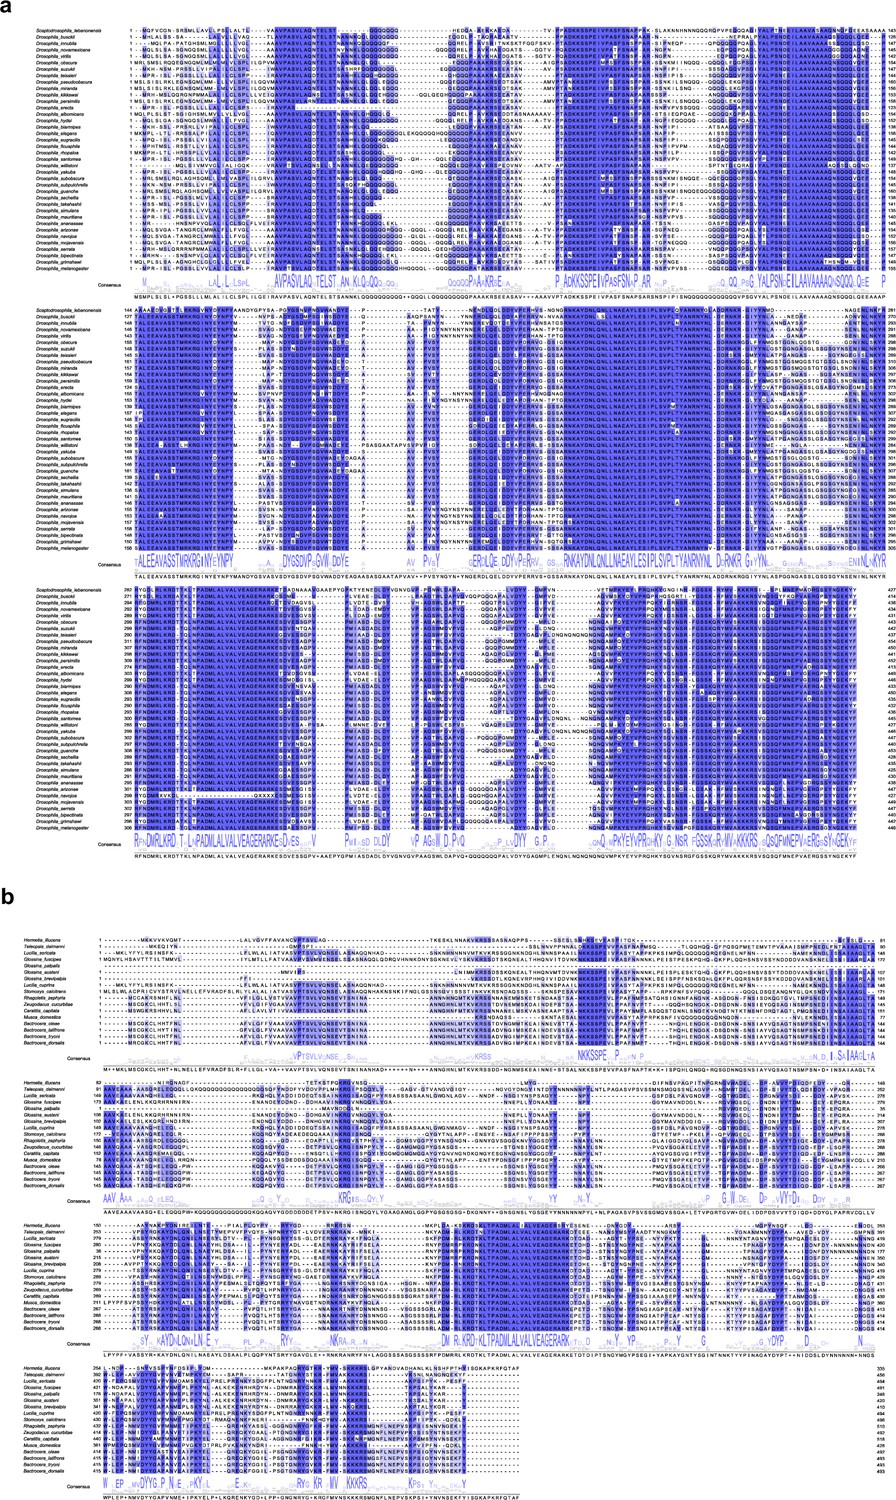
Alignment of CG4577 orthologs in flies (Brachycera).
(a) Alignment of D. melanogaster CG4577 orthologs in the family Drosophilidae (vinegar flies, including the fruit fly D. melanogaster). (b) Alignment of D. melanogaster CG4577 orthologs in other brachyceran taxa.
Figure 4 with 4 supplements
Spar expression in the Drosophila larval brain.
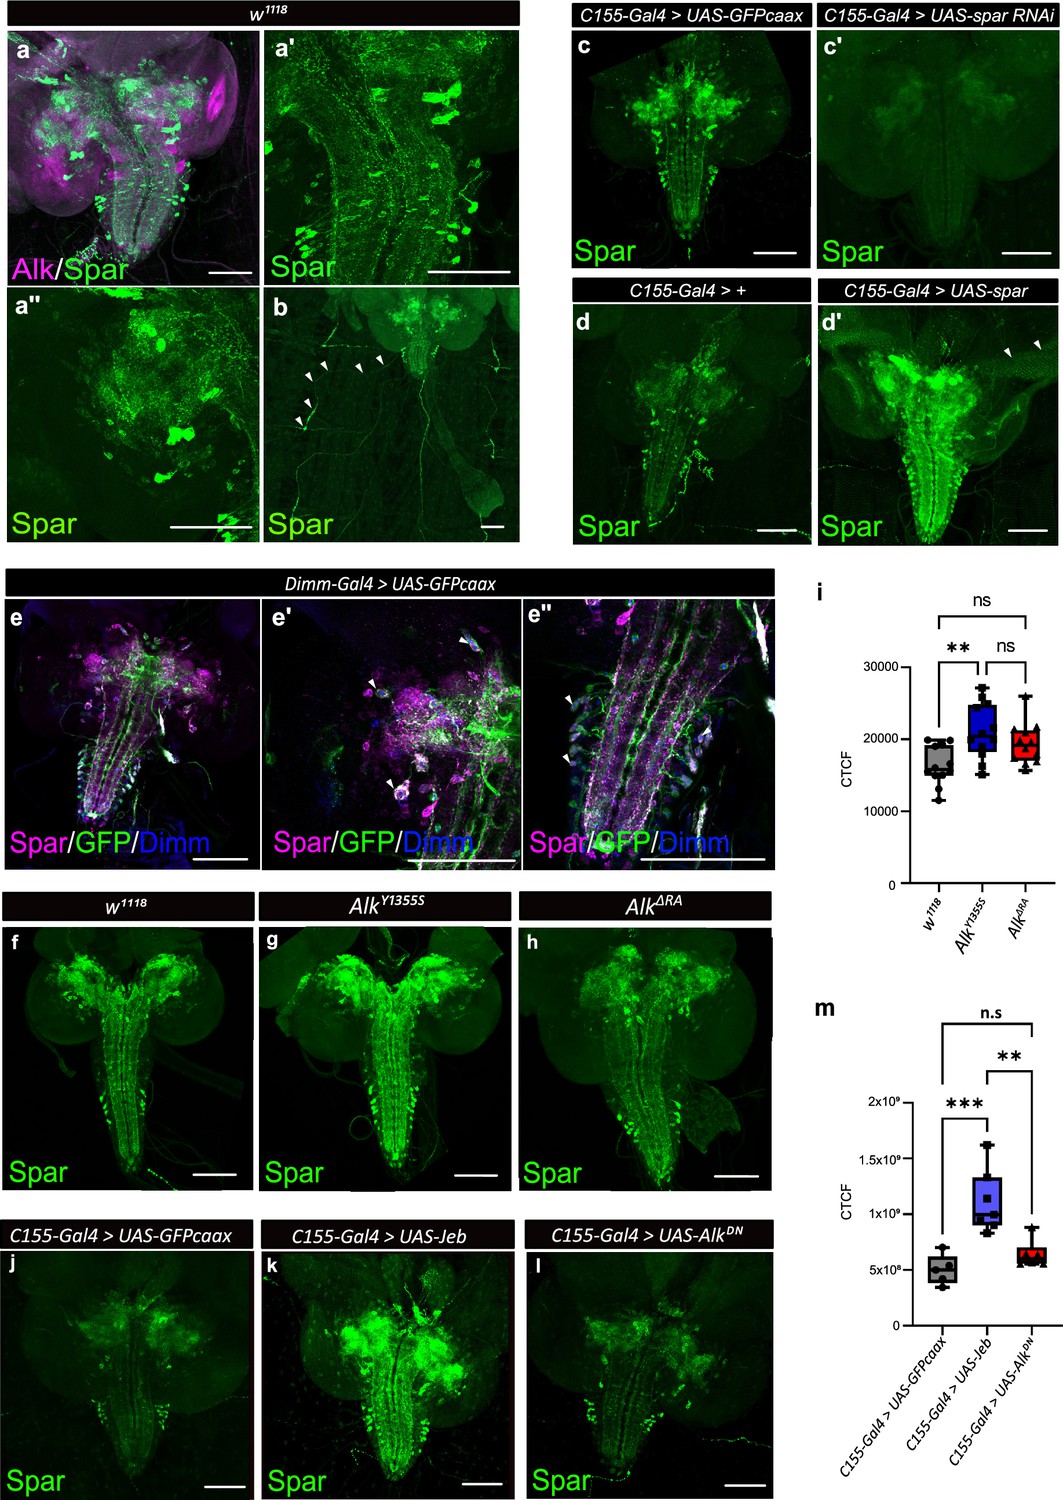
(a) Immunostaining of w1118 third instar larval brains with Spar (green) and Alk (magenta) revealing overlapping expression in central brain and ventral nerve cord. (a’–a’’) Close-up of Spar expression (green) in ventral nerve cord (a’) and central brain (a’’). (b) Immunostaining of w1118 third instar larval central nervous system (CNS) together with the body wall muscles, showing Spar (green) expression in neuronal processes (white arrowheads) which emerge from the ventral nerve cord and innervate larval body wall muscle number 8. (c–c’) Decreased expression of Spar in third instar larval brains expressing Spar RNAi (C155-Gal4>Spar RNAi) compared to control (C155-Gal4>UAS-GFPcaax) confirms Spar antibody specificity (Spar in green). (d–d’) Spar overexpression (C155-Gal4>UAS Spar) showing increased Spar expression (in green) compared to control (C155-Gal4>+) larval CNS. (e–e’’) Immunostaining of Dimm-Gal4>UAS-GFPcaax third instar larval brains with Spar (in magenta), GFP, and Dimm (in blue) confirms Spar expression in Dimm-positive neuroendocrine cells (white arrowheads). Close-up of ventral nerve cord (e’) and central brain (e’’). (f–i) Spar protein expression in w1118, AlkY1355S, and AlkΔRA third instar larval brains. Quantification of Spar levels (corrected total cell fluorescence [CTCF]) in i. (j–m) Overexpression of Jeb in the third instar CNS (C155-Gal4>UAS Jeb) leads to increased Spar protein expression compared to controls (C155-Gal4>UAS-GFPcaax). Quantification of Spar levels [CTCF] in m (**p<0.01; ***p<0.001). Scale bars: 100 μm. Center lines in boxplots indicate medians; box limits indicate the 25th and 75th percentiles; whiskers extend to the maximum or minimum.
Figure 4—figure supplement 1
Expression of Alk and Spar in the larval CNS and prothoracic gland.
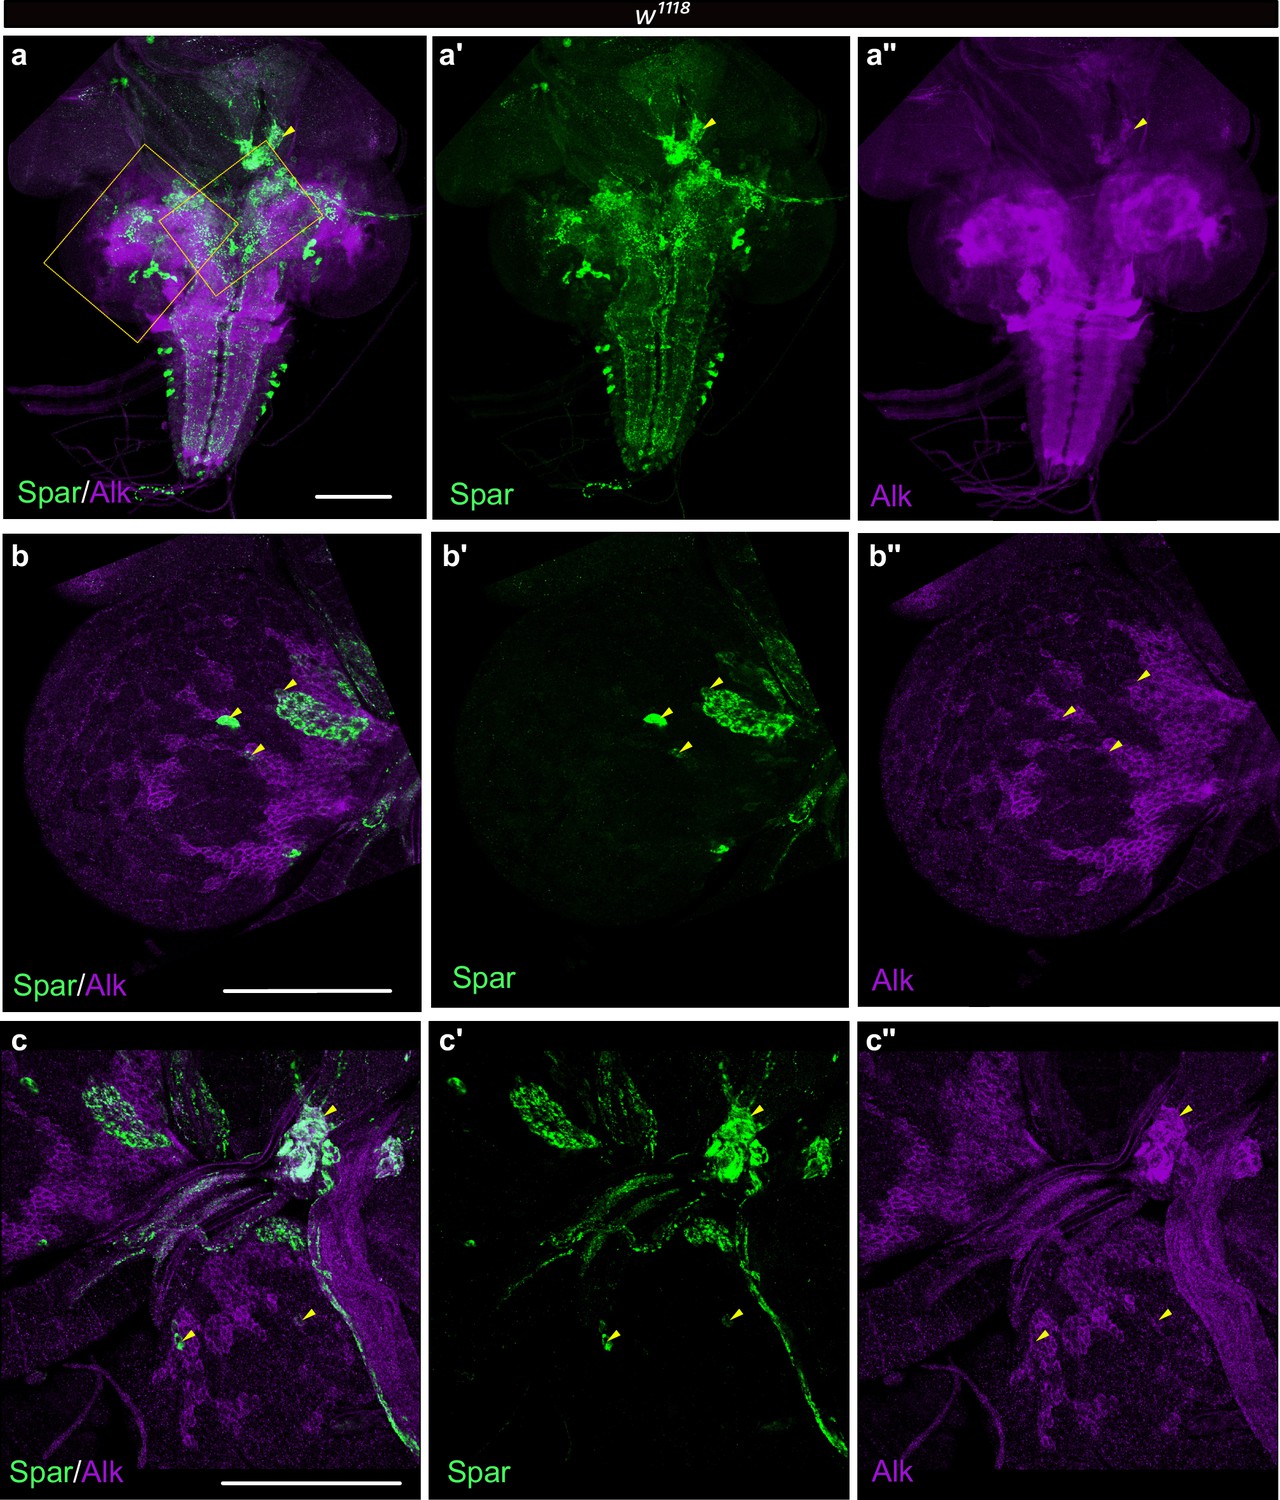
(a–a’’) Immunostaining of w1118 third instar larval brains with Spar (green) and Alk (magenta) revealing overlapping expression (indicated by yellow arrowheads) in central brain, ring gland corpora cardiaca, and ventral nerve cord. Close-ups indicating overlapping cells in central brain (b–b’’) corresponding to dashed box on left in a and ring gland corpora cardiaca cells (c–c’’) corresponding to dashed box on right in a. Scale bars: 100 μm.
Figure 4—figure supplement 2
Expression of Spar in Dimm-positive neurons of the adult CNS.
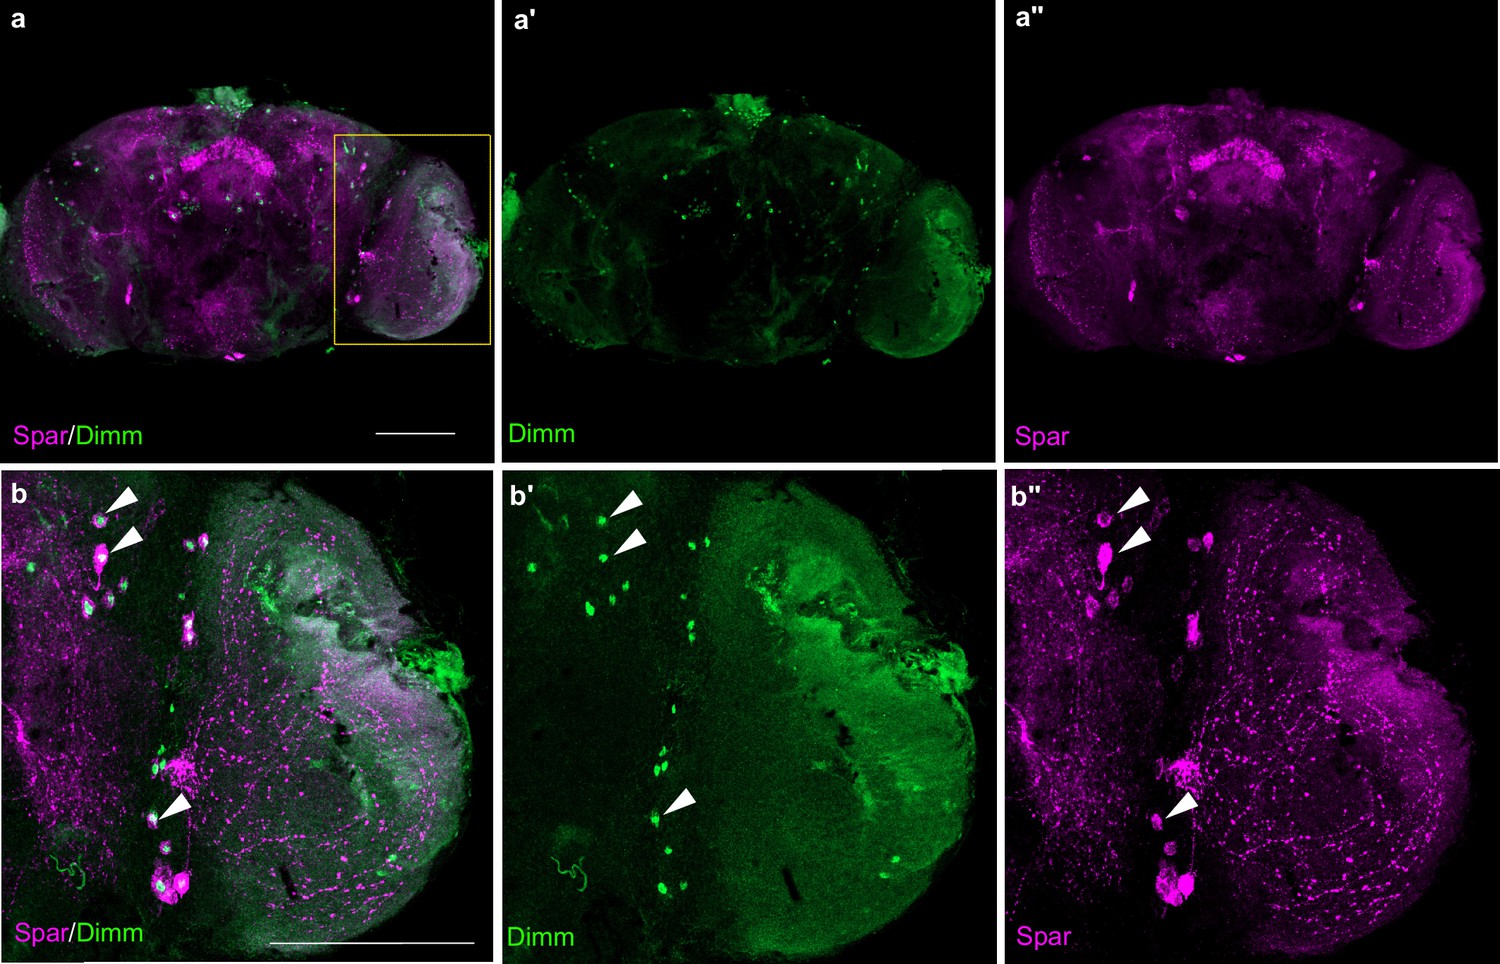
(a–a’’) Adult central nervous system (CNS) showing Spar expression in Dimm-positive cells. Spar (in magenta) and Dimm (in green), close-ups (b–b’’) indicated by boxed region and white arrows indicating representative co-expressed markers cells. Scale bars: 100 μm.
Figure 4—video 1
Z-stack projection video of Figure 4e’.
Figure 4—video 2
Z-stack projection video of Figure 4e’’.
Figure 5
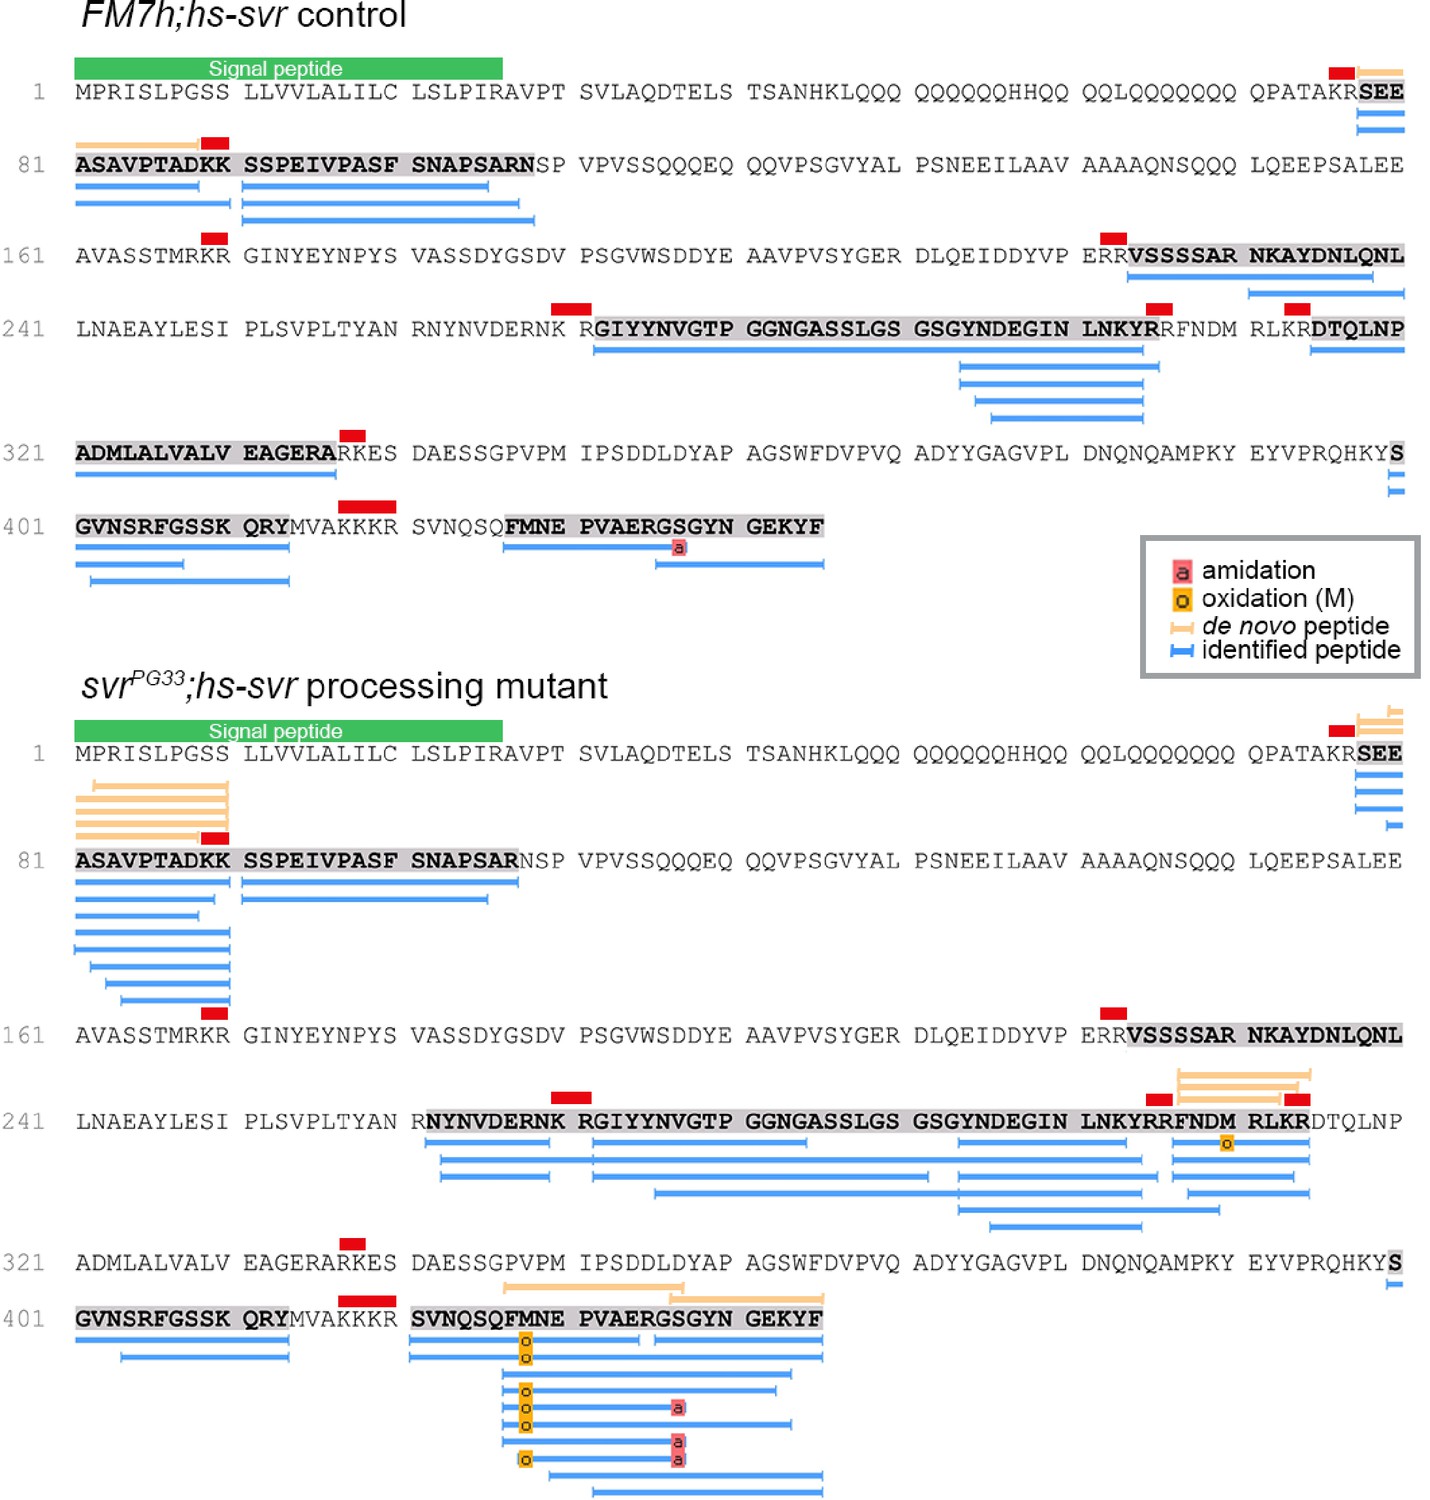
Identification of Spar peptides in Drosophila central nervous system (CNS) tissues.
Peptides derived from the Spar prepropeptide identified by mass spectrometry in wild-type-like control flies (FM7h;hs-svr, upper panel) and svr mutant (svrPG33;hs-svr, lower panel) flies. The predicted amino acid sequence of the CG4577-PA Spar isoform is depicted for each genetic experimental background. Peptides identified by database searching (UniProt D. melanogaster, 1% FDR) are marked by blue bars below the sequence. In addition, peptides correctly identified by de novo sequencing are marked by orange bars above the sequence. Red bars indicate basic PC cleavage sites, green bar indicates the signal peptide.
Figure 6 with 1 supplement
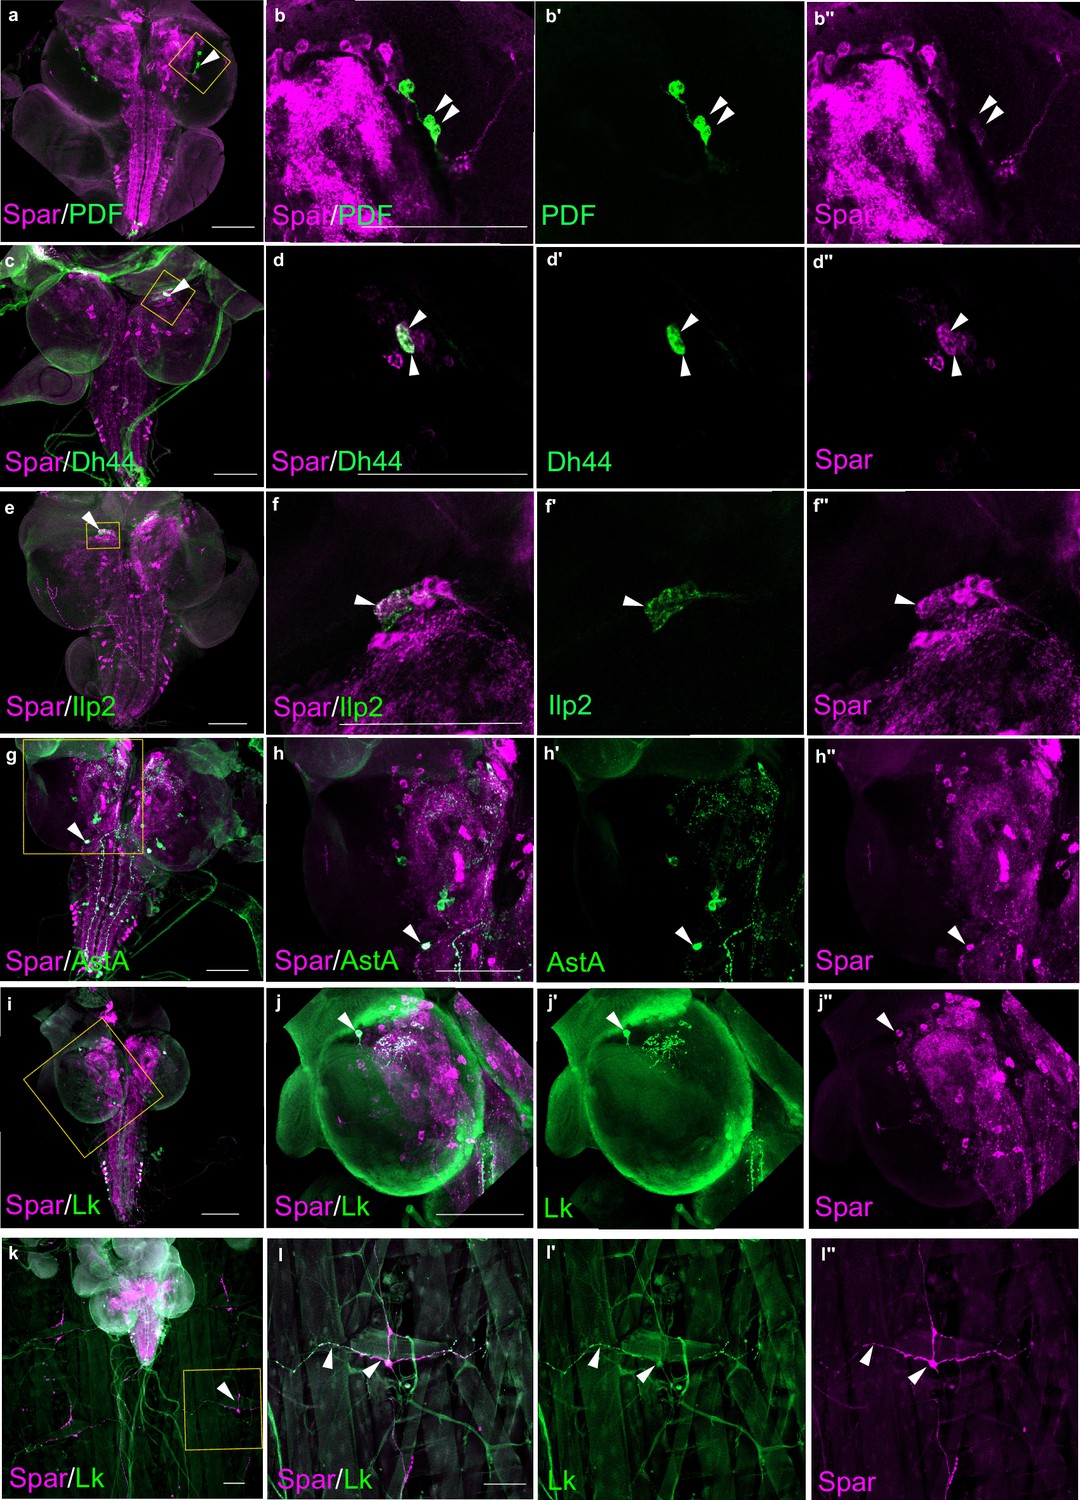
Spar expression in larval neuropeptide expressing neuronal populations.
(a) Immunostaining of w1118 third instar larval central nervous system (CNS) with Spar (in magenta) and PDF (in green). Close-ups (b–b’’) showing PDF- and Spar-positive neurons in central brain indicated by white arrowheads. (c) Immunostaining of w1118 third instar larval CNS with Spar (in magenta) and Dh44 (in green). Close-ups (d–d’’) showing Dh44- and Spar-positive neurons in central brain indicated by white arrowheads. (e) Immunostaining of w1118 third instar larval CNS with Spar (in magenta) and Ilp2 (in green). Close-ups (f–f’’) showing Ilp2- and Spar-positive neurons in central brain indicated by white arrowheads. (g) Immunostaining of w1118 third instar larval CNS with Spar (in magenta) and AstA (in green). Close-ups (h–h’’) showing AstA- and Spar-positive neurons in central brain indicated by white arrowheads. (i) Immunostaining of w1118 third instar larval CNS with Spar (in magenta) and Lk (in green). Close-ups (j–j’’) showing Lk (LHLK neurons)- and Spar-positive neurons in central brain indicated by white arrowheads. (k) Immunostaining of w1118 third instar larval CNS together with the body wall muscles, showing Spar (in magenta) expressing Lk (in green) (ABLK neurons) in neuronal processes, which emerge from the ventral nerve cord and innervate the larval body wall muscle. Close-ups (l–I’’) showing co-expression of Lk and Spar in neurons which attach to the body wall number 8 indicated by white arrow heads. Scale bars: 100 μm.
Figure 6—figure supplement 1
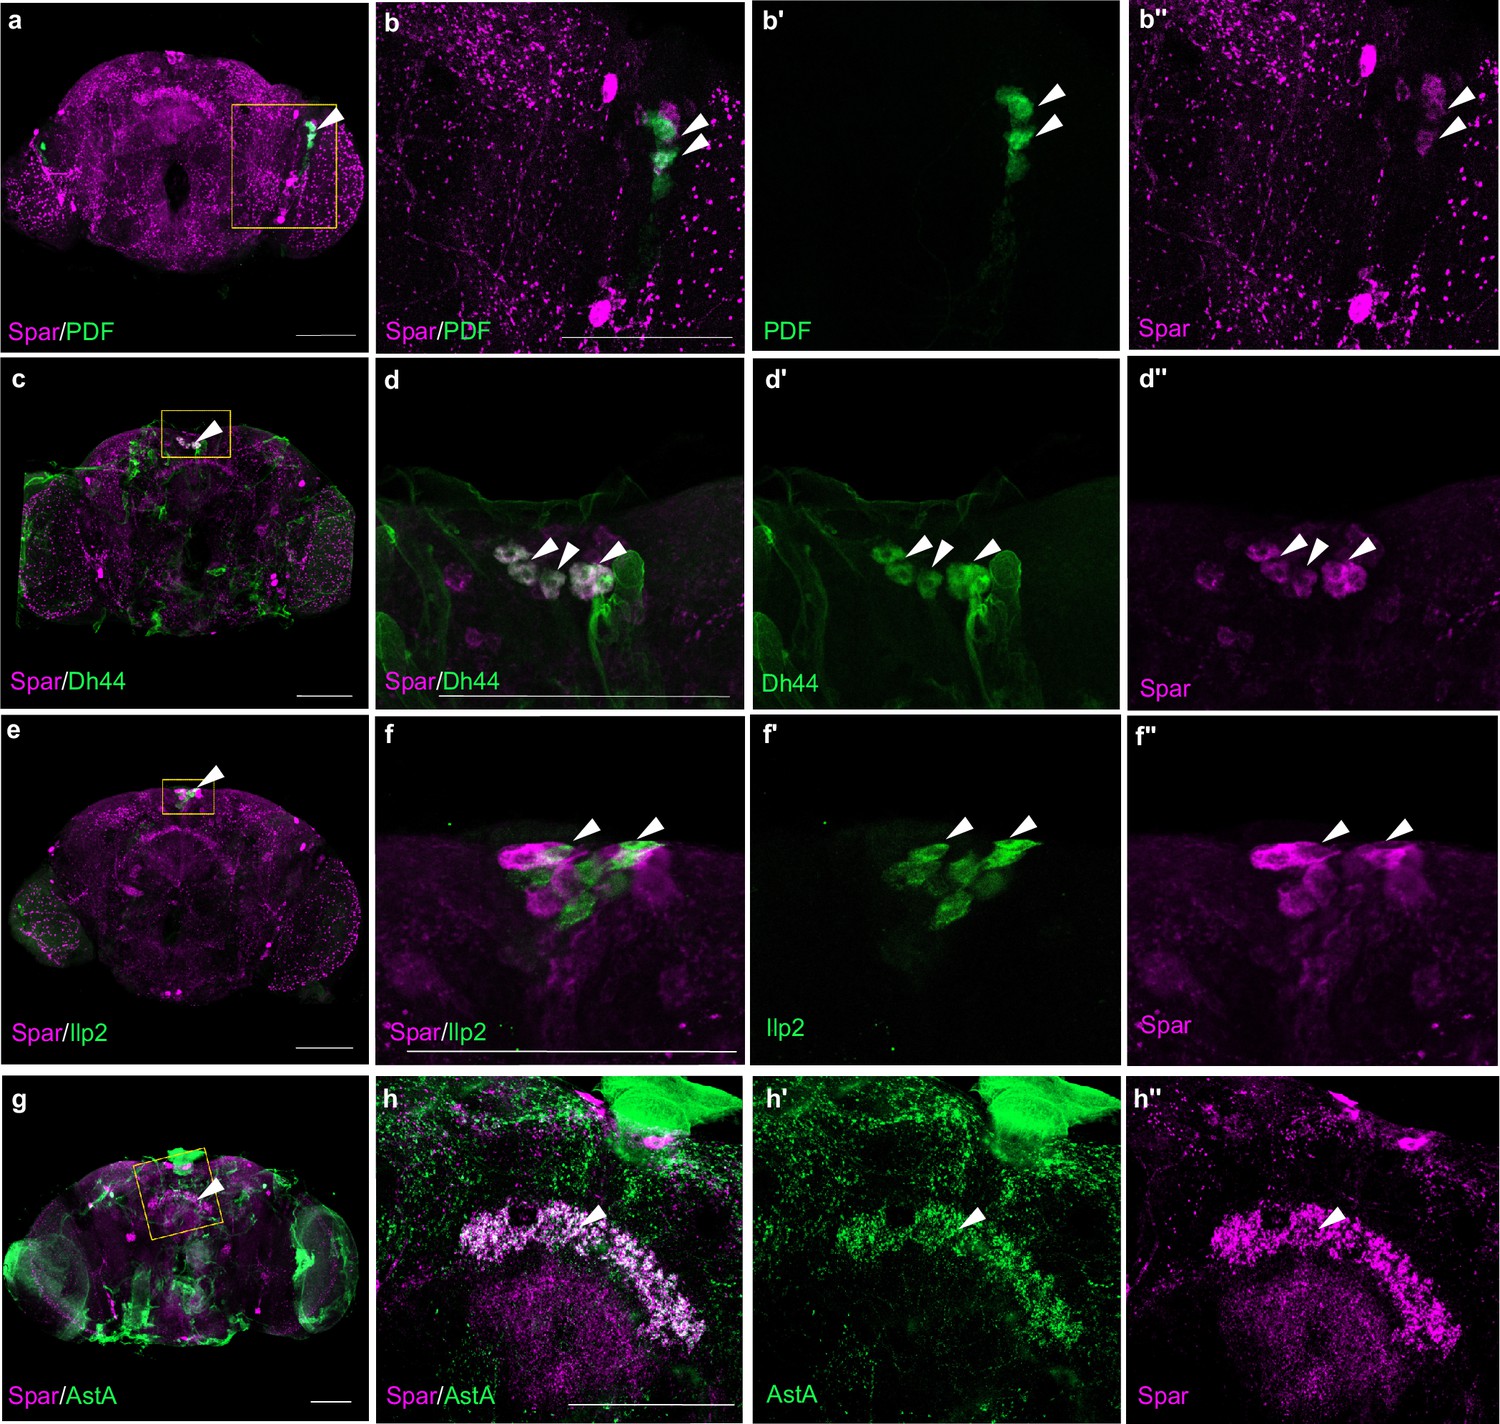
Spar expression in adult neuropeptide expressing neuronal populations.
(a) Immunostaining of w1118 adult central nervous system (CNS) with anti-Spar (in magenta) and anti-PDF (in green). Close-ups (b–b’’) of PDF- and Spar-positive ventral lateral neurons (LNv), indicated by white arrowheads. (c) Immunostaining of w1118 adult CNS with Spar (in magenta) and Dh44 (in green). Close-ups (d–d’’) of Dh44- and Spar-positive neurons, indicated by white arrowheads. (e) Immunostaining of w1118 adult CNS with Spar (in magenta) and Ilp2 (in green). Close-ups (f–f’’) showing the close proximity and overlap of Ilp2-positive and Spar-positive neurons in central brain, indicated by white arrowheads. (g) Immunostaining of w1118 adult CNS with Spar (in magenta) and AstA (in green). Close-ups (h–h’’) showing AstA- and Spar-positive neurons in central brain indicated by white arrowheads. Scale bars: 100 μm.
Figure 7 with 2 supplements
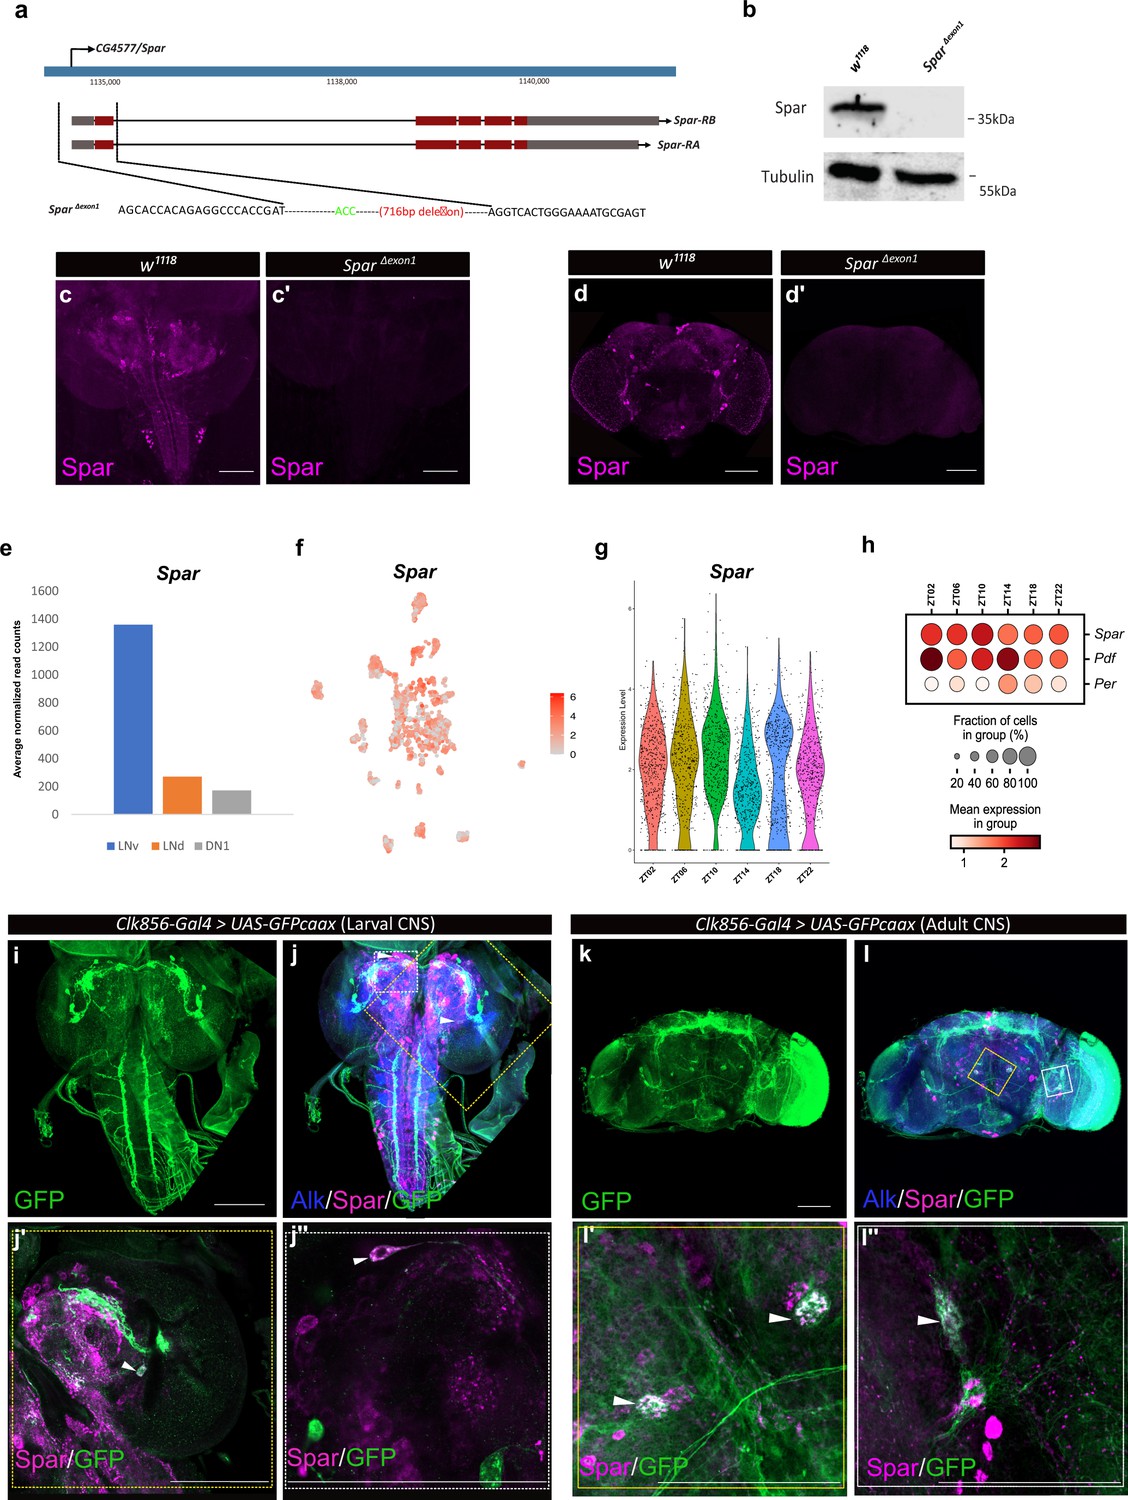
Generation of the SparΔExon1 mutant and expression of Spar in circadian neurons.
(a) Schematic overview of the Spar gene locus and the SparΔExon1 mutant. Black dotted lines indicate the deleted region, which includes the transcriptional start and exon 1. (b) Immunoblotting for Spar. Spar protein (35 kDa) is present in larval central nervous system (CNS) lysates from wild-type (w1118) controls but absent in SparΔExon1 mutants. (c–d’) Immunostaining confirms loss of Spar protein expression in the SparΔExon1 mutant. Third instar larval (c–c’) and adult (d–d’’) CNS stained for Spar (in magenta). Spar signal is undetectable in SparΔExon1. (e) Expression of Spar in ventral lateral neuron (LNv), dorsal lateral neuron (LNd), and dorsal neuron 1 (DN1) circadian neuronal populations, employing publicly available RNA-seq data (Abruzzi et al., 2017). (f) UMAP of Spar expression in circadian neurons, employing publicly available scRNA-seq data (Ma et al., 2021). (g). Violin plot indicating Spar expression throughout the light-dark (LD) cycle, showing light phase (zeitgeber time 2 (ZT02), ZT06, and ZT10) and dark phase (ZT14, ZT18, and ZT22) expression. (h) Dot plot comparing Spar expression throughout the LD cycle with the previously characterized circadian-associated neuropeptide pigment dispersion factor (Pdf) and the core clock gene Period (per). Expression levels and percentage of expressing cells are indicated. (i–j) Spar expression in clock neurons (Clk856-Gal4>UAS-GFPcaax) of the larval CNS, visualized by immunostaining for Spar (magenta), Alk (in blue), and clock neurons (GFP, in green). (j’–j’’) Close-up of central brain regions (yellow dashed box in j) indicating expression of Spar in Clk856-positive neurons (white arrowheads). (k–l) Immunostaining of Clk856-Gal4>UAS-GFPcaax in adult CNS with GFP (in green), Spar (in magenta), and Alk (in blue). (l’–I’’) Close-ups of CNS regions (yellow dashed box in l) stained with GFP (in green) and Spar (in red) showing a subset of clock-positive neurons expressing Spar (white arrowheads). Scale bars: 100 μm.
-
Figure 7—source data 1
Source file for immunoblotting in Figure 7b - raw data.
- https://cdn.elifesciences.org/articles/88985/elife-88985-fig7-data1-v1.zip
Figure 7—figure supplement 1

Spar does not affect the Alk-regulated pupal size phenotype.
Overexpression of Spar (C155-Gal4>UAS Spar) or Spar RNAi (C155-Gal4>UAS Spar RNAi) in central nervous system (CNS) does not significantly affect pupal size compared to previously characterized controls such as AlkDN (C155-Gal4>UAS-AlkDN), which significantly increases pupal size and overexpression of Jeb (C155-Gal4>UAS-AlkDN), which significantly decreases pupal size compared to controls (C155-Gal4>+) (n.s.=not significant, **p<0.05, ***p<0.01). Center lines in boxplots indicate medians; box limits indicate the 25th and 75th percentiles; whiskers extend 1.5 times the interquartile range from the 25th and 75th percentiles, crosses represent sample means; gray bars indicate 83% confidence intervals of the means; data points are plotted as gray circles.
Figure 7—figure supplement 2
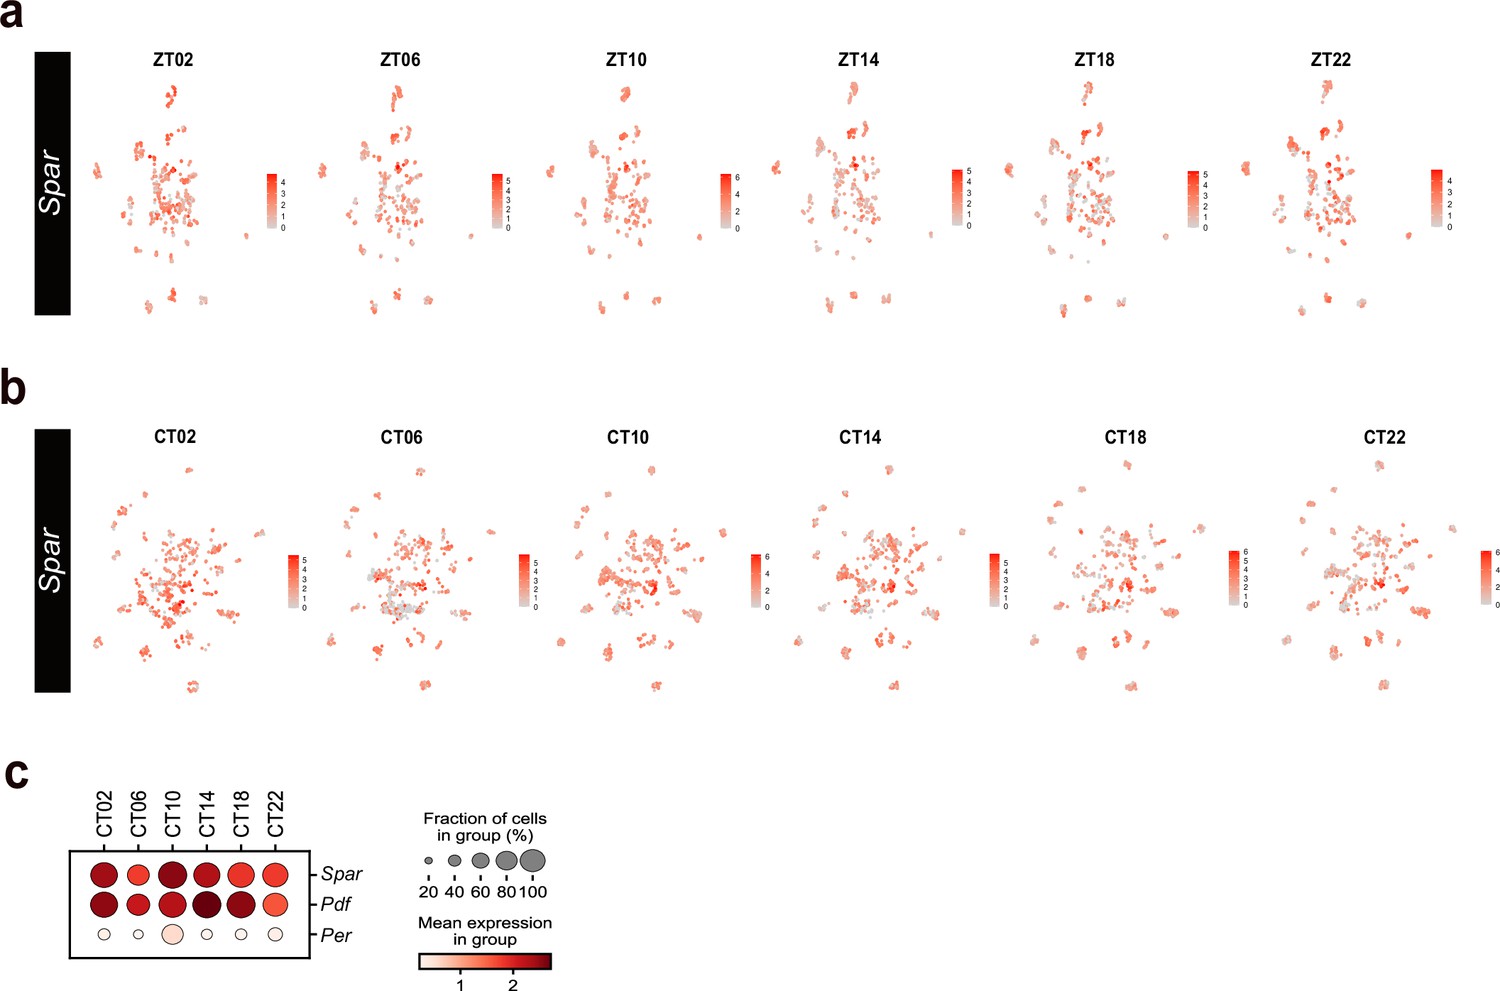
Spar expression in circadian neuronal clusters.
(a–b) Feature plots depicting the expression of Spar in publicly available circadian neuronal scRNA-seq data (Ma et al., 2021) throughout the light-dark (LD) cycle (zeitgeber time) (a) and dark-dark (DD) cycle (circadian time [CT]) (b). (c) Dot plot showing Spar expression throughout the DD cycle along with the previously characterized circadian-associated neuropeptide Pdf and the core clock gene Per. Peak expression of Spar and Per is observed at CT10.
Figure 8 with 4 supplements
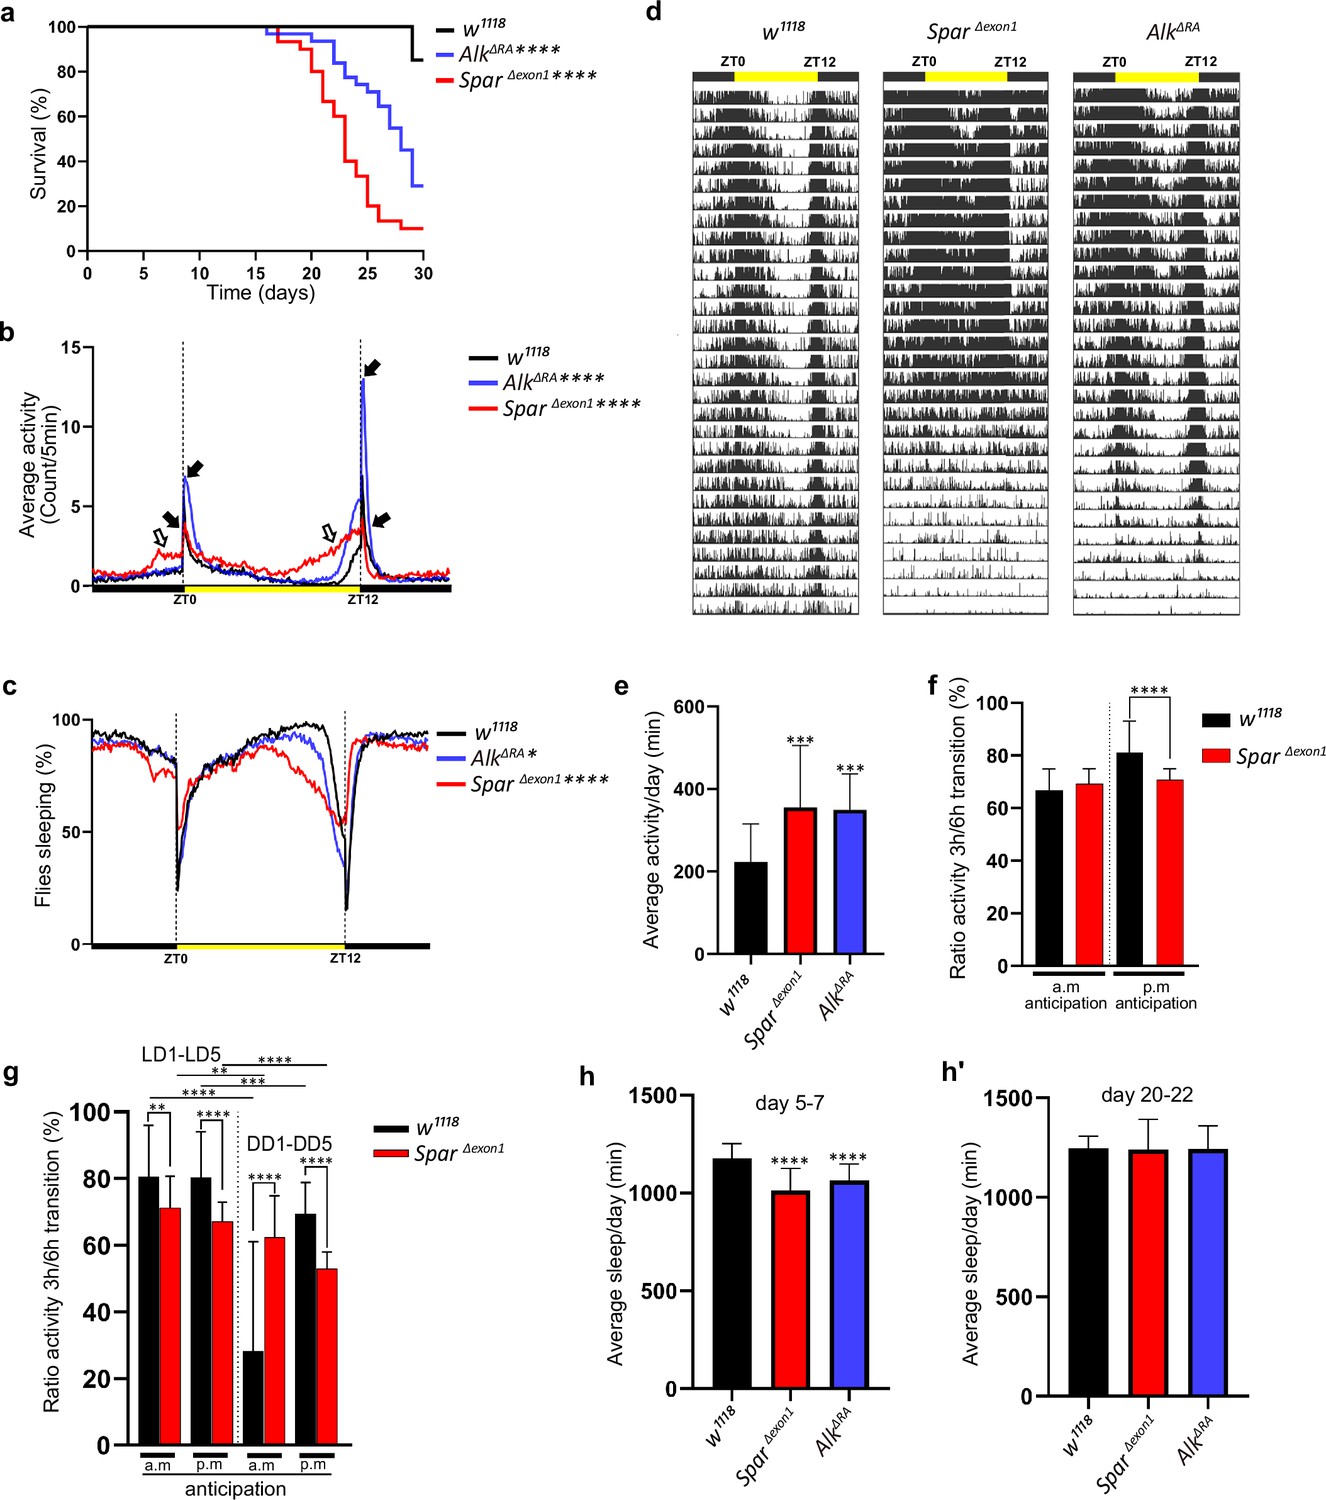
Lifespan and activity plots of SparΔExon1 mutants.
(a) Kaplan-Meier survival curve comparing AlkΔRA (n=31) and SparΔExon1 (n=30) flies to w1118 controls (n=27). Outliers from each group were determined by Tukey’s test, and statistical significance was analyzed by log-rank Mantel-Cox test (****p<0.0001). (b) Representative activity profile graph illustrating average activity count measured every 5 min across a 24 hr span. Black arrows indicate morning and evening activity peaks. Empty arrows indicate anticipatory increase in locomotor activity of SparΔExon1 mutant flies occurring before light transition. One-way ANOVA followed by Tukey’s multiple comparisons post hoc test was used to determine significance between groups (****p<0.0001). w1118 (n=27), SparΔExon1 (n=30), AlkΔRA (n=31). (c) Representative sleep profile, demonstrating the proportion of flies engaged in sleep measured at 5 min intervals over a 24 hr period. One-way ANOVA followed by Tukey’s multiple comparisons post hoc test was used to determine significance between groups (****p<0.0001; *p<0.05). w1118 (n=27), SparΔExon1 (n=30), AlkΔRA (n=31). (d) Representative average actogram of individual flies in each group. Each row corresponds to 1 day, visualized as 288 bars each representing one 5 min interval. Yellow bar represents the time of the day when the lights are turned on, with zeitgeber time 0 (ZT0) indicating the morning peak and ZT12 the evening peak. (e) Mean locomotor activity per day over 30 days. One-way ANOVA followed by Tukey’s multiple comparisons post hoc test was used to determine significance between groups (***p<0.001). w1118 (n=27), SparΔExon1 (n=30), AlkΔRA (n=31). (f) Ratio of the mean activity in the 3 hr preceding light transition over the mean activity in the 6 hr preceding light transition. Activity data was measured over 30 days. a.m. anticipation and p.m. anticipation depict the ratio preceding lights on and lights off respectively. Unpaired Student’s t-test was used to determine the significance between control and SparΔExon1 (****p<0.0001). w1118 (n=27), SparΔExon1 (n=30). (g) Ratio of the mean activity in the 3 hr preceding light transition over the mean activity in the 6 hr preceding light transition. Activity was measured over 5 days in light-dark/dark-dark (LD/DD). a.m. anticipation and p.m. anticipation depict the ratio preceding lights on (or subjective lights on) and lights off (or subjective lights off) respectively. Unpaired Student’s t-test was used to determine the significance between SparΔExon1 and controls (****p<0.0001; **p<0.01); paired Student’s t-test was used to determine significance in each group between the two experimental conditions (****p<0.0001; ***p<0.001; **p<0.01). w1118 (n=32), SparΔExon1 (n=31). (h–h’) Mean sleep per day across a 3 day average (days 5–7 (h), days 20–22 (h’)). One-way ANOVA followed by Tukey’s multiple comparisons post hoc test was used to determine significance between groups (****p<0.0001). w1118 (n=27), SparΔExon1 (n=30), AlkΔRA (n=31). Error bars represent standard deviation.
Figure 8—figure supplement 1
Activity and sleep profiles of SparΔExon1 mutants.
(a) Representative activity profile graph of control (w1118) and SparΔExon1 illustrating average activity count measured every 5 min across a 24 hr span obtained by averaging 5 days in light/dark conditions (LD1-LD5). Unpaired Student’s t-test was used to determine significance (****p<0.0001). w1118 (n=32), SparΔExon1 (n=31). (a’) Mean locomotor activity per day of control and SparΔExon1 obtained by averaging 5 days in light/dark conditions (LD1-LD5). Unpaired Student’s t-test was used to determine significance (****p<0.0001). (b) Representative activity profile graph of control and SparΔExon1 illustrating the average activity count measured every 5 min across a 24 hr span obtained by averaging 5 days in dark/dark conditions (DD1-DD5). Circadian time 0 (CT0) and CT12 represent the start and end of the subjective day in constant dark conditions respectively. Unpaired Student’s t-test was used to determine significance (****p<0.0001). w1118 (n=32), SparΔExon1 (n=31). (b’) Mean locomotor activity per day for control and SparΔExon1 obtained by averaging 5 days in dark/dark conditions (DD1-DD5). Unpaired Student’s t-test was used to determine significance (****p<0.0001). w1118 (n=32), SparΔExon1 (n=31). (c) Representative sleep profile graph of control and SparΔExon1 illustrating the average activity count measured every 5 min across a 24 hr span obtained by averaging 5 days in light/dark conditions (LD1-LD5). Unpaired Student’s t-test was used to determine significance (****p<0.0001). (c’) Graph illustrating mean sleep per day of control and SparΔExon1 obtained by averaging 5 days in light/dark conditions (LD1-LD5). Unpaired Student’s t-test was used to determine significance (****p<0.0001). w1118 (n=32), SparΔExon1 (n=31). (d) Representative sleep profiles of controls and SparΔExon1 illustrating the average activity count measured every 5 min across a 24 hr span obtained by averaging 5 days in dark/dark conditions (DD1-DD5). Unpaired Student’s t-test was used to determine significance (****p<0.0001). w1118 (n=32), SparΔExon1 (n=31). (d’) Mean sleep per day of control and SparΔExon1 obtained by averaging 5 days in dark/dark conditions (DD1-DD5). Unpaired Student’s t-test was used to determine significance (****p<0.0001). w1118 (n=32), SparΔExon1 (n=31). Error bars represent standard deviation.
Figure 8—figure supplement 2
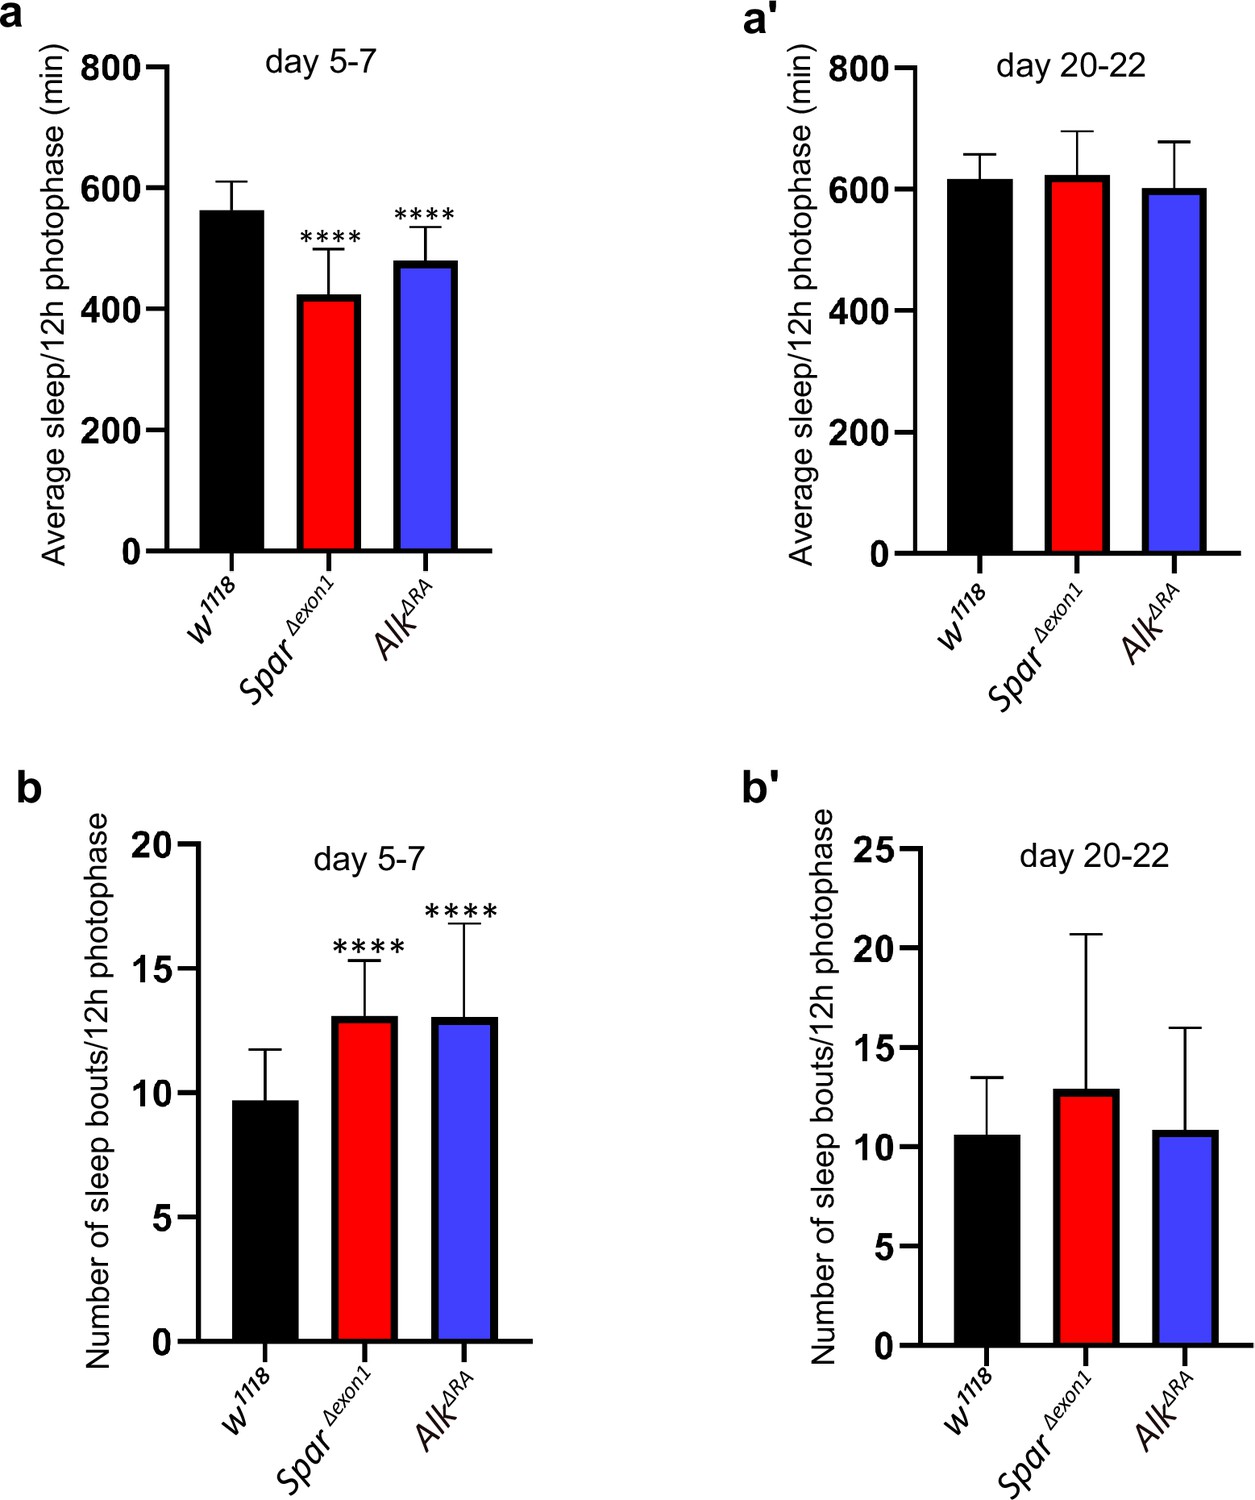
Characterisation of sleep in SparΔExon1 and AlkΔRA mutants.
(a–a’) Mean sleep per 12 hr photophase over 3 days (days 5–7 (a), days 20–22 (a’)). One-way ANOVA followed by Tukey’s multiple comparisons post hoc test was used to determine significance groups (****p<0.0001). w1118 (n=27), SparΔExon1 (n=30), AlkΔRA (n=31). (b–b’) Graph illustrating the average number of sleep bouts for 12 hr photophase over 3 days (days 5–7 (b), days 20–22 (b’)). A one-way ANOVA followed by Tukey’s multiple comparisons post hoc test was used to determine the significance between groups (****p<0.0001). w1118 (n=27), SparΔExon1 (n=30), AlkΔRA (n=31). Error bars represent standard deviation.
Figure 8—figure supplement 3
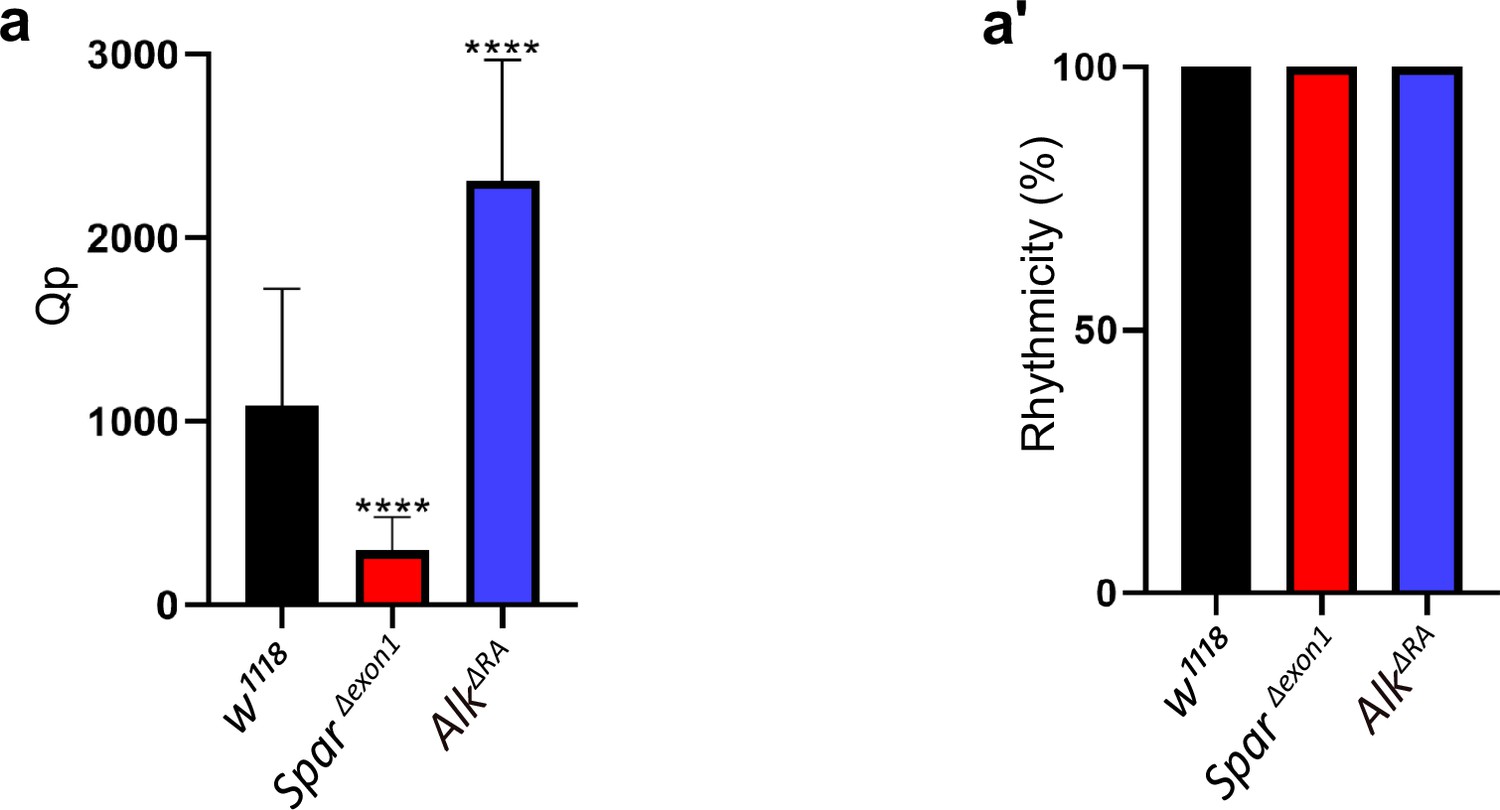
SparΔExon1 flies retain a hyperactive profile when shifted to dark/dark conditions.
(a) Graph illustrating the Qp statistical value (rhythmicity power) obtained by generating chi-square periodograms of control (w1118), SparΔExon1, and AlkΔRA flies. One-way ANOVA followed by Tukey’s multiple comparisons post hoc test was used to determine significance between groups (****p<0.0001). w1118 (n=27), SparΔExon1 (n=30), AlkΔRA (n=31). (a’) Representative graph of percentage of rhythmicity of w1118, SparΔExon1, and AlkΔRA flies. w1118 (n=27), SparΔExon1 (n=30), AlkΔRA (n=31). Error bars represent standard deviation.
Figure 8—figure supplement 4
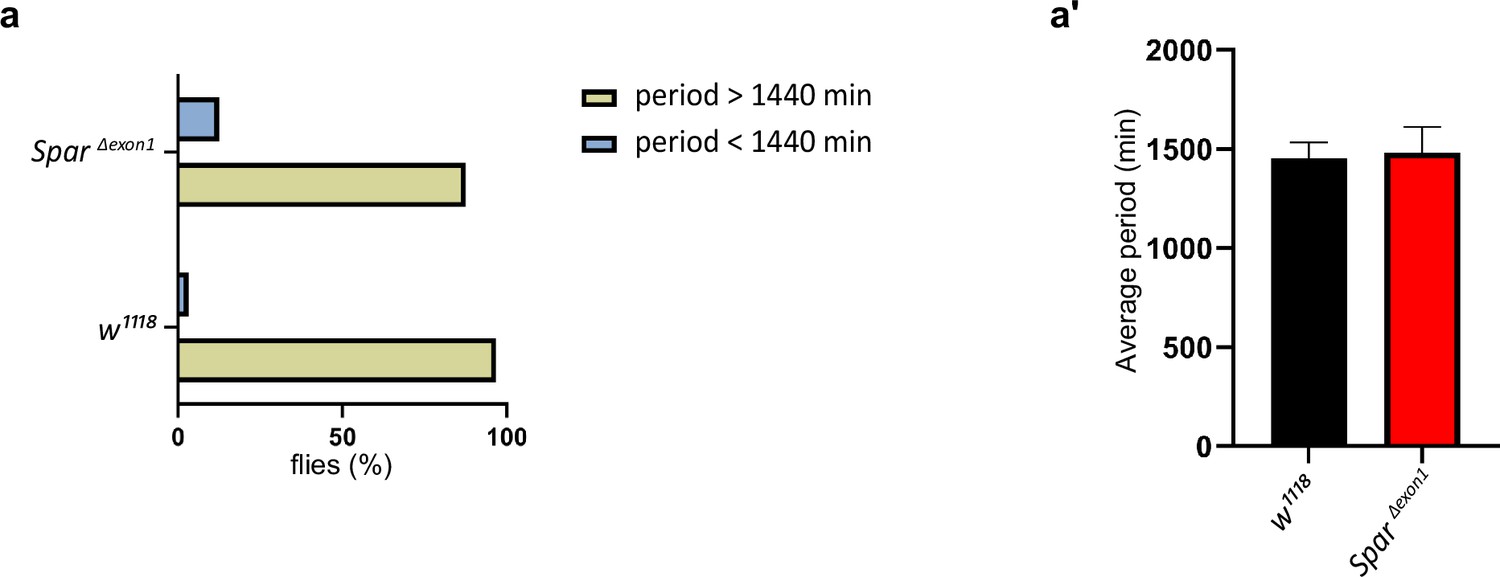
Circadian period length in SparΔExon1 mutants.
(a) Graph illustrating the percentage of arrhythmic flies, and flies with a period higher or lower than 1440 min (24 hr). Flies were maintained under light-dark (LD) conditions and 14 days were selected to calculate the period by generating chi-Square periodograms for each fly in the group. Only data from rhythmic flies was selected to calculate the percentage of flies having a higher or lower period than 1440 min. (a’) Average periods of flies over 14 days in LD conditions. Flies with an arrhythmic profile were not selected for statistical analysis. Unpaired Student’s t-test was used to determine the significance between the two groups. Error bars represent standard deviation.
Figure 9 with 3 supplements
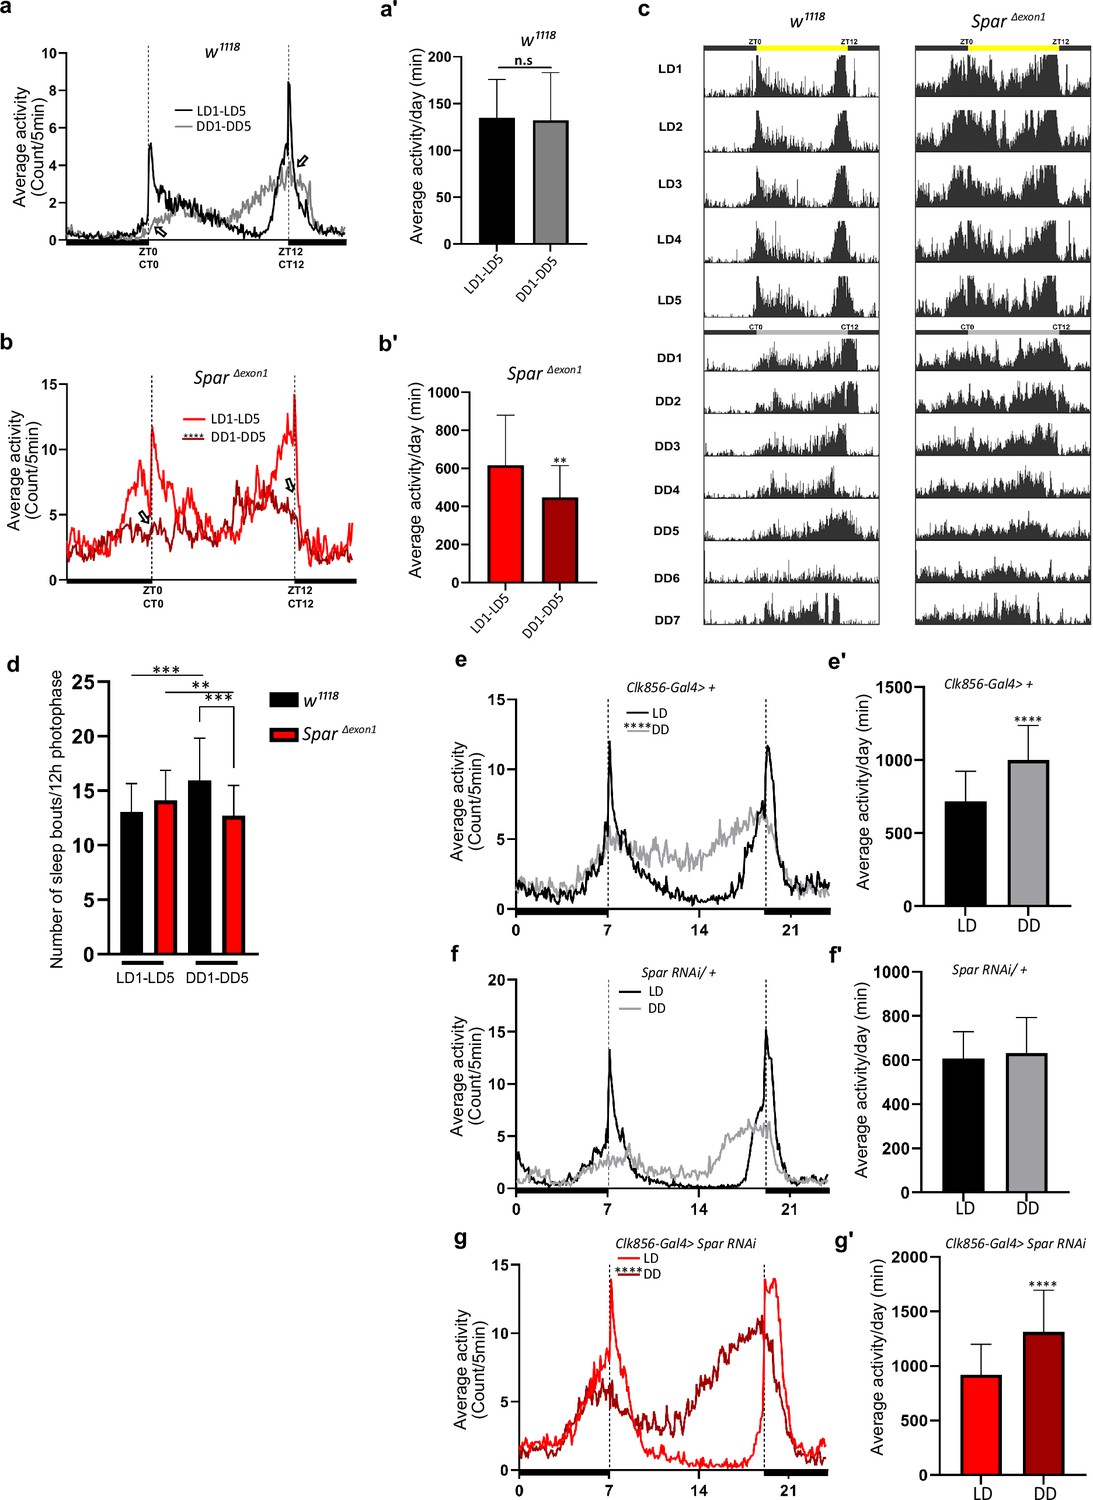
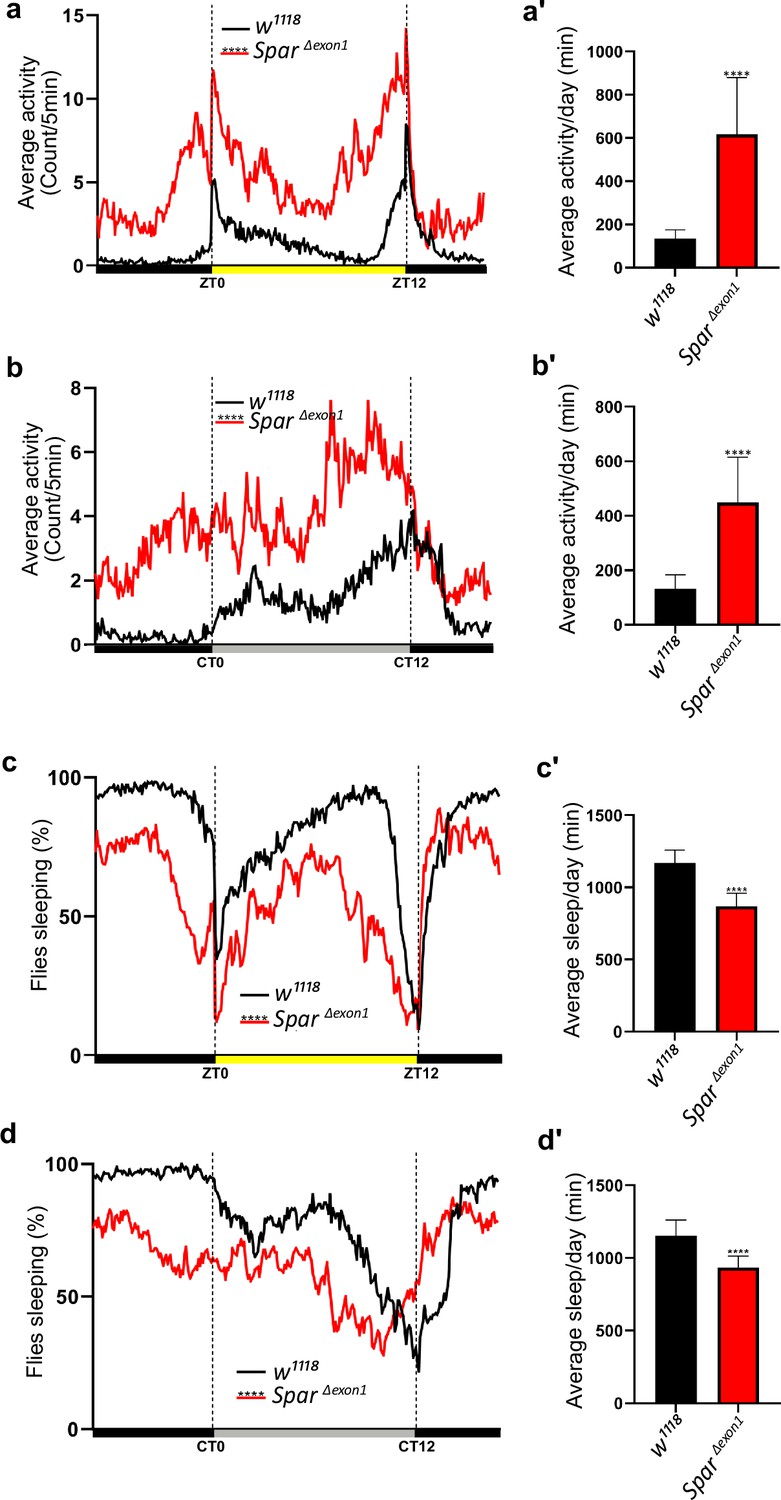
SparΔExon1 mutants exhibit circadian activity disturbances.
(a) Representative activity profile for w1118 controls, illustrating the average activity count measured every 5 min across a 24 hr span for light-dark (LD) for 5 cycles (black line), subsequently switching to dark-dark (DD) for 5 cycles (gray lines). Zeitgeber time 0 (ZT0) and ZT12 represent the start and end of the photoperiod respectively. Circadian time 0 (CT0) and CT12 represent the start and end of the subjective day in constant dark conditions. Empty arrows indicate morning and evening peaks at CT0 and CT12 respectively. Paired Student’s t-test was used to determine significance. w1118 (n=32). (a’) Mean locomotor activity per day in controls obtained by averaging 5 days in LD conditions (LD1-LD5) and 5 days in DD conditions (DD1-DD5). Paired Student’s t-test was used to determine significance. w1118 (n=32). (b) Representative activity profile graph of SparΔExon1 illustrating the average activity count measured every 5 min across 24 hr obtained by averaging 5 days in LD conditions (LD1-LD5) and 5 days in DD conditions (DD1-DD5). Empty arrows indicate morning and evening peaks at CT0 and CT12 respectively. Paired Student’s t-test was used to determine significance between the two experimental conditions (****p<0.0001). SparΔExon1 (n=31). (b’) Mean locomotor activity per day of SparΔExon1 obtained by averaging 5 days in LD conditions (LD1-LD5) and 5 days in DD conditions (DD1-DD5). Paired Student’s t-test was used to determine significance (****p<0.0001). SparΔExon1 (n=31). (c) Representative average actograms of individual w1118 flies (n=32) and SparΔExon1 flies (n=31) in LD and DD conditions. Each row corresponds to 1 day, visualized in 288 bars each representing one 5 min interval. ZT0 and ZT12 represent the start and end of the photoperiod respectively. CT0 and CT12 represent the start and end of the subjective day in constant dark conditions. (d) Average number of sleep bouts for 12 hr photophase over 5 days in LD and the corresponding time over 5 days in DD. Unpaired Student’s t-test was used to determine significance between control (w1118) and SparΔExon1 (***p<0.001). Paired Student’s t-test was used to determine significance between the two experimental conditions (***p<0.001; **p<0.01). w1118 (n=32), SparΔExon1 (n=31). (e) Representative activity profile graph of Clk856-Gal4>+ illustrating the average activity count measured every 5 min across a 24 hr span for LD for 5 cycles (black line) and subsequently switching to DD for 5 cycles (gray lines). Paired Student’s t-test was used to determine significance (****p<0.0001). Clk856-Gal4>+ (n=32). (e’) Mean locomotor activity per day of Clk856-Gal4>+ obtained by averaging 5 days in LD conditions (LD1-LD5) and 5 days in DD conditions (DD1- DD5). Paired Student’s t-test was used to determine significance (****p<0.0001). Clk856-Gal4>+ (n=32). Clk856-GAL4>UAS Spar RNAi (n=27). (f) Representative activity profile graph of UAS-Spar RNAi>+ illustrating the average activity count measured every 5 min across 24 hr span obtained by averaging 5 days in LD conditions (LD1-LD5) and 5 days in DD conditions (DD1-DD5). A paired Student’s t-test was used to determine the significance between the two experimental conditions. UAS-Spar RNAi>+ (n=32). (f') Graph illustrating the mean locomotor activity per day of UAS-Spar RNAi>+ obtained by averaging 5 days in LD conditions (LD1-LD5) and 5 days in DD conditions (DD1-DD5). A paired Student’s t-test was used to determine the significance between the two experimental conditions. UAS-Spar RNAi>+ (n=32). (g) Representative activity profile graph of Clk856-Gal4>UAS Spar RNAi illustrating the average activity count measured every 5 min across 24 hr span obtained by averaging 5 days in LD conditions (LD1-LD5) and 5 days in DD conditions (DD1-DD5). Paired Student’s t-test was used to determine significance (****p<0.0001). Clk856-GAL4>UAS Spar RNAi (n=27). (g’) Mean locomotor activity per day for Clk856-Gal4>UAS Spar RNAi obtained by averaging 5 days in LD conditions (LD1-LD5) and 5 days in DD conditions (DD1-DD5). Paired Student’s t-test was used to determine the significance (****p<0.0001). Error bars represent standard deviation.
Figure 9—figure supplement 1
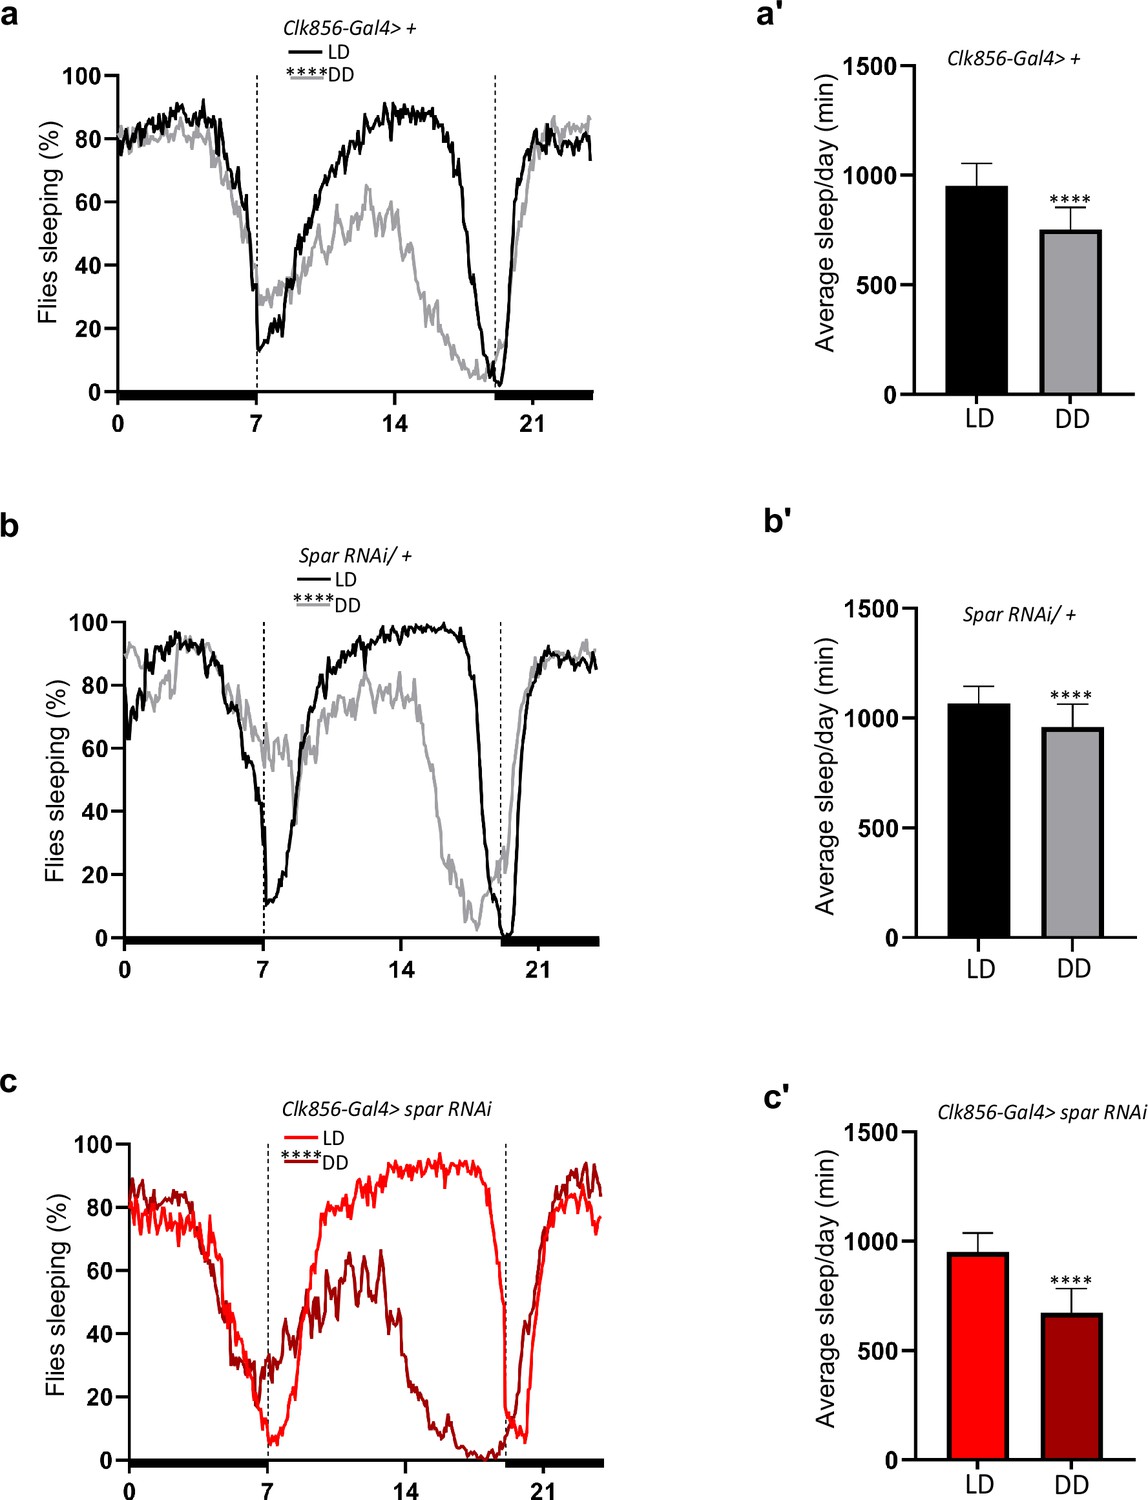
SparΔExon1 mutants exhibit disturbed sleep patterns.
(a) Representative sleep profile graph of Clk856-Gal4>+ illustrating the percentage of time sleeping measured every 5 min across a 24 hr span obtained by averaging 5 days in light/dark conditions (LD1-LD5) and 5 days in dark/dark conditions (DD1- DD5). Paired Student’s t-test was used to determine significance (****p<0.0001). Clk856-Gal4>+ (n=32). (a’) Mean sleep per day of Clk856-Gal4>+ obtained by averaging 5 days in light/dark conditions (LD1-LD5) and 5 days in dark/dark conditions (DD1-DD5). Paired Student’s t-test was used to determine significance (****p<0.0001). Clk856-Gal4>+ (n=32). (b) Representative sleep profile of UAS-Spar RNAi >+ illustrating the percentage of time that flies spend sleeping measured every 5 min across a 24 hr span obtained by averaging 5 days in light/dark conditions (LD1-LD5) and 5 days in dark/dark conditions (DD1-DD5). Paired Student’s t-test was used to determine the significance between the two experimental conditions (****p<0.0001). UAS-Spar RNAi/+ (n=32). (b’) Mean sleep per day of UAS-Spar RNAi/+ obtained by averaging 5 days in light/dark conditions (LD1-LD5) and 5 days in dark/dark conditions (DD1-DD5). Paired Student’s t-test was used to determine the significance between the two experimental conditions (****p<0.0001). UAS-Spar RNAi/+ (n=32). (c) Representative sleep profile graph of Clk856-Gal4>Spar RNAi illustrating the percentage of time sleeping measured every 5 min across a 24 hr span obtained by averaging 5 days in light/dark conditions (LD1-LD5) and 5 days in dark/dark conditions (DD1-DD5). Paired Student’s t-test was used to determine significance (****p<0.0001). Clk856-Gal4>UAS Spar RNAi (n=27). (c’) Mean sleep per day of Clk856-Gal4>Spar RNAi obtained by averaging 5 days in light/dark conditions (LD1-LD5) and 5 days in dark/dark conditions (DD1-DD5). Paired Student’s t-test was used to determine significance (****p<0.0001). Clk856-Gal4>UAS Spar RNAi (n=27). Error bars represent standard deviation.
Figure 9—figure supplement 2
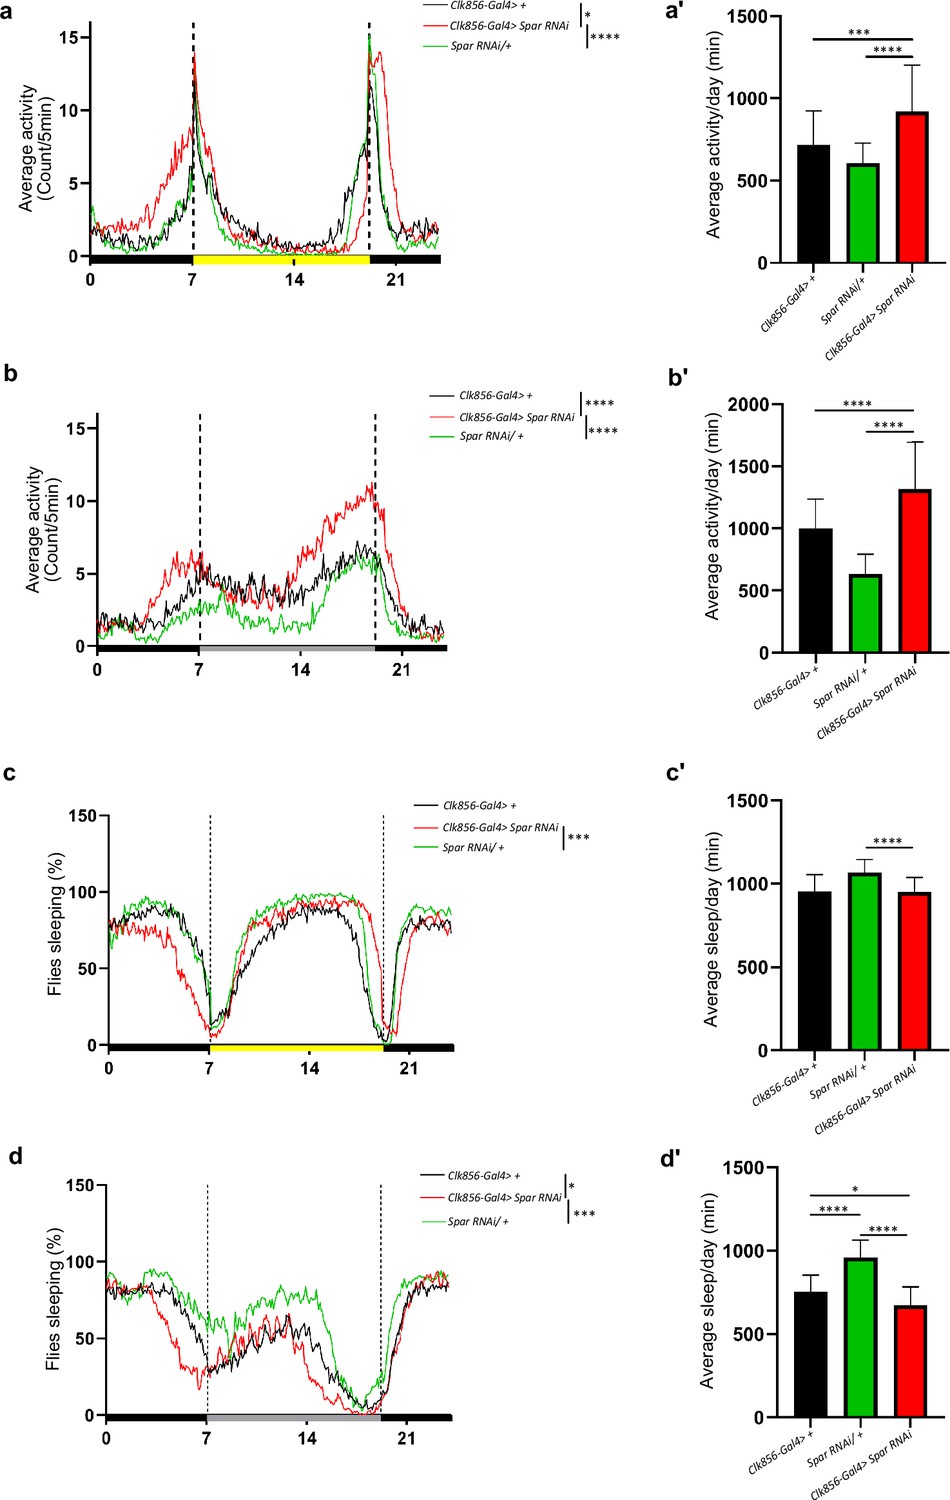
Clock neuron specific Spar RNAi leads to sleep and activity disturbances.
(a) Representative activity profile graph of UAS-Spar RNAi driven by Clk856-Gal4 and the two control groups Clk856-Gal4>+ and UAS-Spar RNAi/+ illustrating the average activity count measured every 5 min across 24 hr obtained by averaging 5 days in light/dark conditions (LD1-LD5). One-way ANOVA followed by Tukey’s multiple comparisons post hoc test was used to determine the significance between groups (*p<0.05, ***p<0.001). Clk856-Gal4>+ (n=32), Clk856-Gal4>UAS Spar RNAi (n=27), and UAS-Spar RNAi/+ (n=32). (a’) Graph illustrating mean locomotor activity per day of Clk856-Gal4>+, Clk856-Gal4>UAS Spar RNAi, and UAS-Spar RNAi/+ obtained by averaging 5 days in light/dark conditions (LD1-LD5). One-way ANOVA followed by Tukey’s multiple comparison post hoc test was used to determine the significance between groups (***p<0.001, ****p<0.0001). Clk856-Gal4>+ (n=32), Clk856-GAL4>UAS Spar RNAi (n=27), and UAS-Spar RNAi/+ (n=32). (b) Representative activity profile graph of UAS-Spar RNAi driven by Clk856-Gal4 and the two control groups Clk856-Gal4>+ and UAS-Spar RNAi/+ illustrating the average activity count measured every 5 min across a 24 hr span obtained by averaging 5 days in dark/dark conditions (DD1-DD5). One-way ANOVA followed by Tukey’s multiple comparison post hoc test was used to determine the significance between groups (****p<0.0001). Clk856-Gal4>+ (n=32), Clk856-Gal4>UAS Spar RNAi (n=27), and UAS-Spar RNAi/+ (n=32). (b’) Graph illustrating the mean locomotor activity per day of Clk856-Gal4>+, Clk856-Gal4>UAS Spar RNAi, and UAS-Spar RNAi/+ obtained by averaging 5 days in dark/dark conditions (DD1-DD5). One-way ANOVA followed by Tukey’s multiple comparison post hoc test was used to determine the significance between groups (****p<0.0001). Clk856-Gal4>+ (n=32), Clk856-Gal4>UAS Spar RNAi (n=27), and UAS-Spar RNAi/+ (n=32). (c) Representative sleep profile graph of UAS-Spar RNAi driven by Clk856-Gal4 and the two control groups Clk856-Gal4>+ and UAS-Spar RNAi/+ illustrating the average activity count measured every 5 min across a 24 hr span obtained by averaging 5 days in light/dark conditions (LD1-LD5). One-way ANOVA followed by Tukey’s multiple comparison post hoc test was used to determine the significance between groups (***p<0.01). Clk856-Gal4>+ (n=32), Clk856-GAL4>UAS Spar RNAi (n=27), and UAS-Spar RNAi>+ (n=32). (c’) Graph illustrating the mean sleep per day of Clk856-Gal4>+, Clk856-Gal4>UAS Spar RNAi, and UAS-Spar RNAi/+ obtained by averaging 5 days in light/dark conditions (LD1-LD5). One-way ANOVA followed by Tukey’s multiple comparison post hoc test was used to determine the significance between groups (****p<0.0001). (d) Representative sleep profile graph of UAS-Spar RNAi driven by Clk856-Gal4 and the two control groups Clk856-Gal4>+ and UAS-Spar RNAi/+ illustrating the average activity count measured every 5 min across a 24 hr span obtained by averaging 5 days in dark/dark conditions (DD1-DD5). One-way ANOVA followed by Tukey’s multiple comparison post hoc test was used to determine the significance between groups (*p<0.005, ****p<0.0001). Clk856-Gal4>+ (n=32), Clk856-Gal4>UAS Spar RNAi (n=27), and UAS-Spar RNAi/+ (n=32). (d’) Graph illustrating the mean sleep per day of Clk856-Gal4>+, Clk856-Gal4>UAS Spar RNAi, and UAS-Spar RNAi/+ obtained by averaging 5 days in dark/dark conditions (DD1-DD5). One-way ANOVA followed by Tukey’s multiple comparisons post hoc test was used to determine the significance between groups (*p<0.05, ****p<0.0001). Clk856-Gal4>+ (n=32), Clk856-Gal4>UAS Spar RNAi (n=27), and UAS-Spar RNAi/+ (n=32). Error bars represent standard deviation.
Figure 9—figure supplement 3
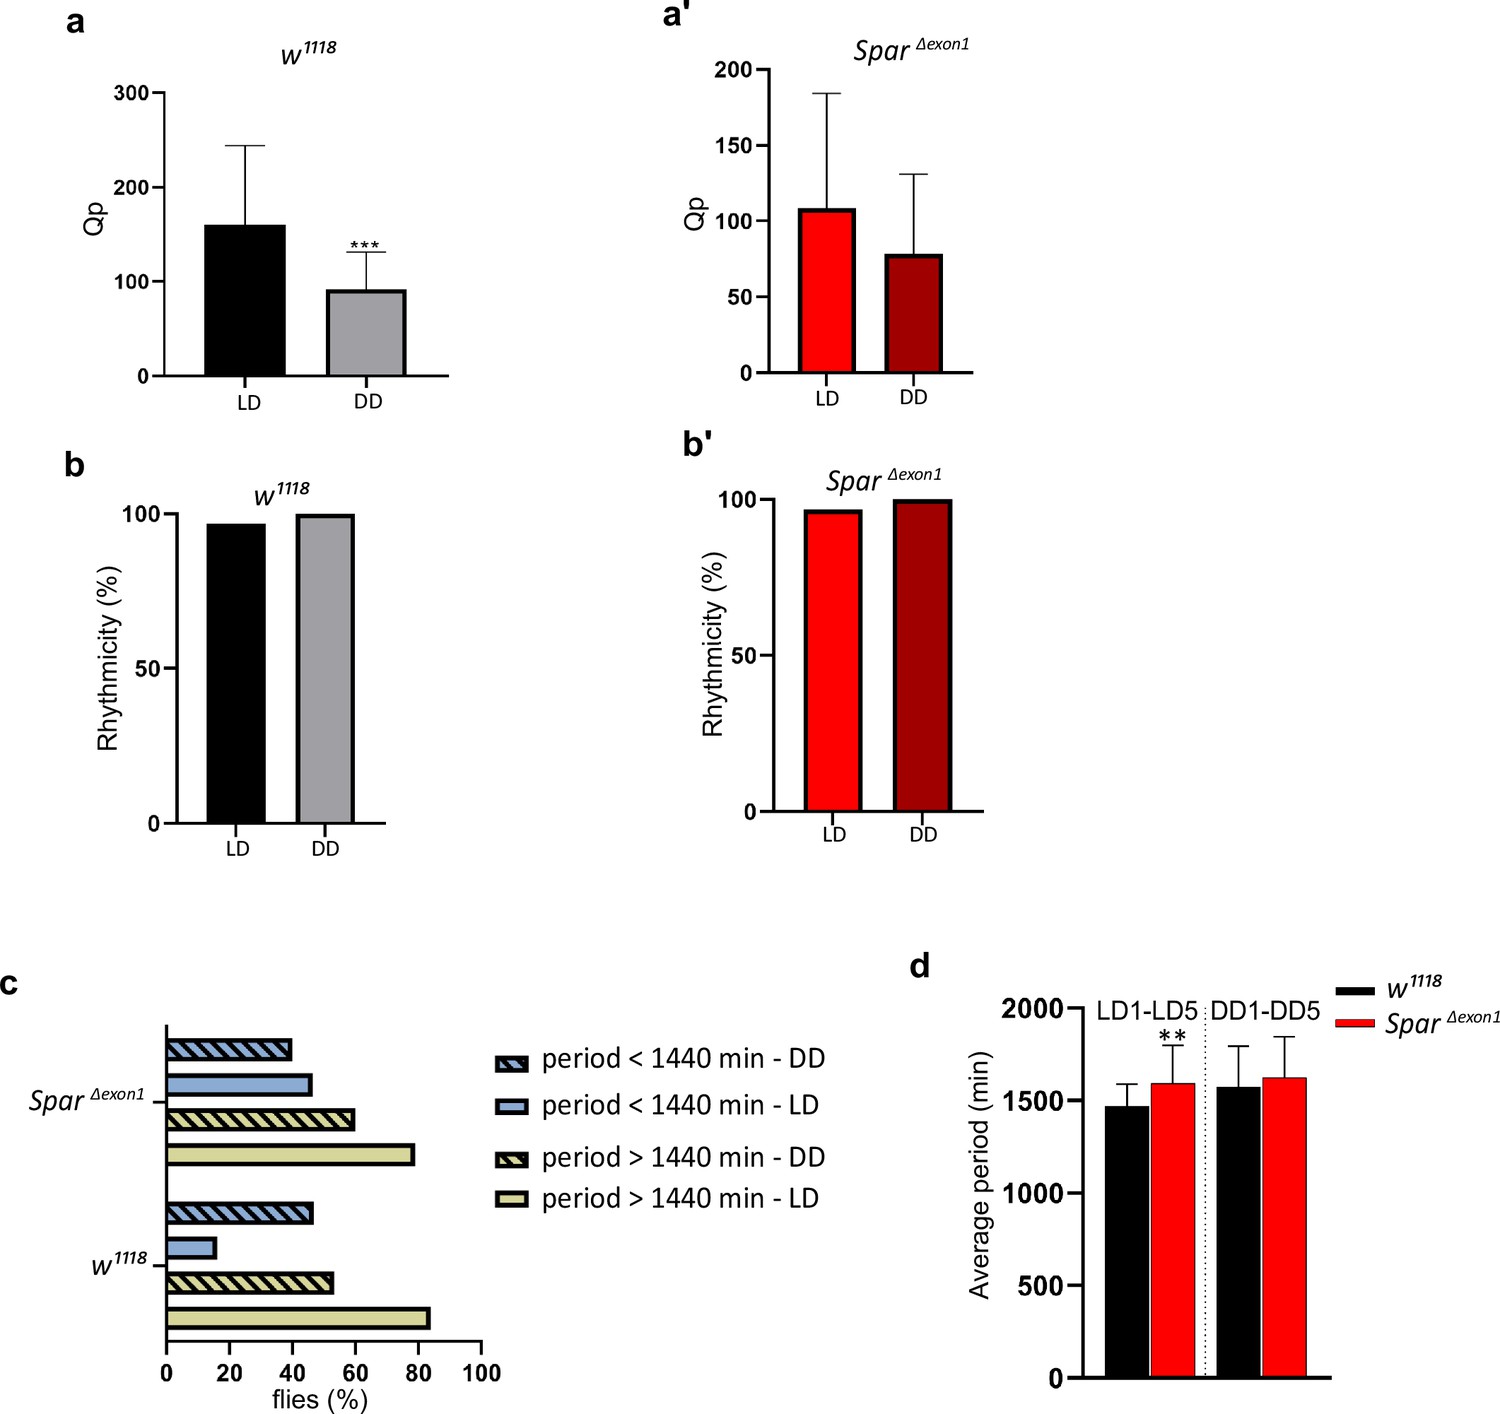
Rhythmicity and circadian period length in SparΔExon1 mutants.
(a) Qp statistical value obtained by generating chi-square periodograms of control (w1118) flies in 5 days light-dark (LD) and 7 days dark-dark (DD) conditions. Paired Student’s t-test was used to determine significance (***p<0.001). w1118 (n=32). (a’) Qp statistical value obtained by generating chi-square periodograms of SparΔExon1 flies in 5 days LD and 7 days DD conditions. Paired Student’s t-test was used to determine significance. SparΔExon1 (n=31). (b) Percentage rhythmicity of control (w1118) flies in LD vs DD conditions. w1118 (n=32). (b’) Percentage rhythmicity of SparΔExon1 flies in LD vs DD conditions. SparΔExon1 (n=31). (c) Percentage of flies with a period higher or lower than 1440 min (24 hr). Flies were maintained for 5 days under LD conditions and shifted to 7 days under DD (free-run). The period was calculated by generating Chi-square periodograms for each fly in the group. Only data from rhythmic flies was selected to calculate the percentage of flies having a period higher or lower than 1440 min. w1118 (n=32), SparΔExon1 (n=31). (d) Graph illustrating the average periods of flies over 5 days in LD and 7 days in DD (free-run). Flies with an arrhythmic profile were not selected for the statistical analysis. An unpaired Student’s t-test was used to determine the significance between the two groups (**p<0.01). w1118 (n=32), SparΔExon1 (n=31). Error bars represent standard deviation.
Tables
Key resources table
| Reagent type (species) or resource | Designation | Source or reference | Identifiers | Additional information |
|---|---|---|---|---|
| Gene (Drosophila melanogaster) | CG4577 | FlyBase | FLYB:FBgn0031306 | Named as Sparkly (Spar) in this paper |
| Genetic reagent (D. melanogaster) | w1118 | Bloomington Drosophila Stock Center | BDSC:3605 | |
| Genetic reagent (D. melanogaster) | Dimm-Gal4 | Bloomington Drosophila Stock Center | BDSC:25373 | Also known as C929-Gal4 |
| Genetic reagent (D. melanogaster) | Clk856-Gal4 | Bloomington Drosophila Stock Center | BDSC:93198 | |
| Genetic reagent (D. melanogaster) | C155-Gal4 | Bloomington Drosophila Stock Center | BDSC:458 | |
| Genetic reagent (D. melanogaster) | UAS-Spar RNAi | Vienna Drosophila Resource Center | VDRC:37830 | |
| Genetic reagent (D. melanogaster) | UAS-LT3-NDam-Pol II | Southall et al., 2013 | ||
| Genetic reagent (D. melanogaster) | UAS-AlkDN | Bazigou et al., 2007 | P{UAS-Alk.EC.MYC} | |
| Genetic reagent (D. melanogaster) | UAS-Jeb | Varshney and Palmer, 2006 | ||
| Genetic reagent (D. melanogaster) | UAS-GFPcaax | Finley et al., 1998 | ||
| Genetic reagent (D. melanogaster) | AlkY1335S | Pfeifer et al., 2022 | ||
| Genetic reagent (D. melanogaster) | AlkΔRA | Pfeifer et al., 2022 | ||
| Genetic reagent (D. melanogaster) | SparΔExon1 | This paper | ||
| Genetic reagent (D. melanogaster) | UAS-Spar | This paper | ||
| Antibody | Anti-Alk (Guinea pig polyclonal) | Lorén et al., 2003 | IF(1:1000) | |
| Antibody | Anti-Alk (Rabbit polyclonal) | Lorén et al., 2003 | IF(1:1000) | |
| Antibody | Anti-Alk (Guinea pig polyclonal) | Allan et al., 2005 | IF(1:1000) | |
| Antibody | Anti-GFP (Chicken polyclonal) | Abcam | Ab13970 | IF(1:1000) |
| Antibody | Anti-PDF (Mouse polyclonal) | Developmental Studies Hybridoma Bank (DSHB) | DSHB#C7 | IF(1:1000) |
| Antibody | Anti-Ilp2 (Rabbit polyclonal) | Veenstra et al., 2008 | IF(1:1000) | |
| Antibody | Anti-Dh44 (Rabbit polyclonal) | Cabrero et al., 2002 | IF(1:1000) | |
| Antibody | Anti-AstA (Rabbit polyclonal) | Stay et al., 1992; Vitzthum et al., 1996 Jena Bioscience GmbH | Cat#ABD-062 | IF(1:3000) |
| Antibody | Anti-Lk (Rabbit polyclonal) | Cantera and Nässel, 1992 | IF(1:1000) | |
| Antibody | Anti-Spar (Guinea pig polyclonal) | This paper | IF(1:2000), WB (1:1000) | |
| Sequence-based reagent | sparΔExon1_F | This paper | PCR primers | caagtgaggcaattagccagaat |
| Sequence-based reagent | sparΔExon1_R | This paper | PCR primers | aacgagatgagctccgagatgg |
| Software, algorithm | Fiji | Schindelin et al., 2012 | ||
| Software, algorithm | GraphPad Prism 8 | GraphPad Software | GraphPad Prism 8 |
Additional files
-
Supplementary file 1
Targeted DamID (TaDa) data AlkDN downregulated genes (Sheet 1).
RNA-seq normalized read count data of CG4577 in control (w1118), AlkRA, and AlkY1355S conditions (Sheet 2). RNA-seq average normalized read count data of Spar in ventral lateral neuron (LNv), dorsal lateral neuron (LNd), and dorsal neuron 1 (DN1) clock neuronal cells (Sheet 3). SparΔExon1 mutant CRISPR single guide RNA target and screening primer information (Sheet 4).
- https://cdn.elifesciences.org/articles/88985/elife-88985-supp1-v1.xlsx
-
MDAR checklist
- https://cdn.elifesciences.org/articles/88985/elife-88985-mdarchecklist1-v1.docx
Download links
A two-part list of links to download the article, or parts of the article, in various formats.
Downloads (link to download the article as PDF)
Open citations (links to open the citations from this article in various online reference manager services)
Cite this article (links to download the citations from this article in formats compatible with various reference manager tools)
The Alk receptor tyrosine kinase regulates Sparkly, a novel activity regulating neuropeptide precursor in the Drosophila central nervous system
eLife 12:RP88985.
https://doi.org/10.7554/eLife.88985.5


