Sex-biased regulatory changes in the placenta of native highlanders contribute to adaptive fetal development
- State Key Laboratory of Genetic Resources and Evolution, Kunming Institute of Zoology, Chinese Academy of Sciences, China
- Kunming College of Life Science, University of Chinese Academy of Sciences, China
- Fukang Obstetrics, Gynecology and Children Branch Hospital, Tibetan Fukang Hospital, China
- State Key Laboratory of Primate Biomedical Research, Institute of Primate Translational Medicine, Kunming University of Science and Technology, China
- Center for Excellence in Animal Evolution and Genetics, Chinese Academy of Sciences, China
Figures
Figure 1 with 2 supplements
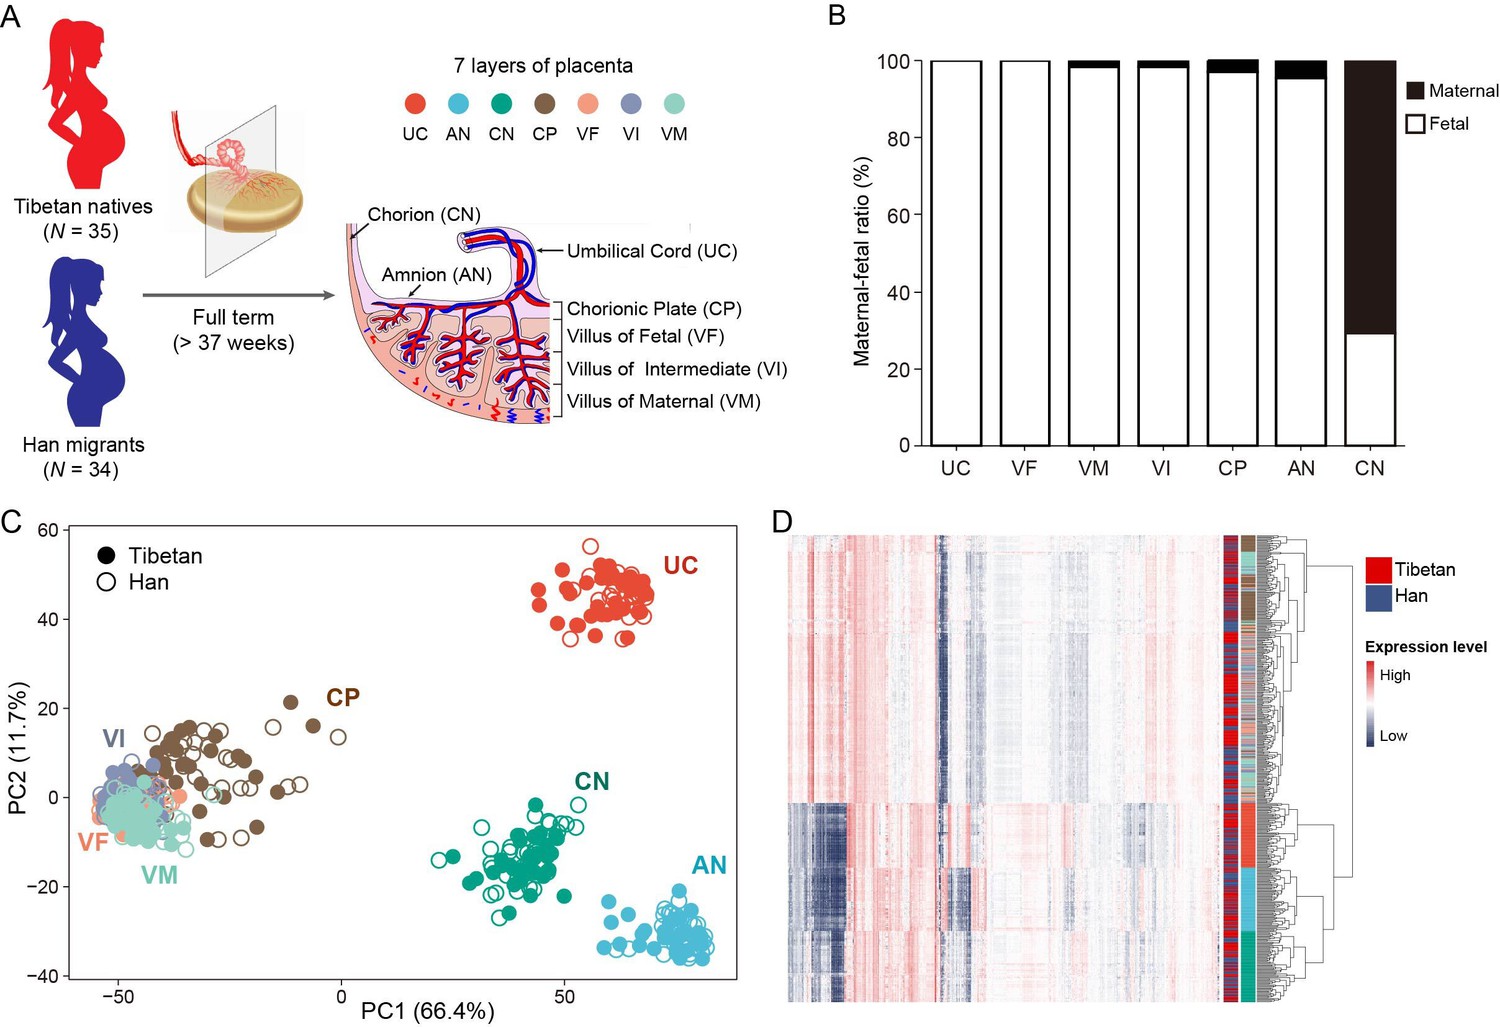
Sampling strategy and gene expression patterns of the placental layers of Tibetans and Han migrants at high altitude.
(A) The strategy of sampling the full-term placentas. The placenta was dissected into seven layers, as shown from the fetal side to the maternal side, are umbilical cord (UC), amnion (AN), chorion (CN), chorionic plate (CP), villus of fetal (VF), villus of intermediate (VI), and villus of maternal (VM). The seven layers are labeled with seven different colors. (B) Analysis of the maternal-fetal origins of the placental layers. (C) The map of principal component analysis (PCA) showing the clustering pattern of placental tissue layers. (D) The heat map of gene expression in the seven placental layers of Tibetans and Han migrants reveals the same clustering pattern seen in the PCA map. The layers are color-coded (see panel A).
Figure 1—figure supplement 1
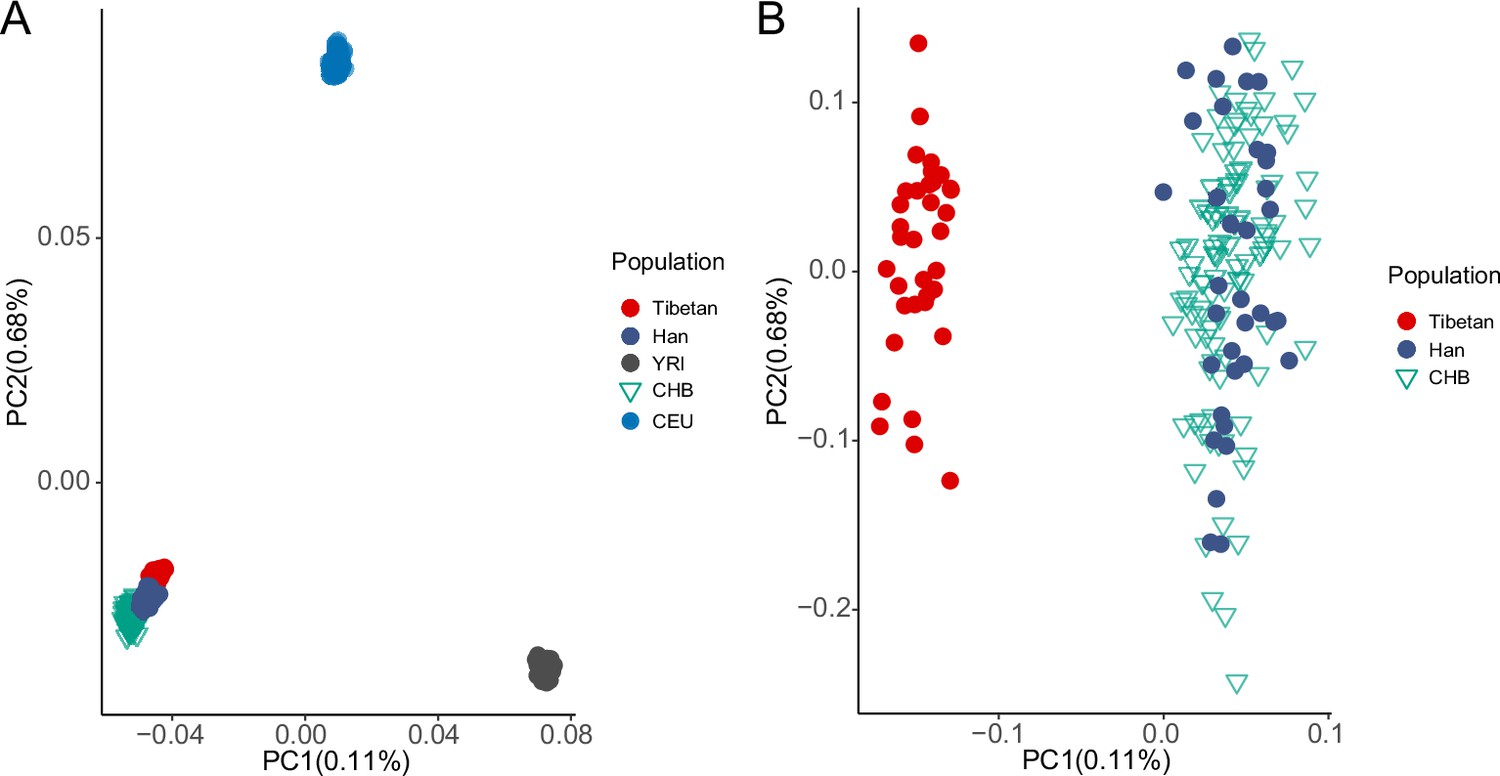
The principal component analysis (PCA) plot of the 69 individuals in this study.
(A) The PCA plot of the 69 individuals (35 Tibetans and 34 Han migrants) based on the genome-wide variants, indicating their East Asian ancestry. (B) The zoom-in PCA plot displays the genetic divergence between Tibetans and Han, and no admixture is seen in the studied 69 individuals.
Figure 1—figure supplement 2
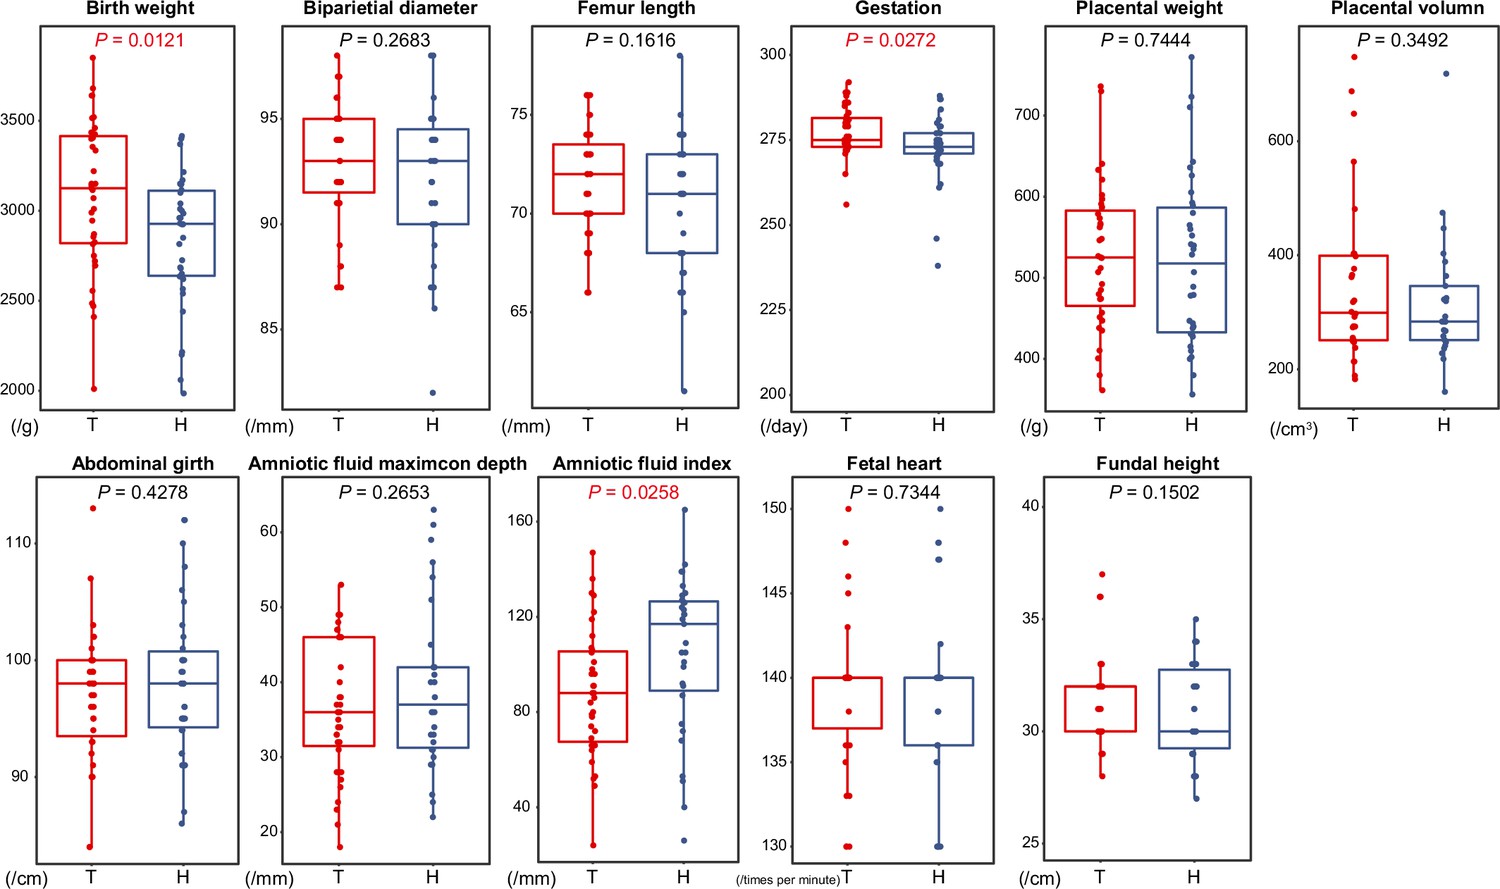
Comparison of 11 reproductive traits between 35 Tibetans and 34 Han immigrants.
Univariate comparisons of the average value of each trait cross-population were made by using the unpaired Student’s t test. Data are represented as mean ± standard error.
Figure 2 with 1 supplement
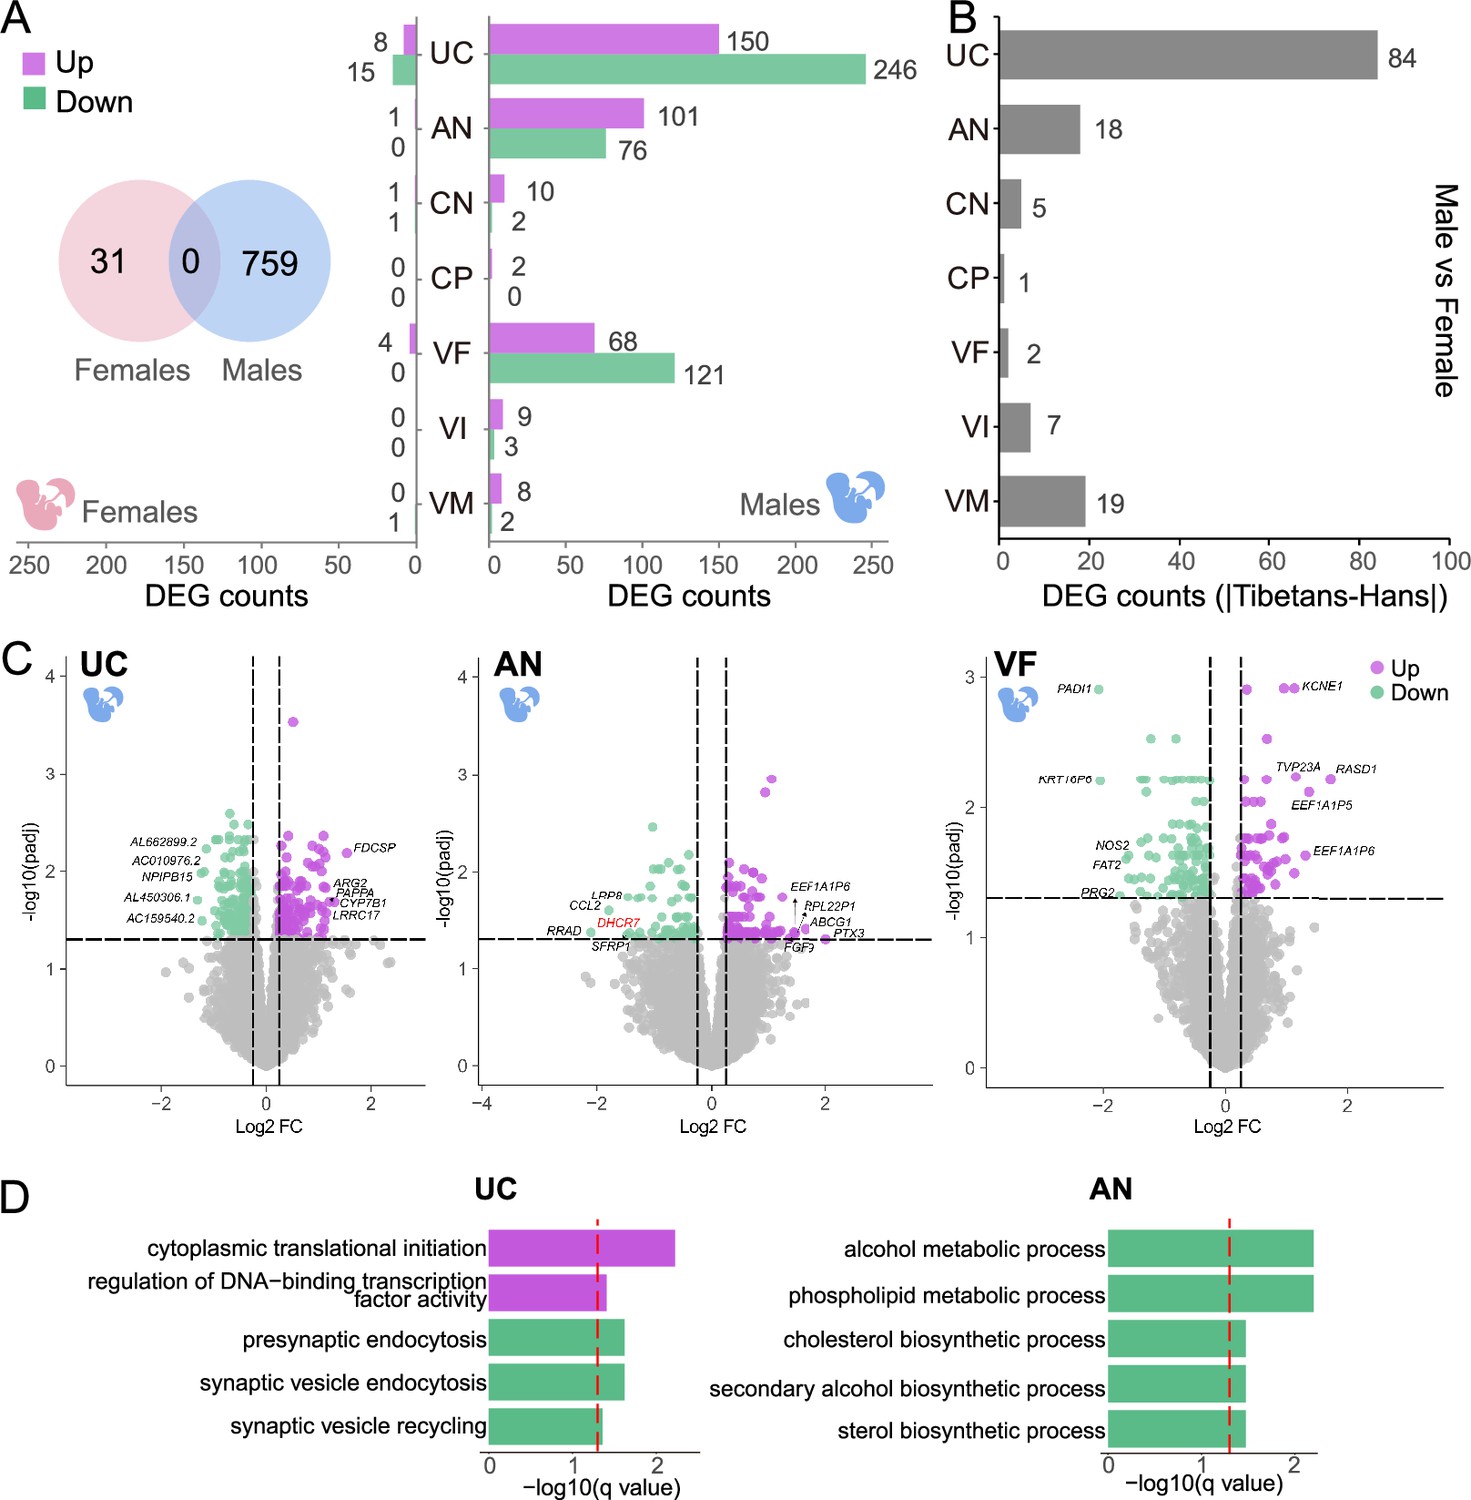
The gene expression differences of the placental layers between Tibetans and Han migrants.
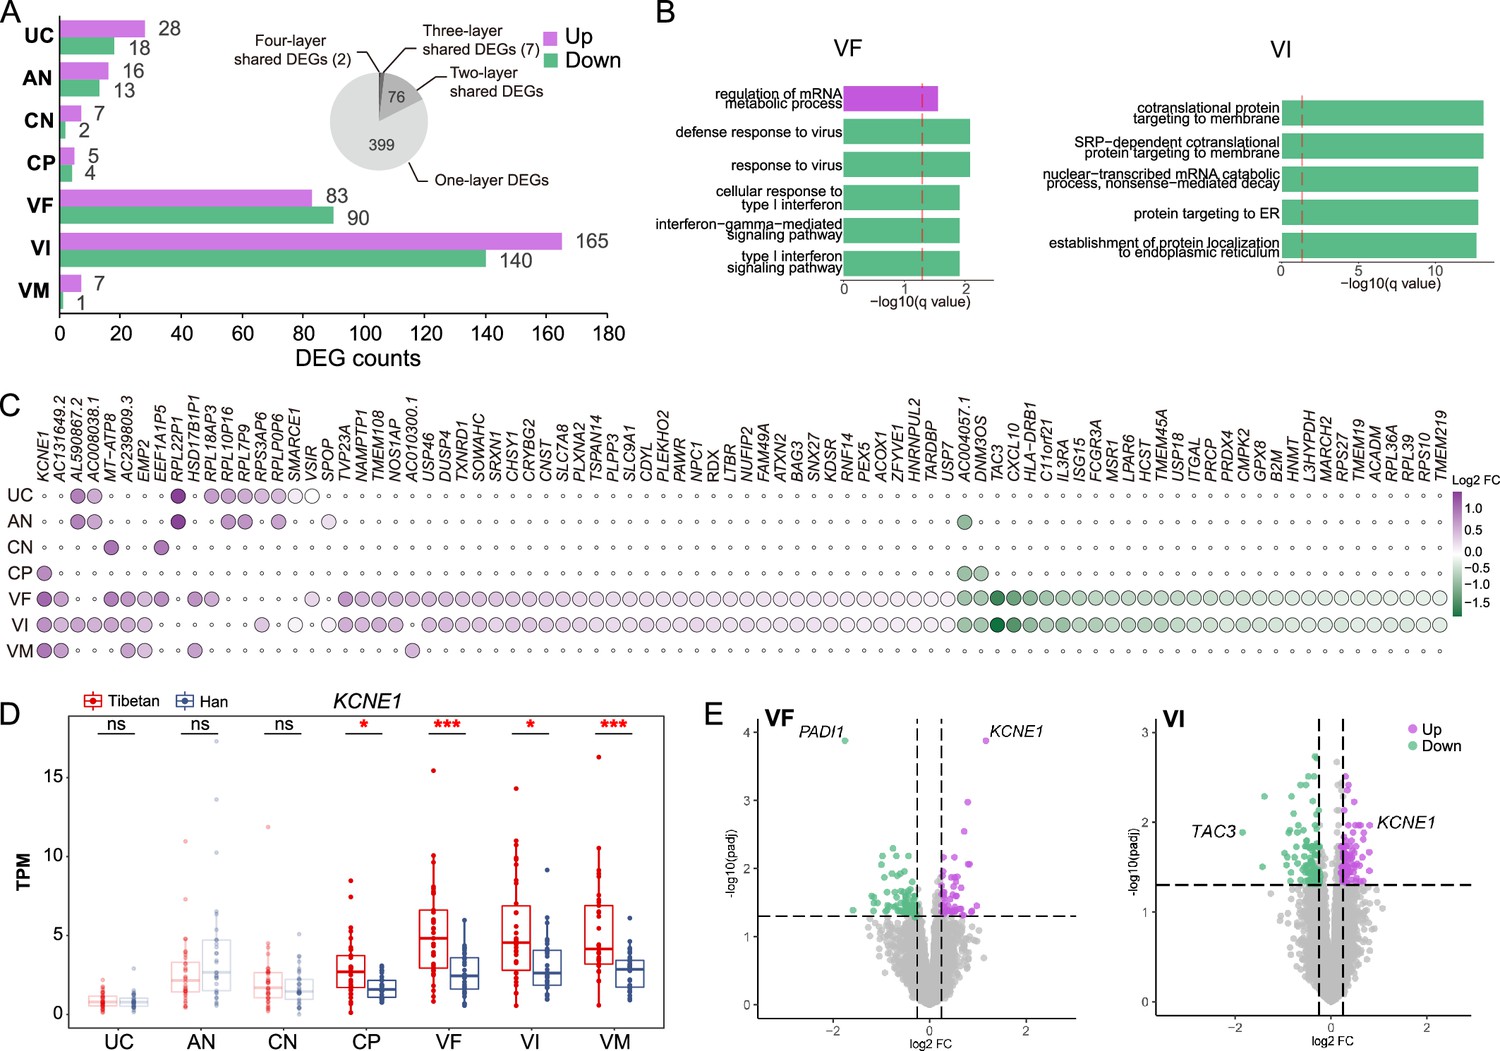
(A) The numbers of differentially expressed genes (DEGs) between Tibetans and Han in each placental layer. Purple: the number of up-regulated DEGs in Tibetans; green: the number of down-regulated DEGs in Tibetans. The pie chart indicates the shared DEGs among two and more placental layers. (B) The enriched functional categories (GO terms) of the up-regulated (top) and the down-regulated (bottom) DEGs in villus of fetal (VF) and villus of intermediate (VI), respectively. The dashed line denotes the threshold of significant test (adjusted p-value <0.05). (C) The heat map of the 85 shared DEGs among two and more placental layers. (D) Comparison of the expression levels of KCNE1 between Tibetans (n=35) and Han (n=34) in the seven layers of placenta. The significant between-population differences are indicated. The p-value was adjusted by FDR. Adjusted p-value (p): *p<0.05; **p<0.01; ***p<0.001; ns: not significant. For each boxplot, we draw a box from the first quartile to the third quartile. A vertical line goes through the box at the median. The whiskers go from each quartile to the minimum or maximum. (E) The volcano plots of the DEGs in VF and VI, respectively. The top genes are indicated.
Figure 2—figure supplement 1
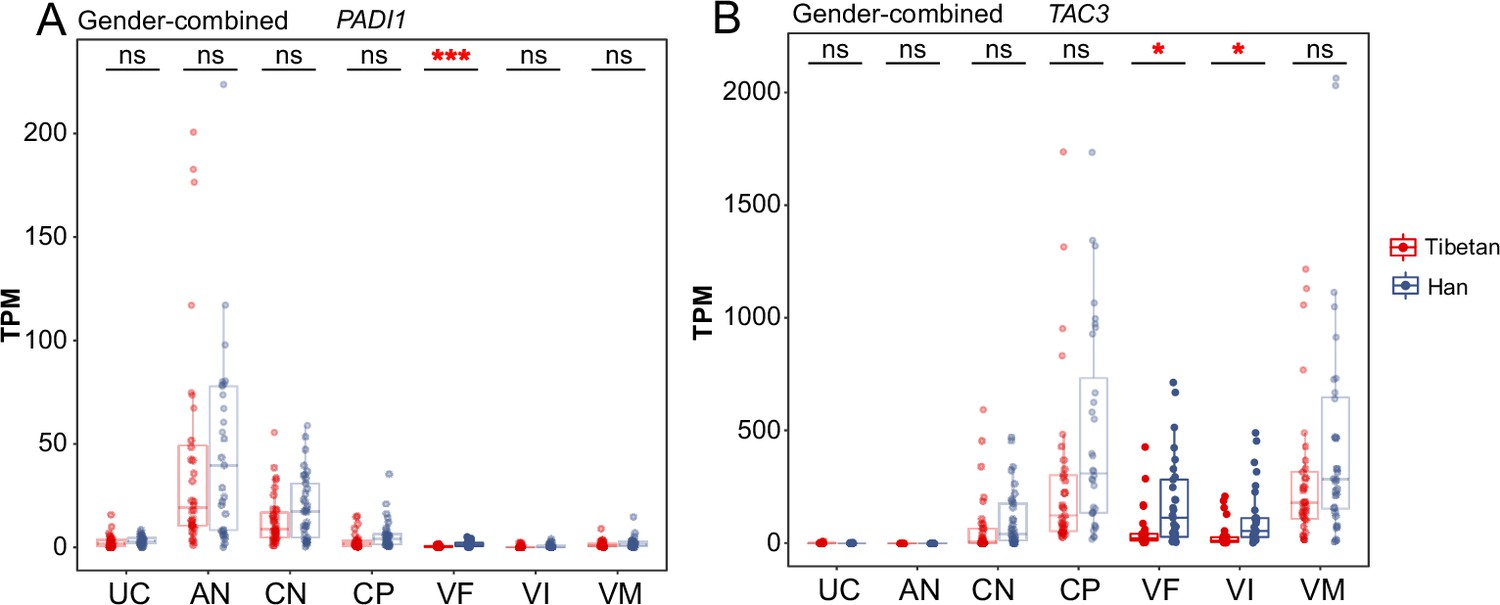
The top differentially expressed genes (DEGs) of the villus of intermediate (VI) and villus of fetal (VF) layers between Tibetans and Han.
Comparison of the expression level of PADI1 (A) and TAC3 (B) in the seven layers of placenta between Tibetans (n=35) and Han (n=34). The p-value was adjusted by FDR. Adjusted p-value (p): *p<0.05; ***p<0.001; ns: not significant. For each boxplot, we draw a box from the first quartile to the third quartile. A vertical line goes through the box at the median. The whiskers go from each quartile to the minimum or maximum.
Figure 3 with 3 supplements
Sex-biased placental expression divergence between Tibetans and Han migrants.
(A) The differentially expressed gene (DEG) numbers of the seven placental layers in the male infants and the female infants, respectively. Left: female (pink); right: male (blue); Venn chart: the overlapped DEGs between male-infant placentas and female-infant placentas. (B) Bar plot shows the difference of gene counts between cross-sex DEGs in native Tibetans and Han migrants. (C) The up- and down-regulated genes in the male infants of Tibetans compared to Han, shown in the volcano plots of umbilical cord (UC), amnion (AN), and villus of fetal (VF). The top 5 DEGs are indicated. The example gene DHCR7 is highlighted in red. (D) The enriched functional categories (GO terms) of the up-regulated (purple) and the down-regulated (green) DEGs in UC and AN, respectively. The dashed line denotes the threshold of significant test (adjusted p-value<0.05).
Figure 3—figure supplement 1
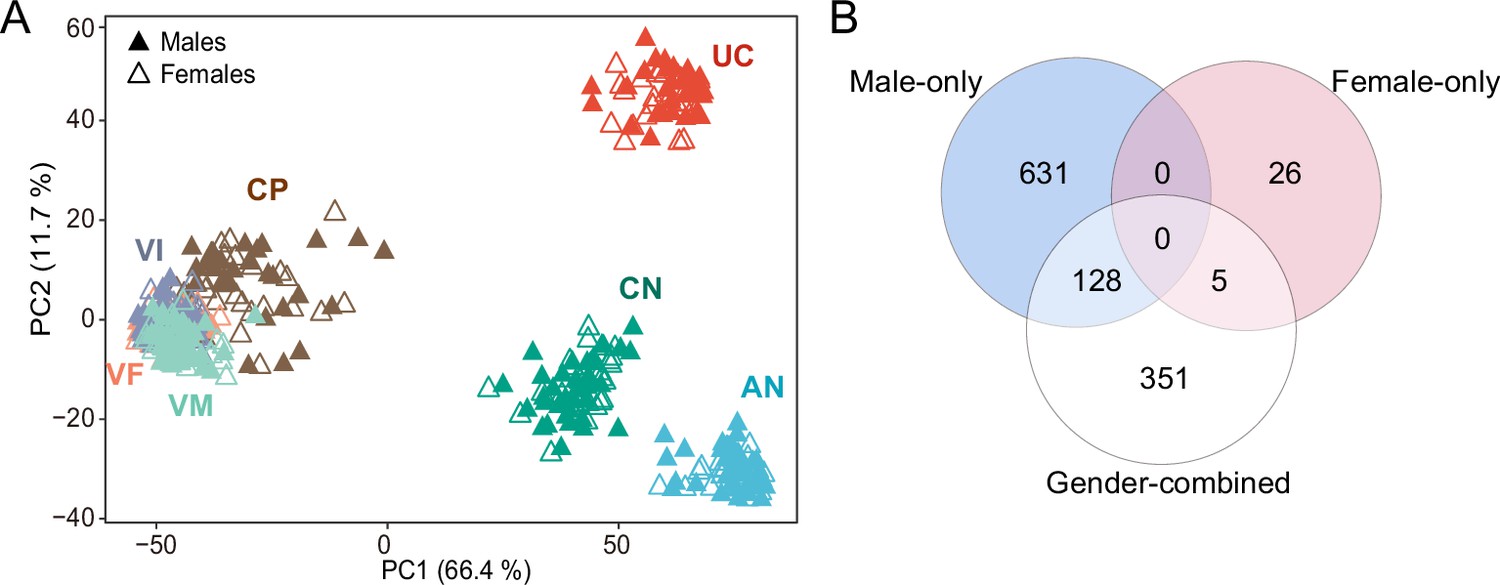
The sex-biased gene expression in the placenta.
(A) The principal component analysis (PCA) map shows the clustering pattern of tissue layers with fetal sex. (B) The overlapped differentially expressed genes (DEGs) between male-only group (blue), the female-only group (pink), and the gender-combined group (white).
Figure 3—figure supplement 2
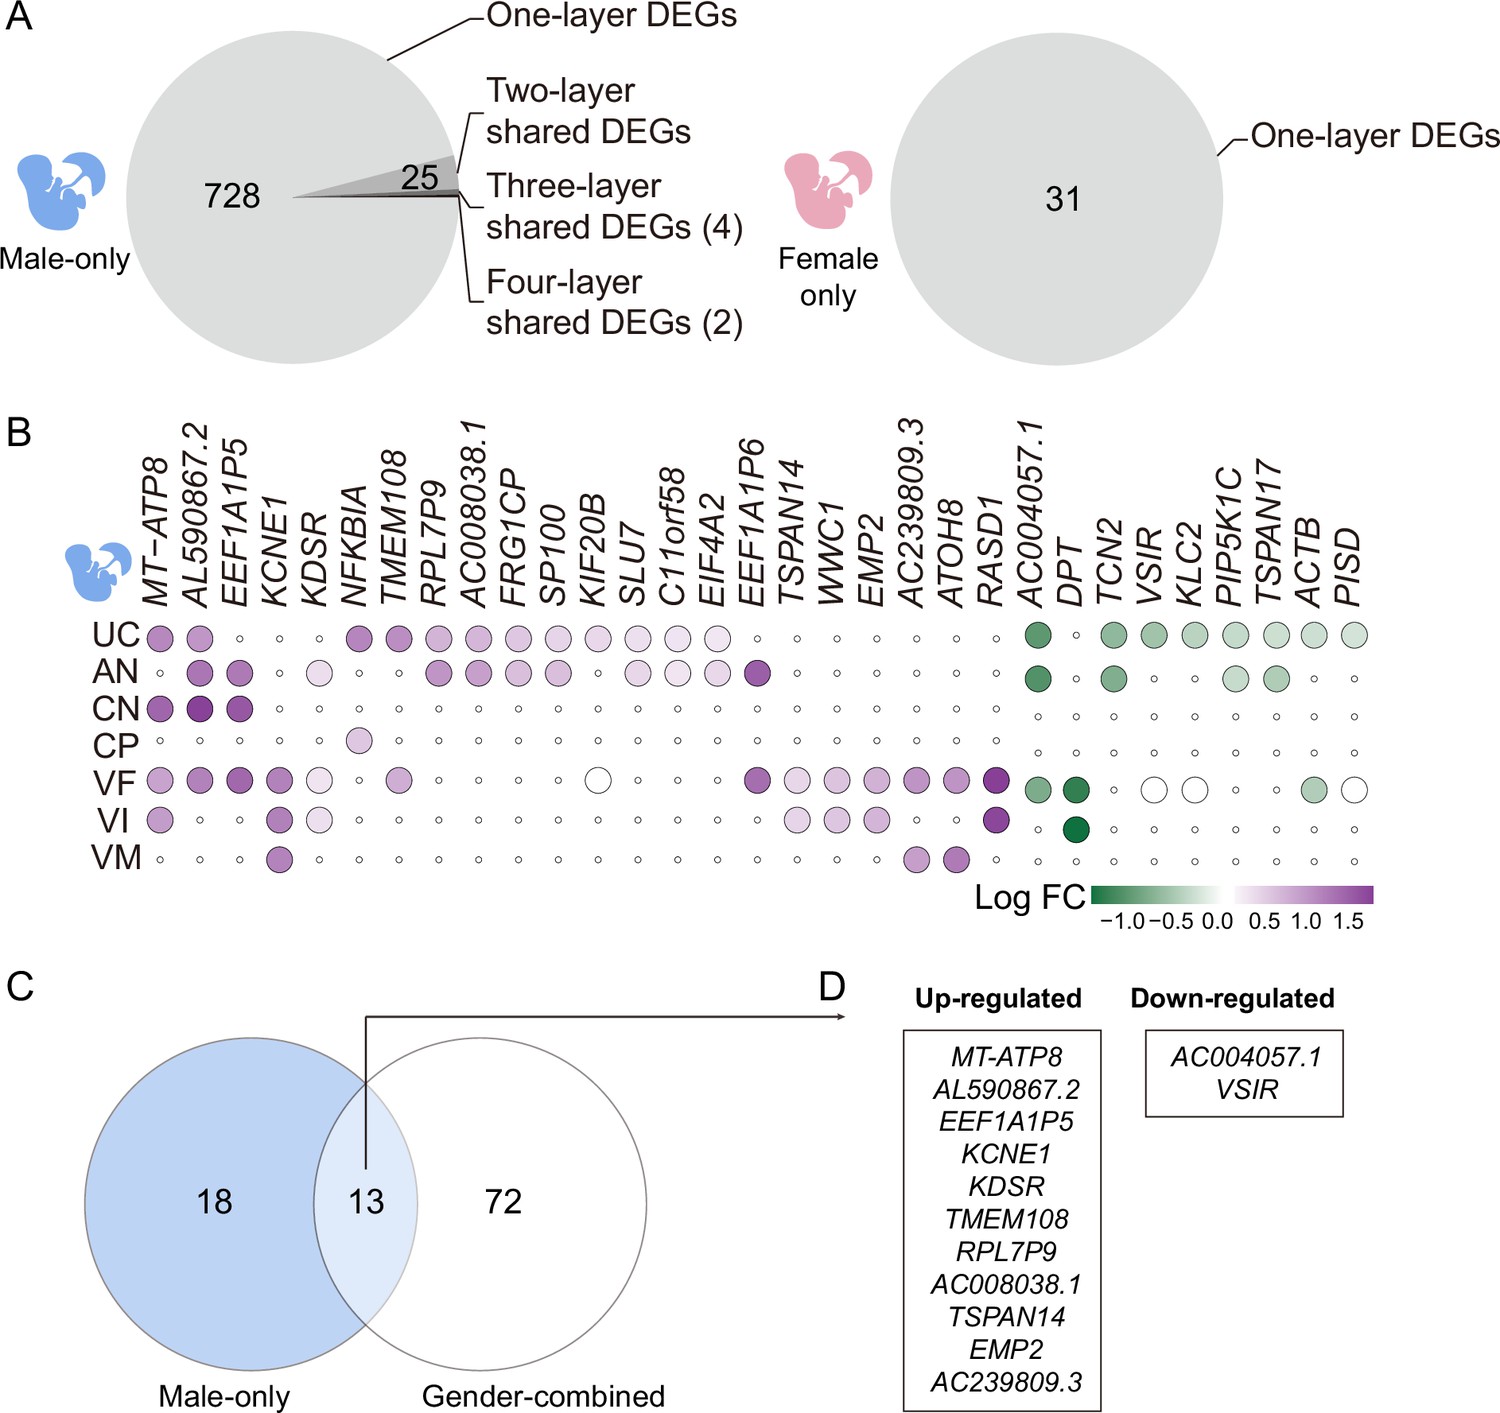
The layer-shared differentially expressed genes (DEGs) in the placentas of males and females.
(A) The pie chart of the shared DEGs among two and more placental layers in males (left) and females (right). (B) The heat map of the 31 shared DEGs among two and more placental layers. Purple: up-regulated in Tibetans; green: down-regulated in Tibetans. (C) The overlap of layer-shared DEGs of the male-infant placentas and the gender-combined placentas. (D) The list of the 13 overlapped DEGs in (C).
Figure 3—figure supplement 3
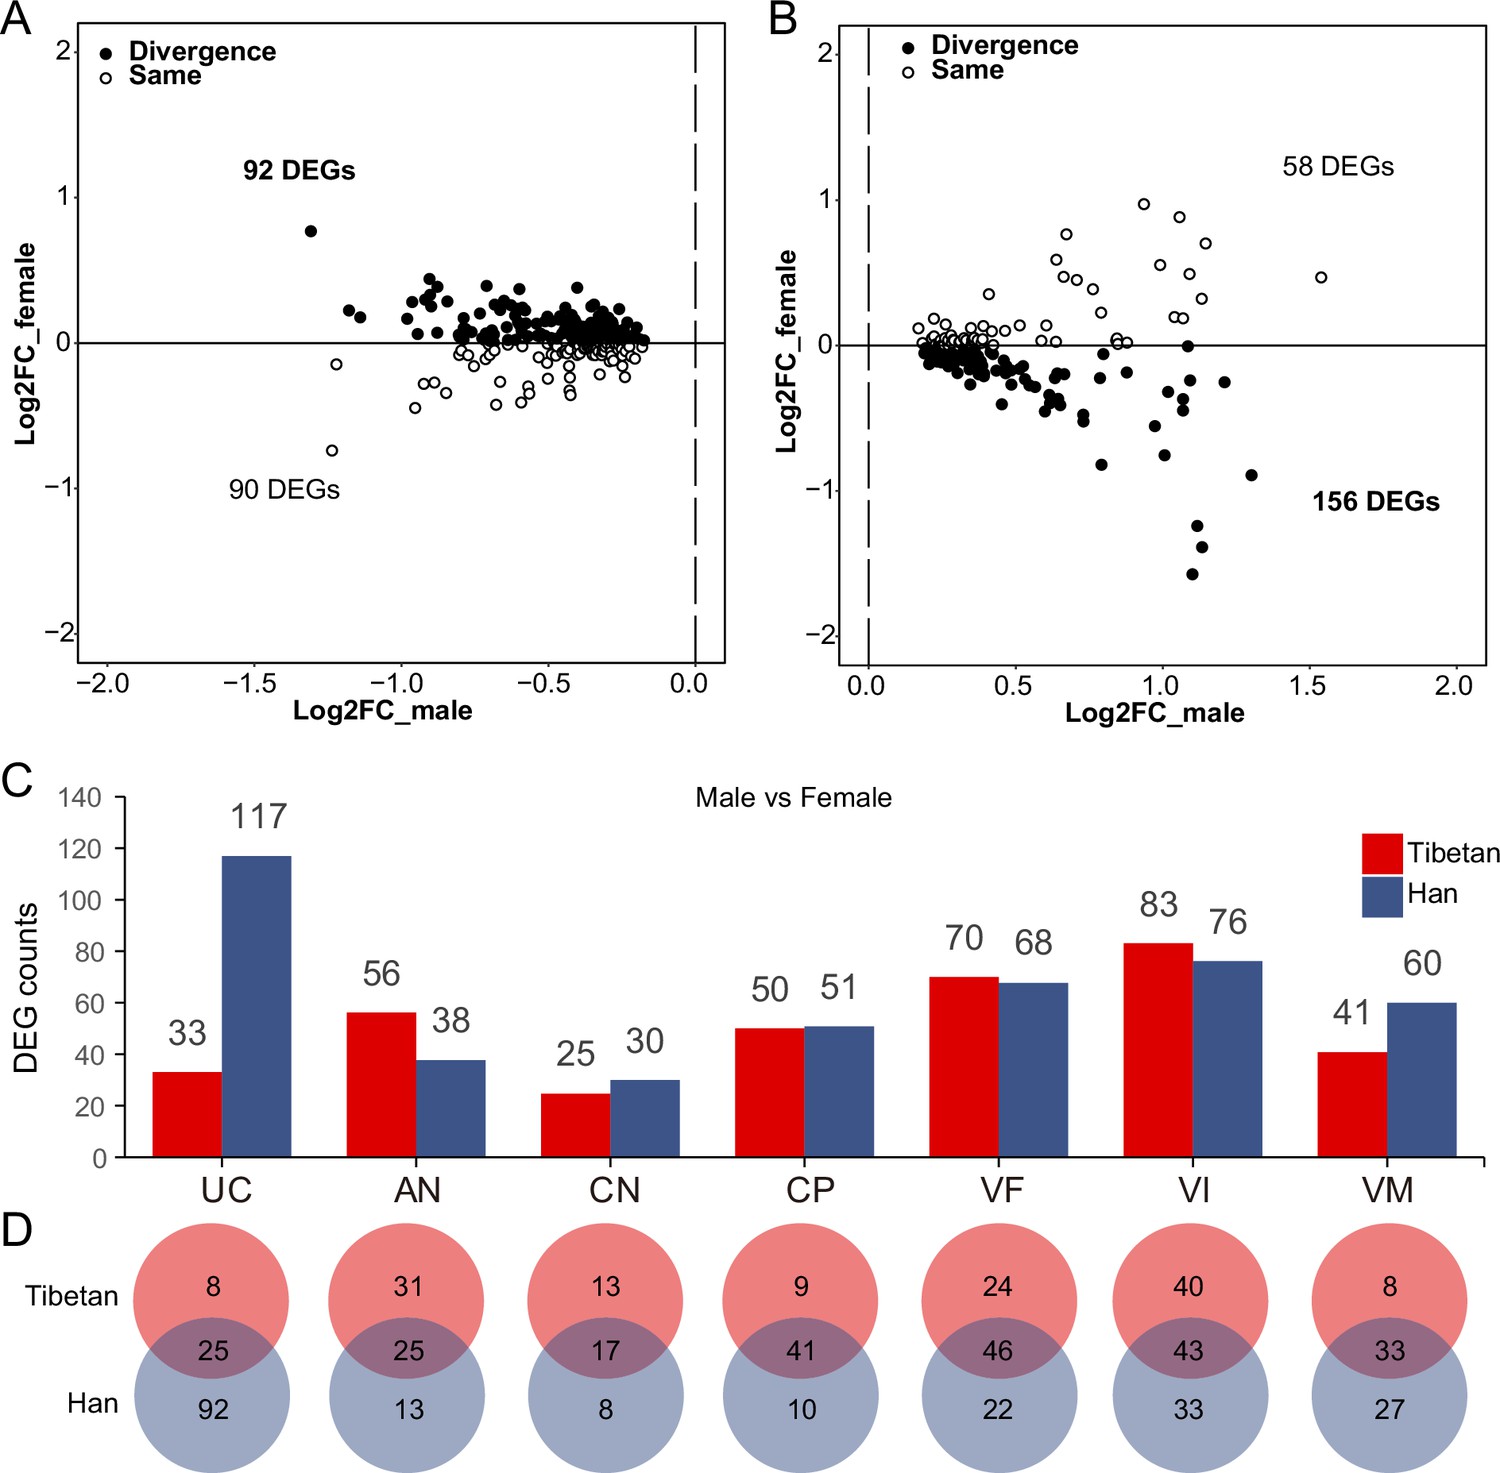
The expression divergence between males and females.
(A) The differential direction of the down-regulated differentially expressed genes (DEGs) in the male umbilical cord (UC) layer in Tibetans and Han female infants. Solid circle: the differential expression direction of the male DEGs are divergent in male and female placentas between Tibetans and Han; hollow circle: the differential expression direction of the male DEGs are the same in male and female placentas between Tibetan and Han. (B) The differential direction of the up-regulated DEGs in the male umbilical cord (UC) layer in Tibetan and Han female infants. (C) Bar plot of DEGs (male-infant placenta vs female-infant placenta) of the seven layers of placenta in Tibetans and Han migrants, respectively. (D) The overlapped DEGs (male-infant placenta vs female-infant placenta) between Tibetans and Han migrants in the seven layers of placenta.
Figure 4 with 1 supplement
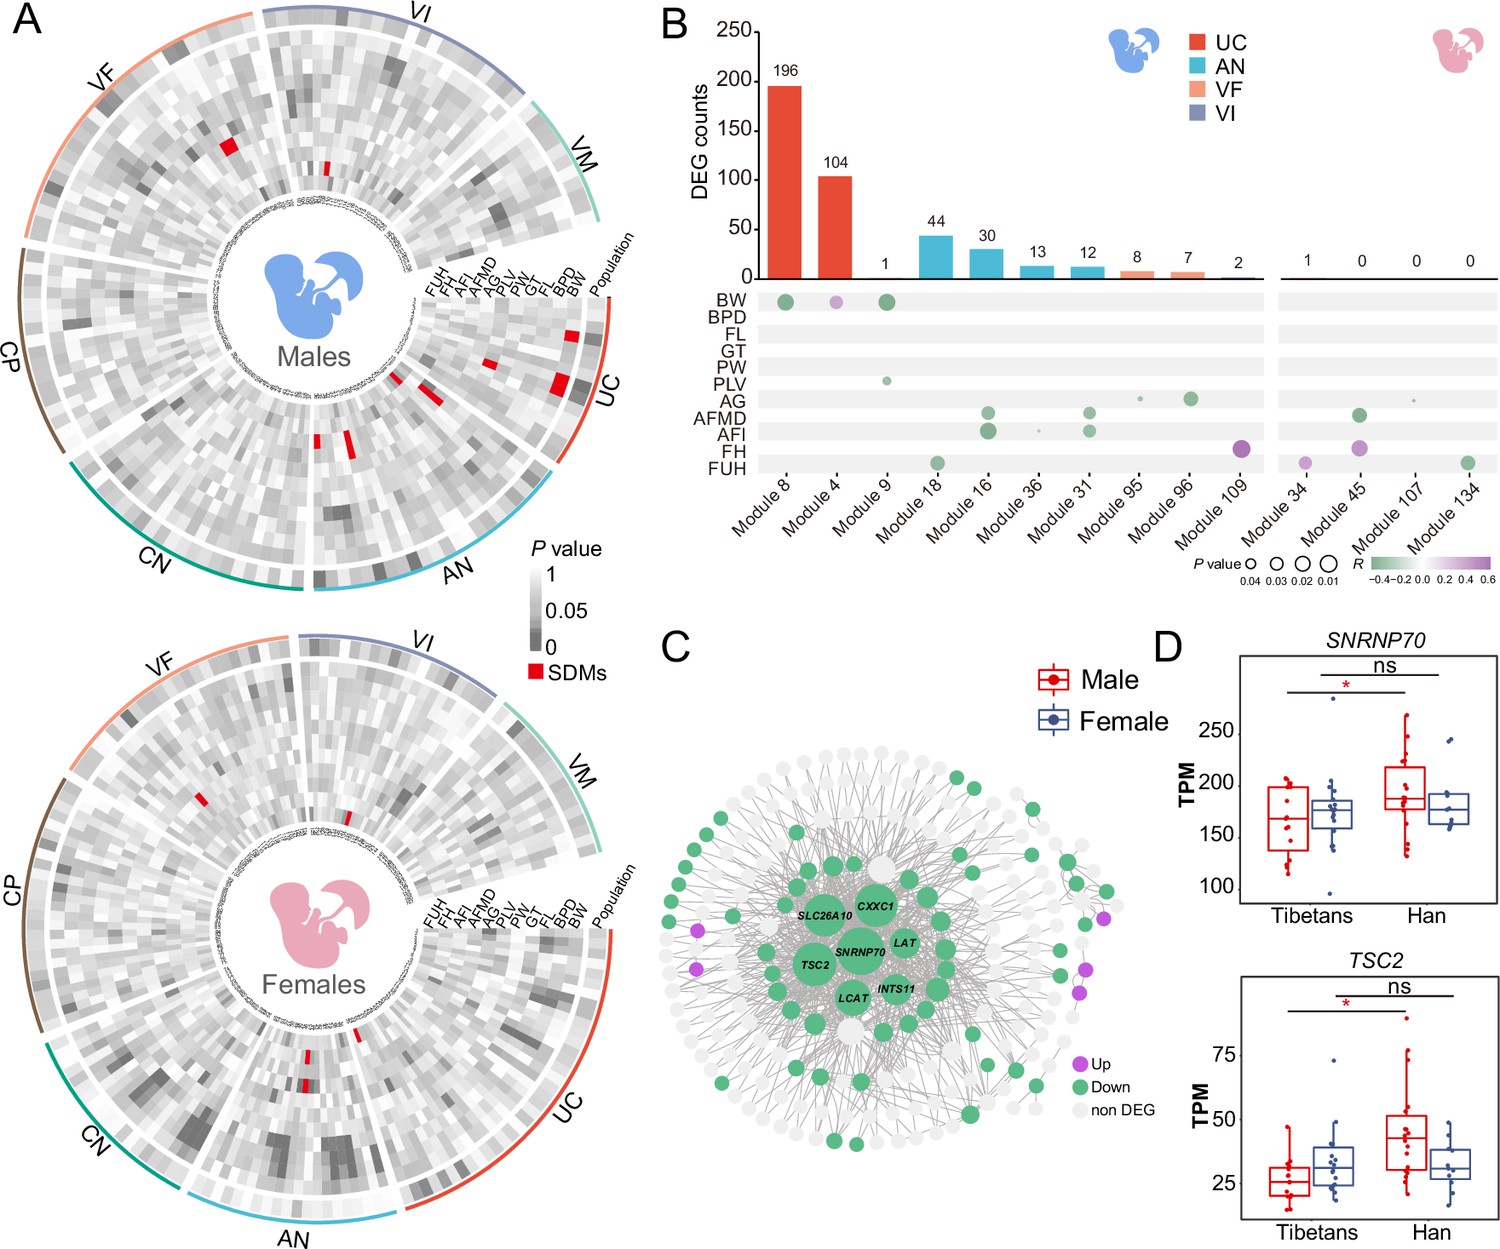
Gene expression modules in umbilical cord (UC) of the male infants correlate with neonatal phenotypes.
(A) The heat maps of p-values showing the correlations between gene expression and the newborn traits of the male-infant placentas (left) and the female-infant placentas (right). Inner ring: module name; outer ring: layers; red: significantly differential modules (SDMs). (B) The counts of the module-associated differentially expressed genes (DEGs) in the seven placental layers of the male infants and the female infants (the upper panels), and their correlations with the newborn traits (the lower panels). (C) The gene co-expression network of Module 8 of the male infants. (D) Gene expression comparisons of two hub genes in UC of the male infants between Tibetans (n: male=16,female=19) and Han (n: male=21,female=13). The p-value was adjusted by FDR. Adjusted p-value (p): *p<0.05; ns: not significant. For each boxplot, we draw a box from the first quartile to the third quartile. A vertical line goes through the box at the median. The whiskers go from each quartile to the minimum or maximum.
Figure 4—figure supplement 1
The sex-biased correlation between gene expression and traits of the male-infant and female-infant placentas.
(A) The correlation between gene expression and birth weight (BW) in the male Module 8. Gene significance (GS): the absolute value of the correlation between the gene and the trait. Module membership (MM): the correlation of the module eigengene and the gene expression profile. (B) Boxplot of the GHR gene in the male (n: Tibetan=16, Han=21) and female (n: Tibetan=19, Han=13) villus of fetal (VF) layers. The p-value was adjusted by FDR. Adjusted p-value (p): *p<0.05; ns: not significant. For each boxplot, we draw a box from the first quartile to the third quartile. A vertical line goes through the box at the median. The whiskers go from each quartile to the minimum or maximum. (C) Correlation of GHR and fundal height (FUH) in the VF layer of the females. The correlations were evaluated by linear regression models. (D) Correlation of GHR and FUH in the VF layer of males.
Figure 5 with 1 supplement
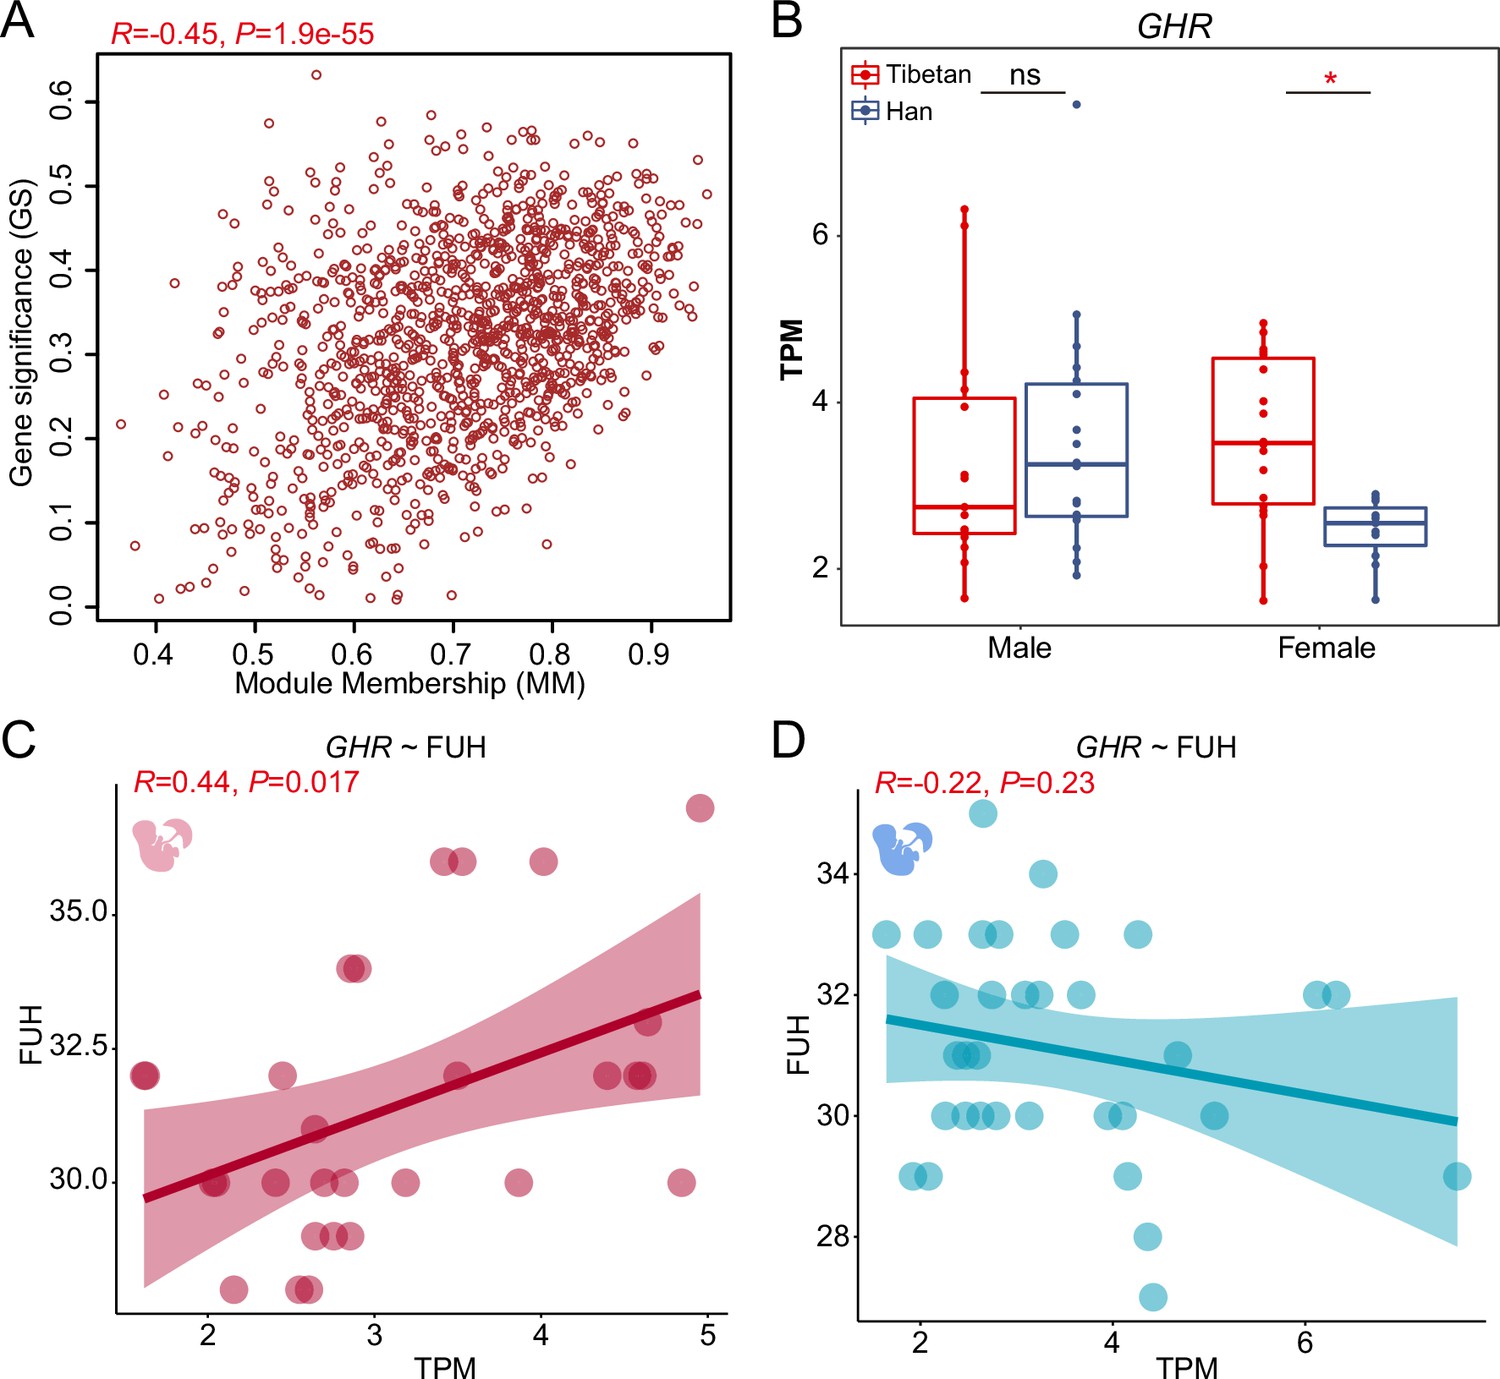
Sex-biased histological changes in the male-infant placentas of Tibetans.
(A) Schematic diagram of the sampling strategy in histological analysis. (B, C) The H&E stained cross-sections of the umbilical cord (UC) vessels (umbilical vein [UV], panel B; and umbilical artery [UA], panel C). The umbilical vein wall (UVW) and umbilical artery intima and media (UAIM) are highlighted in red. The boxplots show the comparisons of area size of UVW and UAIM between Tibetan (n=5) and Han (n=5) male infants (left) or female infants (right). The two umbilical arteries of each UC were subject to analysis in panel C. Scale bar: 500 µm. (D, E) The H&E stained sections of the placental villus of intermediate (VI) and villus of fetal (VF). The arrows denote the syncytial knots. The boxplots show the comparison of the villi numbers or the syncytial knot/villi ratios between Tibetan (n=5) and Han (n=5) male infants (left) or female infants (right). Unpaired Student’s t-tests are used to evaluate the significance of difference. Scale bar: 100 µm. *p-value<0.05; **p-value<0.01; ns: not significant. For each boxplot, we draw a box from the first quartile to the third quartile. A vertical line goes through the box at the median. The whiskers go from each quartile to the minimum or maximum.
Figure 5—figure supplement 1
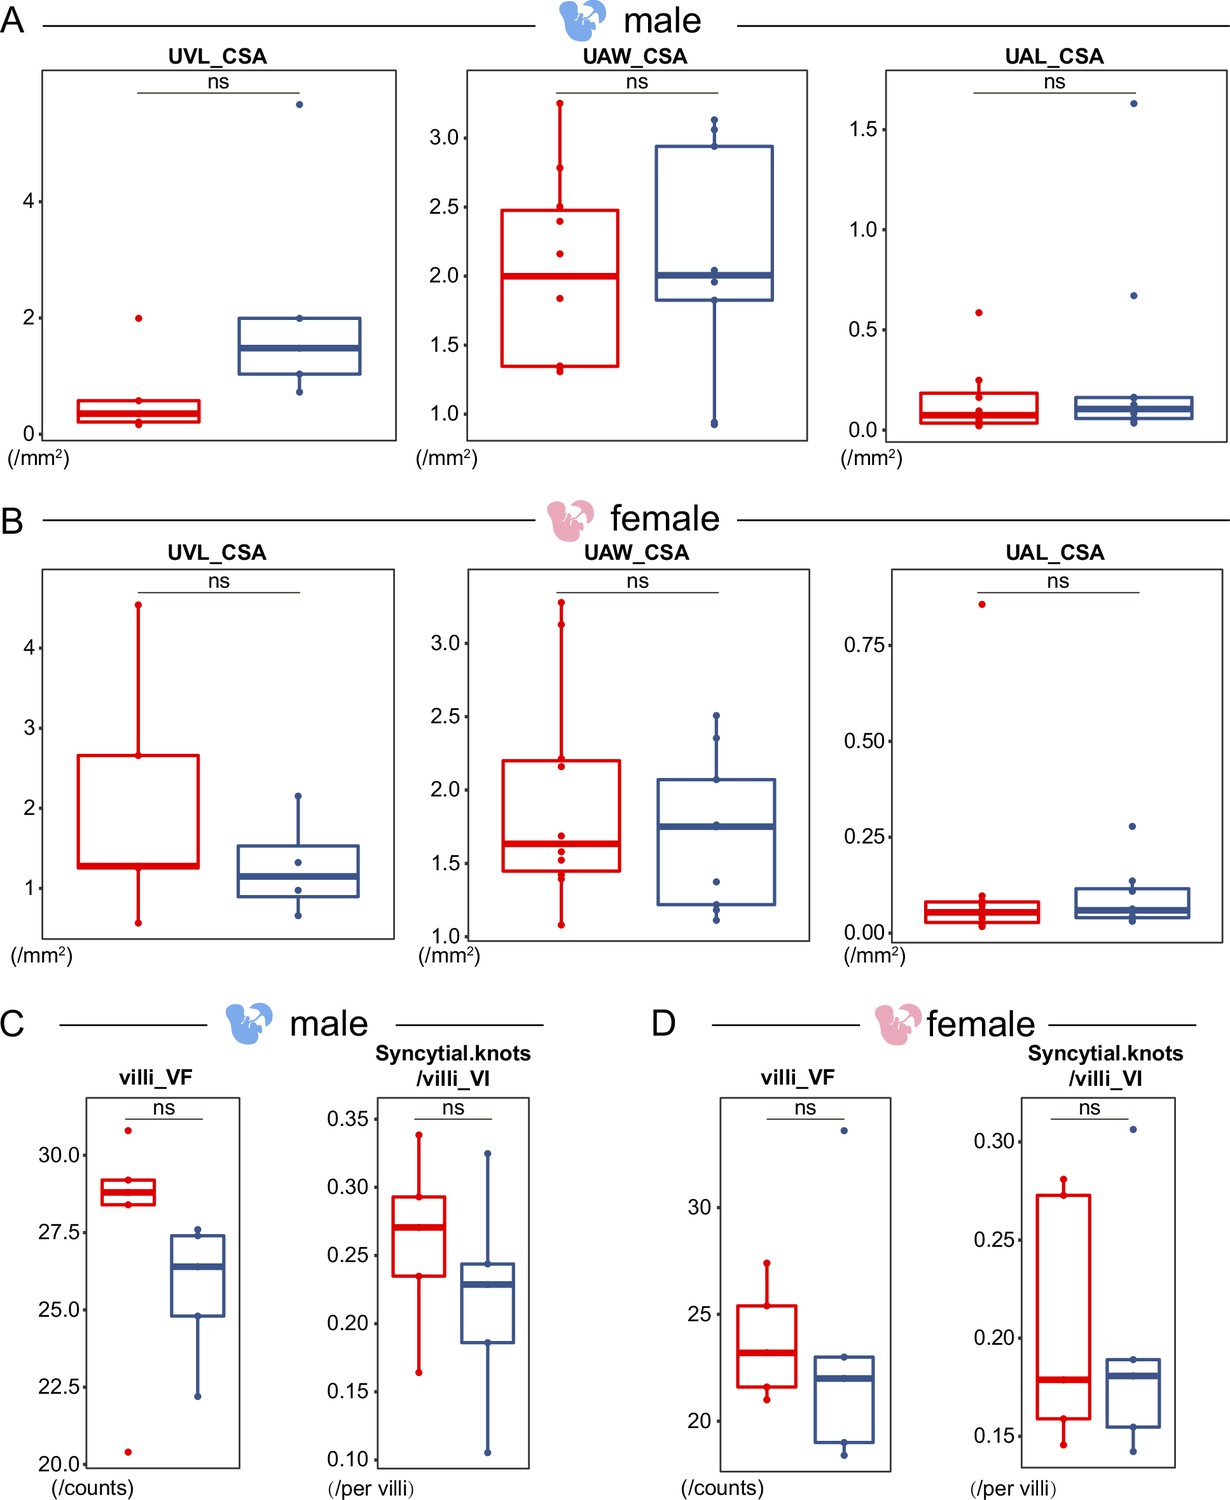
Histological outcome of the sex-biased structure divergence in the placenta.
(A) Three parameters of umbilical cord (UC) in the male placentas. (B) Three parameters of UC in the female placentas. (C) Villi of the villus of fetal (VF) layer and syncytial knots per villi of the villus of intermediate (VI) layer in the male placentas. (D) Villi of the VF layer and syncytial knots per villi of the VI layer in the female placentas. Unpaired Student’s t-tests are used to evaluate the significance of difference. ns: not significant. Sample size of each group is five. For each boxplot, we draw a box from the first quartile to the third quartile. A vertical line goes through the box at the median. The whiskers go from each quartile to the minimum or maximum.
Figure 6 with 3 supplements

The differentially expressed genes (DEGs) in the placenta that underwent positive selection in Tibetans.
(A) The Venn plots show the intersections between the placental DEGs and the 192 Tibetan selection-nominated genes (TSNGs), covering the gender-combined and the gender-separated DEGs. (B) The three DEGs (gender-combined) under positive selection in Tibetans. The upper panels show the allele frequencies of variants with the strongest signals of selection within the gene. Besides Tibetans and Han Chinese, the data from three other reference populations are also presented, including Japanese (JPT), Europeans (CEU), and Africans (YRI) from the 1000 Genome Project. The solid and hollow bars in red denote the allele frequencies in the published 1001 Tibetan individuals and 35 Tibetan individuals, respectively, and the solid and hollow bars in blue denote the allele frequencies in the published 103 Han individuals and 34 Han individuals, respectively. The bottom panels show the comparison of the expression levels between Tibetans (n=35) and Han (n=34) in the seven layers of placenta. Only the significant between-population differences are indicated. The p-value was adjusted by FDR. Adjusted p-value: *p-value<0.05; **p-value<0.01; ***p-value<0.001. For each boxplot, we draw a box from the first quartile to the third quartile. A vertical line goes through the box at the median. The whiskers go from each quartile to the minimum or maximum. (C) Expression levels of three DEGs (sex-separate analysis) with positive selection signals in seven placental layers of Tibetan males (n=16) and Han males (n=21).
Figure 6—figure supplement 1
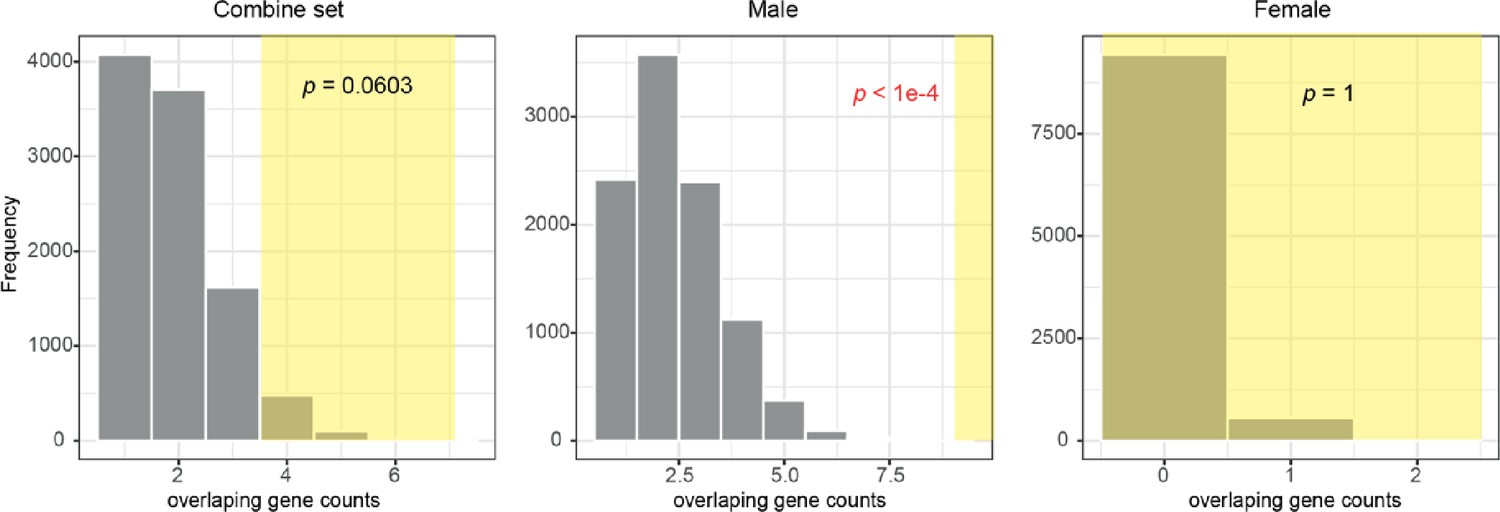
The distribution of the overlapped genes between the identified differentially expressed genes (DEGs) and the 192 randomly selected genes based on 10,000 permutations.
The highlighted parts indicate the counts in the replicates with equal or more overlapping genes than the observed (≥4 for the combined set; ≥9 for the male-only set; ≥0 for the female-only set).
Figure 6—figure supplement 2
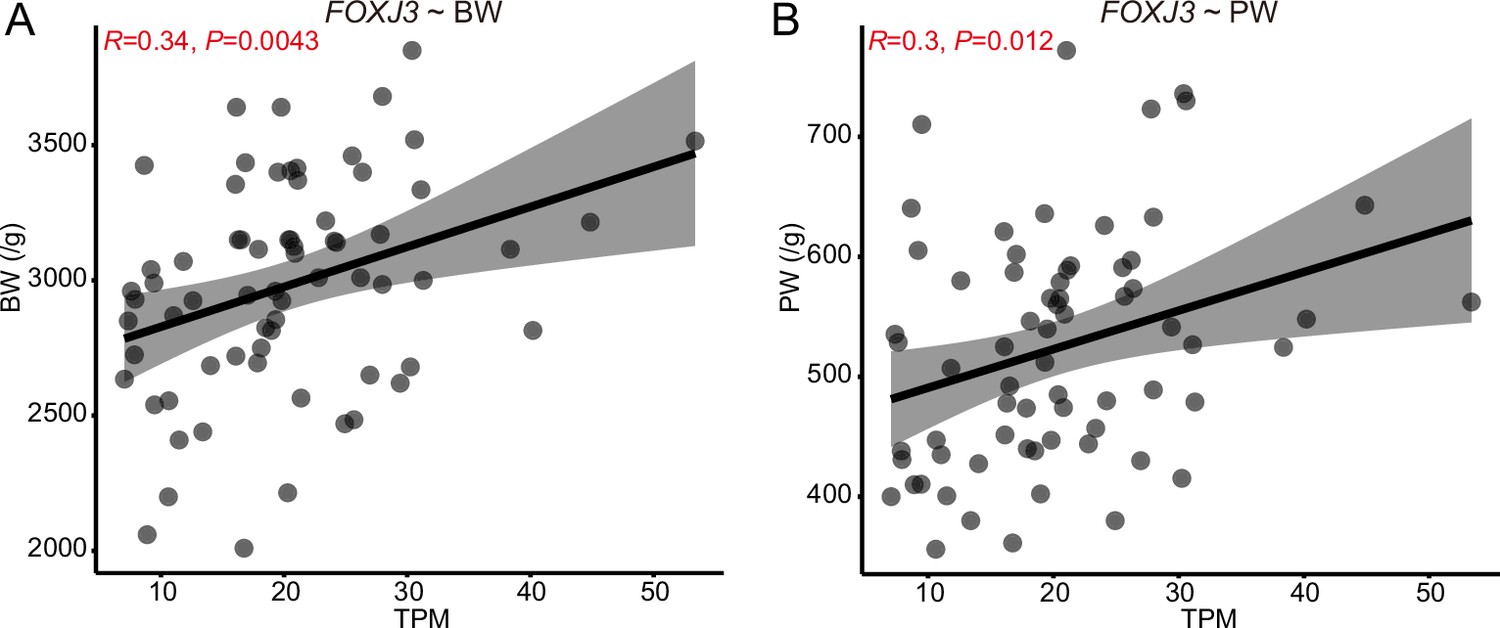
The correlation between the expression of FOXJ3 and birth weight (BW)/placental weight (PW) in the chorion (CN) layer of placenta.
(A) The correlation between FOXJ3 gene expression and BW. (B) The correlation between FOXJ3 gene expression and PW. The correlations were evaluated by linear regression models.
Figure 6—figure supplement 3
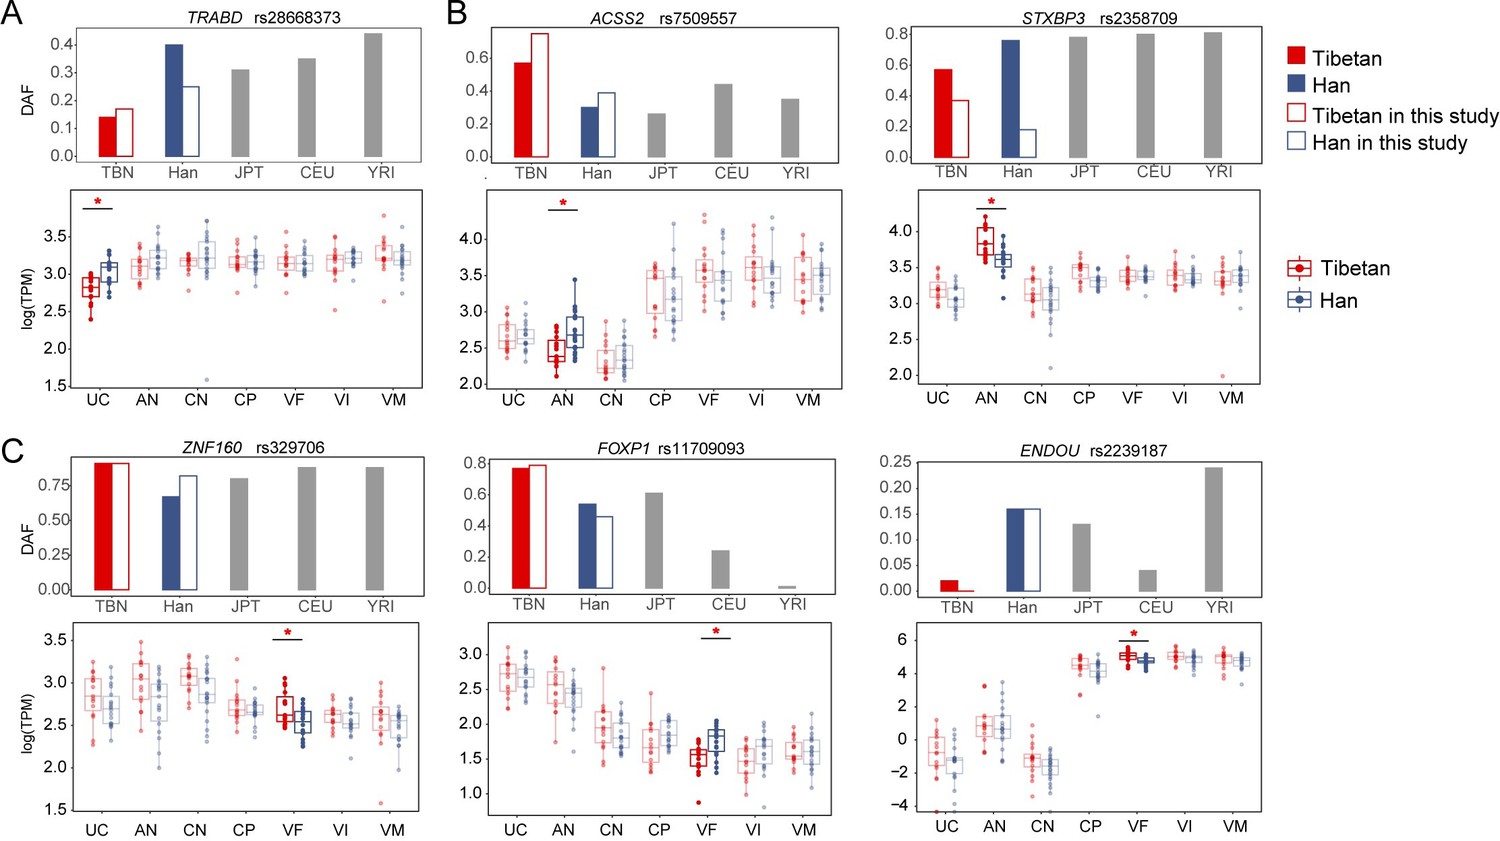
The placental differentially expressed genes (DEGs) of the amnion (AN) and villus of fetal (VF) layers with signals of positive selection in Tibetan population.
(A) TRABD (gender-separated analysis) of the umbilical cord (UC) layer with signals of positive selection in Tibetans. The upper panels show the allele frequencies of variant with the top signals of positive selection within the gene. Besides Tibetans and Han Chinese, the frequencies of other three reference populations are also presented, including Japanese (JPT), Europeans (CEU), and Africans (YRI). The solid and hollow bars in red denote the allele frequencies in the published 1001 Tibetan individuals and 35 Tibetan individuals, respectively, and the solid and hollow bars in blue denote the allele frequencies in the published 103 Han individuals and 34 Han individuals, respectively. The bottom panels show the comparison of the expression levels between Tibetans (n=16) and Han (n=21) in the seven layers of placenta. Only the significant between-population differences are indicated. The p-value was adjusted by FDR. Adjusted p-value: *p-value<0.05; **p-value<0.01; ***p-value<0.001. For each boxplot, we draw a box from the first quartile to the third quartile. A vertical line goes through the box at the median. The whiskers go from each quartile to the minimum or maximum. (B) The two DEGs (gender-separated analysis) of the AN layer with signals of positive selection in Tibetans. (C) The three DEGs (gender-separated) of the VF layer with signals of positive selection in Tibetans.
Tables
Author response table 1
Permutation analysis of the overlapped genes between DEGs and TSNGs.
| combined set | male-only set | female-only set | |||
|---|---|---|---|---|---|
| overlaping gene counts | counts in 10000 permutations | overlaping gene counts | counts in 10000 permutations | overlaping gene counts | counts in 10000 permutations |
| 1 | 4072 | 1 | 2418 | 0 | 9429 |
| 2 | 3707 | 2 | 3572 | 1 | 556 |
| 3 | 1619 | 3 | 2395 | 2 | 16 |
| 4 | 480 | 4 | 1124 | ||
| 5 | 101 | 5 | 373 | ||
| 6 | 21 | 6 | 92 | ||
| 7 | 1 | 7 | 25 | ||
| 8 | 2 | ||||
| 9 | 0 | ||||
| Counts >= 4 | 603 | Counts >= 9 | 0 | Counts >= 0 | 10000 |
| P-value | 0.0603 | P-value | < 1e-4 | P-value | 1 |
Additional files
-
Supplementary file 1
Excel file including the supplementary tables of this study.
- https://cdn.elifesciences.org/articles/89004/elife-89004-supp1-v1.xlsx
-
MDAR checklist
- https://cdn.elifesciences.org/articles/89004/elife-89004-mdarchecklist1-v1.pdf
Download links
A two-part list of links to download the article, or parts of the article, in various formats.
Downloads (link to download the article as PDF)
Open citations (links to open the citations from this article in various online reference manager services)
Cite this article (links to download the citations from this article in formats compatible with various reference manager tools)
Sex-biased regulatory changes in the placenta of native highlanders contribute to adaptive fetal development
eLife 12:RP89004.
https://doi.org/10.7554/eLife.89004.5


