Modulation of RNA processing genes during sleep-dependent memory
- Howard Hughes Medical Institute and Chronobiology and Sleep Institute, Perelman School of Medicine at the University of Pennsylvania, United States
- Department of Biology, University of Pennsylvania, United States
Figures
Figure 1 with 1 supplement

Differential gene expression after training in mushroom ap α′/β′ neurons.
(A) 5- to 7-day-old mixed sex wCS flies were exposed to one of the following three conditions: Trained-Fed, Trained-Starved and Untrained-Fed. Only Trained-Fed flies are expected to increase sleep after treatment and thus form sleep-dependent memory (Chouhan et al., 2021). Brain dissection, single cell suspension and cell sorting were used to extract ap α′/β′ neurons in each of these three different conditions, and bulk-sequencing of the sorted cells was conducted (created in BioRender.com/k87y777). (B) We sequenced four samples for each condition and subjected them to differential gene analysis of pairwise comparison of the three conditions. We found that 59 genes are significantly different in TrainedStarved vs. TrainedFed and UntrainedFed vs. TrainedFed. (C) Gene ontology (GO) analysis of these 59 genes using FlyEnrichr (https://maayanlab.cloud/FlyEnrichr/) revealed that they encode cellular components of the 90 S preribosome, Cajal body, DNA-directed RNA polymerase complex, nuclear euchromatin, and condensed chromosome.(D) Heatmap of the 59 DEGs including two genes labeled in red, CG13773 (Polr1F) and Regnase-1, which affect sleep and are the focus of this study due to their impacts on sleep. DEGs were identified by DESeq2 with the cutoff of FDR <0.1 and fold change >1.5. Heatmaps were plotted by using TPM values of genes for each sample; data were log-transformed and scaled row-wise for visualization.
-
Figure 1—source data 1
RNA-sequencing samples and differentially expressed genes information.
- https://cdn.elifesciences.org/articles/89023/elife-89023-fig1-data1-v1.xlsx
Figure 1—figure supplement 1
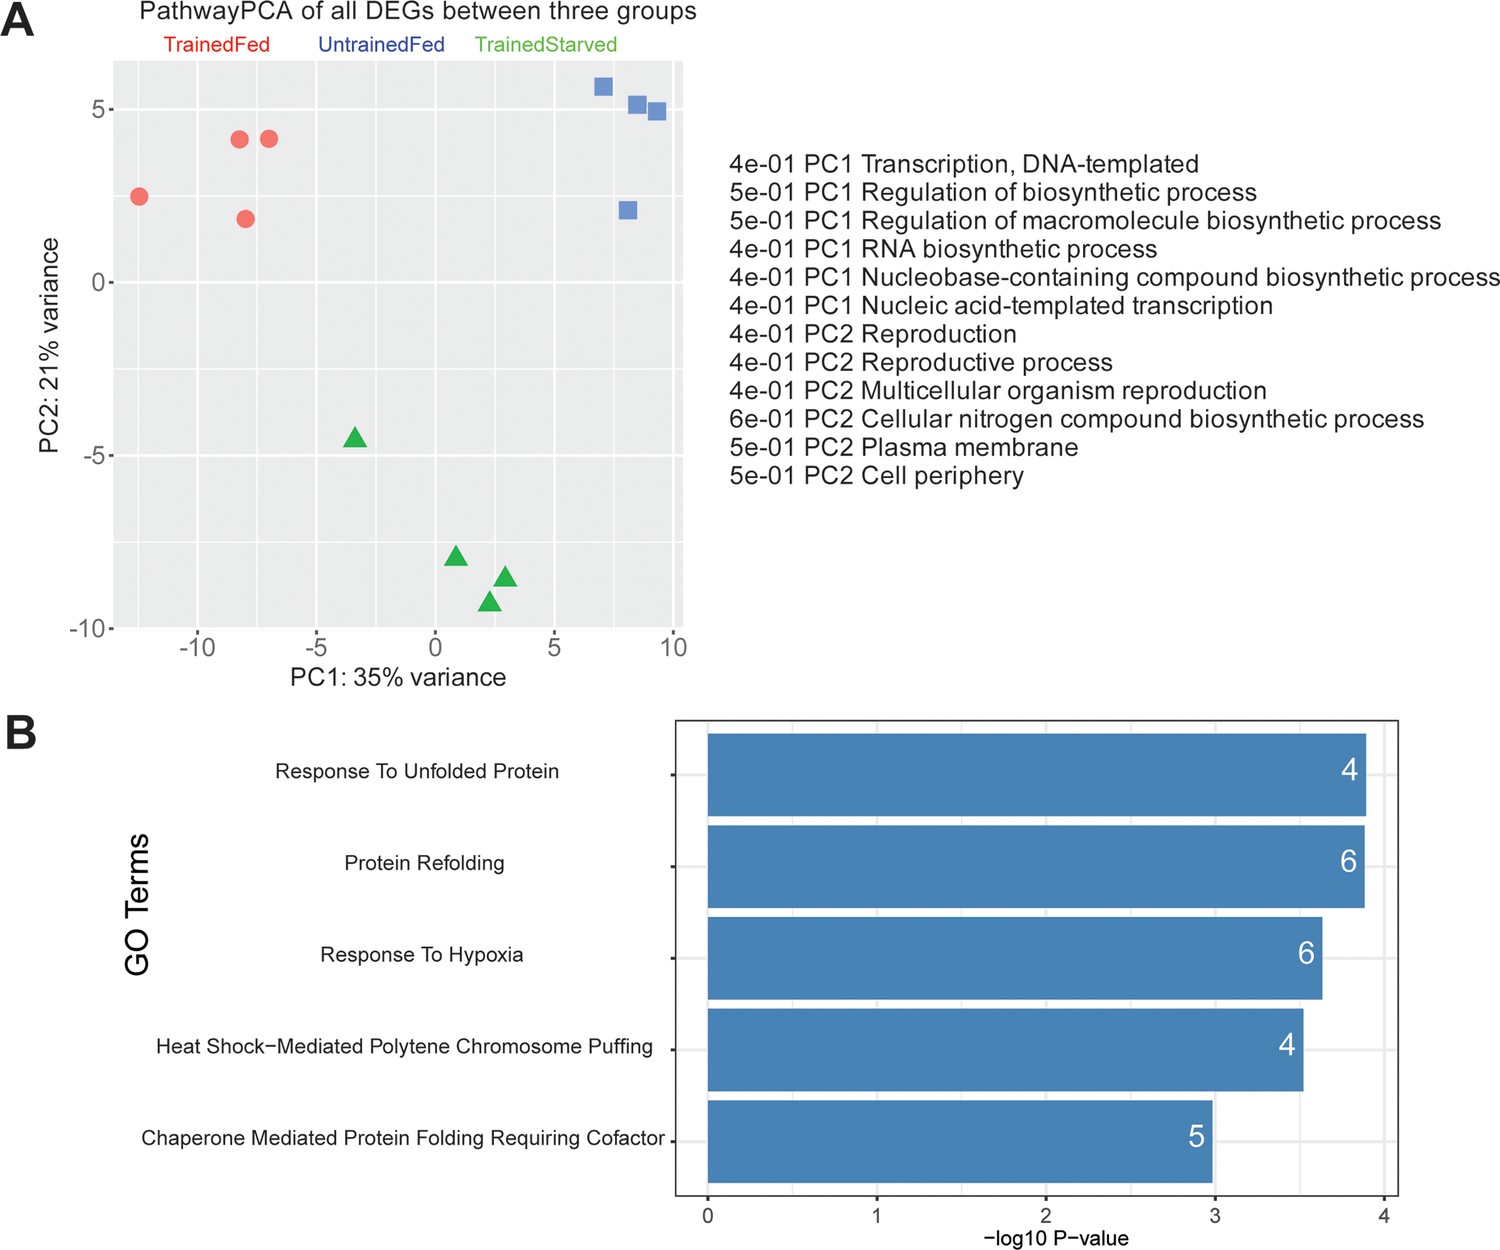
PathwayPCA visualization and GO analysis of differentially expressed genes across three conditions.
(A) PathwayPCA plot of all the differentially expressed genes (DEGs) across the three different conditions. The plot shows that genes responsible for PC1, which accounted for 35% of variance, largely encode proteins involved in transcription and biosynthesis, including RNA biosynthesis processes. (B) Top5 significant Gene Ontology (GO) biological process terms of all differentially expressed genes (DEGs) from three pairwise comparisons are shown. The x-axis represents the -log10 of the p-value, and the numbers on the bars indicate the count of genes identified for each GO term.
Figure 2 with 1 supplement

The sleep screen of differentially expressed genes identifies Polr1F and Regnase-1 as sleep-regulating genes.
(A–B) Flies carrying the ap α′/β′ neuron driver R35B12-Gal4 were crossed with flies carrying UAS-RNAi constructs targeting DEGs identified from RNA-seq analysis. 5–7 days old female F1 progeny were loaded onto Trikinetics DAM monitors to measure their sleep in a 12 hr light: 12 hr dark (12:12 LD) cycle. Mean total sleep (A) and nighttime sleep (B) were calculated by Pysolo and the difference between experimental flies and Gal4 and RNAi controls was calculated separately for each independent experiment; average values comparing each experimental to its Gal4 control (X-axis) and RNAi control (Y-axis) are shown in the plots. Of all the lines screened, knockdown of Polr1F and Regnase-1 had strongest effects on sleep, producing an increase and decrease in sleep, respectively. (C–F) show the representative sleep traces of R35B12-Gal4>polr1FRNAi flies and R35B12-Gal4>regnase1 RNAi. N=23–32 per genotype from two independent replicates combined are shown in E and F respectively, and bar graphs show mean + SEM. p values for each comparison were calculated using the Kruskal-Wallis test with Dunn’s multiple comparisons test. **p<0.01, ***p<0.001, ****p<0.0001.
-
Figure 2—source data 1
The sleep screen of differentially expressed genes and sleep phenotypes resulting from ap α′/β′ neuron knockdown of Polr1F and Regnase-1.
- https://cdn.elifesciences.org/articles/89023/elife-89023-fig2-data1-v1.xlsx
Figure 2—figure supplement 1
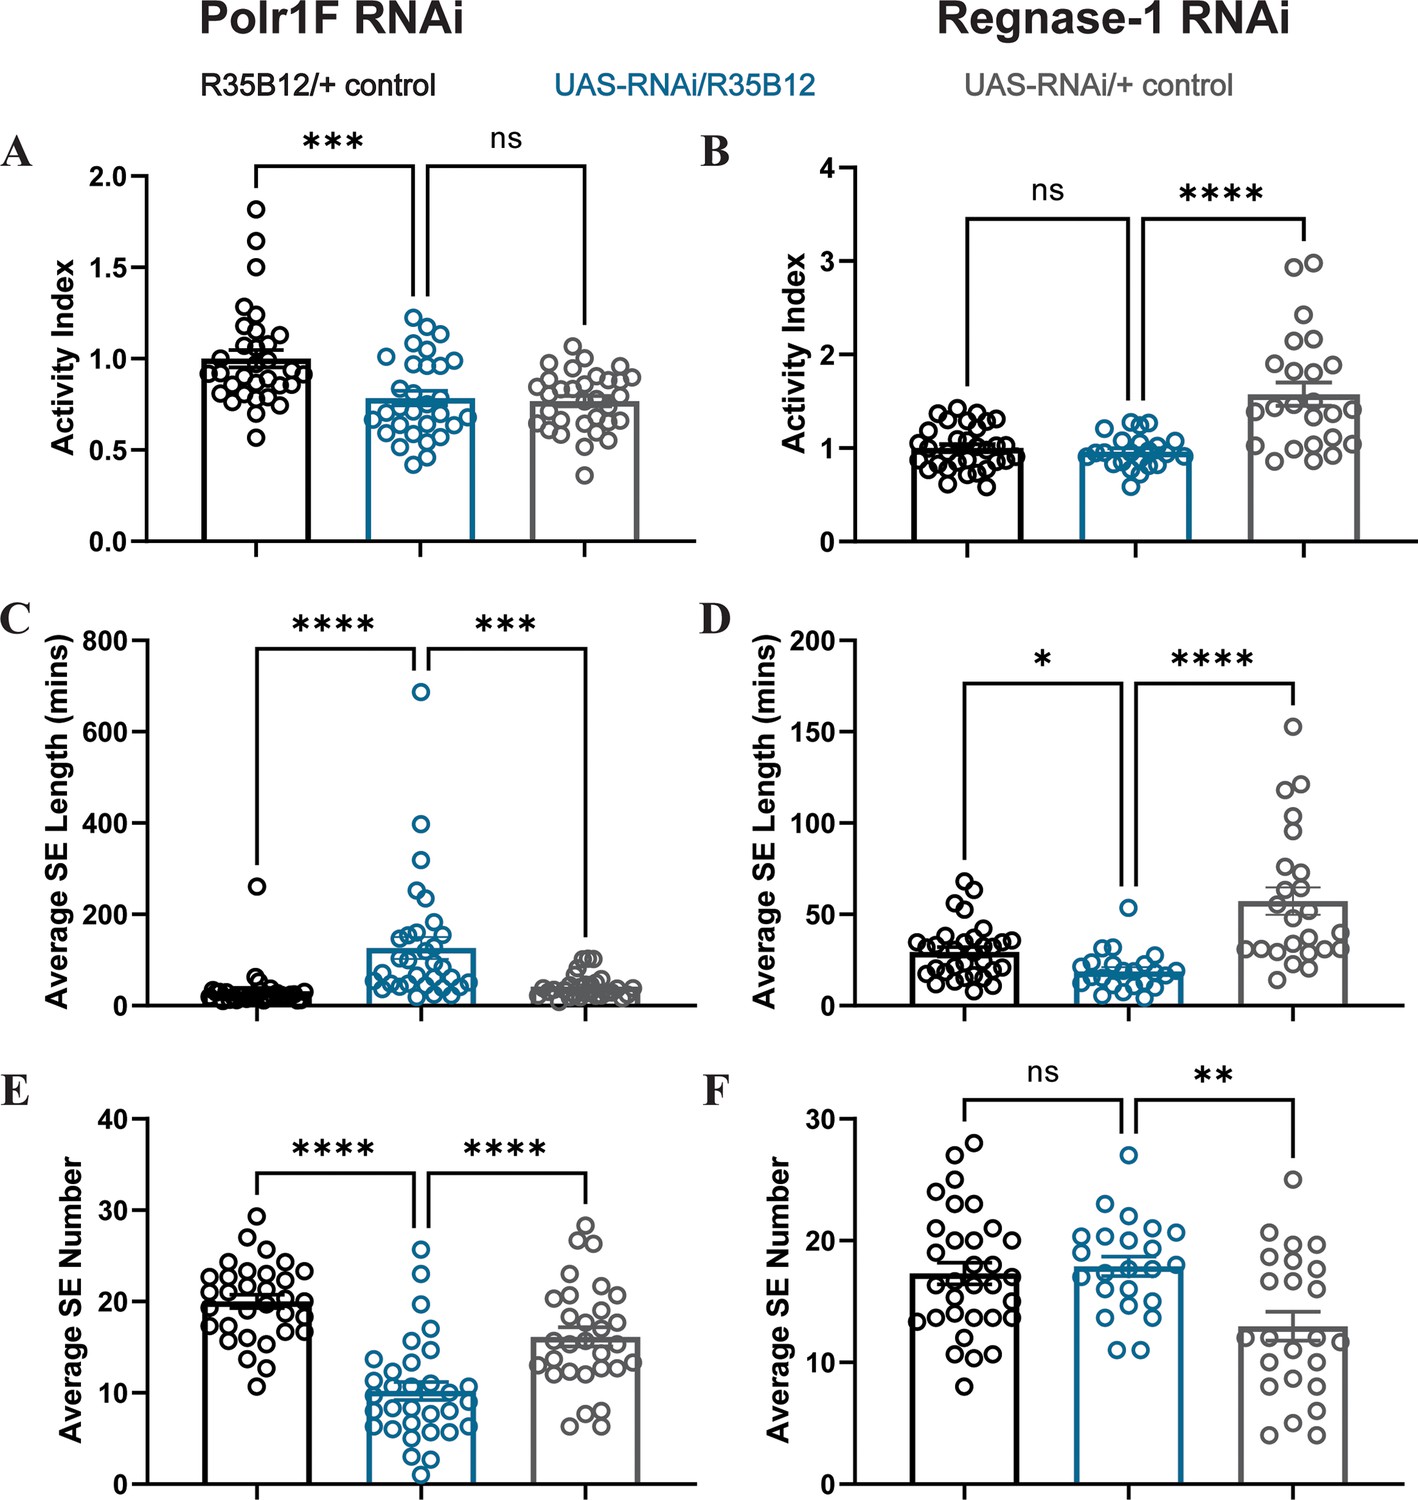
Effect of Polr1F and Regnase-1 knockdown on activity and sleep architecture.
(A–B) Total activity of flies is not altered by knockdown of Polr1F and Regnase-1. One-way ANOVA was used to calculate the p-values for each comparison. (C–D) Knockdown of Polr1F significantly increases the nighttime average sleep episode (SE) length in R35B12-Gal4>polr1 F RNAi flies, while knockdown of Regnase-1 reduces it in R35B12-Gal4>regnase1 RNAi flies. The p-values for each comparison were calculated using the Kruskal–Wallis test with Dunn′s multiple comparisons test. (E–F) Knockdown of Polr1F significantly reduces the nighttime average sleep episode (SE) number in R35B12-Gal4>polr1FRNAi flies, but it is not significant compared to control groups in R35B12-Gal4>regnase1 RNAi flies. The p-values for each comparison were calculated using the Kruskal–Wallis test with Dunn′s multiple comparisons test. ns = not significant, p>0.05, *p<0.05, **p<0.01, ***p <0.001, ****p < 0.0001.
-
Figure 2—figure supplement 1—source data 1
Effect of Polr1F and Regnase-1 knockdown on activity and sleep architecture.
- https://cdn.elifesciences.org/articles/89023/elife-89023-fig2-figsupp1-data1-v1.xlsx
Figure 3 with 4 supplements

Acute and chronic effects of pan-neuronal knockdown of Polr1F on sleep in adult flies.
(A) Schematic representation of transient and chronic sleep measurements in nSyb-GS>polr1fRNAi flies (created in BioRender.com/t22a408). (B) Representative sleep traces and transient activity plot of flies expressing Polr1F RNAi under the control of an inducible pan-neuronal driver (nSyb-GS>polr1f RNAi) with and without RU treatment. (C) Quantification of sleep during the first 3 hours (ZT 9–12) after F1 progeny flies were loaded into RU- or RU+ DAM tubes at ZT8-T9. Sleep was measured starting at ZT9. N=39–40 individual flies per replicate with data from three independent replicates combined. The Mann-Whitney test was used to compare RU+ group and RU- groups. (D) Representative average sleep traces of nSyb-GS>polr1f RNAi in the RU- and RU+ DAM tubes for 3 consecutive days. Chronic sleep effects of pan-neuronal knockdown Polr1F were measured based on sleep data from day 3 to day 5. (E) Quantification of average total sleep of nSyb-GS>polr1fRNAi and controls in the DAM tubes from (D). Unpaired t-test was used to compare between RU- and RU+ groups. ****p<0.0001.
-
Figure 3—source data 1
Acute and chronic sleep phenotypes resulting from adult pan-neuronal knockdown of Porl1F.
- https://cdn.elifesciences.org/articles/89023/elife-89023-fig3-data1-v1.xlsx
Figure 3—figure supplement 1
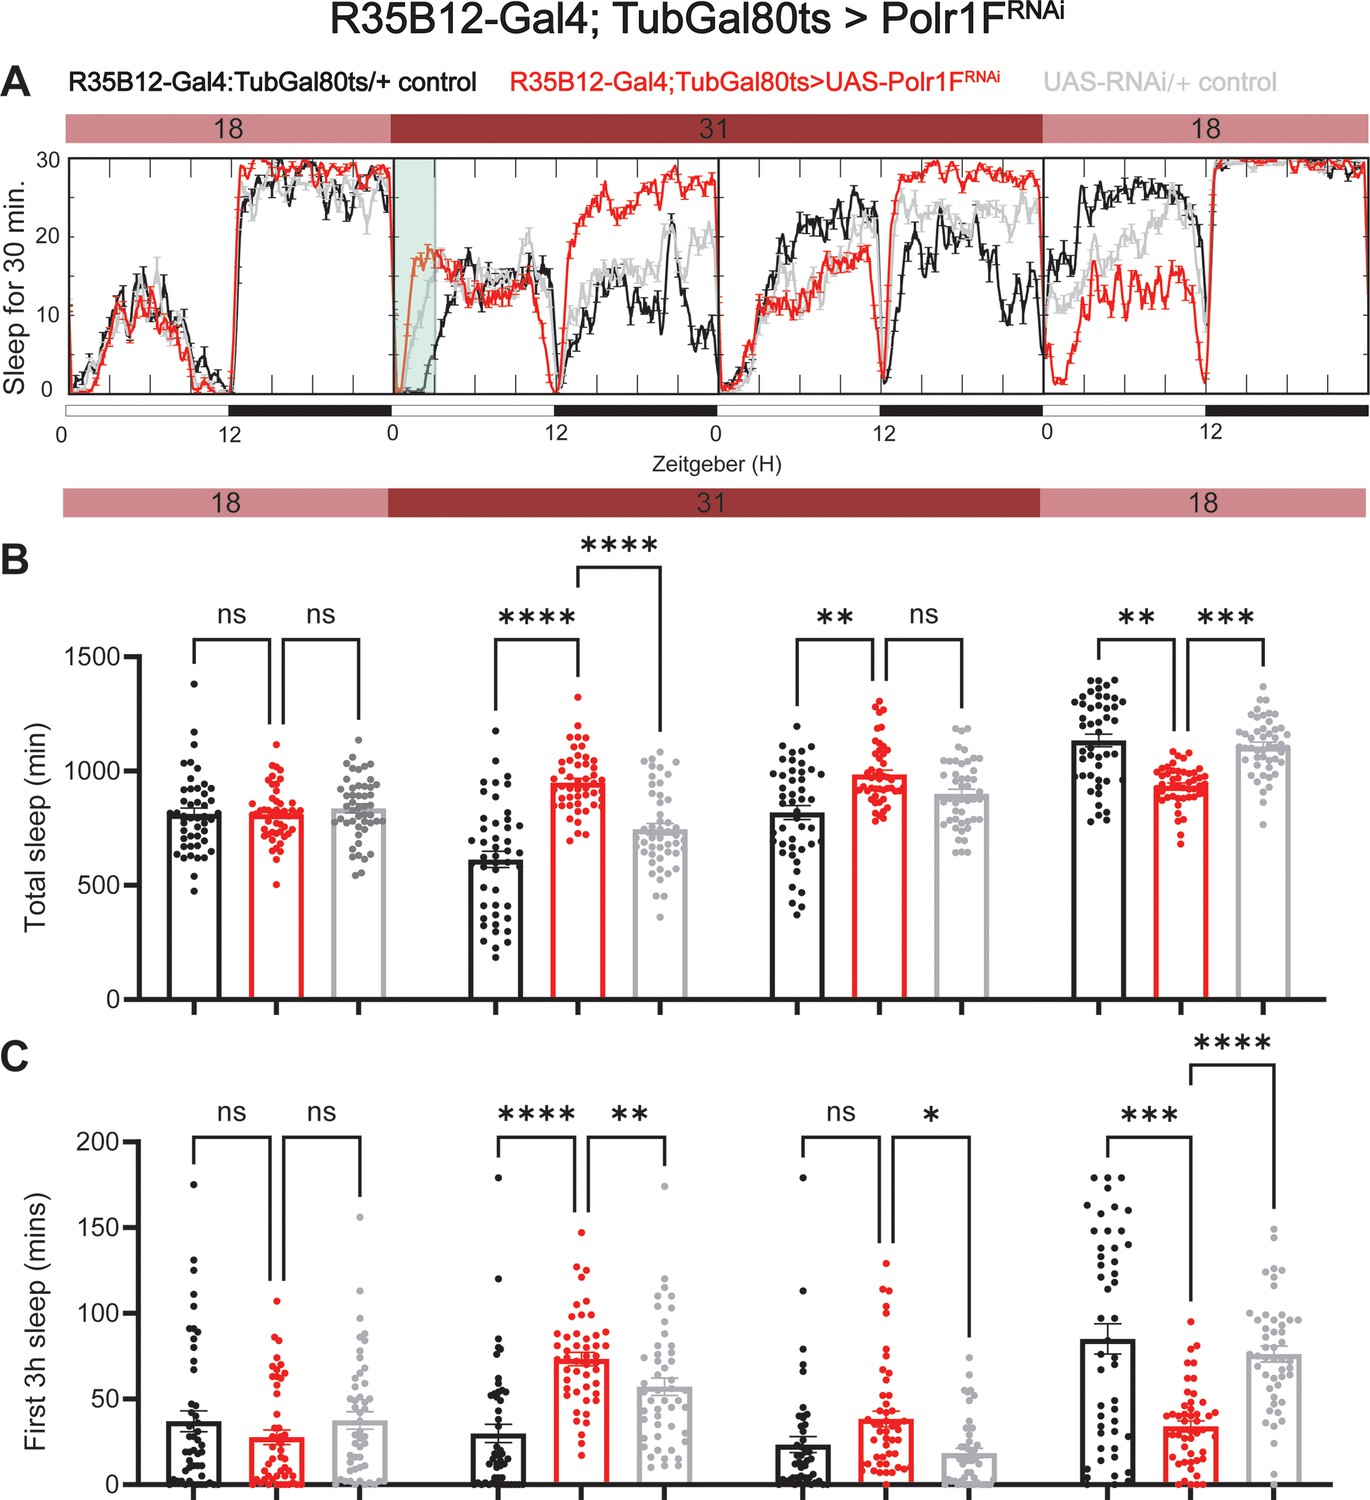
Adult specific knockdown of Polr1F promotes sleep.
(A) Representative sleep traces of adult flies expressing Polr1F RNAi under the control of R35B12-Gal4/Tubulin-gal80ts. At permissive temperature, Gal80ts inhibits Gal4 activation of UAS; however, upon switching to restrictive temperature, Gal80ts is deactivated, leading to downstream activation of the UAS-regulated gene. (B) Sleep patterns were quantified over 4 consecutive days, with flies under permissive temperature on the first and last days and restrictive temperature on the second and third days. (C) Sleep quantification during the initial 3 hr period (ZT 0–3) after light onset for each day is shown. N=46–48 individual flies per replicate with data from three independent replicates combined. The Kruskal-Wallis test with Dunn′s multiple comparisons test was used to compare three groups. ns = not significant, p>0.05, *p<0.05, **p<0.01, ***p<0.001, ****p<0.0001.
-
Figure 3—figure supplement 1—source data 1
Sleep phenotypes resulting from α′/β′ neuronal knockdown of Polr1F by TARGET system.
- https://cdn.elifesciences.org/articles/89023/elife-89023-fig3-figsupp1-data1-v1.xlsx
Figure 3—figure supplement 2
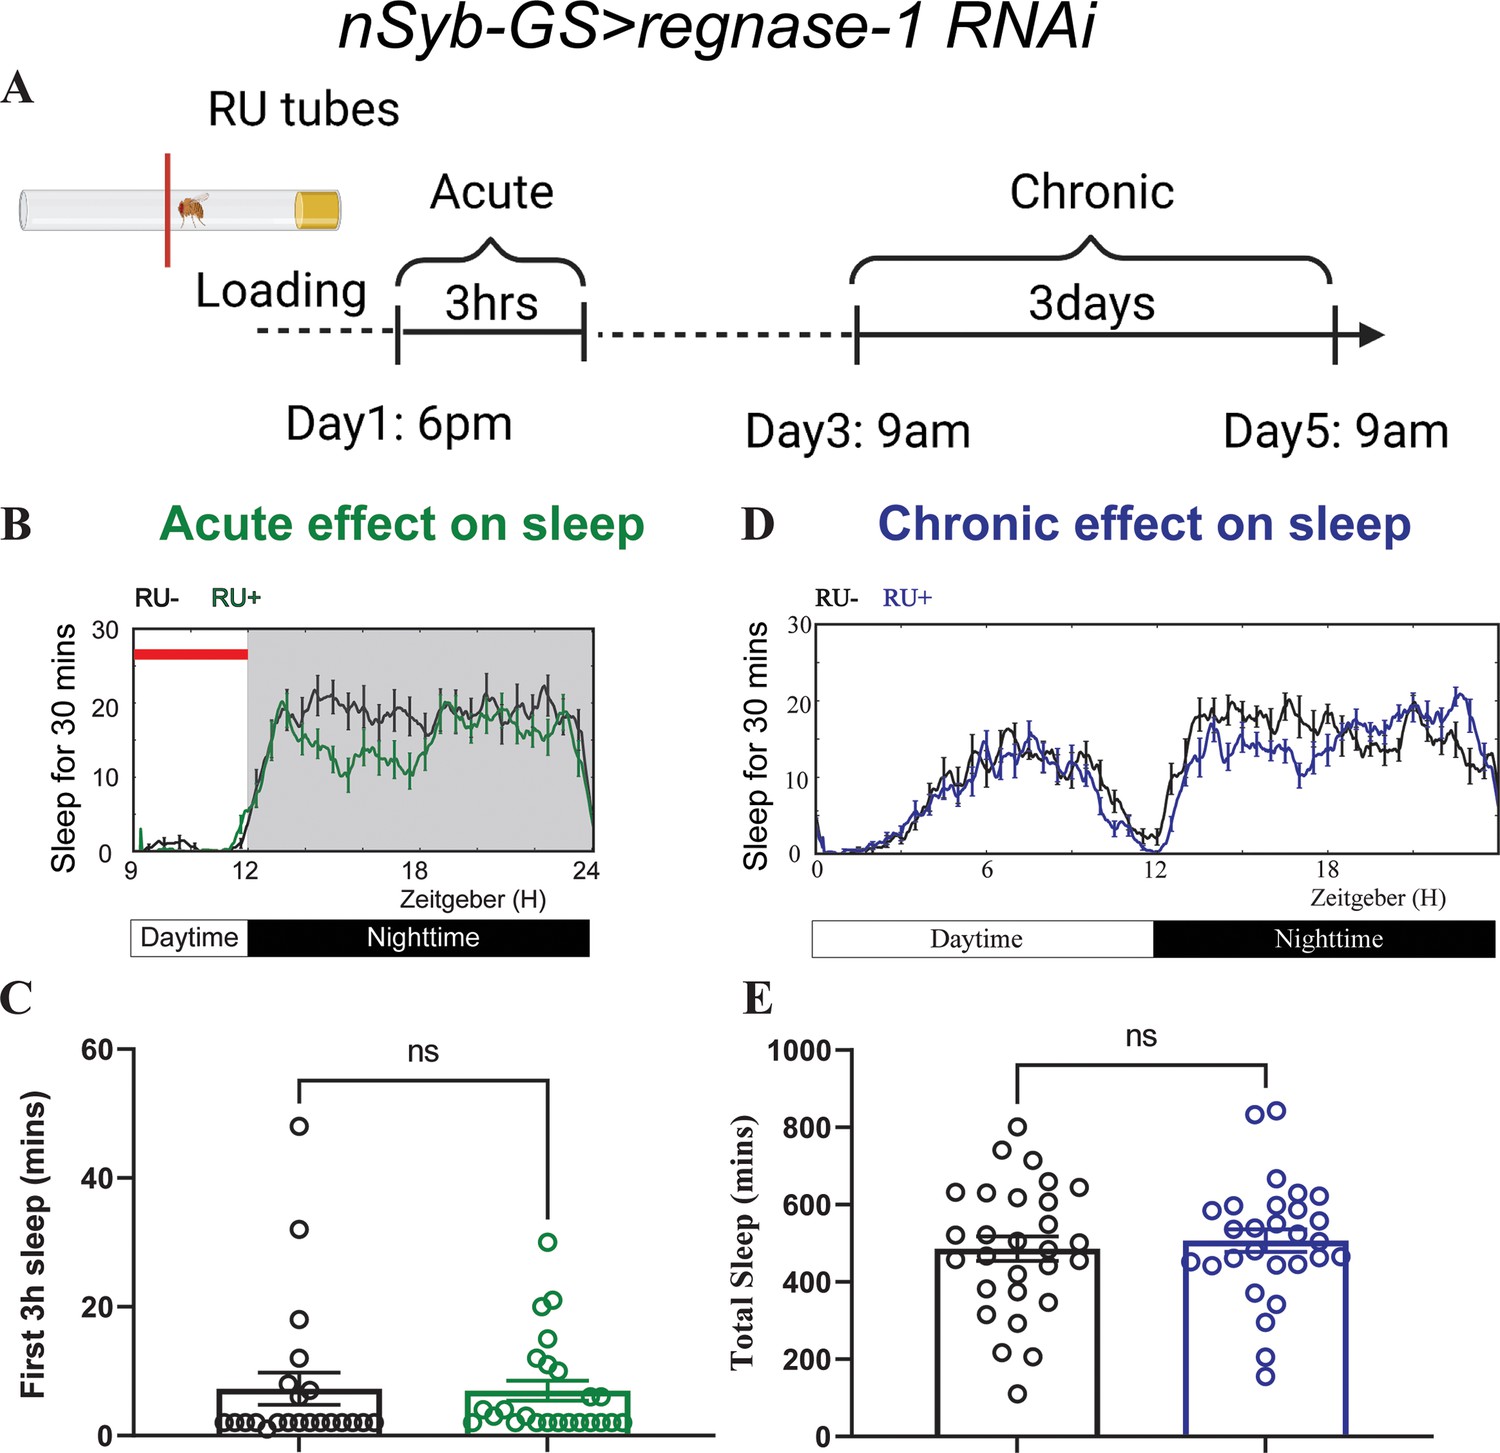
Acute and chronic effects of pan-neuronal knockdown of Regnase-1 on sleep in adult flies.
(A) Schematic representation of the protocol for transient and chronic sleep measurements in nSyb-GS>regnase-1 RNAi flies (created in BioRender.com/t22a408). (B) Representative sleep traces plot of flies expressing Rengase-1 RNAi under the control of an inducible pan-neuronal driver (nSyb-GS>regnase-1 RNAi) with and without RU treatment (C) Quantification of sleep during the first 3 hr (ZT 9–12) after F1 progeny flies were loaded into RU- or RU + DAM tubes at ZT8-T9. Sleep was measured starting at ZT9. N=22–24 individual flies per replicate with data from two independent replicates combined. The Mann-Whitney test was used to compare RU + group and RU- groups. (D) Representative average sleep traces of nSyb-GS>regnase-1 RNAi in the RU- and RU + DAM tubes for three consecutive days. Chronic sleep effects of knockdown of Regnase-1 were measured based on sleep data from day 3 to day 5. (E) Quantification of average total sleep of nSyb-GS>regnase-1 RNAi and controls in the DAM tubes from (D). Unpaired t-test was used to compare between RU- and RU + group. ns = not significant.
-
Figure 3—figure supplement 2—source data 1
Acute and chronic sleep phenotypes resulting from adult pan-neuronal knockdown of Regnase-1.
- https://cdn.elifesciences.org/articles/89023/elife-89023-fig3-figsupp2-data1-v1.xlsx
Figure 3—figure supplement 3
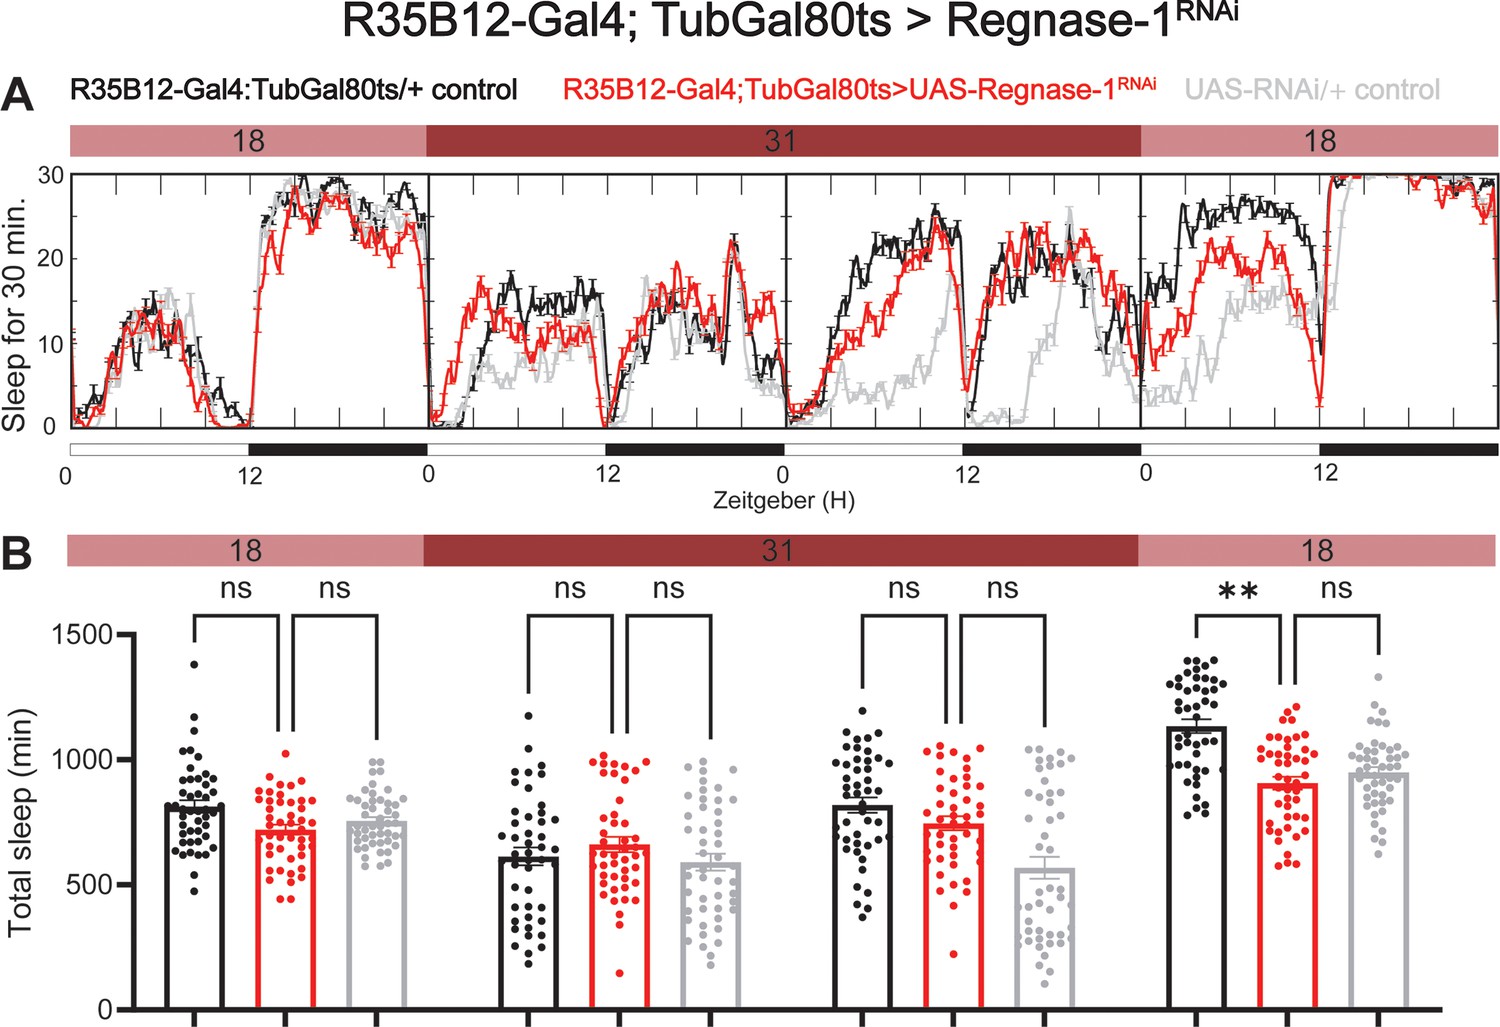
Adult specific knockdown of Regnase-1 has no effect on sleep.
(A) Representative sleep traces of adult flies expressing Regnase-1 RNAi under the control of R35B12-Gal4/Tubulin-gal80ts. (B) Sleep was quantified over four consecutive days, with flies under permissive temperature on the first and last days and restrictive temperature on the second and third days. N=46 individual flies per replicate with data from three independent replicates combined. The Kruskal-Wallis test with Dunn′s multiple comparisons test was used to compare three groups. ns = not significant, p>0.05, *p<0.05, **p<0.01.
-
Figure 3—figure supplement 3—source data 1
Sleep phenotypes resulting from α′/β′ neuronal knockdown of Regnase-1 by TARGET system.
- https://cdn.elifesciences.org/articles/89023/elife-89023-fig3-figsupp3-data1-v1.xlsx
Figure 3—figure supplement 4
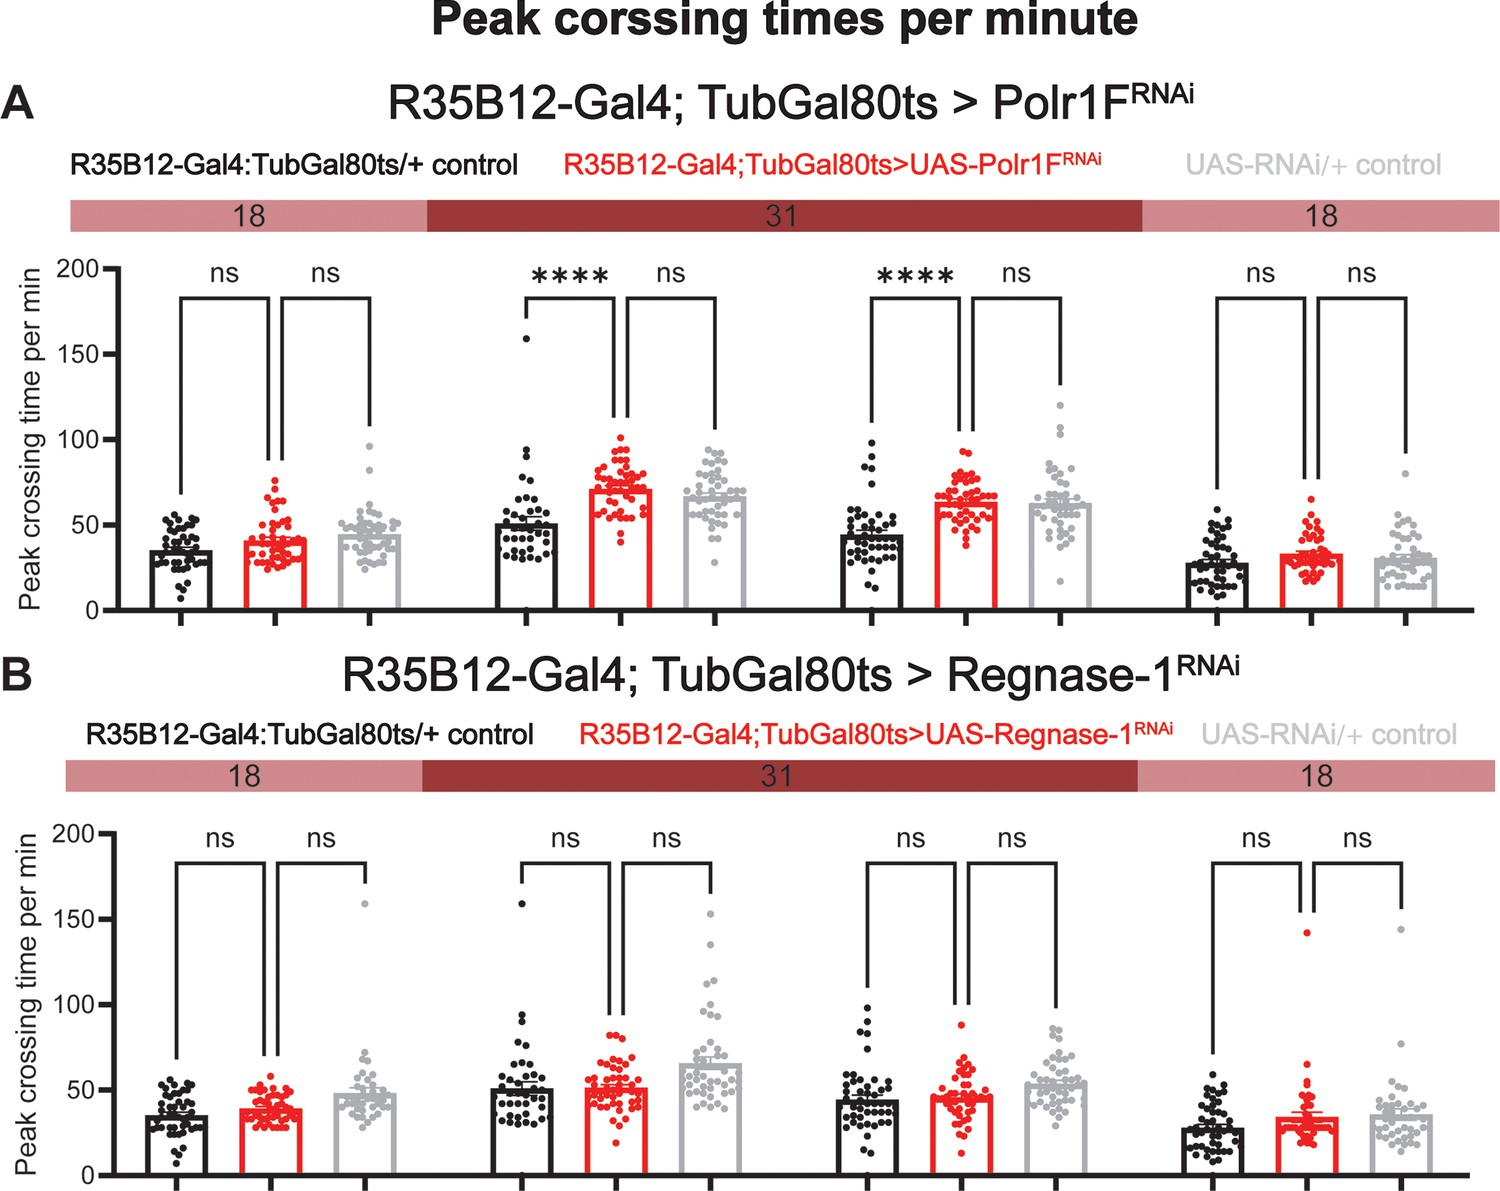
Adult specific knockdown of Polr1F or Regnase-1 has no effect on peak activity.
(A) Maximal activity per minute for R35B12-Gal4; TubGal80ts > polr1 F RNAi was quantified over four consecutive days, with flies under permissive temperature on the first and last days and restrictive temperature on the second and third days. (B) Maximal activity per minute for R35B12-Gal4; TubGal80ts > Regnase-1 RNAi was quantified. N=40–48 individual flies per replicate with data from three independent replicates combined. The Kruskal-Wallis test with Dunn′s multiple comparisons test was used to compare three groups. ns = not significant, p>0.05, *****p<0.0001.
-
Figure 3—figure supplement 4—source data 1
Effect of Polr1F and Regnase-1 knockdown by TARGET system on peak activity.
- https://cdn.elifesciences.org/articles/89023/elife-89023-fig3-figsupp4-data1-v1.xlsx
Figure 4 with 1 supplement

Regnase-1 expression is essential for sleep-dependent and sleep-independent memory.
(A) Schematic representation of the memory test protocol (created in BioRender.com/z46i047). (B, C) Sleep-dependent and sleep-independent memory tests were conducted under fed and starved conditions, respectively. Knockdown of Regnase-1 significantly reduces long-term memory performance in both fed and starved flies. However, knockdown of Polr1F in ap α′/β′ neurons does not affect long-term memory performance. N≥6 biological replicates, each replicate containing 100–150 flies. (D, E) Fed UAS-regnase-1-RNAi/+and R35B12/+flies exhibit a significant increase in sleep after training, while R35B12-Gal4>regnase-1 RNAi flies fail to show a comparable increase in post-training sleep. The total sleep in the ZT8-ZT12 interval is shown in (E). Polr1F knockdown in ap α′/β′ neurons does not affect the post-training increase in sleep. N≥32. (F) Compared to R35B12-Gal4/+and + /UAS-Regnase-1 RNAi flies, R35B12-Gal4>reganse-1 RNAi flies show a significant decrease in the performance index in short-term memory. N≥6 biological replicates, each containing 100–150 flies. ns = not significant, p>0.05, *p<0.05, **p<0.01, ***p<0.001, ****p<0.0001.
-
Figure 4—source data 1
Effects of Porl1F and Regnase-1 knockdown on memory and post-training sleep.
- https://cdn.elifesciences.org/articles/89023/elife-89023-fig4-data1-v1.xlsx
Figure 4—figure supplement 1
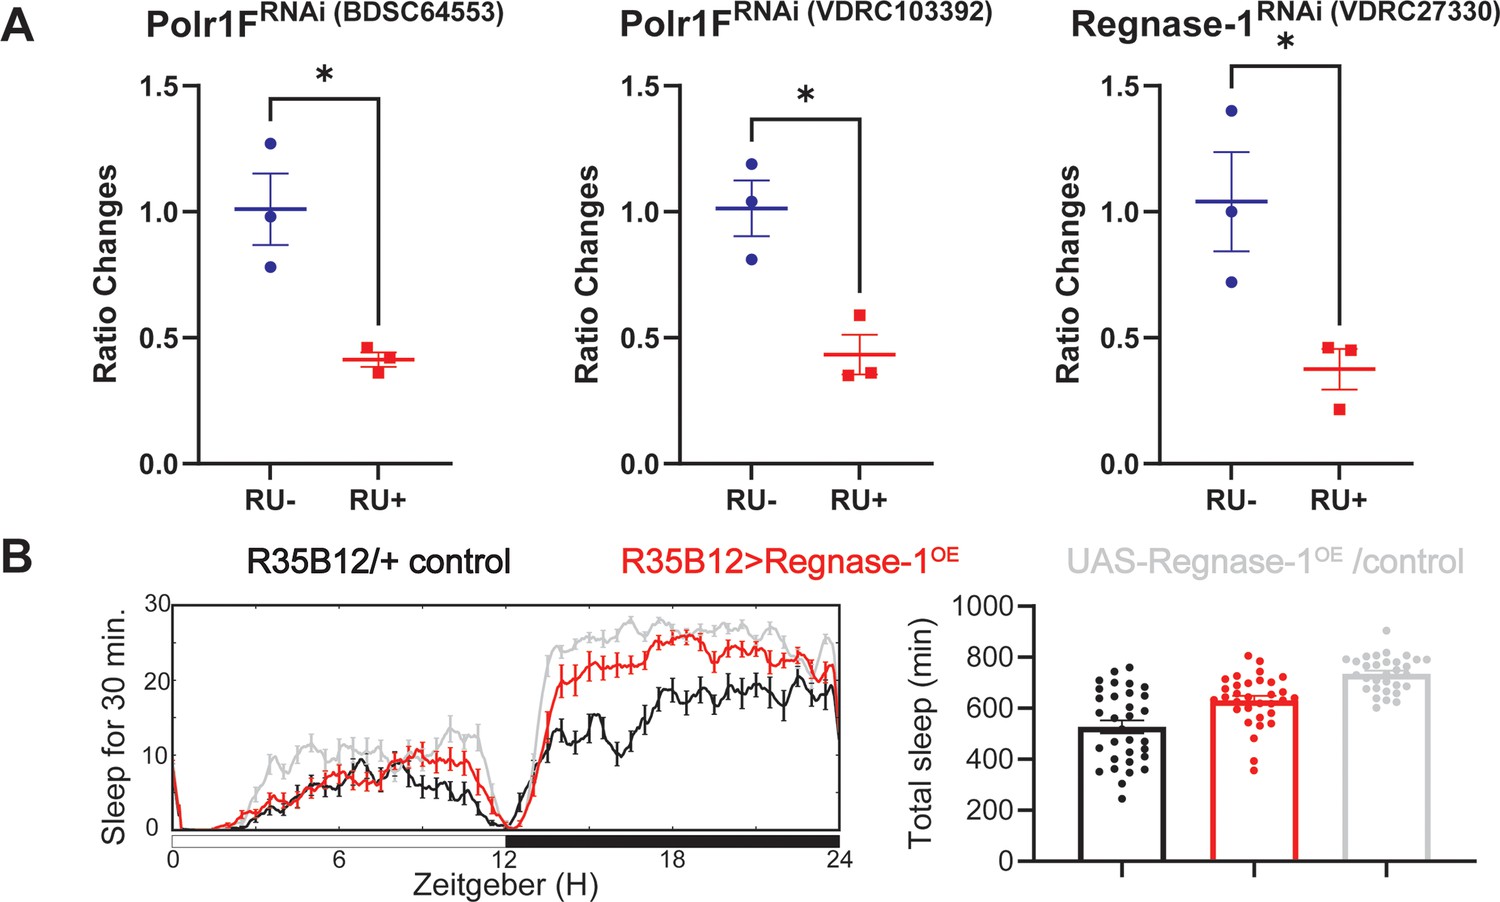
Regnase-1 overexpression in the ap α′/β′ neurons does not affect sleep.
(A) The efficacy of the RNAi used in the experiments was verified by real-time quantitative PCR. The different RNAi lines were crossed with nSyb-GS, and adult progeny were placed in either RU- or RU + tubes overnight before being dissected for qPCR. Welch’s test was used for statistical analysis across all three RNAi, with *p<0.05 indicating significance. (B) Representative sleep traces and quantification of adult flies expressing Regnase-1 under the control of R35B12-Gal4. Sleep data were averaged over three consecutive days, with N=31–32 individual flies per replicate, and combined data from two independent replicates were analyzed.
-
Figure 4—figure supplement 1—source data 1
Verification of RNAi line efficacy and the sleep phenotypes resulting from Regnase-1 overexpression.
- https://cdn.elifesciences.org/articles/89023/elife-89023-fig4-figsupp1-data1-v1.xlsx
Figure 5 with 1 supplement

Knockdown of Polr1F results in high translation.
(A) The nSyb-GS >polr1 f RNAi flies exhibit a significant increase in pre-rRNA levels. (B) The ex vivo puromycin immunostaining assay was used to measure translation in dissected whole brains. The results show that knockdown of Polr1F using the pan-neuronal nSyb-GeneSwitch (GS) system increases translation relative to control flies that were not treated with RU. The normalized mean grayscales from the RU- and RU +groups are compared using an unpaired t-test. The analysis includes data from 8 to 11 flies per group, with results from two independent replicates combined. Scale bar: 100 µm. (C) The schematic model (created in BioRender.com/h27z926) illustrates the major transcriptome features of ap α′/β′ neurons under trained and fed conditions, revealed in this manuscript. Two RNA processing genes Polr1F and Regnase-1 are prominently downregulated during memory consolidation in trained and fed flies, respectively. Polr1F is involved in regulating ribosomal RNA synthesis, and its decrease in levels in trained and fed flies promotes sleep and translation. In contrast, Regnase-1 is localized in the ribosome and involved in mRNA decay, and its downregulation causes deficits in sleep and memory.
-
Figure 5—source data 1
The quantification of pre-rRNA levels and puromycin GFP signals resulting from Polr1F knockdown.
- https://cdn.elifesciences.org/articles/89023/elife-89023-fig5-data1-v1.xlsx
Figure 5—figure supplement 1
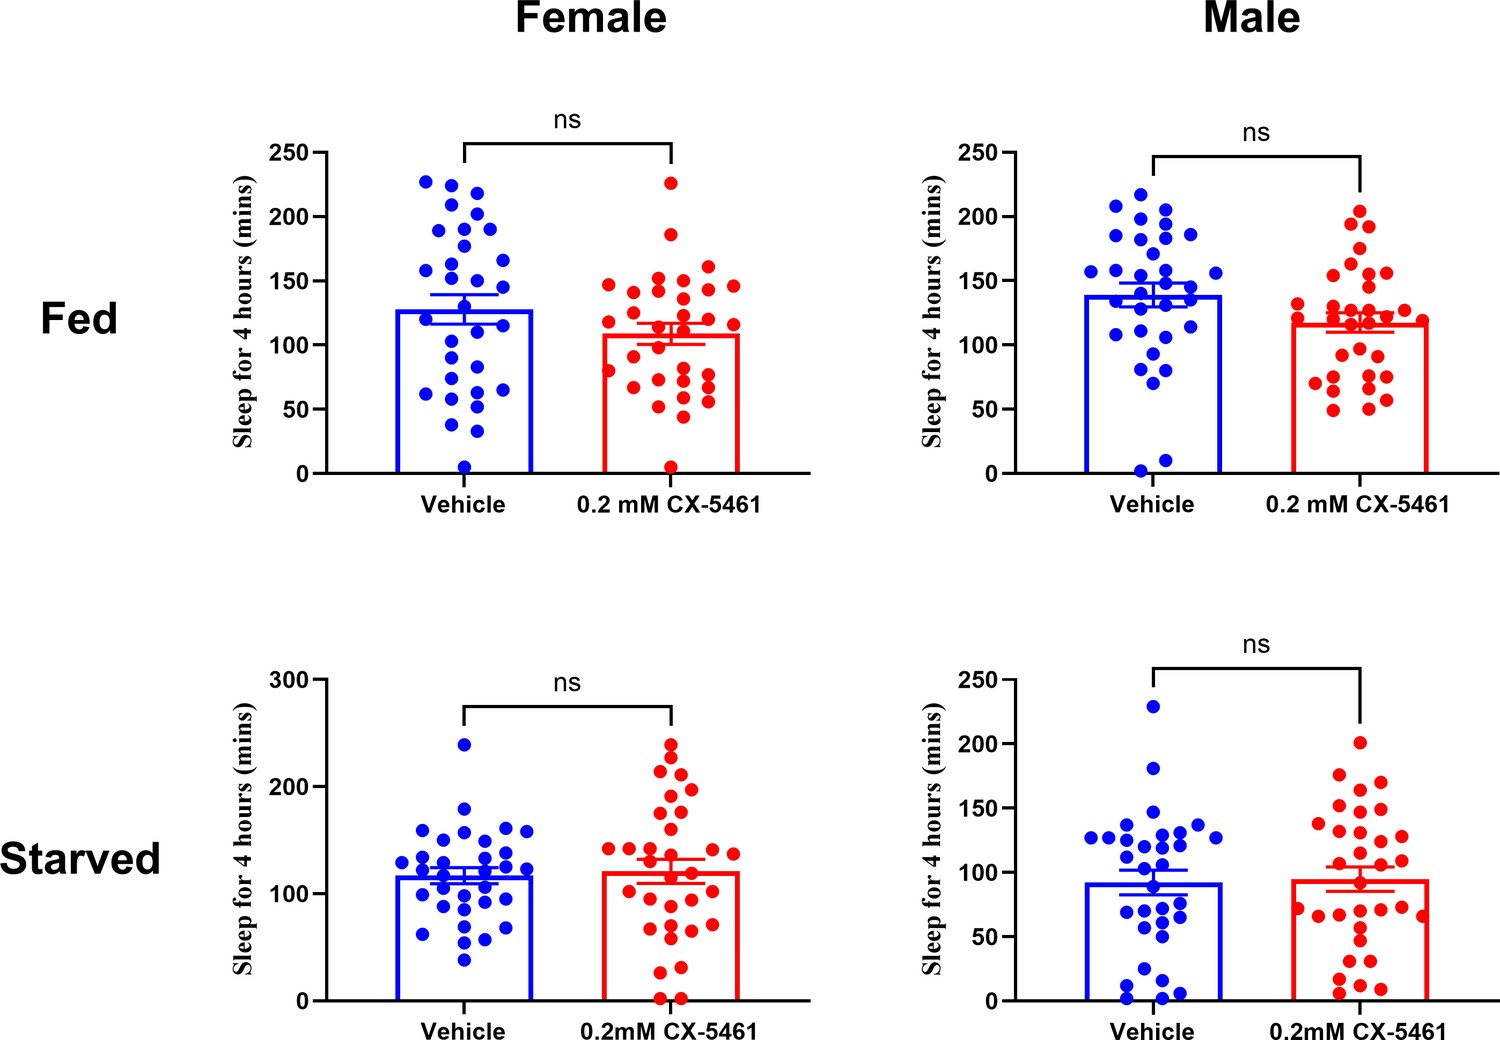
rRNA inhibitor (CX-5461) feeding does not affect sleep.
Feeding of the ribosome RNA inhibitor CX-5461 at a concentration of 0.2 mM does not affect sleep in fed or starved flies. Statistical analysis shows that there is no significant difference between CX-5461-fed and control flies. The sample size is N=32 per group from two independent replicates. ns, not significant.
-
Figure 5—figure supplement 1—source data 1
Sleep phenotypes resulting from rRNA inhibitor (CX-5461) feeding.
- https://cdn.elifesciences.org/articles/89023/elife-89023-fig5-figsupp1-data1-v1.xlsx
Tables
Key resources table
| Reagent type (species) or resource | Designation | Source or reference | Identifiers | Additional information |
|---|---|---|---|---|
| Genetic reagent (D. melanogaster) | white Canton-S (wCS) | Laboratory Stocks | ||
| Genetic reagent (D. melanogaster) | nSyb-GS | Laboratory Stocks | PMID:29590612 | |
| Genetic reagent (D. melanogaster) | R35B12-Gal4 | Bloomington Stock Center | 49822 | |
| Genetic reagent (D. melanogaster) | UAS-nGFP | Bloomington Stock Center | 4775 | |
| Genetic reagent (D. melanogaster) | R26E01-Gal4 | Bloomington Stock Center | 60510 | |
| Genetic reagent (D. melanogaster) | UAS-Polr1F RNAi | Bloomington Stock Center | 64553 | |
| Genetic reagent (D. melanogaster) | UAS-Regnase-1 RNAi | VDRC Stock Center | 27330 | |
| Genetic reagent (D. melanogaster) | UAS-Rengase-1 OE | Ryuya Fukunaga lab | ||
| Genetic reagent (D. melanogaster) | UAS-Polr1F RNAi (Used in Figure 3—figure supplements 1 and 4) | VDRC Stock Center | 103392 | |
| Antibody | Anti-Puromycin [3RH11] Antibody, mouse monoclonal | Kerafast | EQ0001 | IF(1:1000) |
| Sequence-based reagent | Pre-rRNA oligo | F: ATG GCC GTA TTC GAA TGG ATT TA | This paper | |
| Sequence-based reagent | Pre-rRNA oligo | R: CTA CTG GCA GGA TCA ACC AGA | This paper | |
| Sequence-based reagent | Regnase-1 oligo | F: CAG TCC GGG TGG CAA TAA TA | This paper | |
| Sequence-based reagent | Regnase-1 oligo | R: AGA TCC ATT TGA GCG GAG AAG | This paper | |
| Sequence-based reagent | Polr1F oligos | F: GGG TCT TCA ACA CCT CCA TAC | This paper | |
| Sequence-based reagent | Polr1F oligos | R: GCA ATA GTT CTC CCT CGA TGT AA | This paper | |
| Sequence-based reagent | Rp49 oligo | F: CCA CCA GTC GGA TCG ATA TGC | This paper | |
| Sequence-based reagent | Rp49 oligo | R: CTC TTG AGA ACG CAG GCG ACC | This paper | |
| Software, algorithm | GraphPad Prism v9 | GraphPad Software | RRID:SCR_002798 | |
| Software, algorithm | DAMFileScan113 | Trikinetics | https://trikinetics.com/ | |
| Software, algorithm | Pysolo | Gilestro and Cirelli, 2009 | https://www.pysolo.net/about/ | |
| Software, algorithm | Adobe Illustrator 2020 | Adobe | https://www.adobe.com/ | |
| Software, algorithm | BioRender | BioRender | RRID:SCR_018361 | |
| Software, algorithm | Fiji software | ImagJ | RRID:SCR_002285 | |
| Chemical compound, drug | Schneider′s medium | Thermofisher | 21720024 | |
| Chemical compound, drug | Papain | Worthington PAP2 | LK003178 | |
| Chemical compound, drug | Liberase | Roche | 5401119001 | 2.5 mg/ml |
| Chemical compound, drug | DAPI | Thermofisher | 62247 | |
| Chemical compound, drug | Puromycin dihydrochloride | Santa Cruz | Sc-108071A | |
| Chemical compound, drug | RNA Polymerase I Inhibitor II, CX-5461 | Sigma | 5092650001 | 0.2 mM |
| Commercial assay or kit | RNeasy Plus Mini Kit | Qiagen | Item No. 74134 |
Additional files
Download links
A two-part list of links to download the article, or parts of the article, in various formats.
Downloads (link to download the article as PDF)
Open citations (links to open the citations from this article in various online reference manager services)
Cite this article (links to download the citations from this article in formats compatible with various reference manager tools)
Modulation of RNA processing genes during sleep-dependent memory
eLife 12:RP89023.
https://doi.org/10.7554/eLife.89023.4


