Distance and grid-like codes support the navigation of abstract social space in the human brain
- State Key Laboratory of Cognitive Neuroscience and Learning & IDG/McGovern Institute for Brain Research, Beijing Normal University, China
- School of Systems Science, Beijing Normal University, China
Figures
Figure 1 with 4 supplements

Experimental design and behavioral performance.
(A) Visual analogs illustrating each avatar’s social values. The height of the left bars signals values on the competence dimension, while the height of the right bars signals trustworthiness. Labels for each of the two bars are omitted for illustration purposes. (B) Corresponding layout of the social value map and example trajectory in the recall task. Scattered dots indicate the actual sets of positions generated for participants. (C) Positions of the avatars indicated by participants at the end of the whole experiment. (D) Trial timeline of the recall task. Participants first watched the bars morphing for 1 s according to a predefined competence-trustworthiness ratio (i.e., the first half of a trajectory in B). After the bars stopped morphing, they were instructed to imagine the bars continue to morph according to the same ratio, at the same speed, and for the same amount of time (i.e., the second half of a trajectory in B). (E) Color-coded trajectory map of the explore task during the learning and review session. Color indicates the percentage of time spent in each pixel of the social value map during the explore task in the learning (left panel) and review (right panel) session. A pattern emerged that participants spent more time at avatars and less time at the edge during review. (F) Memory test performance of the collect and recall task in learning, review, and scan-day sessions. Collect (<15°): percentage of trials where the deviation of first transition from ideal trajectory was smaller than 15°; Collect (<0.01): percentage of trials where the distance between response location and correct location was smaller than 0.01 units; Recall (correct): percentage of trials where the response was correct. (G) The distance effect in comparison task across the review and scan-day session. Colored dots indicate the estimates of distance effect regressor while error bars indicate standard error of the estimates. (H) Ratings became predictable from the avatars’ social value after the experiment. Icons of avatars are for illustration and retrieved from https://pixabay.com/vectors/avatar-flat-modern-minimal-5261900/, https://pixabay.com/vectors/avatar-flat-modern-minimal-5261896/.
Figure 1—figure supplement 1
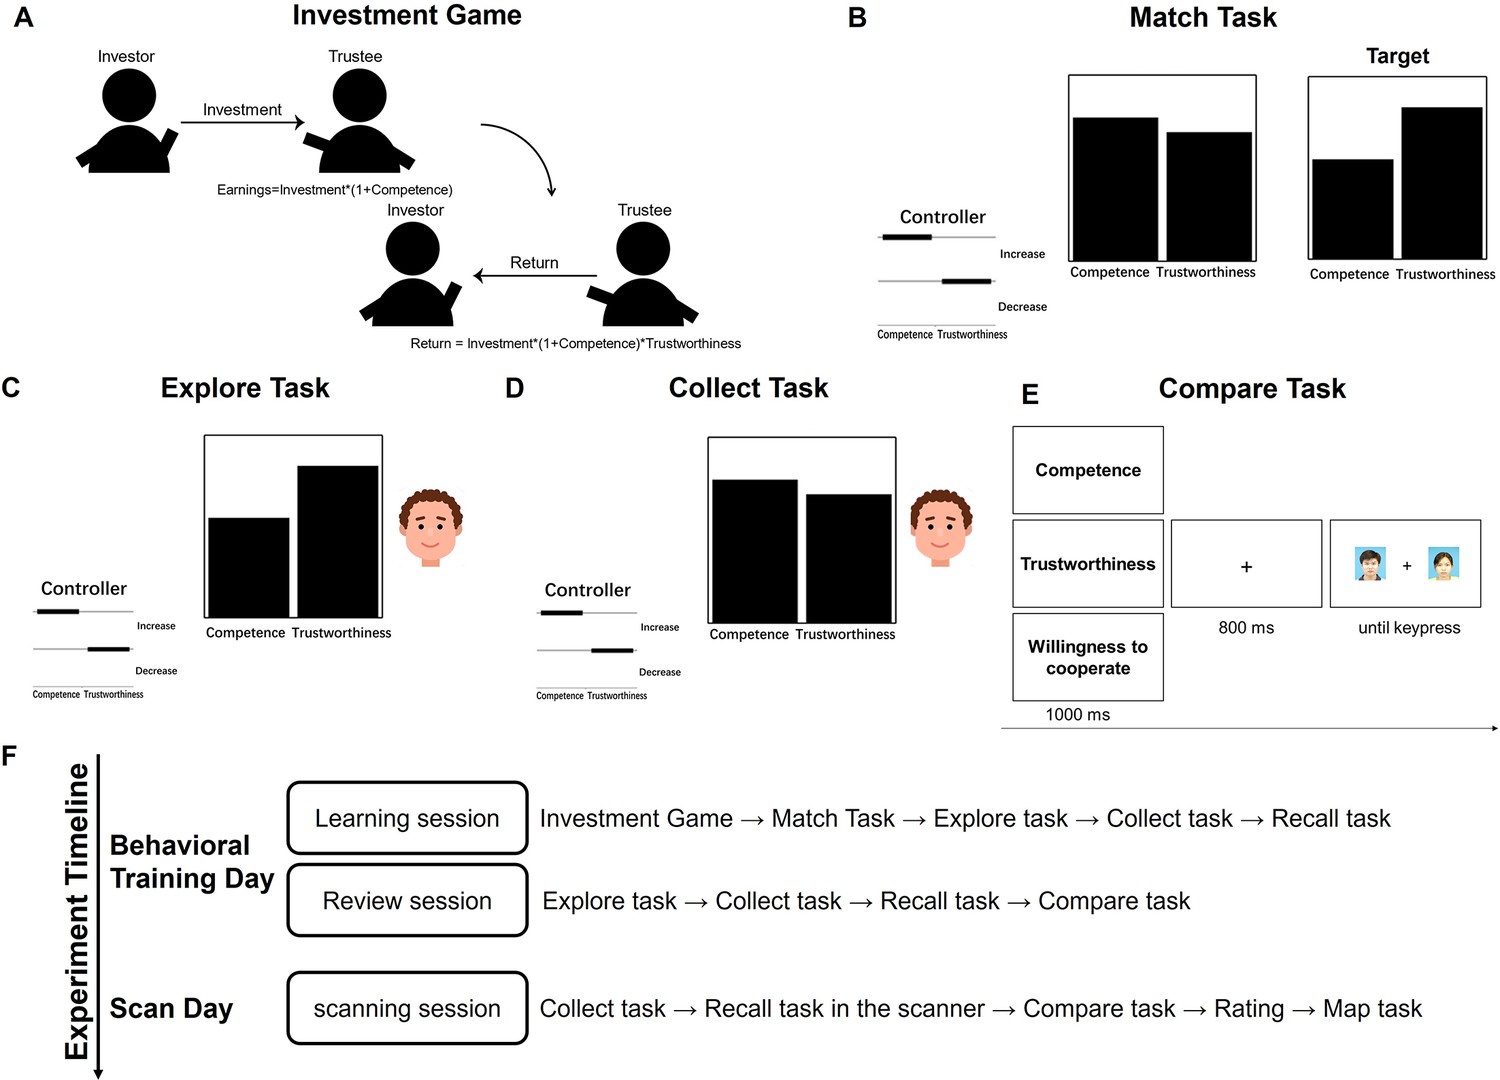
Behavioral training tasks.
(A) Schematic illustration of the investment game and its relation to the competence and trustworthiness dimensions. (B–D) Example screenshot of match, explore, and collect task. (E) Timeline of compare task. (F) Timeline of the experiment and tasks completed by participants in each session.
Figure 1—figure supplement 2
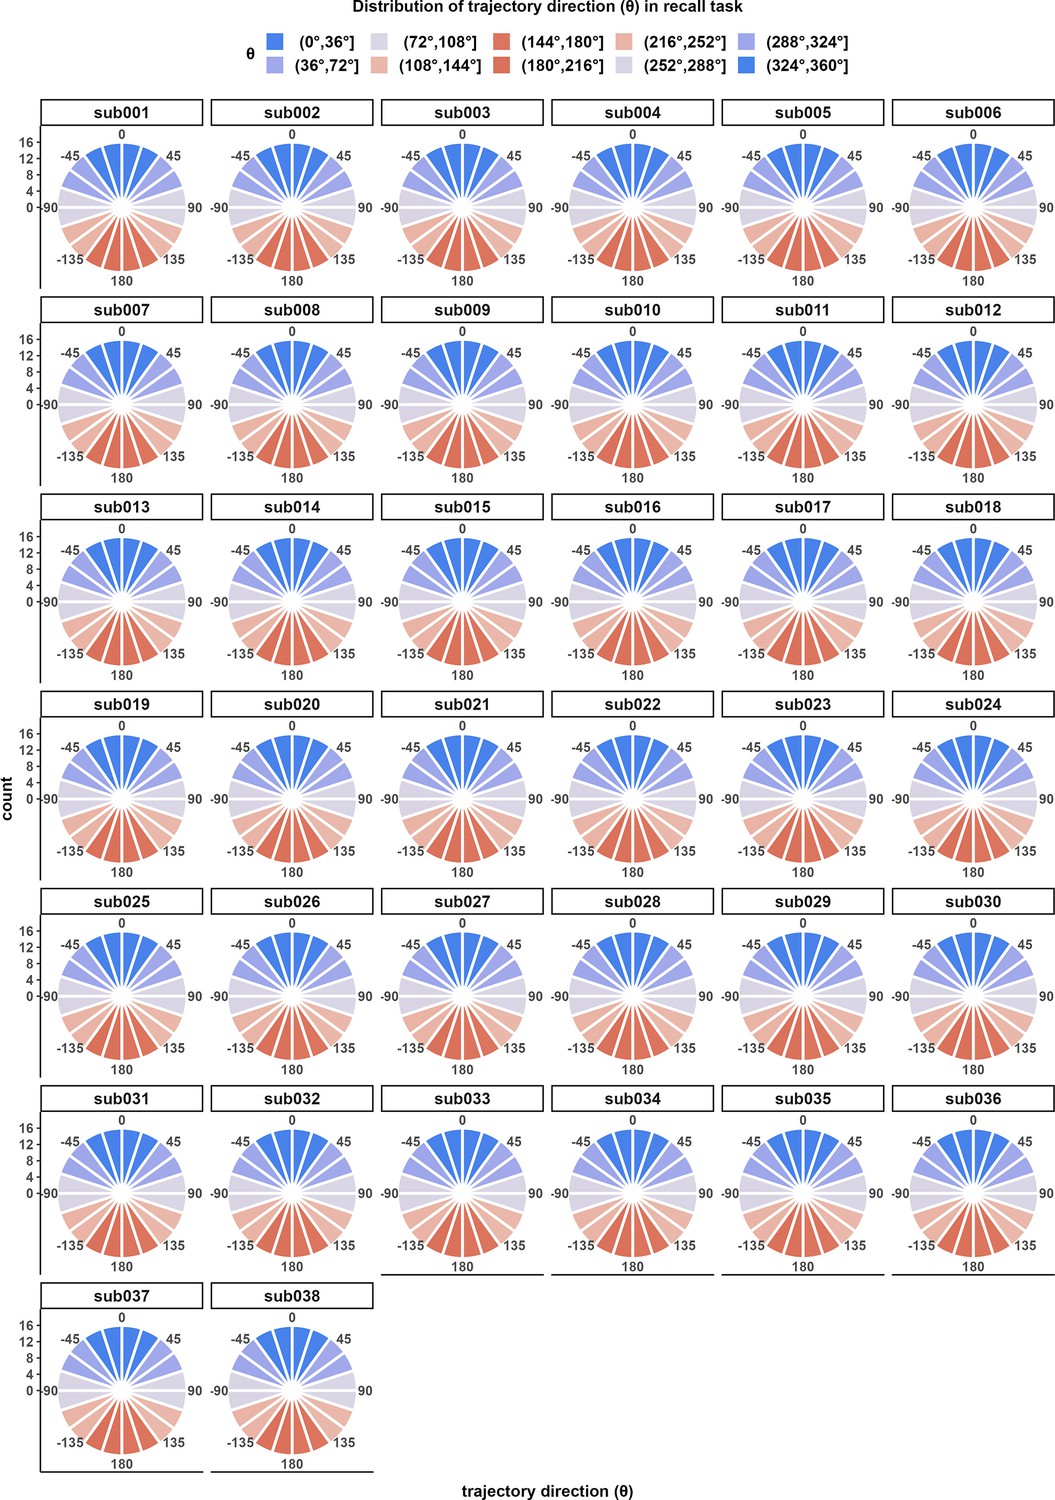
Distribution of trajectory direction (theta) in the recall task in the scanner.
Trajectory directions from all four runs were divided into 20 bins to plot histogram. The angle of polar plot indicates the trajectory direction, and the distance from the center indicates the number of trials in the bin.
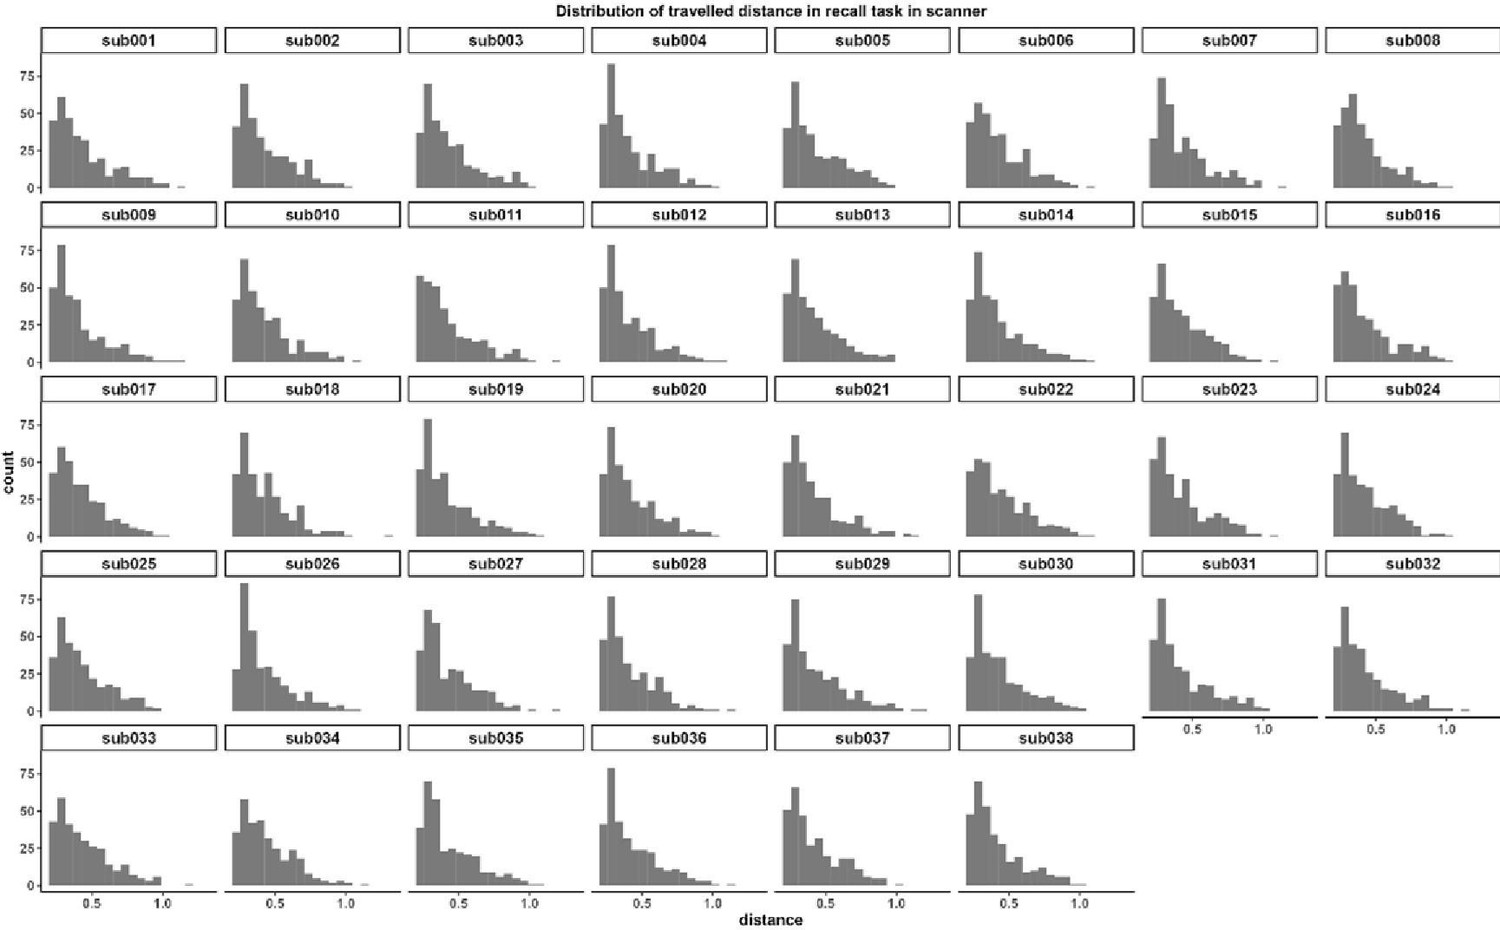
Figure 1—figure supplement 3
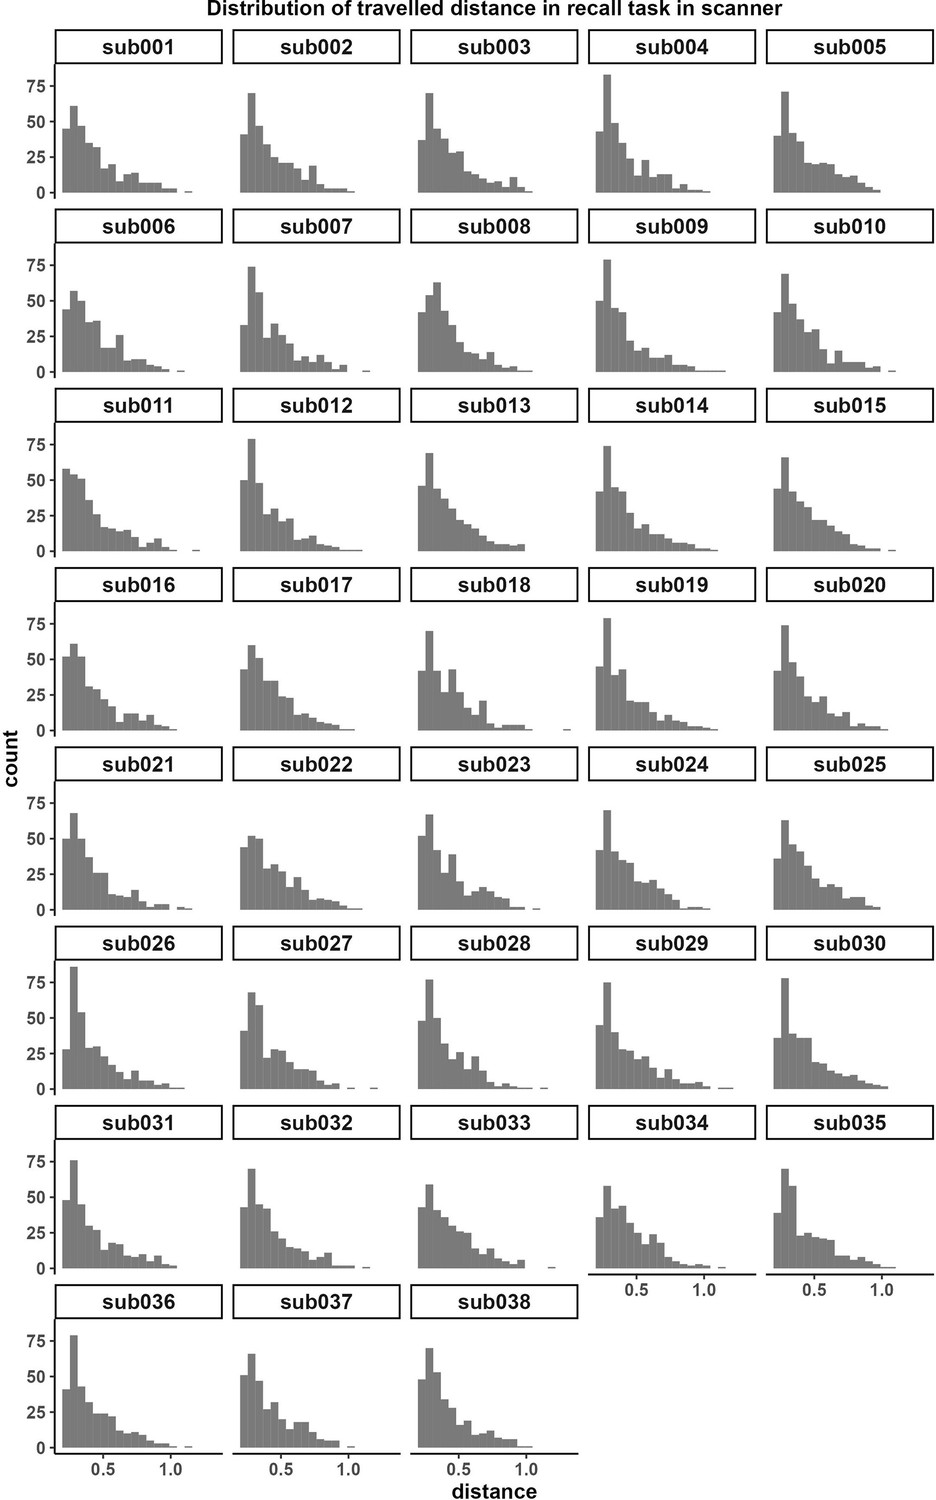
Distribution of trajectory length (travelled distance) in the recall task in the scanner.
Trajectory lengths from all four runs were divided into 20 bins to plot histogram.
Figure 1—animation 1
Recall task morph stage.
Figure 2

Neural representation of Euclidean distance on the social value map.
(A) Activity in the bilateral precuneus positively correlated with traveled Euclidean distance. (B) Activity in bilateral fusiform and the right middle occipital gyrus negatively correlated with traveled Euclidean distance. Display threshold: cluster-defining threshold p<0.001.
Figure 3 with 5 supplements

Evidence of grid-like activity aligned to putative grid orientation in the right frontal pole and the right posterior–medial entorhinal cortex.
(A) Theoretical prediction of grid-like activity. (B, C) Regions of interest (ROIs) for deriving putative grid orientations: (B) right FP ROI from quadrature filter analysis showing sensitivity to hexagonal modulation. A 5 mm sphere was defined around the peak coordinate to compute grid angle. Display threshold: voxel-level p<0.001, cluster-level p<0.05 FWE-corrected. (C) Anatomically defined right pmEC ROI used to compute grid angle. (D–G) Grid-like activity aligned to putative grid orientations in the right FP ROI (D, E) and right pmEC (F, G) ROI, respectively. Left panels: clusters from whole-brain hexagonal consistency analysis. Color indicates T statistics as shown in the colorbar in (B). Display threshold: voxel-level p<0.005, cluster-level p<0.05 FWE-corrected. Middle panels: hexagonal consistency effects plotted as contrast estimates of the 12 trial-bin regressors extracted from corresponding cluster in the left panel; To illustrate the effect in EC in (E), estimates were extracted from the intersection of the suprathreshold cluster and anatomical mask of the EC. Right panels: such effects were specific to sixfold. n.s., p>0.05, *p<0.05, **p<0.01, ***p<0.001. FP, frontal pole; pmEC, EC, entorhinal cortex; posterior–medial entorhinal cortex; vmPFC, ventral medial prefrontal cortex; STP, superior temporal pole.
Figure 3—figure supplement 1
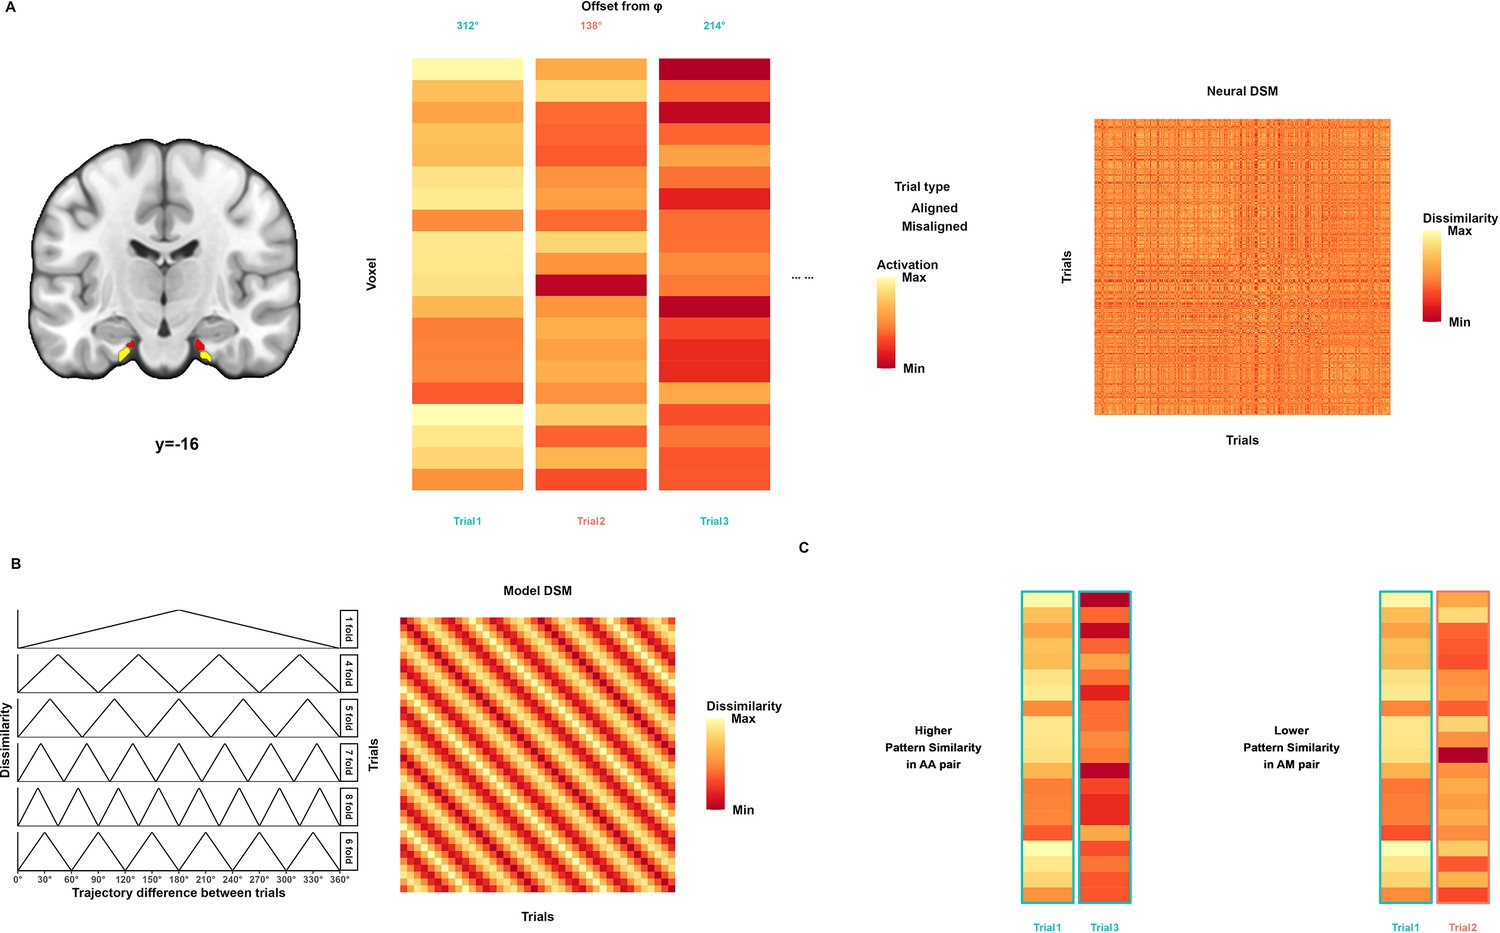
Analysis pipeline of multivariate pattern analysis in entorhinal region of interest (ROI).
(A) Signals from four subregions of entorhinal cortex were extracted. (B) Model-based analysis hexagonal consistency effect in the entorhinal subregions. (C) Model-free analysis (angle independent) representational similarity analysis (RSA) results in the whole entorhinal cortex and different entorhinal subregions.
Figure 3—figure supplement 2
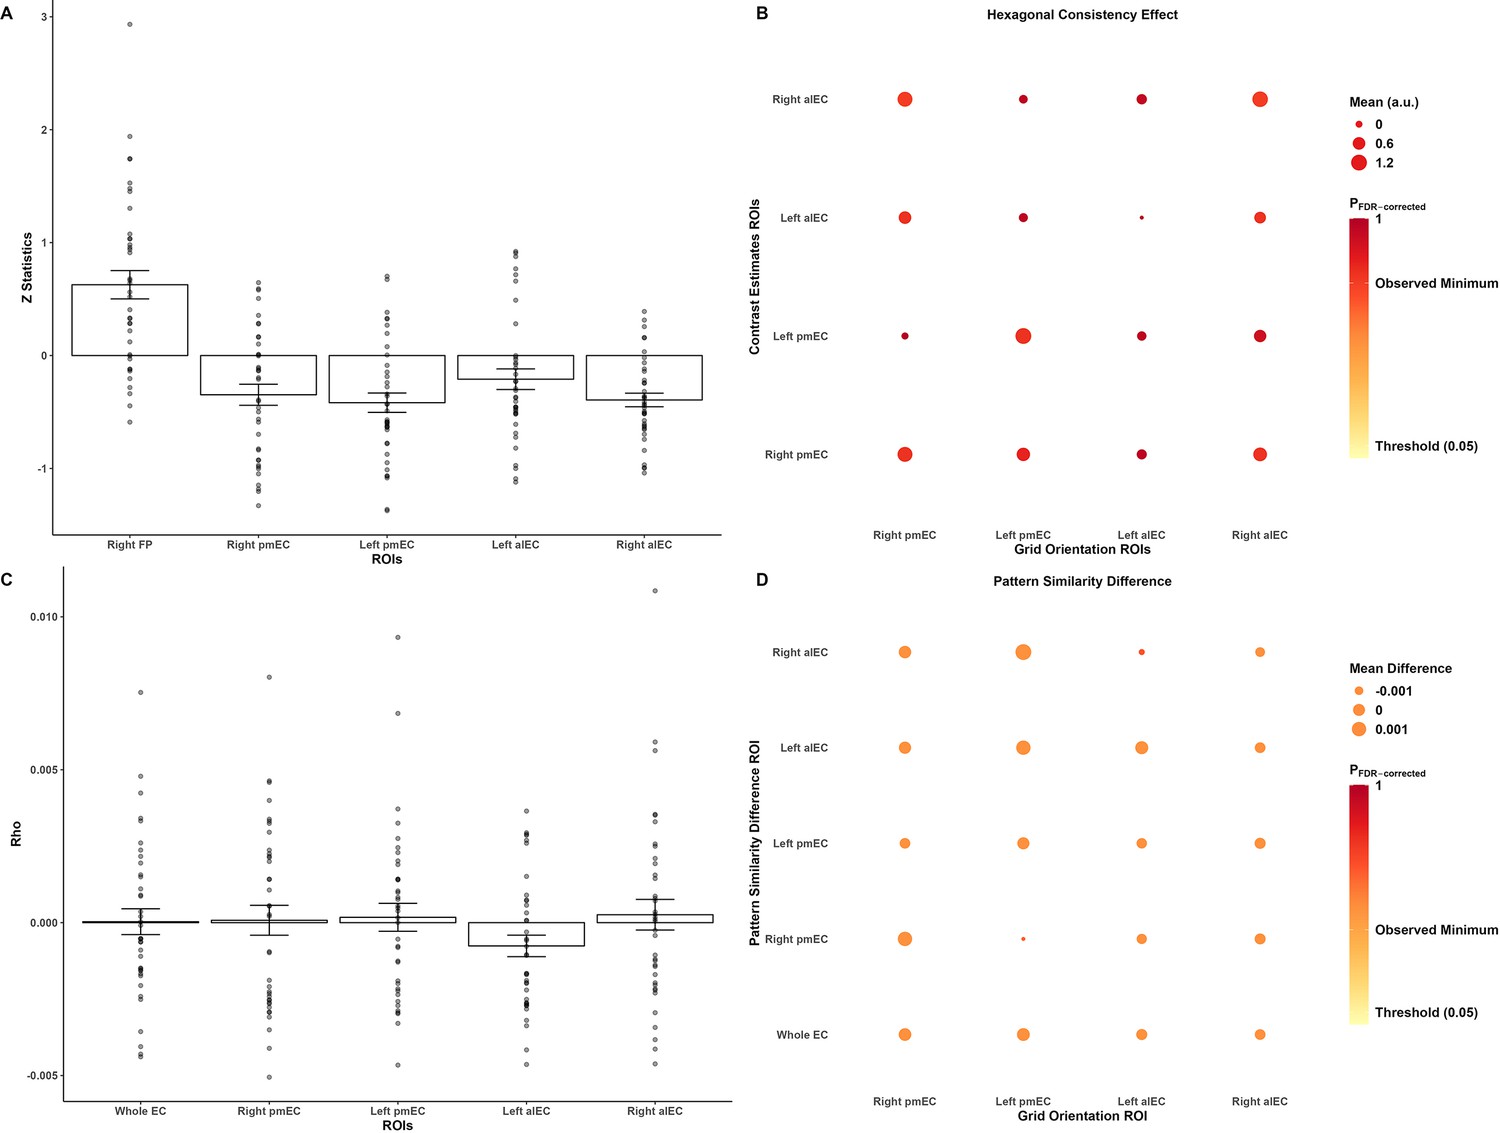
Region of interest (ROI) analysis of univariate and multivariate grid-like code in the entorhinal cortex.
(A) Z-transformed F statistics of hexagonal modulation effect in the entorhinal subregions in comparison with the frontal pole ROI. (B) Hexagonal consistency effect in the entorhinal subregions. (C) Model-based (orientation-independent) representational similarity analysis (RSA) results in the whole entorhinal cortex and different entorhinal subregions. (D) Model-free (orientation-dependent) RSA results in the entorhinal subregions. Pattern similarity difference between aligned and misaligned trials based on putative grid orientations from different entorhinal subregions. FP, frontal pole; pmEC, posterior–medial entorhinal cortex; alEC, anterior–lateral entorhinal cortex.
Figure 3—figure supplement 3
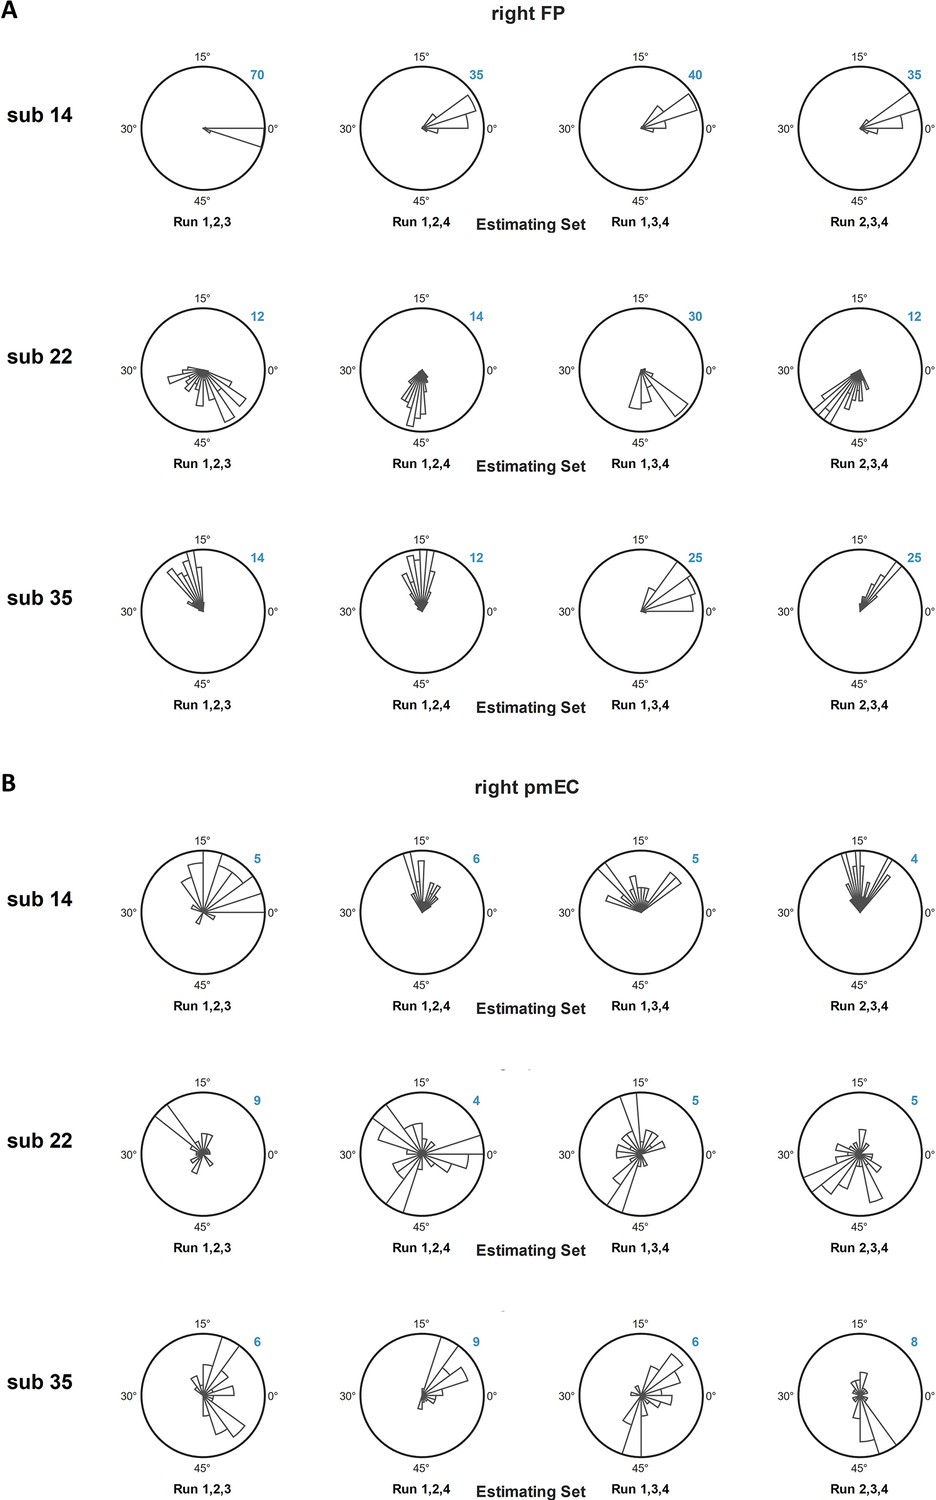
Distribution of voxel-wise grid orientation of example participants (voxel-wise distribution plot of all participants can be viewed at https://doi.org/10.57760/sciencedb.08637).
(A) in the right Frontal Pole ROI; (B) in the right posterior-medial EC ROI. Blue number indicates voxel count in the bin with most voxels.
Figure 3—figure supplement 4
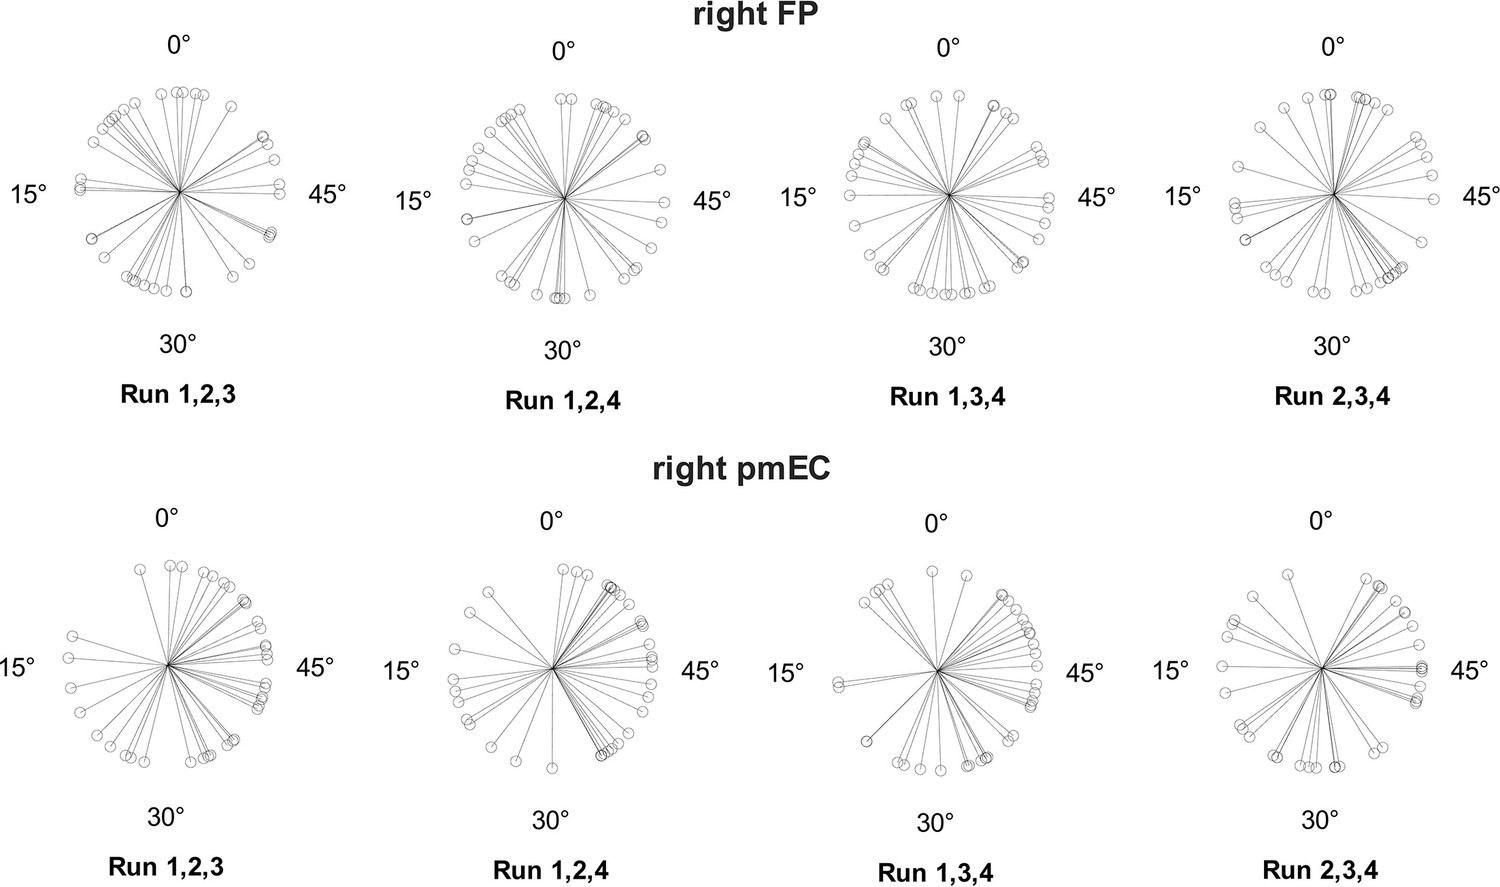
Distribution of grid orientation across participants.
Each point is the estimated grid orientation in a given estimating set in a given region of interest (ROI) for one participant.
Figure 3—figure supplement 5
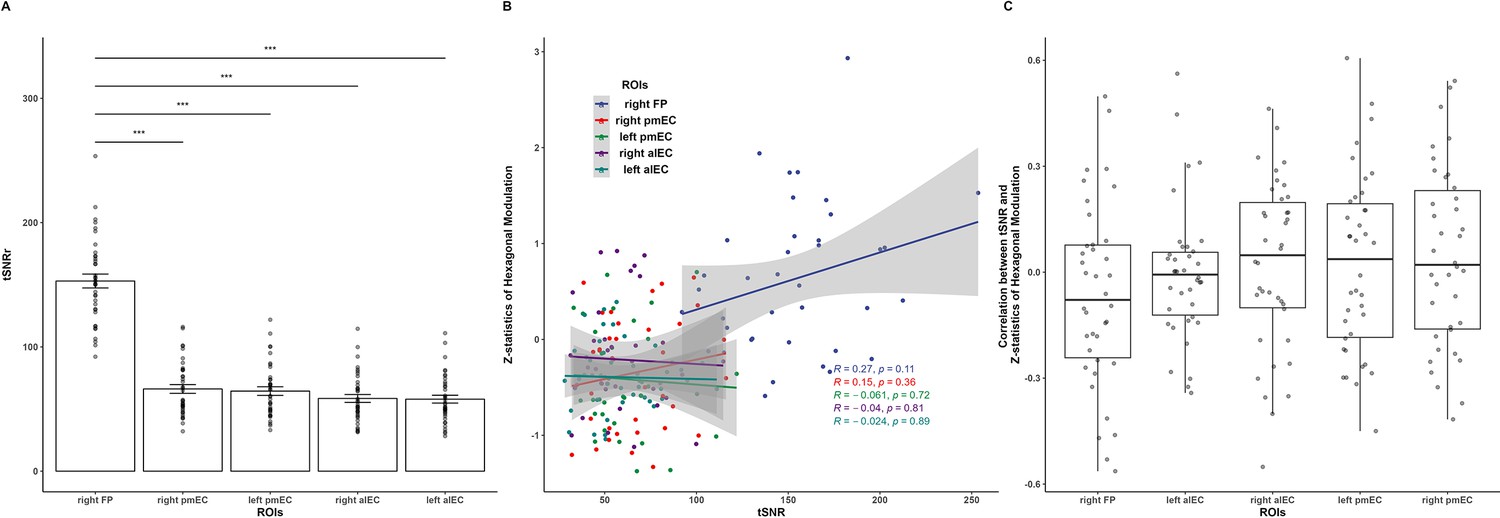
Relationship between temporal signal-to-noise ratio (tSNR) and the strength of evidence of hexagonal modulation effect in frontal pole and entorhinal regions of interest (ROIs).
(A) Across participants, mean tSNR in the right frontal pole ROI is higher than all four subregions of entorhinal cortex. (B) Across participants, in each of the five ROIs, its mean tSNR is not correlated with the Z-statistics of hexagonal modulation effect. (C) Within participants, in each of the five ROIs, voxel-wise tSNR is not correlated with the Z-statistics of hexagonal modulation effect.
Figure 4 with 1 supplement

Behavioral relevance of hexagonal consistency effect.
(A, B) Higher hexagonal consistency in temporal lobe aligned to grid orientation of (A) right FP region of interest (ROI) and (B) right pmEC significantly correlated with stronger distance effect in compare task when choosing preferred partners for cooperation. Display threshold: voxel-level p<0.005, cluster-level p<0.05 FWE-corrected. (C) Hexagonal consistency effect in left precuneus aligned to grid orientation of right FP ROI significantly correlated with social avoidance score. Display threshold: voxel-level p<0.001, cluster-level p<0.05 FWE-corrected. n.s., p>0.05, *p<0.05, **p<0.01, ***p<0.001. FP, frontal pole; pmEC, posterior–medial entorhinal cortex; MTG, middle temporal gyrus; LING, lingual gyrus.
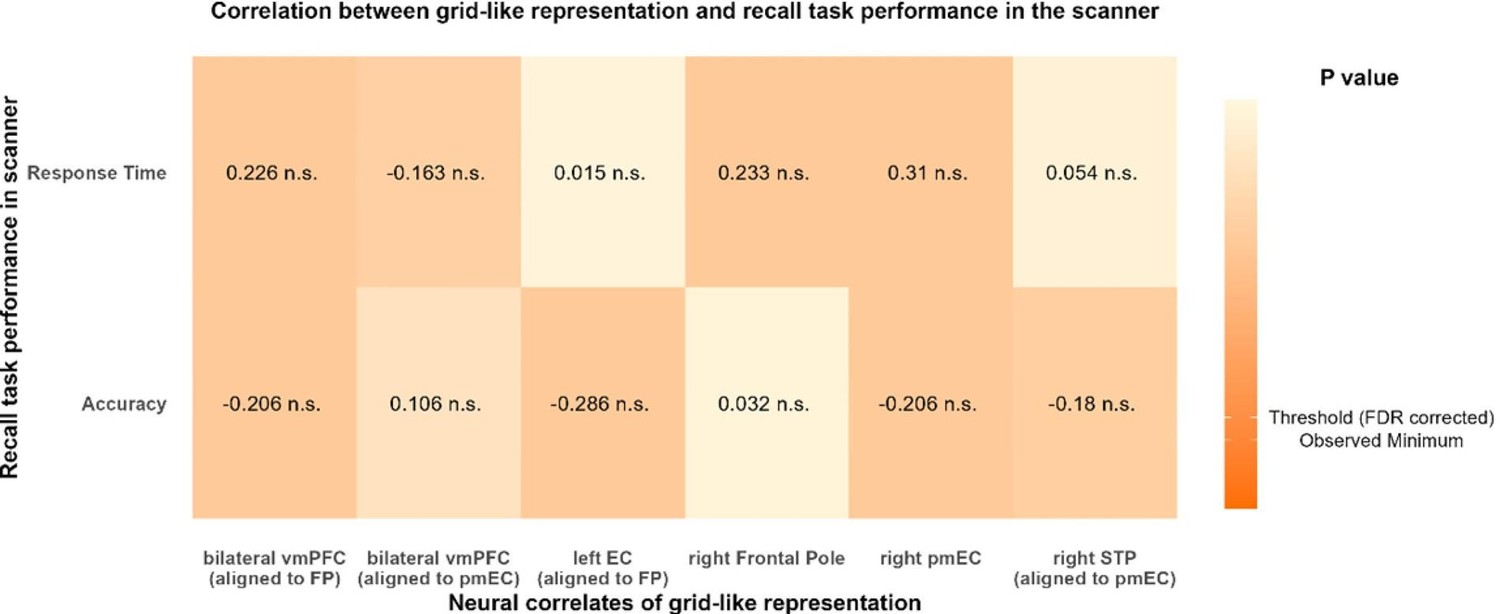
Figure 4—figure supplement 1
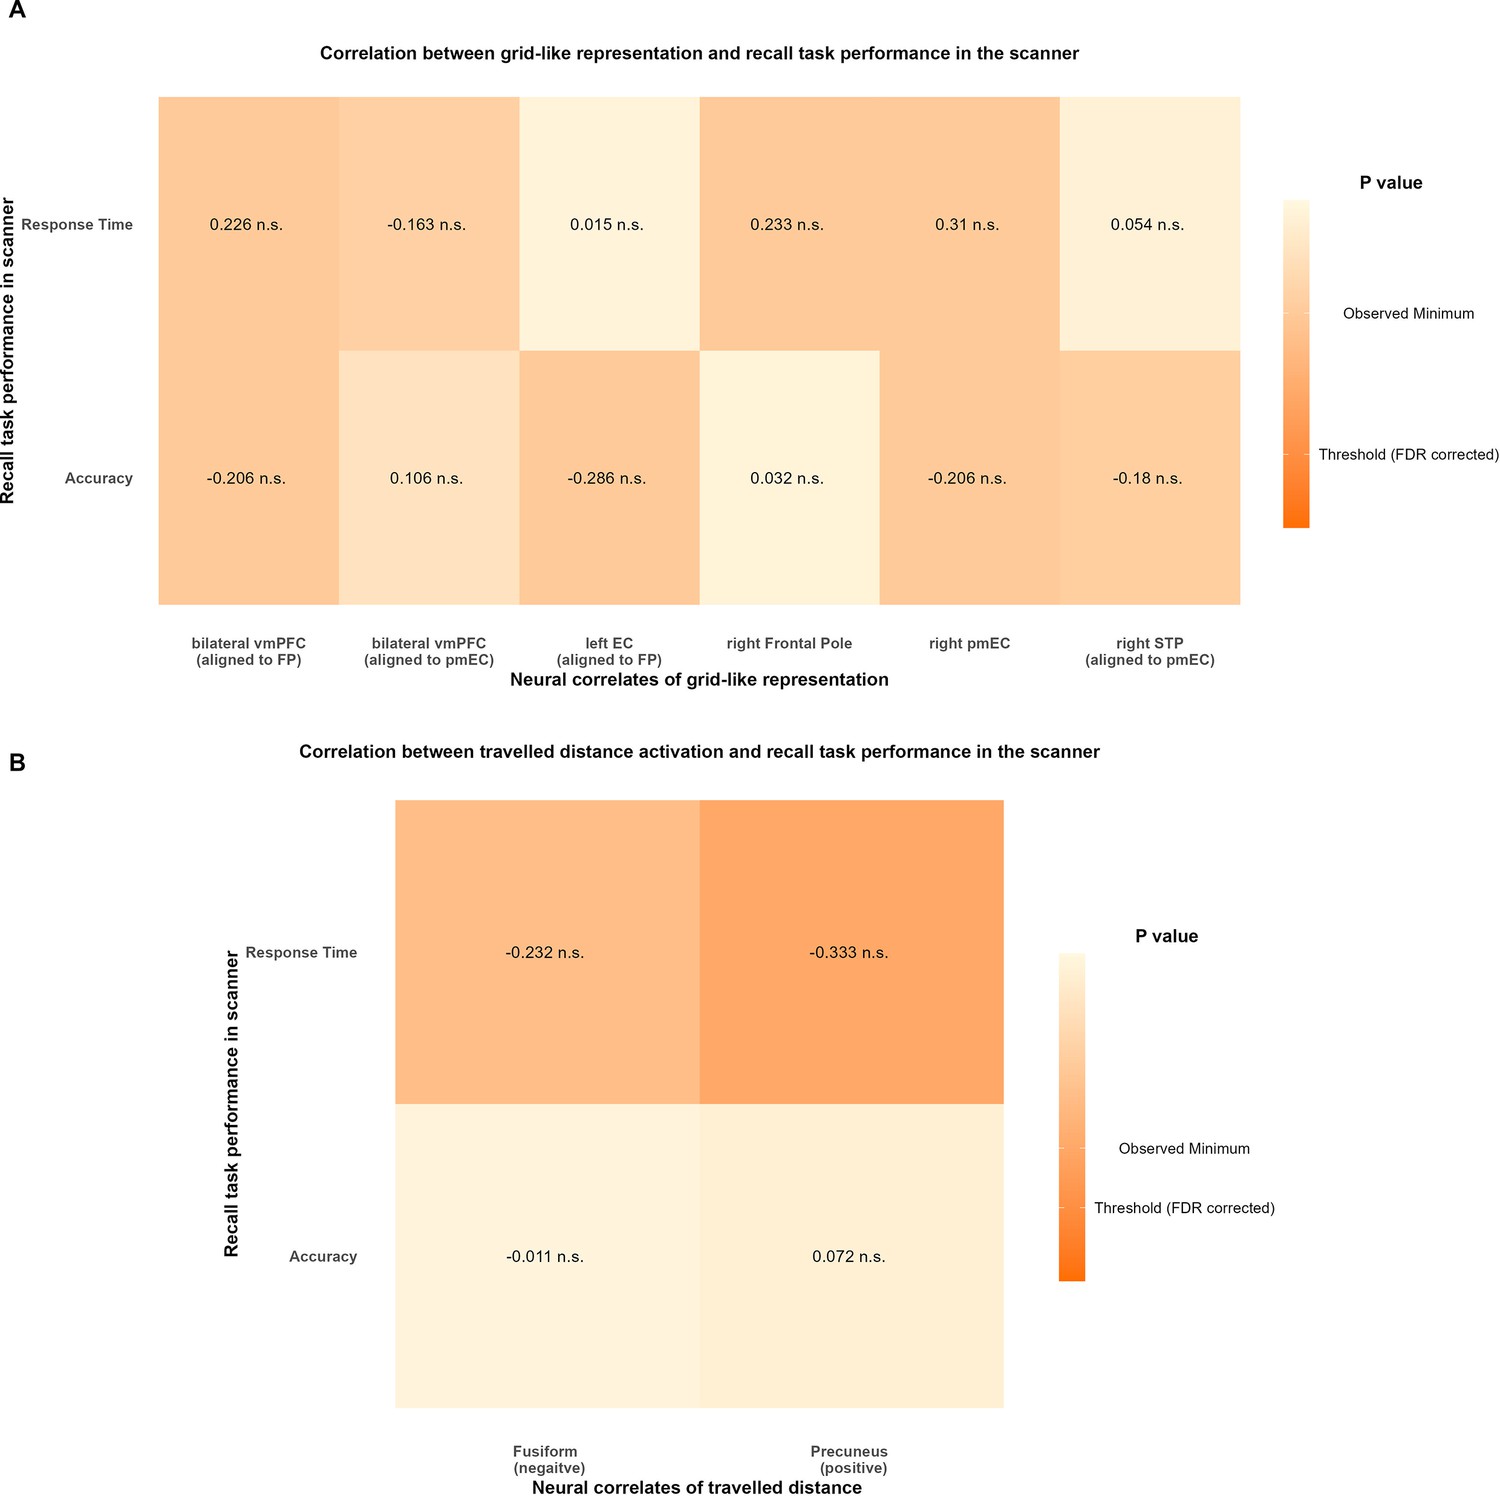
No evidence of correlation between grid-like (A) and distance (B) representation and performance in the scanner.
The number in each grid indicates Pearson correlation coefficient between a pair of behavioral and neural variable, and color indicates p-value result from statistical test (false discovery rate [FDR]-corrected).
Author response image 1
Author response image 2
Tables
Table 1
Related to Figure 1H.
| A. Linear mixed effect model for different rating items | |||||
|---|---|---|---|---|---|
| Competence | Trustworthiness | Attractiveness | |||
| (Intercept) | 5.157 *** [4.775, 5.539] | 5.614 *** [5.276, 5.951] | 4.590 *** [4.168, 5.011] | ||
| Post vs pre | –2.173 *** [–2.707, –1.639] | –1.998 *** [-2.469,–1.527] | –0.828 ** [–1.364, –0.292] | ||
| Avatar | –0.395 [–1.024, 0.234] | –0.637 * [–1.240, –0.034] | –0.281 [–0.710, 0.149] | ||
| avatar * (post vs pre) | 4.812 *** [3.923, 5.702] | 5.185 *** [4.333, 6.038] | 1.964 *** [1.357, 2.572] | ||
| N (observation) | 456 | 456 | 456 | ||
| N (id) | 38 | 38 | 38 | ||
| AIC | 1600.834 | 1589.456 | 1808.221 | ||
| BIC | 1625.569 | 1614.191 | 1832.956 | ||
| R2 (fixed) | 0.302 | 0.337 | 0.129 | ||
| R2 (total) | 0.313 | 0.347 | 0.223 | ||
| B. Follow-up analysis of interaction term in mixed effect models: simple slope of avatars in different sessions | |||||
| Rating item | Moderator levels session | Estimate [lower CI, upper CI] | SE | t (415) | p |
| Competence | Pre-experiment | –0.395 [-1.026, 0.236] | 0.321 | –1.231 | 0.89 |
| Post-experiment | 4.417 [3.786, 5.048] | 0.321 | 13.766 | <0.001 | |
| Trustworthiness | Pre-experiment | –0.637 [-1.241, 0.032] | 0.308 | –2.069 | 0.98 |
| Post-experiment | 4.549 [3.944, 5.154] | 0.308 | 14.787 | <0.001 | |
| Attractiveness | Pre-experiment | –0.281 [-0.711, 0.150] | 0.219 | –1.281 | 0.9 |
| Post-experiment | 1.684 [1.253, 2.114] | 0.219 | 7.684 | <0.001 | |
-
Statistic results for right-sided t-test against zero (noninferiority).
-
AIC=Akaike Information Criterion;MNI=Montreal Neurological Institute;ACC=Anterior Cingulate Cortex;FWE=Family Wise Error;DMN=Default Mode Network,SAD=Social Anxiety Disorder;BIC=Bayesian Information Criterion.
-
*p<0.05; **p<0.01; ***p<0.001.
Table 2
Related to Figure 2.
Neural codes represent traveled distance on the social value map.
| Anatomical description | Hemisphere | Peak MNI coordinates | Peak t-value | Cluster | |||
|---|---|---|---|---|---|---|---|
| x | y | z | Size | pFWE | |||
| A. Regions positively correlated with traveled distance | |||||||
| Precuneus | R | 12 | –56 | 26 | 4.53 | 151 | 0.054 |
| Precuneus | L | –12 | –54 | 18 | 4.952 | 134 | 0.082 |
| B. Regions negatively correlated with traveled distance | |||||||
| Fusiform | R | 36 | –48 | 20 | 4.53 | 766 | <0.001 |
| Fusiform | L | –38 | –56 | –10 | 4.952 | 234 | 0.008 |
| Middle occipital gyrus | R | 42 | –80 | 8 | 4.952 | 196 | 0.018 |
-
L, left; R, right.
Table 3
Regions showing hexagonal modulation (GLM1).
| Anatomical description | Hemisphere | Peak coordinates (MNI) | Peakt-value | Cluster | |||
|---|---|---|---|---|---|---|---|
| x | y | z | Size | pFWE | |||
| Superior parietal gyrus | R | 28 | –66 | 56 | 5.021 | 522 | <0.001 |
| Precuneus | L | -6 | –46 | 38 | 5.707 | 426 | <0.001 |
| Middle frontal gyrus | R | 42 | 24 | 34 | 5.221 | 271 | <0.001 |
| Paracentral Lobule | R | 10 | –36 | 68 | 4.835 | 120 | <0.001 |
| Middle frontal gyrus | R | 38 | 42 | 30 | 4.849 | 103 | 0.001 |
| Frontal pole | L | –26 | 50 | 0 | 4.269 | 71 | 0.014 |
| Frontal pole | R | 26 | 52 | -2 | 4.494 | 69 | 0.017 |
| Angular | L | –52 | –60 | 26 | 4.718 | 58 | 0.041 |
-
L, left; R, right.
Table 4
Related to Figure 3—figure supplement 5C.
Group-level Wilcoxon signed-rank test of correlation between voxel-wise temporal signal-to-noise ratio (tSNR) and the Z-statistics of hexagonal modulation effect in frontal pole and entorhinal regions of interest (ROIs).
| ROIs | N | Test statistics | p |
|---|---|---|---|
| Right frontal pole | 38 | 268.000 | 0.140 |
| Left anterior–lateral entorhinal cortex | 38 | 331.000 | 0.572 |
| Right anterior–lateral entorhinal cortex | 38 | 415.000 | 0.528 |
| Left posterior–medial entorhinal cortex | 38 | 396.500 | 0.712 |
| Right posterior–medial entorhinal cortex | 38 | 433.000 | 0.369 |
Additional files
Download links
A two-part list of links to download the article, or parts of the article, in various formats.
Downloads (link to download the article as PDF)
Open citations (links to open the citations from this article in various online reference manager services)
Cite this article (links to download the citations from this article in formats compatible with various reference manager tools)
Distance and grid-like codes support the navigation of abstract social space in the human brain
eLife 12:RP89025.
https://doi.org/10.7554/eLife.89025.4


