Reward contingency gates selective cholinergic suppression of amygdala neurons
- The Picower Institute for Learning and Memory, Department of Brain and Cognitive Sciences, Massachusetts Institute of Technology, United States
- Department of Neurology, Northwestern University, United States
- The Department of Neuroscience, Developmental, and Regenerative Biology, Neuroscience Institute & Brain Health Consortium, University of Texas at San Antonio, United States
- Vanderbilt Center for Addiction Research, Department of Pharmacology, Vanderbilt University, United States
- Coulter Department of Biomedical Engineering, Georgia Tech & Emory University, United States
- Chinese Institute for Brain Research, China
- State Key Laboratory of Membrane Biology, Peking University School of Life Sciences; PKUIDG/McGovern Institute for Brain Research; Peking-Tsinghua Center for Life Sciences, China
- Eaton-Peabody Laboratories, Massachusetts Eye and Ear, United States
- Department of Otolaryngology – Head and Neck Surgery, Harvard Medical School, United States
- HHMI Investigator, Member of the Kavli Institute for Brain and Mind, and Wylie Vale Professor at the Salk Institute for Biological Studies, United States
Figures
Figure 1 with 4 supplements
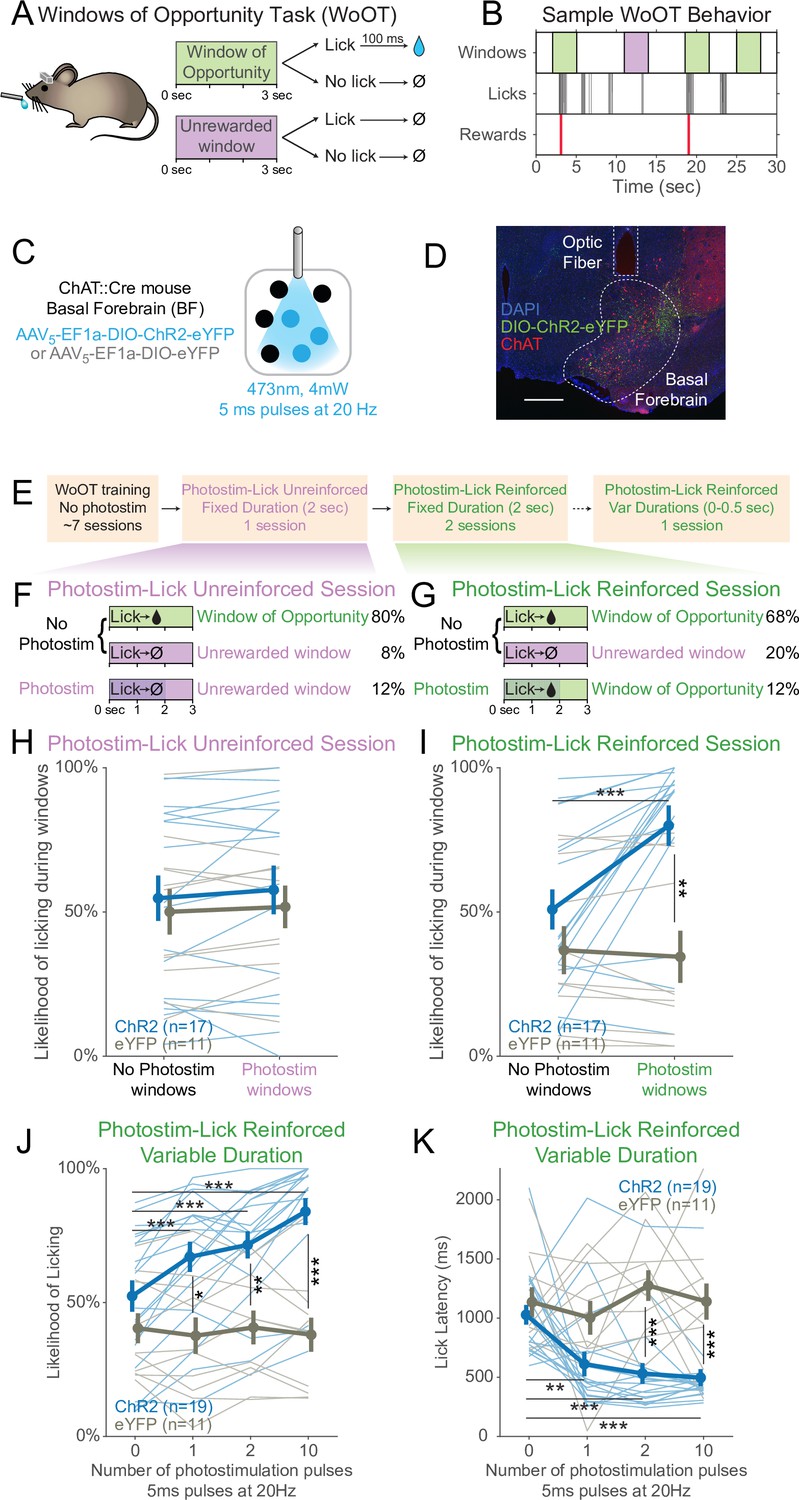
Photostimulation of basal forebrain cholinergic neurons promotes conditioned responding when associated with the opportunity to collect rewards.
(A) Window of Opportunity Task (WoOT) to study conditioned responding in the absence of discrete cues. Mice were trained prior to any photostimulation, using an operant, variable-interval reinforcement schedule with limited hold (Ferster and Skinner, 1957). Sessions were divided into trials of 3 s Windows of Opportunity, with variable intertrial intervals (ITIs). Rewards were only delivered if mice licked during an unsignaled Window of Opportunity (green; 90% of trial windows). We also included a subset of Unrewarded Windows, on which, even if the mouse licked, reward would not be delivered (purple; 10% of trial windows), similar to intervening ITIs (white). Because windows were not discretely cued and occurred after variable ITIs, mice did not know when they initiated a lick whether it would be rewarded. (B) Sample WoOT behavior. If a mouse licked during an uncued Windows of Opportunity (green), then reward was delivered. But if a mouse licked during an uncued Unrewarded Window (purple) or during the ITI (white), reward was not delivered. reward delivery. The use of Unrewarded Windows (purple) allowed us to investigate behavior during epochs temporally matched to Windows of Opportunity (green). Training mice in this manner conditioned them to lick the spout with a relatively stable pattern of intermittent lick bouts (Figure 1—figure supplement 1). (C) Optogenetic strategy to photostimulate cholinergic basal forebrain neurons, by driving Cre-dependent expression of Channelrhodopsin-2 (ChR2) or a control fluorophore (eYFP) in mice expressing Cre-recombinase under control of the choline acetyltransferase promoter (ChAT::Cre). The photostimulation parameters displayed were used in later behavioral sessions. (D) Sample histology of fiber placement over cholinergic neurons in the posterior portion of the basal forebrain, the sublenticular substantia innominata/extended amygdala. Blue = DAPI nucleic acid staining, green = Cre-dependent expression of ChR2 fused to eYFP, red = anti-ChAT immunohistochemical staining. AP coordinate = –0.46. Scale bar = 500 microns. See also Figure S1A and B. (E) Behavioral training and testing sessions. After early WoOT training without any photostimulation, mice subsequently received testing during a Photostim-Unreinforced or Photostim-Reinforced sessions. (F) Photostim-Unreinforced session. In addition to no photostimulation Windows of Opportunity (green, 80%) and Unrewarded Windows (purple, 8%), mice received 2 s of photostimulation (blue lines) during a subset of Unrewarded Windows (purple, 12%) to study innate responses to photostimulation. (G) Photostim-Reinforced session. Conversely to Photostim-Unreinforced sessions, during Photostim-Reinforced sessions, photostimulation (blue lines) was delivered during a subset of Windows of Opportunity (green, 12%), during which, if mice licked, they would receive a reward. Mice still had many more Windows of Opportunity with no photostimulation (68%). (H, I) The likelihood of licking depended on an interaction of Virus, Photostimulation Window type, and Photostim-Reinforcement Session type (linear mixed effects model, F1,78 = 5.26, p=0.025). Thin lines represent data from all individual mice, pooled data are represented as mean ± SEM. During the Photostim-Unreinforced session (H), there was no significant difference between ChR2 (blue) and eYFP (gray) groups, regardless of photostimulation window type. However, during the Photostim-Reinforced session (I), ChR2 mice licked significantly more during Photostim windows than No Photostim windows (post hoc tests with Sidak correction for multiple comparisons: ***p<0.0001). ChR2 mice also licked significantly more than eYFP mice during Photostim windows during Photostim-Reinforced sessions (**p=0.001). There were no detectable effects of photostimulation on licking in eYFP mice, and no detectable differences in licking on no photostimulation windows between ChR2 and eYFP mice (all other post hoc comparisons p>0.10). (J) We initially photostimulated with a fixed duration, but in a follow-up session photostimulated with varied durations (0–0.5 s, using different number of pulses at the same frequency/duty cycle). The likelihood of licking depended on an interaction of Virus and the number of photostimulation pulses (linear mixed effects model, F3,84 = 16.22, p=2.1 × 10⁻⁸). ChR2 mice licked significantly more on windows with 1, 2, or 10 pulses than windows without photostimulation, and more than eYFP mice with any number of pulses (post hoc tests with Sidak correction for multiple comparisons: *p=0.015, **p=0.0095, ***p<0.001; all other post hoc comparisons p>0.10). (K) When tested with different durations of photostimulation, the latency of the first lick depended on an interaction of Virus and the number of photostimulation pulses (linear mixed effects model, F3,84 = 4.53, p=0.005). ChR2 mice licked significantly sooner on windows with 1, 2, or 10 pulses than windows without photostimulation, and sooner than eYFP mice for 2 and 10 pulses (post hoc tests with Sidak correction for multiple comparisons: **p=0.0047, ***p<0.001; all other post hoc comparisons p>0.10).
-
Figure 1—source data 1
The likelihood of licking during (or outside of) the photostim windows during the Photostim-Unreinforced session, as shown in Figure 1H.
- https://cdn.elifesciences.org/articles/89093/elife-89093-fig1-data1-v1.zip
-
Figure 1—source data 2
The likelihood of licking during (or outside of) the photstim windows during the Photostim-Reinforced session, as shown in Figure 1I.
- https://cdn.elifesciences.org/articles/89093/elife-89093-fig1-data2-v1.zip
-
Figure 1—source data 3
The likelihood of licking based on the number of photostimulation pulses during the Photostim-Reinforced Variable Duration, as shown in Figure 1J.
- https://cdn.elifesciences.org/articles/89093/elife-89093-fig1-data3-v1.zip
-
Figure 1—source data 4
The lick latency based on the number of photostimulation pulses during the Photostim-Reinforced Variable Duration, as shown in Figure 1K.
- https://cdn.elifesciences.org/articles/89093/elife-89093-fig1-data4-v1.zip
Figure 1—figure supplement 1
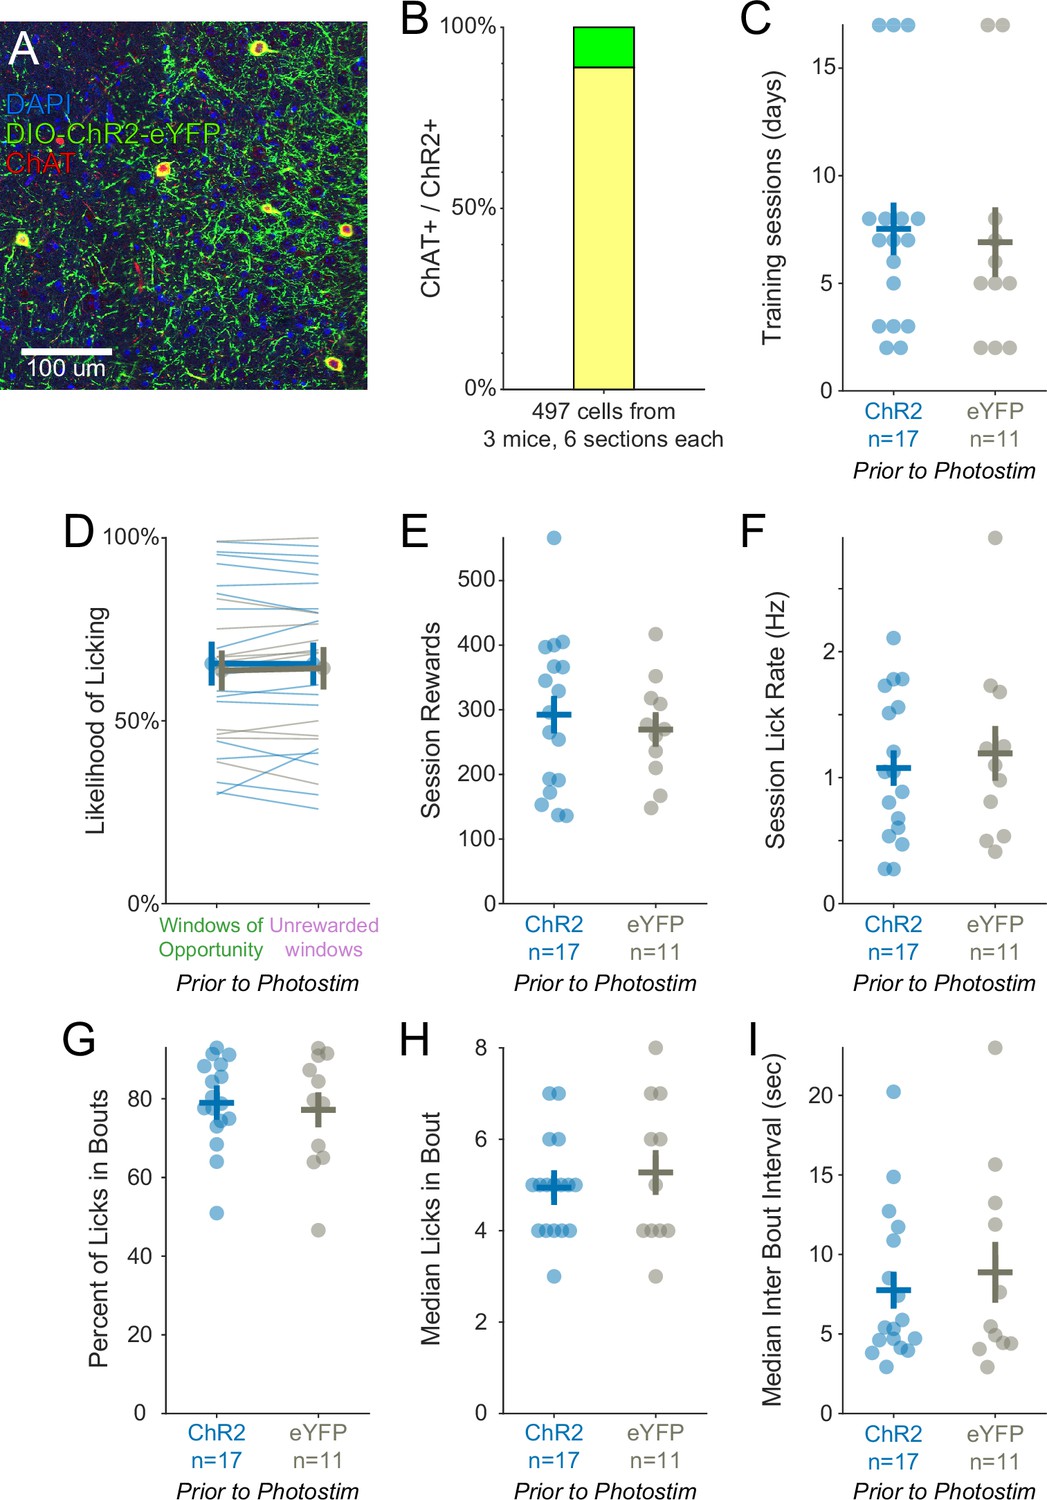
Training history was similar for optogenetic experimental ChR2 mice and control eYFP mice.
(A) Histological evaluation of basal forebrain tissue. Blue = DAPI nucleic acid staining, green = Cre-dependent expression of ChR2-eYFP, red = anti-ChAT immunohistochemical staining. Yellow overlap indicates ChAT+ cells expressing ChR2-eYFP. (B) Validation of ChR2 expression in ChAT::Cre neurons. 88.9% of ChR2 expressing cells were also immunoreactive for ChAT (442/497 cells, 18 total sections from three mice). (C) After surgery, mice were trained on the Window of Opportunity Task (WoOT) prior to any photostimulation, until they attempted to collect rewards on at least 30% of uncued Windows of Opportunity. The number of training sessions to reach this criterion was similar for ChR2 and eYFP mice (ChR2: n = 17 mice, 7.53 ± 1.22 sessions; eYFP: n = 11 mice, 7.00 ± 1.61 sessions; rank-sum p=0.49). Pooled data are represented as mean (horizontal lines) ± SEM (vertical lines) in this and all subsequent panels, all of which represent training after surgery but prior to any photostimulation. (D) On the WoOT training session on which mice met criterion prior to any photostimulation, ChR2 and eYFP mice were similarly likely to lick on unsignaled Windows of Opportunity as on Unrewarded Windows, confirming that mice could not predict reward delivery prior to licking (Figure 1C; linear mixed effects model: effect of Virus p=0.859, effect of Window of Opportunity type p=0.744, interaction between Virus * Window p=0.652). (E) The number of rewards earned in a session was similar between both groups of mice (ChR2: 292.47 ± 29.08 rewards; eYFP: 269.45 ± 23.85 rewards; rank-sum p=0.71). (F) Session mean licking rates were similar between both groups of mice (ChR2: 1.08 ± 0.14 licks/s; eYFP: 1.19 ± 0.22 licks/s; rank-sum p=0.81). (G) The majority of licks occurred within bouts, defined as at least three licks with inter-lick intervals of ≤0.3 s. The percentages of licks in bouts were similar between both groups of mice (ChR2: 79 ± 3%; eYFP: 77 ± 4%; rank-sum p=0.96). (H) The median numbers of licks in a bout were similar between both groups of mice (ChR2: 4.94 ± 0.26 licks/bout; eYFP: 5.27 ± 0.49 licks/bout; rank-sum p=0.73). (I) The median intervals between bouts were similar between both groups of mice (ChR2: 7.75 ± 1.16 s; eYFP: 8.87 ± 1.91 s; rank-sum p=0.78).
-
Figure 1—figure supplement 1—source data 1
The number of training sessions in days prior to photo-stimulation, as shown in Figure 1—figure supplement 1C.
- https://cdn.elifesciences.org/articles/89093/elife-89093-fig1-figsupp1-data1-v1.zip
-
Figure 1—figure supplement 1—source data 2
The likelihood of licking prior to photo-stimulation, as shown in Figure 1—figure supplement 1D.
- https://cdn.elifesciences.org/articles/89093/elife-89093-fig1-figsupp1-data2-v1.zip
-
Figure 1—figure supplement 1—source data 3
The number of rewards earned in a session, prior to photo-stimulation, as shown in Figure 1—figure supplement 1E.
- https://cdn.elifesciences.org/articles/89093/elife-89093-fig1-figsupp1-data3-v1.zip
-
Figure 1—figure supplement 1—source data 4
The session licking rate for each animal, prior to photo-stimulation, as shown in Figure 1—figure supplement 1F.
- https://cdn.elifesciences.org/articles/89093/elife-89093-fig1-figsupp1-data4-v1.zip
-
Figure 1—figure supplement 1—source data 5
The percent lick per bout for each animal, prior to photo-stimulation, as shown in Figure 1—figure supplement 1G.
- https://cdn.elifesciences.org/articles/89093/elife-89093-fig1-figsupp1-data5-v1.zip
-
Figure 1—figure supplement 1—source data 6
The median number of licks per bout for each animal, prior to photo-stimulation, as shown in Figure 1—figure supplement 1H.
- https://cdn.elifesciences.org/articles/89093/elife-89093-fig1-figsupp1-data6-v1.zip
-
Figure 1—figure supplement 1—source data 7
The median inter bout interval in seconds for each animal, prior to photo-stimulation, as shown in Figure 1—figure supplement 1I.
- https://cdn.elifesciences.org/articles/89093/elife-89093-fig1-figsupp1-data7-v1.zip
Figure 1—figure supplement 2
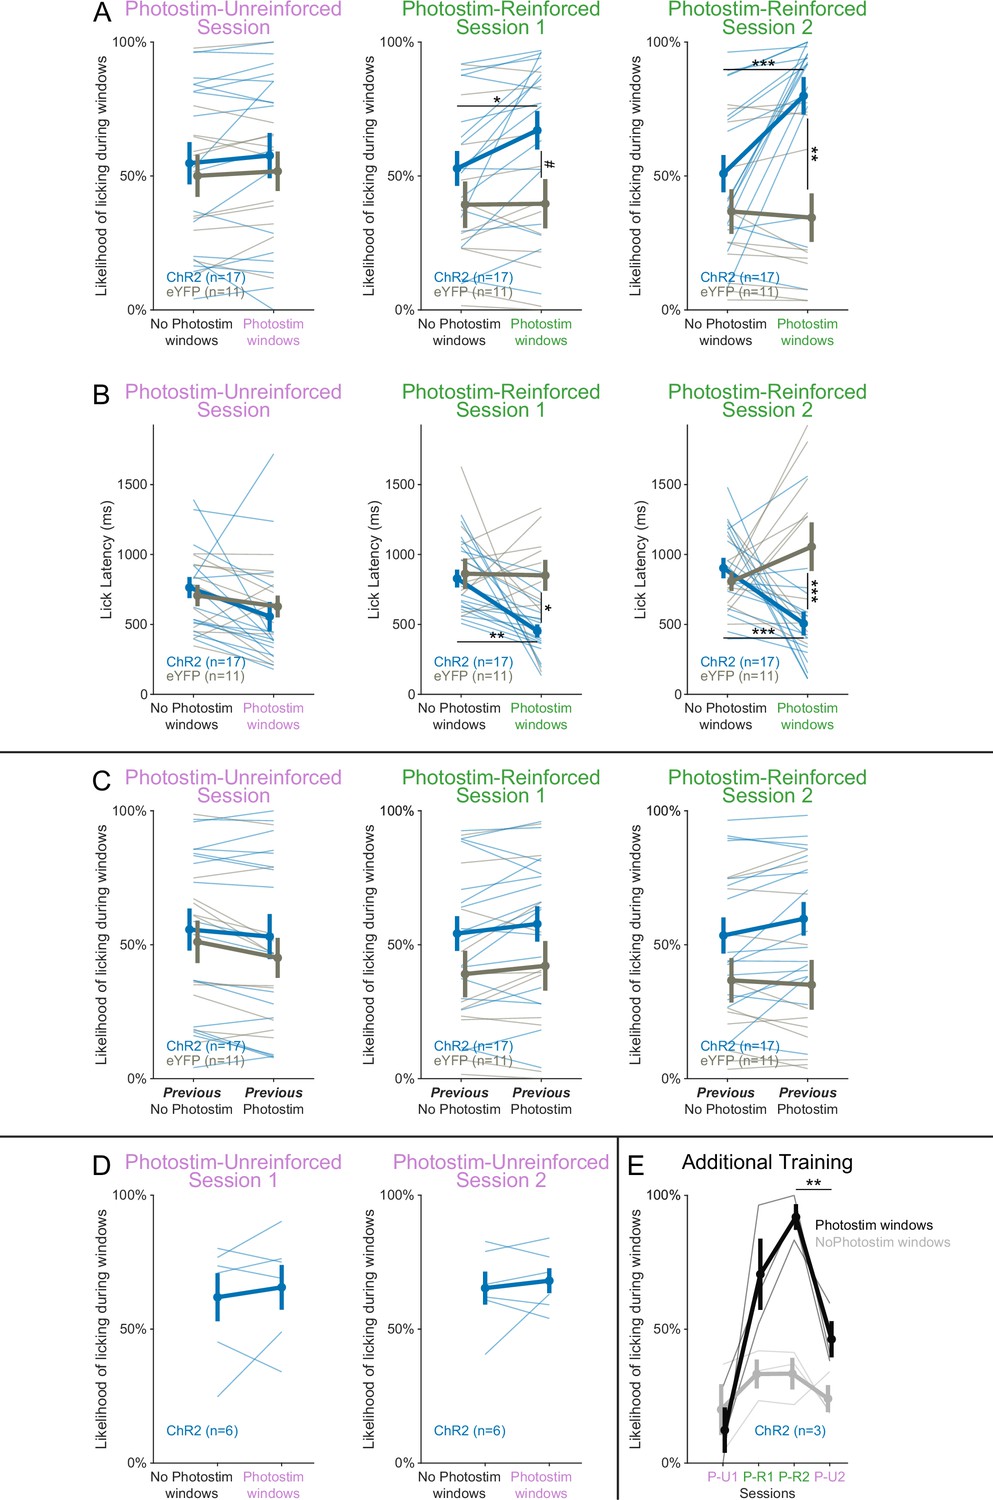
Responses across the Windows of Opportunity Task (WoOT) photostimulation testing sessions.
(A) The likelihood of licking depended on an interaction of Virus, Photostimulation Window type, and Session (linear mixed effects model, F2,130 = 3.34, p=0.038). Thin lines represent data from all individual mice, pooled data are represented as mean ± SEM. During the Photostim-Unreinforced session, there was no significant difference between ChR2 (blue) and eYFP (gray) mice, regardless of photostimulation window type. However, during the Photostim-Reinforced sessions, ChR2 mice started to lick more during Photostim windows than No Photostim windows. ChR2 mice also began to trend to lick more over sessions during Photostim windows than eYFP mice (post hoc tests with Sidak correction for multiple comparisons: #p<0.10, *p<0.05, **p<0.01, ***p<0.001). There were no detectable effects of photostimulation on licking in eYFP mice, and no detectable differences in licking on No Photostim windows between ChR2 and eYFP mice (all other post hoc comparisons p>0.10). (B) Lick latencies depended on an interaction of Virus and Photostimulation window (linear mixed effects model, F1,128 = 15.20, p=0.0002). During the Photostim-Unreinforced session, there was no significant difference between ChR2 (blue) and eYFP (gray) mice, regardless of photostimulation window type. However, during the Photostim-Reinforced sessions, ChR2 mice licked with significantly shorter latencies during Photostim windows than No Photostim windows. ChR2 mice also licked with significantly shorter latencies than eYFP mice during Photostim windows (post hoc tests with Sidak correction for multiple comparisons: *p<0.05, **p<0.01, ***p<0.001). There were no detectable effects of photostimulation on lick latencies in eYFP mice, and no detectable differences in lick latencies on No Photostim windows between ChR2 and eYFP mice (all other post hoc comparisons p>0.10). (C) Photostimulation on a previous trial did not affect the likelihood of licking in a subsequent window. In this panel, trials are split based on whether animals received photostimulation on the previous trial. There was no significant interaction between Virus, previous photostimulation, and Session (linear mixed effects model, F2,130 = 0.33, p=0.717). (D) An additional Photostim-Unreinforced session did not lead to increased licking during photostimulation windows (n = 6 ChR2 mice). There were no significant main effects of Photostimulation window (linear mixed effects model, F1,15 = 0.431, p=0.521), Session (F1,15 = 0.359, p=0.558), or an interaction between them (F1,15 = 0.009, p=0.926). (E) An additional Photostim-Unreinforced (P-U2) session after Photostim-Reinforced (P-R 1&2) training led to decreased licking during photostimulation windows (n = 3 ChR2 mice). In all three mice, response rates from the Photostim-Reinforced 2 (P-R2) session decreased during a subsequent Photostim-Unreinforced session (P-U2, paired t-test p=0.005), suggesting that the association between photostimulation and reinforcement remained plastic.
-
Figure 1—figure supplement 2—source data 1
The likelihood of licking during the three sessions, as shown in Figure 1—figure supplement 2A.
- https://cdn.elifesciences.org/articles/89093/elife-89093-fig1-figsupp2-data1-v1.zip
-
Figure 1—figure supplement 2—source data 2
The lick latencies during the three sessions, as shown in Figure 1—figure supplement 2B.
- https://cdn.elifesciences.org/articles/89093/elife-89093-fig1-figsupp2-data2-v1.zip
-
Figure 1—figure supplement 2—source data 3
The likelihood of licking based on photostim on a previous trial during the different sessions, as shown in Figure 1—figure supplement 2C.
- https://cdn.elifesciences.org/articles/89093/elife-89093-fig1-figsupp2-data3-v1.zip
-
Figure 1—figure supplement 2—source data 4
The likelihood of licking based on including an additional Photostim-Unreinforced session, as shown in Figure 1—figure supplement 2D.
- https://cdn.elifesciences.org/articles/89093/elife-89093-fig1-figsupp2-data4-v1.zip
-
Figure 1—figure supplement 2—source data 5
The likelihood of licking based on including an additional Photostim-Unreinforced session after Photostim-Reinforced training, as shown in Figure 1—figure supplement 2E.
- https://cdn.elifesciences.org/articles/89093/elife-89093-fig1-figsupp2-data5-v1.zip
Figure 1—figure supplement 3
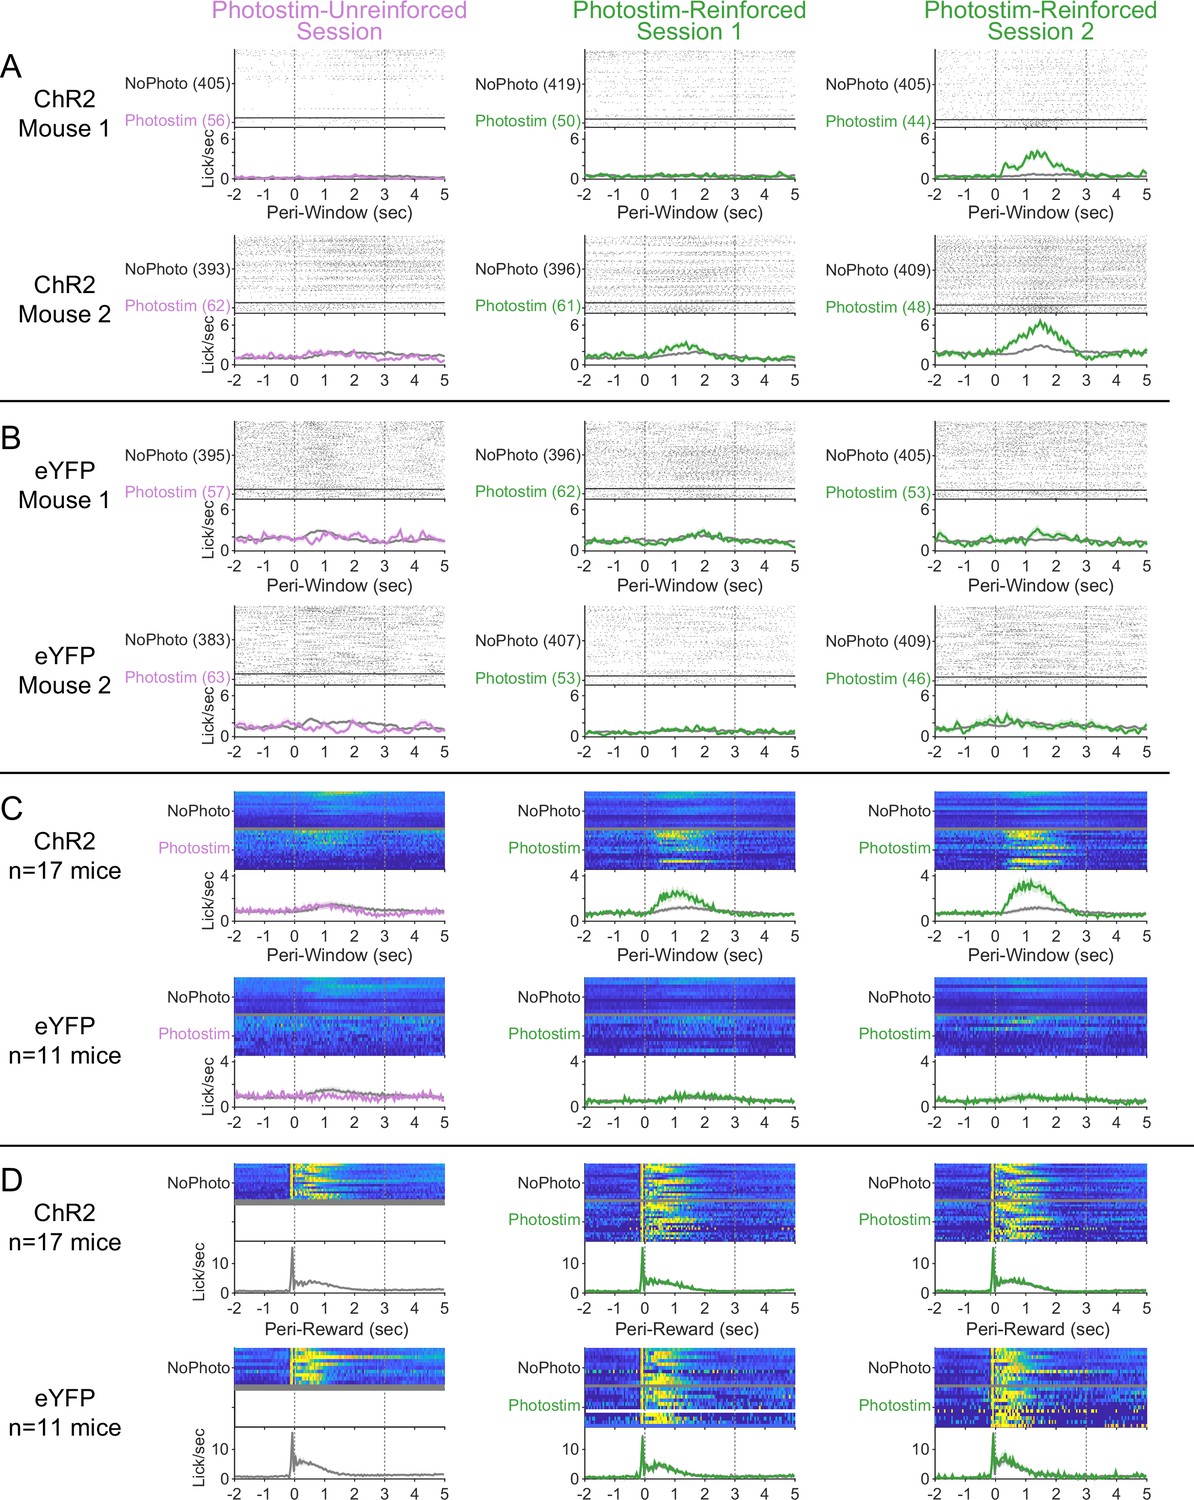
Peri-event licking across the Windows of Opportunity Task (WoOT) photostimulation testing sessions.
(A) Detailed licking profiles of two individual ChR2 mice along all three sessions of the WoOT photostimulation assay process. For photostimulation trials, the laser was turned on from 0 to 2 s. Summary plots depict mean ± SEM for all panels. (B) Detailed licking profiles of two individual eYFP mice along all three sessions of the WoOT photostimulation assay process. (C) For all mice across all sessions, licking is presented synchronized to the times of WoOT windows (Peri-Window). Each row depicts stratified results by viral group, and colors depict whether trials involved photostimulation. (D) For each mouse for each session, licking is presented synchronized to reward onset (Peri-Reward), stratified by viral group (row) and whether the trial involved photostimulation (color). There were not any photostimulation trials around the time of reward for the Photostim-Unreinforced sessions, since photostimulation was only delivered when reward could not be obtained. Across subsequent sessions, there was no clear effect of photostimulation on licking or reward consumption behavior in either ChR2 (n = 17) or eYFP (n = 11) mice.
Figure 1—figure supplement 4
Photostimulation of basal forebrain cholinergic neurons increases arousal, but does not increase unconditioned movement and is not inherently reinforcing.
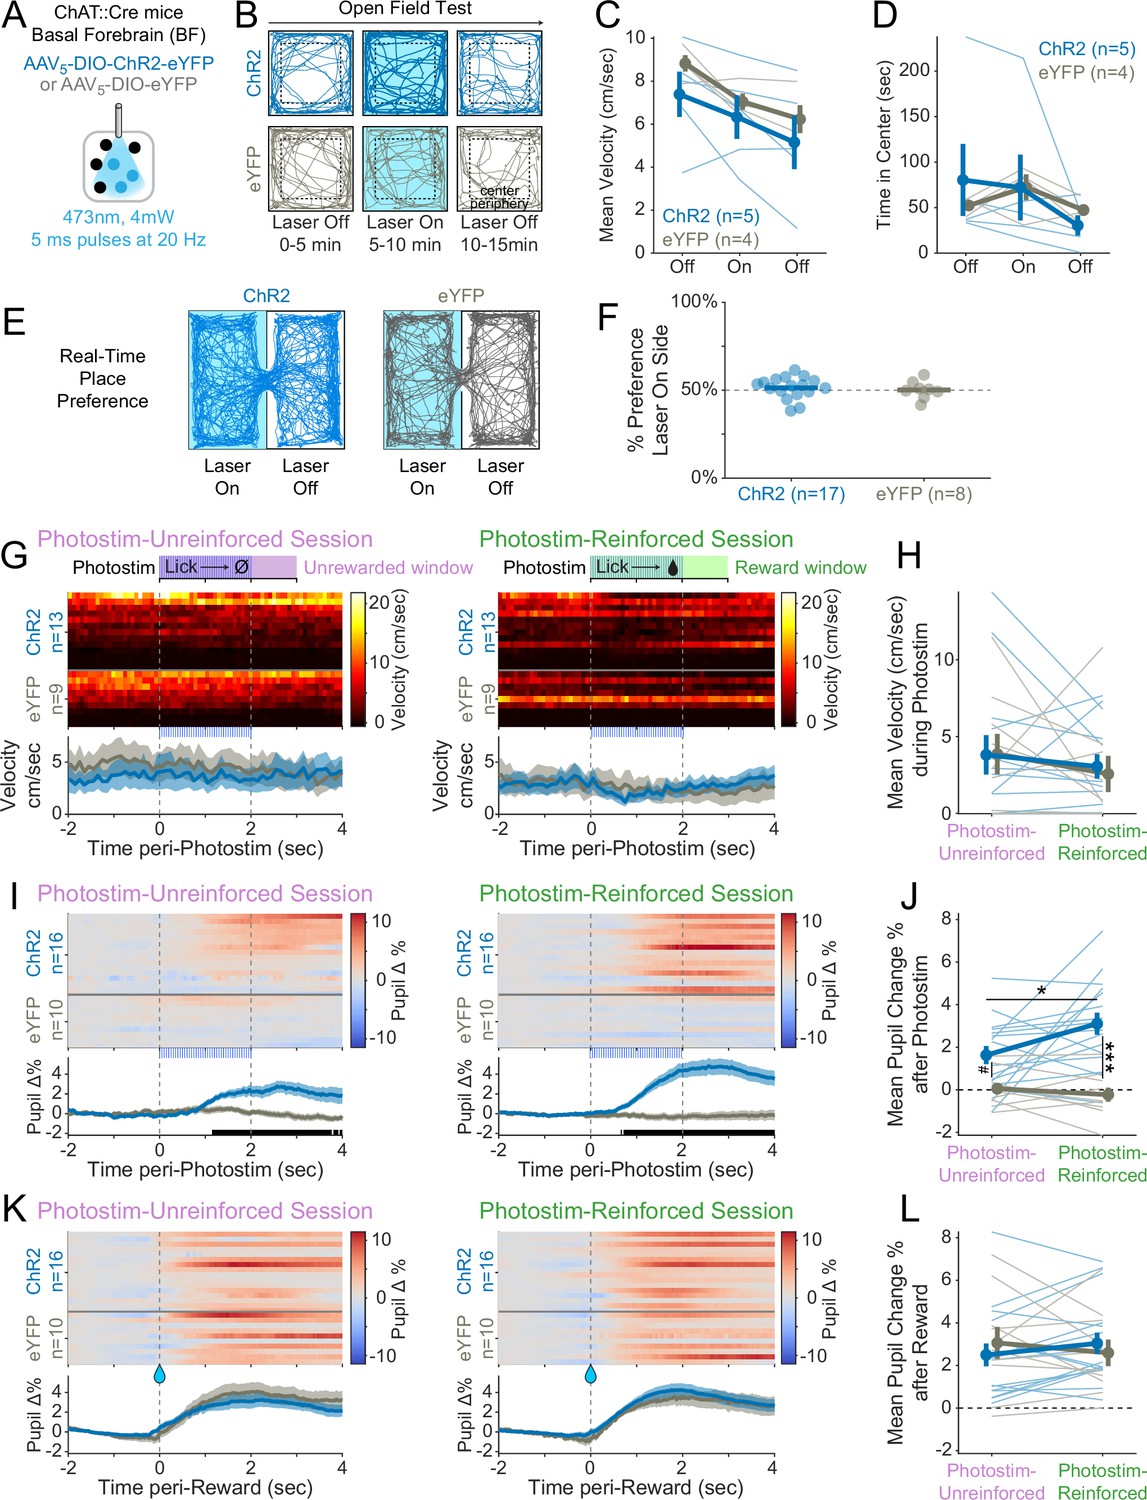
(A) Optogenetic strategy for photostimulation of basal forebrain cholinergic (ChAT::Cre) neurons. The same photostimulation parameters (473 nm, 4 mW, 5 ms pulses at 20 Hz) were used for all ChR2 and eYFP experiments. (B) Open-field test protocol. Mice explored an open chamber for three contiguous windows, during which photostimulation was off for 5 min, then on for 5 min, then off again for the last 5 min. Example tracks are shown for a ChR2 mouse (dark blue, top row) and an eYFP mouse (gray, bottom row). (C) Basal forebrain cholinergic photostimulation did not increase mouse locomotor movement in an open field (linear mixed effects model: effect of Time F1,15 = 19.18, ***p<0.0001; effect of Virus F1,7.26 = 0.71, p=0.43; effect of Photostim F1,15 = 0.20, p=0.66; interaction between Virus and Photostim F1,15 = 0.33, p=0.58). (D) Photostimulation of cholinergic basal forebrain neurons did not modify innate locomotor preference, as measured by time spent in the center of the open field (linear mixed effects model: effect of Time F1,15 = 2.90, p=0.11; effect of Virus F1,7.39 = 0.01, p=0.94; effect of Photostim F1,15 = 1.64, p=0.22; interaction between Virus and Photostim F1,15 = 0.04, p=0.85). (E) Real-time place preference (RTPP) assay. When mice entered the Laser On zone, photostimulation was activated for the duration of the time spent in the On zone. When mice entered the Laser Off zone, photostimulation was terminated for the duration of time spent in the Off zone. (F) Neither ChR2 nor eYFP mice preferred the chamber side paired with photostimulation (averaged results of two counterbalanced sessions for each mouse, t-test ChR2 t16 = 0.94, p=0.36; eYFP t7 = 0.08, p=0.94), suggesting that photostimulation of cholinergic basal forebrain neurons was not inherently reinforcing. (G) We trained a subset of mice to perform the Window of Opportunity Task (WoOT) while on a treadmill to measure unconditioned, spontaneous locomotion during photostimulation. Heat maps: mean velocity for each mouse on photostimulation trials in 10 ms bins. Data are stratified by Virus group and sorted by mean velocity during the Photostim-Unreinforced session. Bottom panels: pooled data are displayed as mean ± SEM. There was no significant difference in locomotion around photostimulation between the ChR2 and eYFP groups during either the Photostim-Unreinforced or Photostim-Reinforced sessions (no 10 ms bins were significantly different between groups on either day, rank-sum p<0.05, uncorrected). (H) Mean velocity on the treadmill during photostimulation (0–2 s) for Photostim-Unreinforced (left) and Photostim-Reinforced (right) sessions did not differ between groups or by sessions (linear mixed effects model: Virus * Session F1,20 = 0.09, p=0.769; effect of Virus F1,37 = 0.02, p=0.887; effect of Session F1,20 = 1.26, p=0.275). (I) We measured pupil diameter in a subset of mice as an index of arousal. Heat maps: mean change in pupil diameter across laser trials for each mouse for the Photostim-Unreinforced session (left) and Photostim-Reinforced session (right). Data are normalized to baseline pupil diameter –2 to –1 s before photostimulation, and sorted by mean pupil diameter during the Unreinforced session. Bottom panels: pooled data are displayed as mean ± SEM (ChR2: blue, n = 16; eYFP: gray, n = 10). Black marks underneath pooled data signify frames (33.3 ms bins) during which pupil responses were different between ChR2 and eYFP (rank-sum p<0.05, uncorrected). (J) Mean change in pupil diameter after photostimulation onset (0–4 s) for Photostim-Unreinforced (left) and Photostim-Reinforced (right) sessions. Mean pupil change depended on Viral Group and Session Type (linear mixed effects model: Virus * Session F1,24 = 4.37, *p=0.047; effect of Virus F1,24 = 24.40, ***p<0.001; effect of Session F1,24 = 2.01, p=0.169). ChR2 mice had greater pupil dilation during the Photostim-Reinforced session than during their Photostim-Unreinforced session (post hoc tests with Sidak correction for multiple comparisons: *p<0.05). ChR2 mice also had greater pupil dilation than eYFP mice during the Photostim-Reinforced session (***p<0.001). During the Photostim-Unreinforced session, there was a trend towards a small increase in pupil dilation in ChR2 mice vs eYFP mice (#p=0.075). (K) Pupil diameter surrounding reward onset, during Photostim-Unreinforced (left) and Photostim-Reinforced (right) sessions, similar conventions as in (I), sorted in the same order as (G). There was no significant difference between ChR2 and eYFP groups for any 10 ms bin (rank-sum p<0.05, uncorrected). (L) Mean change in pupil diameter after reward onset (0–4 s) for Photostim-Unreinforced session (left) vs. Photostim-Reinforced sessions (right). Mean pupil change was independent of Viral Group and Session (linear mixed effects model: Virus * Session F1,24 = 2.43, p=0.132; effect of Virus F1,24 = 0.01, p=0.942; effect of Session F1,24 = 0.01, p=0.910). Mean pupil change across all mice was greater than 0 (linear mixed effects model: intercept 2.78%, t24 = 7.067, ***p<0.001).
-
Figure 1—figure supplement 4—source data 1
The percentage of time spent in in the laser ON side during the RTPP, as shown in Figure 1—figure supplement 4F.
- https://cdn.elifesciences.org/articles/89093/elife-89093-fig1-figsupp4-data1-v1.zip
-
Figure 1—figure supplement 4—source data 2
The mean velocities and time spent in the center of the open field test before, during and after basal forebrain cholinergic photostimulation as shown in Figure 1-figure supplement 4C, D.
- https://cdn.elifesciences.org/articles/89093/elife-89093-fig1-figsupp4-data2-v1.zip
-
Figure 1—figure supplement 4—source data 3
The mean velocities during Photostim-Unreinforced and Photostim-Reinforced sessions, as shown in Figure 1-figure supplement 4H.
- https://cdn.elifesciences.org/articles/89093/elife-89093-fig1-figsupp4-data3-v1.zip
-
Figure 1—figure supplement 4—source data 4
The percent change of the pupil after photostim, as shown in Figure 1-figure supplement 4J, L.
- https://cdn.elifesciences.org/articles/89093/elife-89093-fig1-figsupp4-data4-v1.zip
Figure 2

BFChAT:ChR2-induced conditioned responding is muscarinic receptor-dependent.
(A) Experimental strategy to test the necessity of cholinergic receptors in conditioned responding. Cholinergic neurons in the basal forebrain were photostimulated after blockade of cholinergic muscarinic or nicotinic receptors using intraperitoneal injection of pharmacologic antagonists. (B) Modification of Window of Opportunity Task (WoOT) to include additional tone conditioned responses. To provide additional within-subject controls for pharmacological testing, mice could now receive rewards on either of two separate types of Windows of Opportunity: with tones (top row) or with photostimulation (middle row, both 2 s duration). Licks during unsignaled, Unrewarded Windows were recorded but had no consequence (bottom row). (C) Photostim-induced licking was abolished by systemic muscarinic receptor antagonist administration. Linear mixed effects modeling confirmed that licking depended upon an interaction between Virus group, Stimulus type, and Drug session (F3,363 = 4.61, p=0.0002). Thin lines represent data from individual mice, pooled data are displayed as mean ± SEM. Saline: both ChR2 and eYFP mice responded more during Tone Windows of Opportunity than during unsignaled, Unrewarded Windows (Unrwd) (***p<0.001, *p<0.05, #p=0.10, Sidak post hoc multiple comparisons). However, only ChR2 mice responded more during Photostimulation Windows of Opportunity than during unsignaled, Unrewarded Windows, at a similar likelihood as their responses during tone Windows of Opportunity. Scopolamine 0.3 mg/kg: ChR2 mice now responded less during photostimulation than during tones. Scopolamine 1 mg/kg: ChR2 mice no longer responded more during photostimulation than during Unrewarded Windows, and no longer responded more during photostimulation than eYFP mice, although they continued to respond more during tones than intertrial intervals (ITIs). Mecamylamine 1 mg/kg: response patterns were similar to saline sessions. For each session, the likelihood of licking during Unrewarded Windows was similar between ChR2 and eYFP mice (all p>0.8). Additionally, within each group, the likelihood of licking during Unrewarded Windows was similar to saline sessions for all drug doses (all p>0.8).
-
Figure 2—source data 1
The likelihood of licking under saline and various agonist conditions and in response to different stimuli, as shown in Figure 2C.
- https://cdn.elifesciences.org/articles/89093/elife-89093-fig2-data1-v1.zip
Figure 3
Cholinergic basal forebrain neural activity increases during conditioned stimuli and responses, even in the absence of reward delivery.
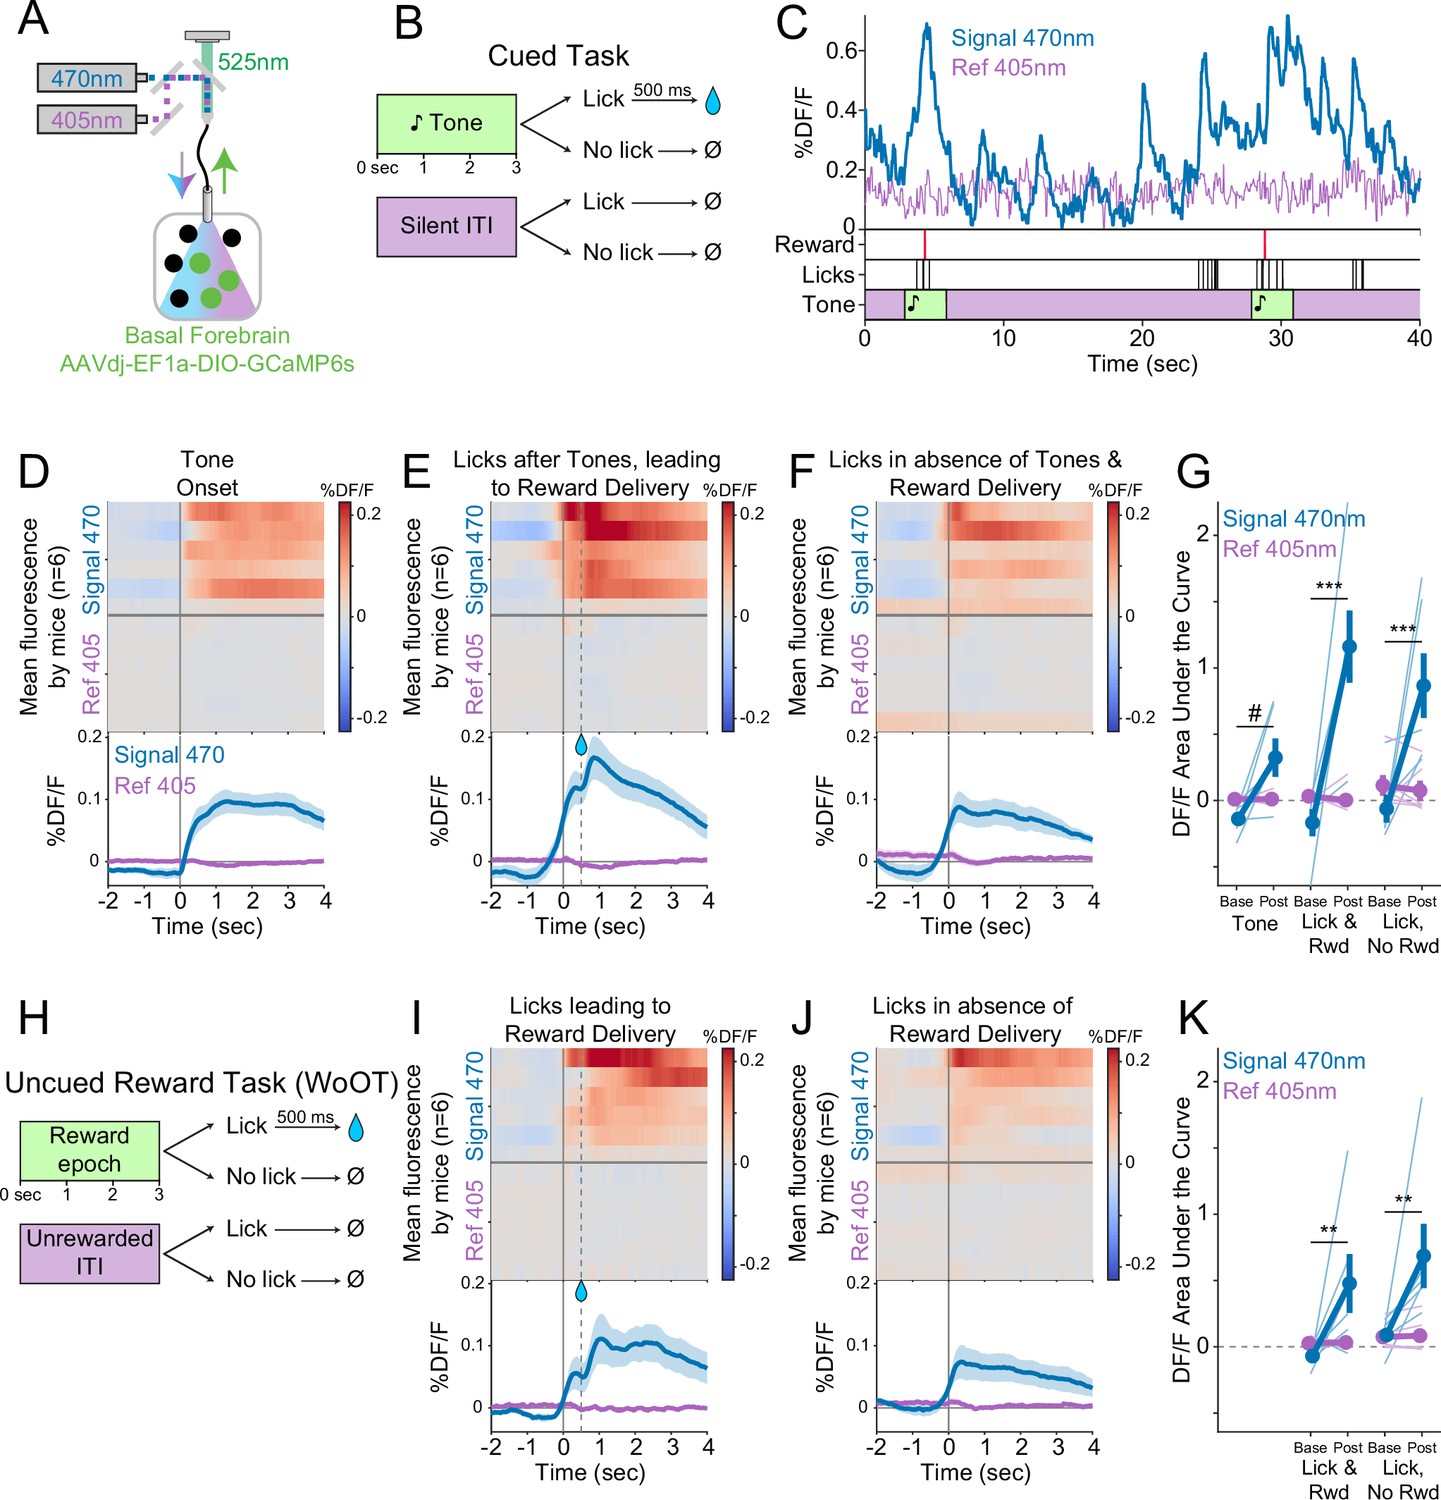
(A) Strategy to record fluorescent activity from basal forebrain cholinergic neurons expressing the calcium sensor GCaMP6s, using interleaved signal (470 nm, blue) and reference (405 nm, violet) wavelengths to elicit fluorescence (525 nm, green). (B) Task windows. We recorded fluorescent activity from mice during a traditional operant cue detection task. If mice licked after the onset of a tone, a fluid reward was delivered after a 0.5 s delay. Licks during the silent Unrewarded Windows had no consequence. (C) Sample GCaMP photometry fluorescence traces from one mouse demonstrating signal increases around the times of tones, licks, and reward deliveries. Increases were apparently present even for licking in the absence of tones and rewards. The blue trace represents data from the signal wavelength (470 nm) and the violet trace represents interleaved data from the reference wavelength (405 nm). (D) Changes in fluorescence from basal forebrain cholinergic neurons referenced to the time of tone onset. Heat maps represent trial-averaged data from each mouse. Top heat maps are for 470 nm excited fluorescence (Signal 470), bottom heat maps are for 405 nm reference (Ref 405). The bottom panel summary data are represented as mean ± SEM. Mice are sorted in all heat maps (D–F, I–J), in the order of average post-lick activity in panel (E). (E) Changes in fluorescence from basal forebrain cholinergic neurons referenced to the time of the first lick after tone onset. Licking triggered subsequent reward delivery (first lick at 0 s, reward delivery at dashed line, 0.5 s). (F) Changes in fluorescence from basal forebrain cholinergic neurons referenced to the onset of matched lick bouts that were in the absence of tone cues and did not lead to reward delivery. (G) Fluorescence levels from basal forebrain cholinergic neurons at baseline (−2 to –1.5 s before each referenced event) and post-event time points (0–0.5 s after events, to standardize analyses between events) in the cued task. Fluorescence levels depended on an interaction of wavelength, time point, and event type (linear mixed effects model, F2,55 = 3.28, p=0.045). Fluorescence levels increased at the time of events in the 470 nm wavelength signal channel (blue), but not the 405 reference channel (violet) (tone: t55 = 2.64, #p=0.064; Lick leading to Reward Delivery [Lick & Rwd]: t55 = 7.57, ***p<0.001; Licks in the absence of Cue & Reward Delivery [Lick, No Rwd]: t55 = 5.29, ***p<0.001; Sidak correction for six multiple comparisons). Thin lines represent data from all individual mice, pooled data are represented as mean ± SEM. (H) Uncued Window of Opportunity Task (WoOT). All mice were also recorded from at an earlier stage of WoOT training, before experience with tones or other discrete cues. If a mouse licked during an uncued Window of Opportunity, a fluid reward was delivered. A 0.5 s delay was instituted between lick and reward to account for the slow dynamics of GCaMP6s. Licks during Unrewarded Windows were recorded but had no consequence. (I) Changes in fluorescence from basal forebrain cholinergic neurons referenced to the time of the first lick that triggered reward delivery (first lick at 0 s, reward delivery at dashed line, 0.5 s). (J) Changes in fluorescence from basal forebrain cholinergic neurons referenced to the onset of matched lick bouts that did not lead to reward delivery. (K) Fluorescence levels from basal forebrain cholinergic neurons at baseline (−2 to –1.5 s before each referenced event) and post-event time points (0–0.5 s after events, to standardize analyses between events) in WoOT. Fluorescence levels depended on an interaction of wavelength and time point (linear mixed effects model, F1,35 = 13.59, p=0.0008), without a third-order interaction by event type (F1,35 = 0.02, p=0.882). Fluorescence levels increased at the time of events in the 470 nm wavelength signal channel (blue), but not the 405 reference channel (violet) (Lick leading to Reward Delivery [Lick & Rwd]: t35 = 3.58, **p=0.004; Licks in absence of Reward Delivery [Lick, No Rwd]: t35 = 3.90, **p<0.002; Sidak correction for four multiple comparisons). Thin lines represent data from all individual mice, pooled data are represented as mean ± SEM.
-
Figure 3—source data 1
The fluorescence levels during baseline and post-cue events in the cued task, as shown in Figure 3G.
- https://cdn.elifesciences.org/articles/89093/elife-89093-fig3-data1-v1.zip
-
Figure 3—source data 2
The fluorescence levels during baseline and post-cue events in WoOT, as shown in Figure 3K.
- https://cdn.elifesciences.org/articles/89093/elife-89093-fig3-data2-v1.zip
Figure 4
Local acetylcholine (ACh) levels in the basolateral amygdala (BLA), measured using a genetically encoded sensor, increase during conditioned stimuli and responses.
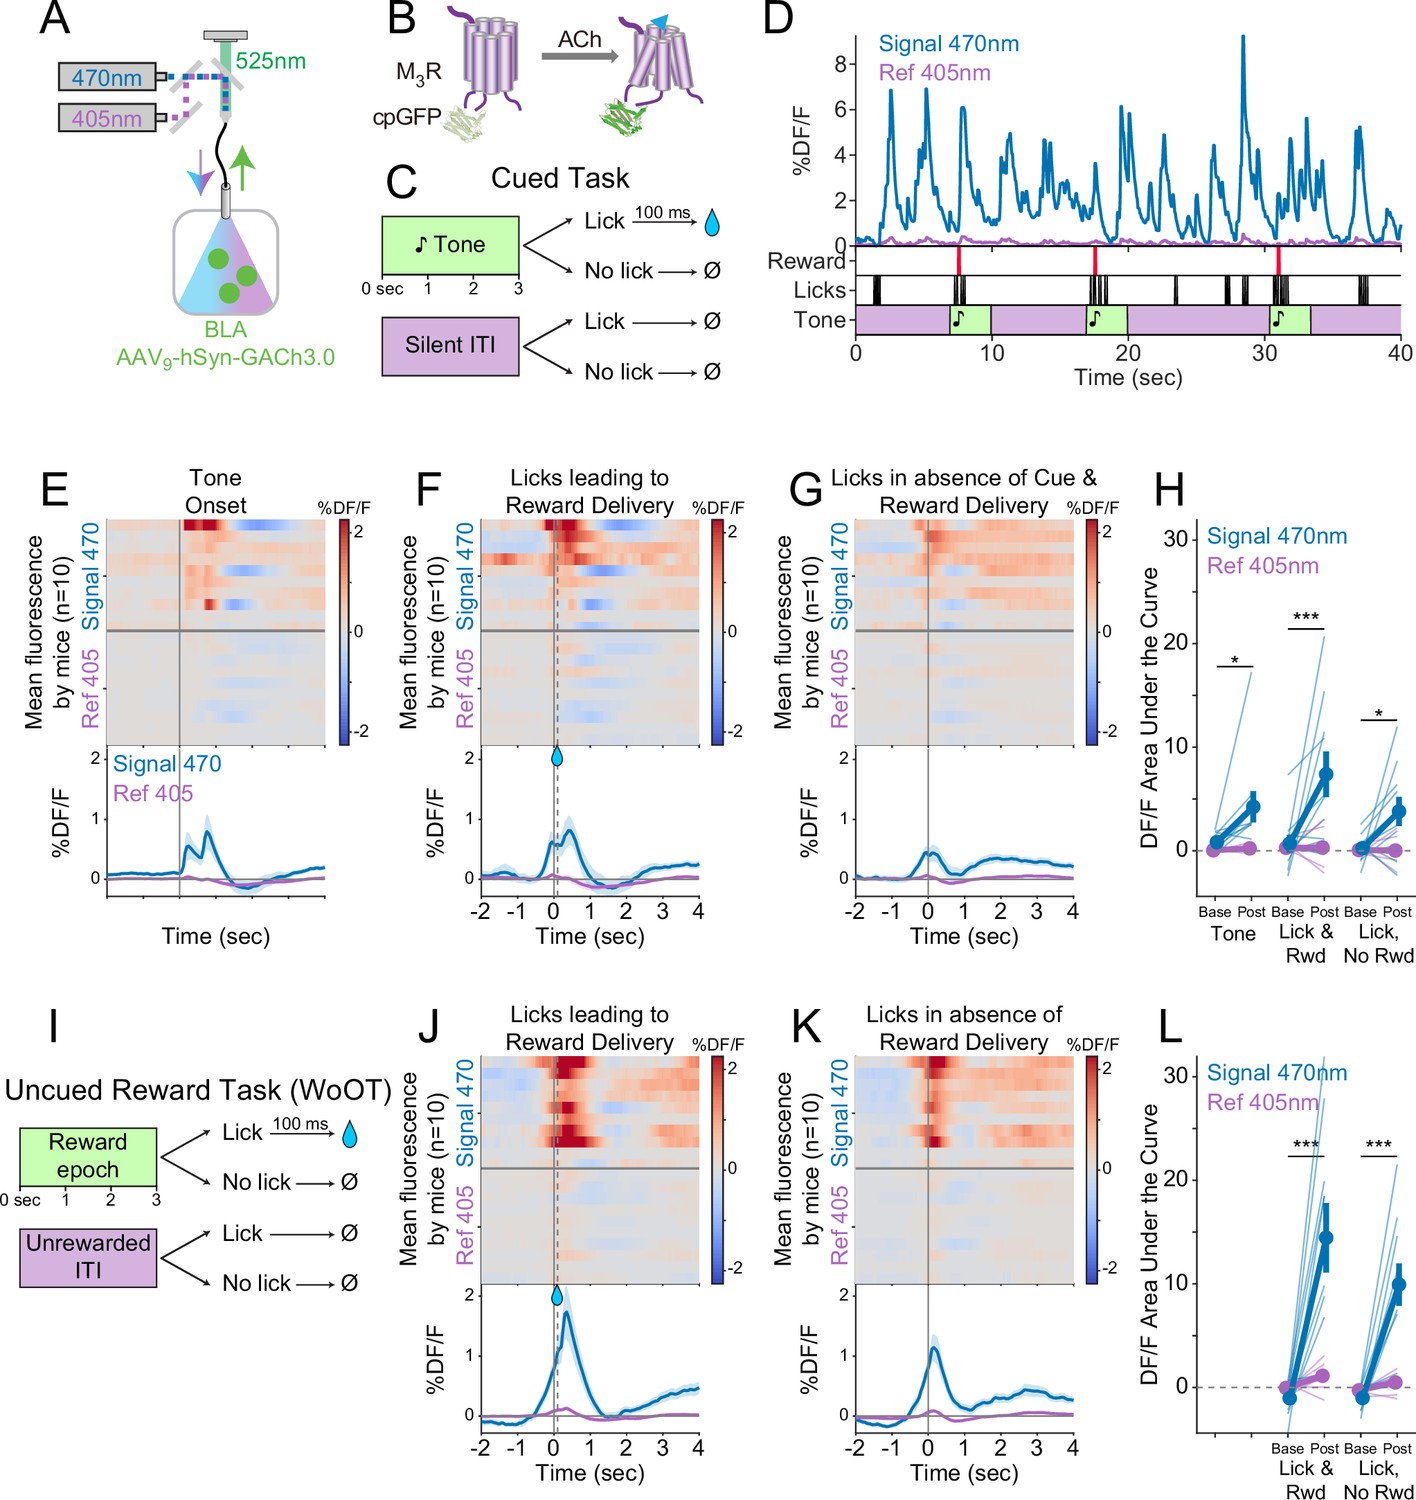
(A) Strategy to record local ACh levels in the BLA. A genetically encoded, fluorescent ACh sensor (GACh3.0, [B]) was expressed in BLA neurons, and imaged using interleaved signal (470 nm, blue) and reference (405 nm, violet) wavelengths to elicit fluorescence (525 nm, green). (B) The fluorescent ACh sensor, GACh3.0, is a fusion protein between a modified M3 muscarinic receptor and cyclically permuted GFP. GACh3.0 undergoes a conformational change and fluoresces to 470 nm light after binding ACh. Please note that kinetics for GACh3.0 (Jing et al., 2020) are somewhat faster than those for GCaMP6s.(Chen et al., 2013). (C) Cued task windows. We recorded fluorescent activity from mice during a traditional operant cue detection task. If mice licked after the onset of a tone, a fluid reward was delivered after a 0.1 s delay. Licks during intertrial intervals (ITIs) had no consequence. (D) Sample BLA ACh sensor fluorescence traces from one mouse demonstrating apparent increases around the times of tones, licks, and reward deliveries. Increases were apparently present even for licking in the absence of tones and rewards. (E) Changes in BLA ACh sensor fluorescence referenced to the time of tone onset. Heat maps represent trial-averaged data from each mouse. Top heat maps are for 470 nm excited fluorescence (Signal 470), bottom heat maps are for 405 nm reference (Ref 405). The bottom panel summary data are represented as mean ± SEM. Mice are sorted in all heat maps (E–G, J–K), in the order of average post-lick activity in panel (F). (F) Changes in BLA ACh sensor fluorescence referenced to the time of the first lick after tone onset. Licking triggered reward delivery (first lick at 0 s, reward delivery at dashed line, 0.5 s). (G) Changes in BLA ACh sensor fluorescence referenced to the onset of matched lick bouts that were in the absence of tone cues and did not lead to reward delivery. (H) BLA ACh sensor fluorescence levels at baseline (−2 to –1.5 s before each referenced event) and post-event time points (0–0.5 s after events, to standardize analyses between events) in the Cued task. Fluorescence levels depended on an interaction of wavelength and time point (linear mixed effects model, F1,99 = 20.41, p<0.001), without a third-order interaction by event type (F2,99=1.20, p=0.305). Fluorescence levels increased at the time of events in the 470 nm wavelength signal channel (blue), but not the 405 reference channel (violet) (tone: t99 = 2.80, *p=0.036; Lick leading to Reward Delivery [Lick & Rwd]: t99 = 5.49, ***p<0.001; Licks in the absence of Cue & Reward Delivery [Lick, No Rwd]: t99 = 2.91, *p<0.027; Sidak correction for six multiple comparisons). Thin lines represent data from all individual mice, pooled data are represented as mean ± SEM. (I) Uncued Window of Opportunity Task (WoOT). All mice were also recorded from at an earlier stage of WoOT training, before experience with tones or other discrete cues. If a mouse licked during an uncued Window of Opportunity, a fluid reward was delivered. Licks during Unrewarded Windows were recorded but had no consequence. (J) Changes in BLA ACh sensor fluorescence referenced to the time of the first lick that triggered reward delivery (first lick at 0 s, reward delivery at dashed line, 0.1 s). (K) Changes in BLA ACh sensor fluorescence referenced to the onset of matched lick bouts that did not lead to reward delivery. (L) BLA ACh sensor fluorescence levels at baseline (−2 to –1.5 s before each referenced event) and post-event time points (0–0.5 s after events, to standardize analyses between events) in WoOT. Fluorescence levels depended on an interaction of wavelength and time point (linear mixed effects model, F1,63 = 44.21, p<0.001), without a third-order interaction by event type (F1,63 = 1.25, p=0.267). Fluorescence levels increased at the time of events in the 470 nm wavelength signal channel (blue), but not the 405 reference channel (violet) (Lick leading to Reward Delivery [Lick & Rwd]: t63 = 8.41, ***p<0.001; Licks in the absence of Reward Delivery [Lick, No Rwd]: t63 = 5.94, ***p<0.001; Sidak correction for four multiple comparisons). Thin lines represent data from all individual mice, pooled data are represented as mean ± SEM.
-
Figure 4—source data 1
BLA ACh sensor fluorescence levels at baseline and post-event time points in the Cued task, as shown in Figure 4H.
- https://cdn.elifesciences.org/articles/89093/elife-89093-fig4-data1-v1.zip
-
Figure 4—source data 2
BLA ACh sensor fluorescence levels at baseline and post-event time points in the WoOT, as shown in Figure 4L.
- https://cdn.elifesciences.org/articles/89093/elife-89093-fig4-data2-v1.zip
Figure 5 with 1 supplement
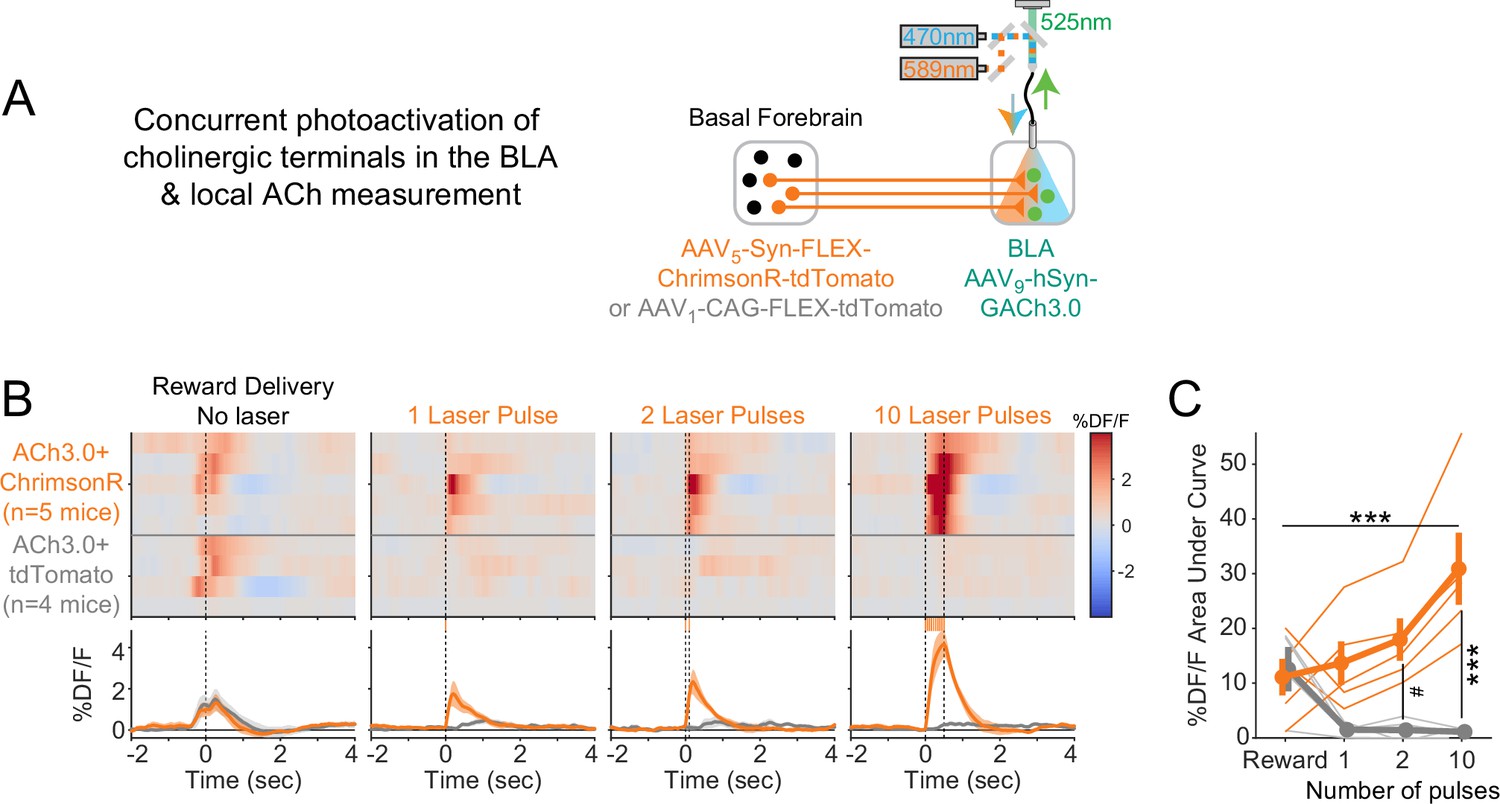
Cholinergic signaling in the basolateral amygdala (BLA) is sufficient to promote conditioning responding but acetylcholine (ACh) release is independent of reward contingency.
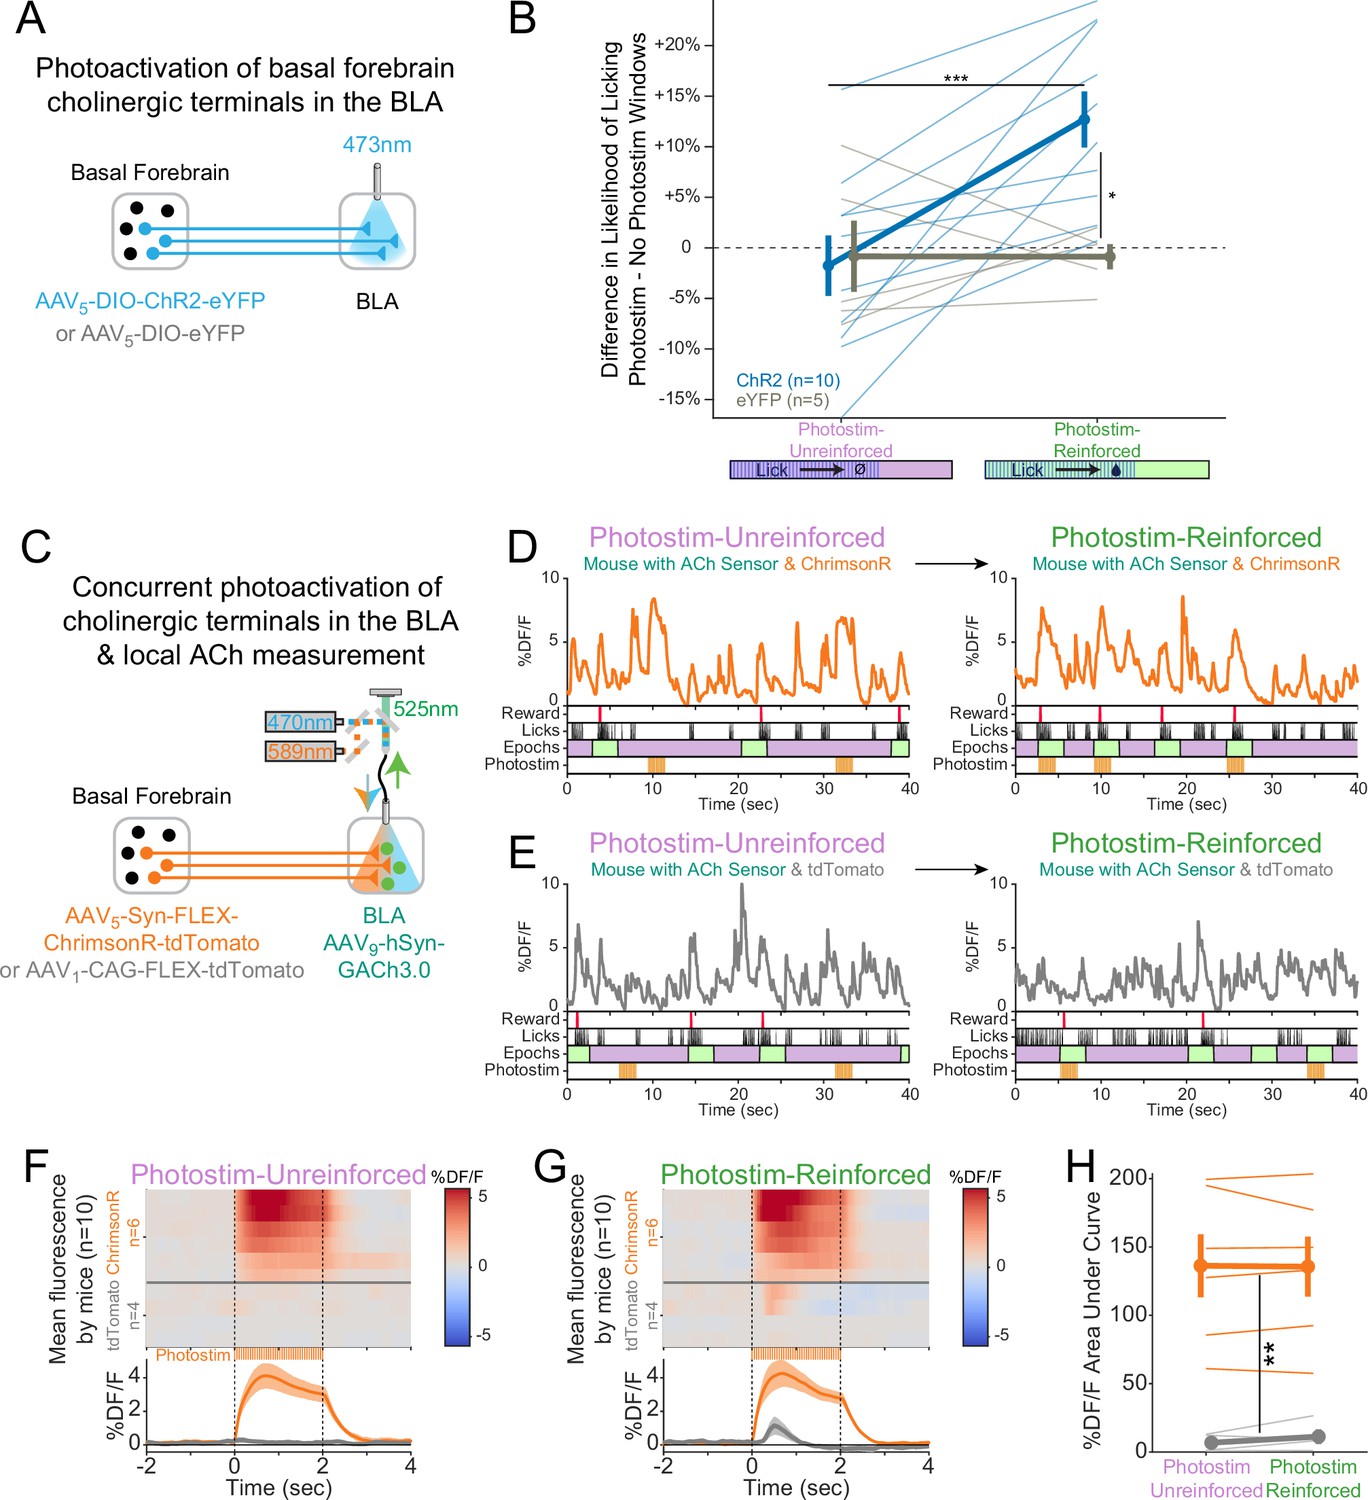
(A) Optogenetic strategy to photostimulate cholinergic (ChAT::Cre) basal forebrain terminals in the BLA selectively. (B) The difference in the likelihood of licking between Photostim and No Photostim windows differed depending on the window in which photostimulation was delivered. The effect of photostimulation within each session is calculated for each mouse. A linear mixed effects model to account for repeated measures demonstrated that the effect of photostimulation depended on an interaction between Virus and Session type (F1,15 = 9.624, p=0.007). Post hoc tests Sidak correction for multiple comparisons revealed that the effect of photostimulation was greater for ChR2 mice in Photostim-Reinforced than Photostim-Unreinforced sessions (***p=0.0004), and that the effect of photostimulation in Photostim-Reinforced sessions was greater for ChR2 mice than eYFP mice (*p=0.0215). All other comparisons were not significant (p>0.05). (C) Schematic showing concurrent photostimulation of cholinergic terminals in the BLA while measuring local ACh using a genetically encoded fluorescent sensor, through the same optic fiber. Mice either expressed ChrimsonR or a control fluorophore (tdTomato) in basal forebrain ChAT neurons.(D) Sample fluorescent traces from ACh sensor (orange) from a mouse with ChrimsonR, in relationship to reward delivery (red), licks (black), behavioral windows (Reward green/Unrewarded purple), and photostimulation (orange). Photostimulation was either delivered in a Photostim-Unreinforced session (during Unrewarded Windows, left, purple) or Photostim-Reinforced session (during rewarded windows, right, green). (E) Sample ACh fluorescent traces from ACh sensor (gray) from a mouse with a control fluorophore, displayed similarly to (E), in relationship to rewards, licks, behavioral windows, and photostimulation, delivered either in a Photostim-Unreinforced (left, purple) or Photostim-Reinforced session (right, green). (F) Heat maps comparing average ACh measurements for each mouse around the time of photostimulation on the Photostim-Unreinforced session. Mice are separated based on whether they expressed ChrimsonR (orange, n = 6) or control fluorophore (gray, n = 4). Summary data in the bottom panel are represented as mean ± SEM. Mice are sorted in all panels based mean DF/F during laser stimulation. (G) Heat maps comparing average ACh measurements for each mouse during photostimulation in the Photostim-Reinforced session. Conventions are as in (G), and mice are sorted in the same order as in (G). (H) Mean ACh measurements evoked by photostimulation on the Unreinforced (left) or Reinforced (right) session. Evoked ACh measurements were higher for ChrimsonR mice than control fluorophore mice, but evoked ACh measurements did not depend upon whether photostimulation was provided on Unreinforced or Reinforced sessions (linear mixed effects model: effect of Virus F1,8 = 20.21, **p=0.002; effect of Session F1,8 = 0.47, p=0.51; interaction between Virus and Session type F1,8 = 0.86, p=0.38).
-
Figure 5—source data 1
The likelihood of licking for Photostim-Reinforced or Photostim-Unreinforced sessions, as shown in Figure 5B.
- https://cdn.elifesciences.org/articles/89093/elife-89093-fig5-data1-v1.zip
-
Figure 5—source data 2
ACh measurements evoked by photostimulation for Photostim-Reinforced or Photostim-Unreinforced sessions, as shown in Figure 5H.
- https://cdn.elifesciences.org/articles/89093/elife-89093-fig5-data2-v1.zip
Figure 5—figure supplement 1
Comparison of acetylcholine (ACh) evoked by reward collection with that evoked by photostimulation.
(A) Schematic showing strategy for concurrent photostimulation of cholinergic terminals in the basolateral amygdala (BLA) while measuring local ACh using a genetically encoded fluorescent sensor, through the same optic fiber. Mice either expressed ChrimsonR or a control fluorophore (tdTomato) in basal forebrain ChAT neurons. (B) Heat maps comparing average ACh measurements for each mouse around the time of reward delivery (left panel), or at the times of photostimulation of increasing duration (subsequent panels). Mice are separated based on whether they expressed ChrimsonR (orange, n = 5) or control fluorophore (gray, n = 4). Summary data in the bottom panels are represented as mean ± SEM. Mice are sorted in all panels based on the peri-reward activity in the first panel. (C) Area under the curve (AUC) for %DF/F elicited by Reward (leftmost point) or increasing durations of photostimulation (1, 2, or 10 pulses), for mice with ChrimsonR (orange) or control fluorophore (gray). Data was analyzed for 0–0.5 s after the event, consistent with the longest duration of photostimulation. Fluorescence levels depended upon an interaction between photostimulation duration and virus type (linear mixed effects model, F3,21 = 10.36, p<0.001). Post hoc tests compared to rewards showed that fluorescence changes only were greater for 10 pulses (t21 = 5.24, ***p<0.001) and were most clearly greater in ChrimsonR mice than control fluorophore mice for increasing pulses (2 pulses t16.5 = 2.98, #p=0.083; 10 pulses t16.5 = 5.36, ***p<0.001; Sidak correction for 10 comparisons). Summary data are represented as mean ± SEM.
-
Figure 5—figure supplement 1—source data 1
The fluorescence levels in response to Reward under various photostim durations, as shown in Figure 5-figure supplement 1C.
- https://cdn.elifesciences.org/articles/89093/elife-89093-fig5-figsupp1-data1-v1.zip
Figure 6 with 4 supplements
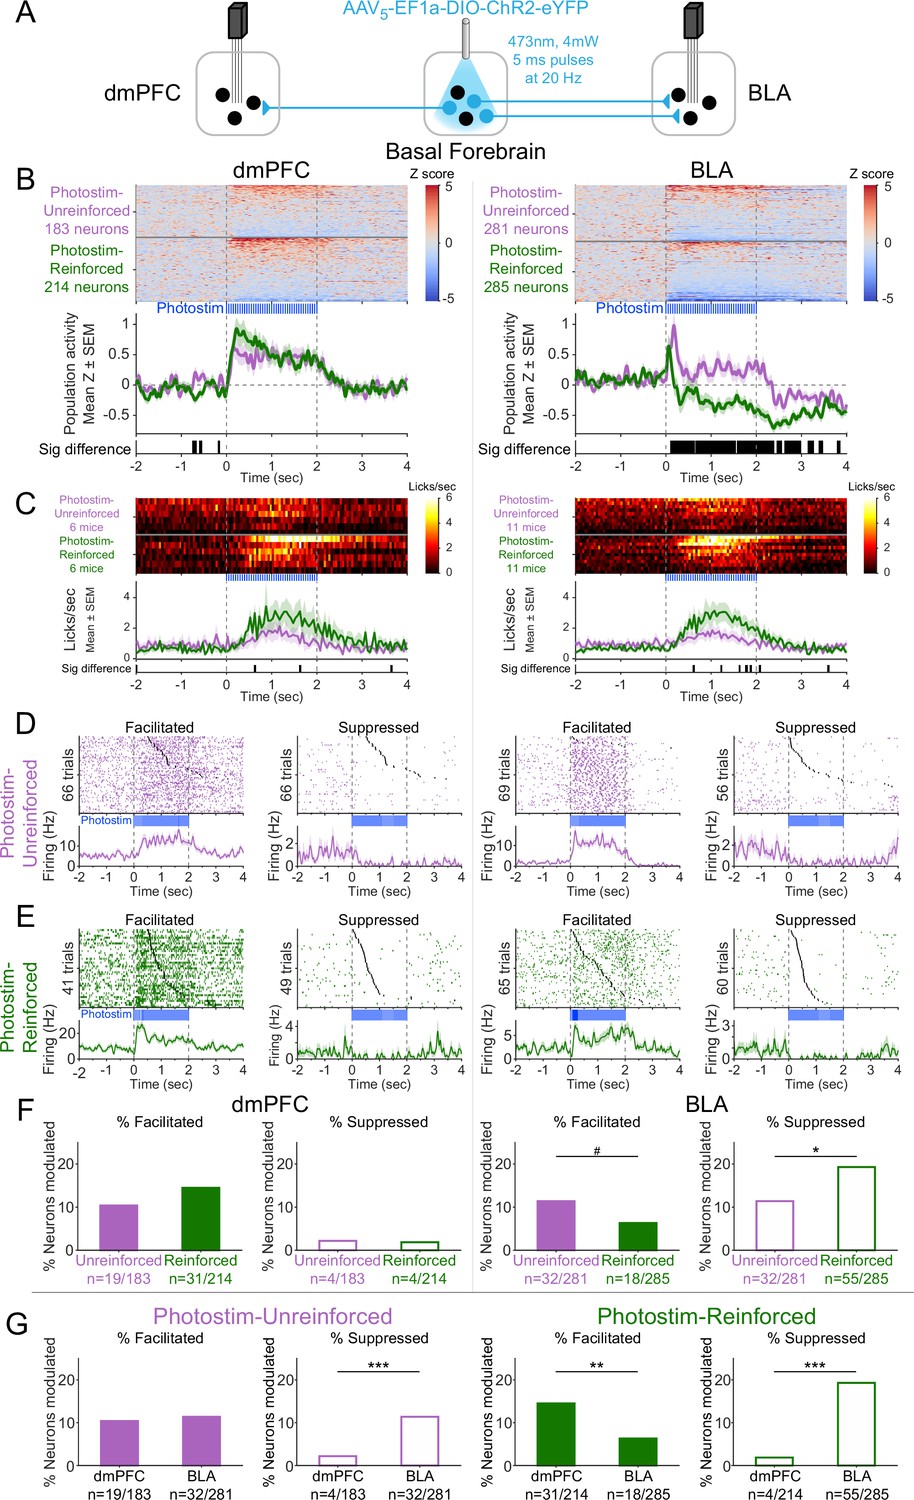
Cholinergic modulation of neural activity in vivo depends upon reward context in the amygdala, but not in the prefrontal cortex.
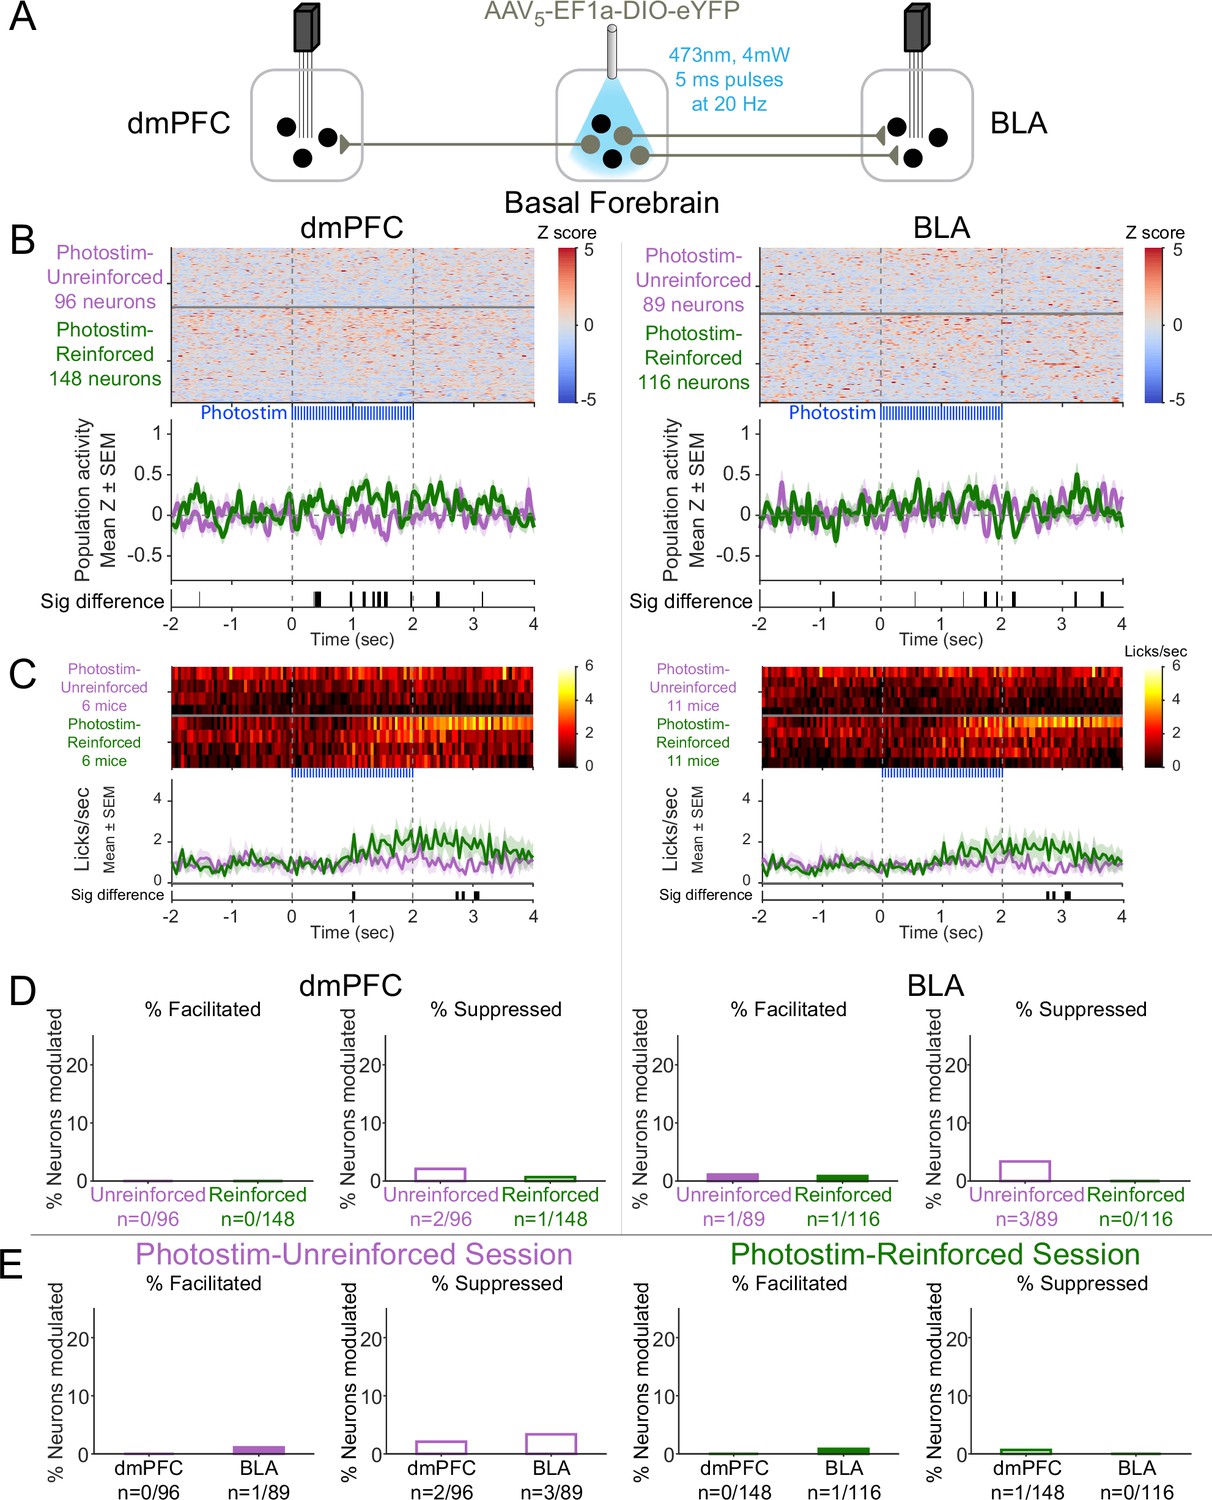
(A) Strategy for photostimulation of cholinergic basal forebrain neurons and terminal region electrophysiology in the dorsomedial prefrontal cortex (dmPFC) and basolateral amygdala (BLA). Six ChR2 mice had electrodes implanted in both dmPFC and BLA. Five ChR2 mice had electrodes implanted only in the basolateral amygdala (BLA), yielding a total of 11 ChR2 mice with electrodes in BLA. Photostimulation parameters were the same as in ChR2 behavioral experiments (Figure 1). (B) Activity from all recorded neurons in each target area (dmPFC and BLA, total 963 neurons over all sessions from 11 mice), from sessions in which photostimulation was delivered during intertrial interval (ITI) Unrewarded Windows (Photostim-Unreinforced, purple) or sessions in which photostimulation was delivered during Windows of Opportunity (Photostim-Reinforced, green). Each row represents activity from a single neuron, normalized to baseline (−2 to 0 s before photostimulation onset) and smoothed with a 50 ms Gaussian. Neurons are sorted according to mean activity during photostimulation (0 to +2 s). Summary population data in the bottom panels are represented as mean ± SEM. Black marks underneath the population data represent 10 ms steps when the population activity differed between Photostim-Unreinforced vs. Photostim-Reinforced sessions (rank-sum test, p<0.01). (C) Licking activity from all mice contributing recordings for each target area, from sessions in which photostimulation was delivered during ITI Unrewarded Windows (Photostim-Unreinforced, purple) or sessions in which photostimulation was delivered during Windows of Opportunity (Photostim-Reinforced, green). Each row represents activity from a single mouse. Summary population data in the bottom panels are represented as mean ± SEM. Black marks underneath the population data represent 10 ms steps when the population licking activity differed between Photostim-Unreinforced vs. Photostim-Reinforced sessions (rank-sum test, p<0.01). (D) Example neural activity from each target area (dmPFC left, BLA right) around photostimulation of basal forebrain cholinergic neurons (0–2 s), from Photostim-Unreinforced sessions. Top panels are individual trial rasters and black markers indicate the first lick following Photostim onset. Trials are sorted by lick latency. Summary data in the bottom panels are represented as mean ± SEM, smoothed with a 50 ms Gaussian kernel. We observed neurons that were facilitated and suppressed relative to baseline in both regions (signed-rank test of firing rate in the 1 s before stimulation vs 0.5 s after, p<0.01). (E) Example neural activity from each target area (dmPFC left, BLA right) around photostimulation of basal forebrain cholinergic neurons (0–2 s) from Photostim-Reinforced sessions. We again observed neurons that were facilitated and suppressed relative to baseline in both regions. Conventions are the same as in (E). (F) Proportions of neurons that were facilitated (solid bars) or suppressed (open bars) in each area during Photostim-Unreinforced sessions (purple) or Photostim-Reinforced sessions (green). Denominator ns refer to neurons recorded across all mice during each session type. A higher percentage of BLA neurons were suppressed on Photostim-Reinforced sessions than Photostim-Unreinforced sessions (two-sample tests for equality of proportions: Χ2 = 6.81, df = 1, *p=0.036, corrected for four multiple comparisons using Holm’s procedure). There was a trend toward a lower percentage of BLA neurons being facilitated on Photostim-Reinforced sessions than Photostim-Unreinforced sessions (Χ2 = 4.52, df = 1, #p=0.10). (G) Proportions of neurons that were facilitated (solid bars) or suppressed (open bars) in each area during Photostim-Unreinforced sessions (left, purple) or Photostim-Reinforced sessions (right, green). Data is replotted from (E) to facilitate comparisons between areas for each session type. A higher percentage of BLA neurons than dmPFC neurons were suppressed during both Photostim-Unreinforced and Photostim-Reinforced sessions (two-sample tests for equality of proportions: Photostim-Unreinforced: Χ2 = 13.11, df = 1, ***p<0.001; Photostim-Reinforced: Χ2 = 35.61, df = 1, ***p<0.001; all p values corrected for four multiple comparisons using Holm’s procedure). A lower percentage of BLA neurons than PFC neurons was facilitated during Photostim-Reinforced sessions (Χ2 = 9.21, df = 1, **p=0.005).
-
Figure 6—source data 1
The neurons that were modulated (either facilitated or suppressed) by Photostim-Reinforced or Photostim-Unreinforced sessions for each brain region, as shown in Figure 6F, G.
- https://cdn.elifesciences.org/articles/89093/elife-89093-fig6-data1-v1.zip
Figure 6—figure supplement 1
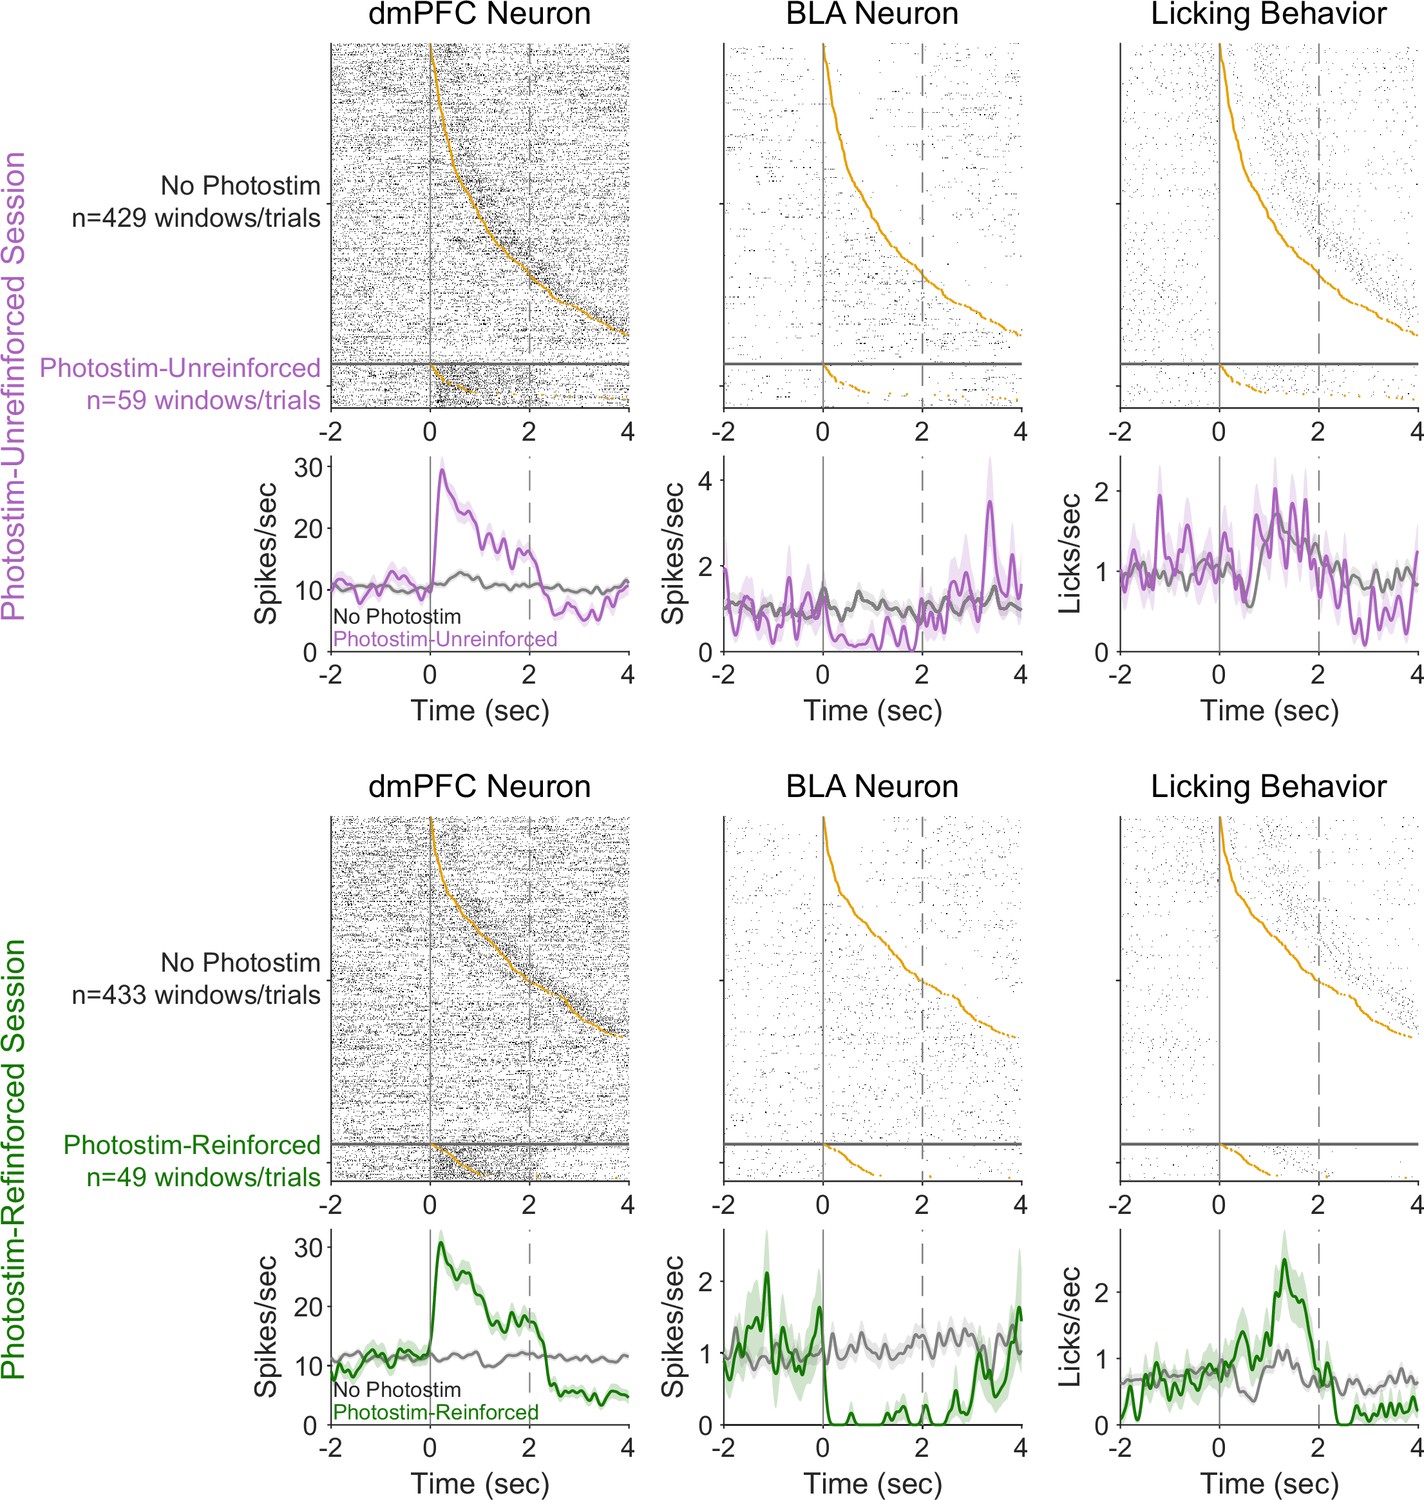
Example neural variability and relationship to behavioral responses.
Pairs of neurons recorded simultaneously from the dorsomedial prefrontal cortex (dmPFC) (left column) and basolateral amygdala (BLA) (middle column) during a Photostim-Unreinforced session (top row) and Photostim-Reinforced session (bottom row). Top panels indicate trial-by-trial rasters sorted by the first lick occurring in the window (orange circle), with bottom panels indicating average activity (smoothed with 100 ms Gaussian window). Rasters are split by whether they occurred during windows with photostimulation (purple or green), or matched windows without photostimulation.
Figure 6—figure supplement 2
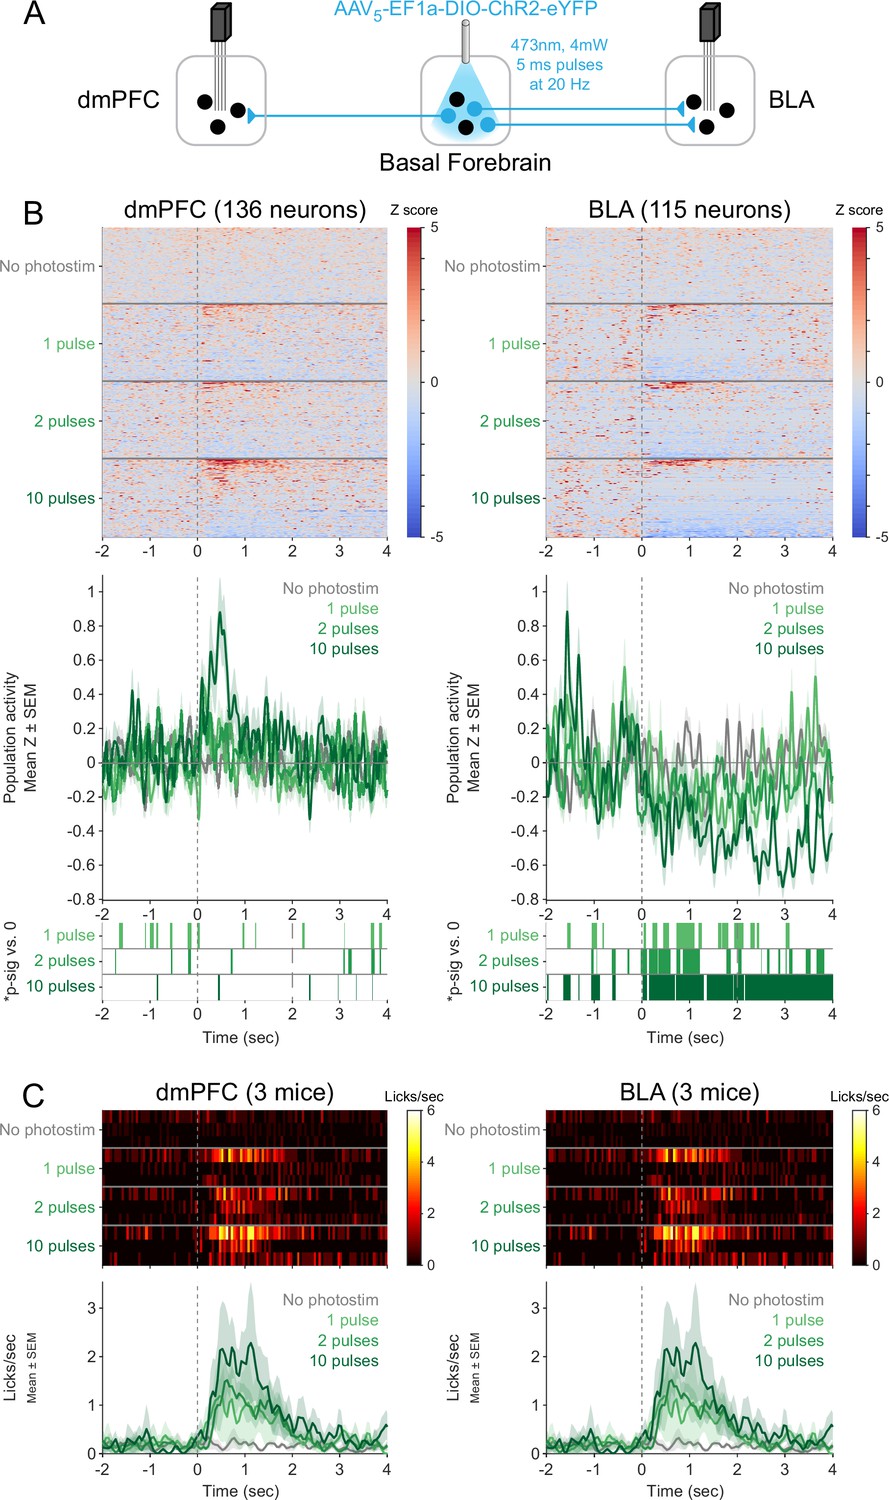
Responses of neurons in the dorsomedial prefrontal cortex (dmPFC) and basolateral amygdala (BLA) to shorter photostimulations.
(A) Strategy for photostimulation of cholinergic basal forebrain neurons and terminal region electrophysiology in the dmPFC and BLA with varying photostimulation durations. Three ChR2 mice had electrodes implanted in both dmPFC and BLA. Photostimulation parameters were the same as in ChR2 behavioral experiments (Figure 1). (B) Activity from all recorded neurons in each target area (dmPFC and BLA, from three mice), from a session in which photostimulation was delivered during Rewarded windows at different durations (No photostimulation, 1 pulse, 2 pulses, or 10 pulses). Each row represents activity from a single neuron, normalized to baseline (−2 to 0 s before photostimulation onset) and smoothed with a 50 ms Gaussian. Neurons are sorted according to mean activity after photostimulation (0 to +2 s to maintain the same timing as prior figures) and represented under each trial type. Summary population data in the bottom panels for each photostimulation duration are represented as mean ± SEM. Green shaded marks underneath the population data represent 10 ms steps when the population activity differed between each duration of photostimulation and no photostimulation (sign-rank test, p<0.01). (C) Licking activity from all mice contributing recordings to this figure. Each row represents activity from a single mouse for different photostimulation durations. Summary population data in the bottom panels are represented as mean ± SEM. The two plots are identical since the same mice were used for recordings in both areas, but are presented in duplicate to facilitate comparison with the plots above.
Figure 6—figure supplement 3
Effects of laser illumination on neural activity were not seen in control eYFP subjects.
(A) Control strategy for laser illumination of cholinergic basal forebrain neurons expressing non-optogenetic fluorophore (eYFP). Four mice expressing eYFP in basal forebrain cholinergic neurons had electrodes implanted in both dorsomedial prefrontal cortex (dmPFC) and basolateral amygdala (BLA). One eYFP mouse had electrodes implanted only in the BLA, yielding a total of five eYFP mice with electrodes in BLA. (B) Activity from all recorded neurons in each area (total 449 neurons over two sessions per five control eYFP mice) from sessions in which laser illumination was delivered during intertrial interval (ITI) Unrewarded Windows (Photostim-Unreinforced, purple) or sessions in which laser illumination was delivered during Windows of Opportunity (Photostim-Reinforced, green). Each row represents activity from a single neuron, normalized to baseline (−2 to 0 s before laser illumination onset) and smoothed with a 50 ms Gaussian. Neurons are sorted according to mean activity during laser illumination (0 to +2 s). Summary population data in the bottom panels are represented as mean ± SEM. Black marks underneath the population data represent 10 ms steps when the population activity differed between Photostim-Unreinforced vs. Photostim-Reinforced sessions (rank-sum test, p<0.01). Axis and color limits are the same as for ChR2 mice in Figure 4 to enable comparison with experimental mice. (C) Licking activity from all mice contributing recordings for each target area from sessions in which photostimulation was delivered during ITI Unrewarded Windows (Photostim-Unreinforced, purple) or sessions in which photostimulation was delivered during Windows of Opportunity (Photostim-Reinforced, green). Each row represents activity from a single mouse. Summary population data in the bottom panels are represented as mean ± SEM. Black marks underneath the population data represent 10 ms steps when the population licking activity differed between Photostim-Unreinforced vs. Photostim-Reinforced sessions (rank-sum test, p<0.01). (D) Percents of neurons that were facilitated (solid bars) or suppressed (open bars) in control eYFP mice in each area during Photostim-Unreinforced sessions (purple) or Photostim-Reinforced sessions (green). Denominator ns refer to neurons recorded across all mice during each session type. There were no clear differences in percentages of neurons facilitated or suppressed on Rewarded or Unrewarded days (two-sample tests for equality of proportions: p>0.10, corrected for four multiple comparisons using Holm’s procedure). Axis limits are the same as for ChR2 mice in Figure 4 to enable comparison with experimental mice. (E) Percents of neurons that were facilitated (solid bars) or suppressed (open bars) in control eYFP mice in each area during Photostim-Unreinforced sessions (left, purple) or Photostim-Reinforced sessions (right, green). Data is replotted from (C) to facilitate comparisons between areas for each session type. There were no clear differences in percentages of neurons facilitated or suppressed between areas (two-sample tests for equality of proportions: p>0.10, corrected for four multiple comparisons using Holm’s procedure). Axis limits are the same as for ChR2 mice in Figure 4 to enable comparison with experimental mice.
-
Figure 6—figure supplement 3—source data 1
The neurons that were modulated (either facilitated or suppressed) by Photostim-Reinforced or Photostim-Unreinforced sessions for each brain region for control eYFP and experimental ChR2 mice, as shown in Figure 6-figure supplement 3D, E.
- https://cdn.elifesciences.org/articles/89093/elife-89093-fig6-figsupp3-data1-v1.zip
Figure 6—figure supplement 4
Neurons facilitated or suppressed by cholinergic photostimulation may have different baseline firing rates.
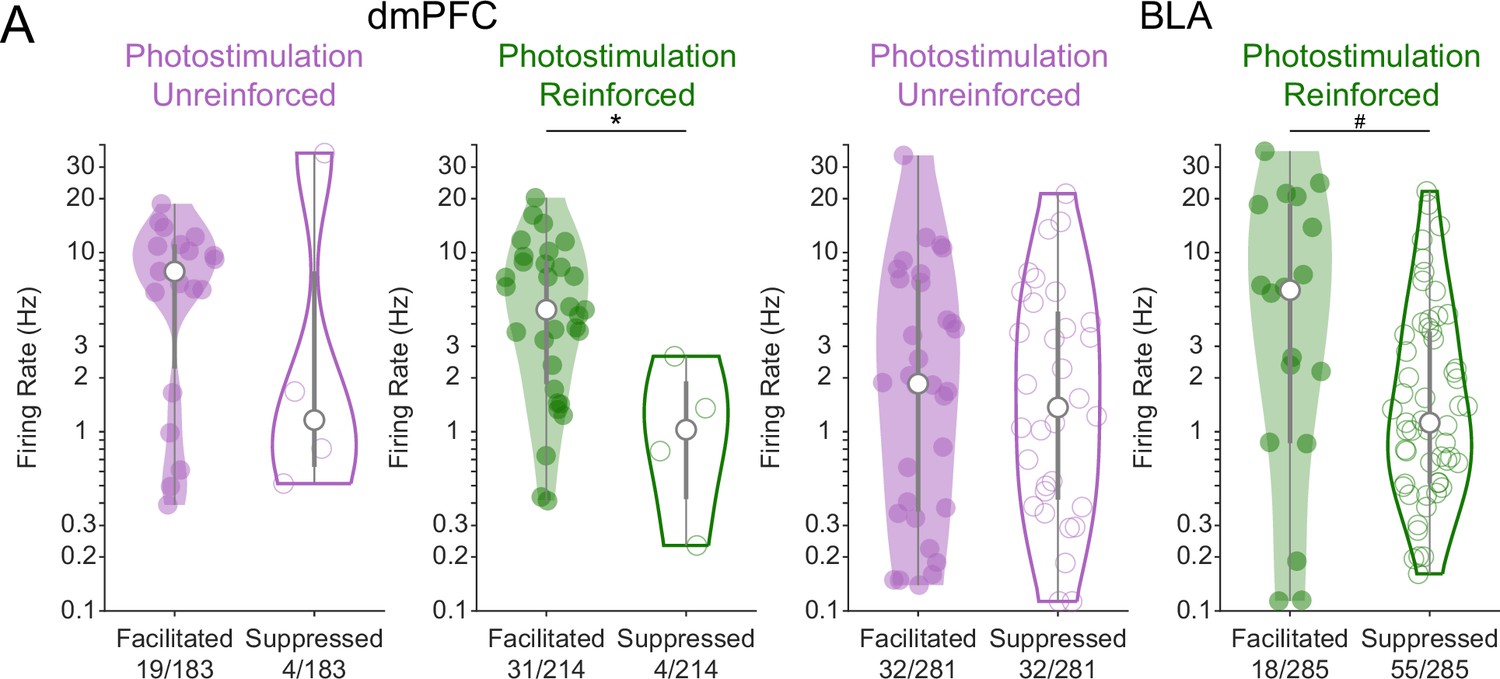
(A) The baseline firing rates of neurons in ChR2 mice that were either facilitated (solid distributions) or suppressed (open distributions) by photostimulation of cholinergic basal forebrain neurons are plotted by region (dorsomedial prefrontal cortex [dmPFC] left, basolateral amygdala (BLA) right) and session (Photostim-Unreinforced sessions in purple, Photostim-Reinforced sessions in green). Significant facilitation and suppression were determined based on a sign-rank test comparing activity in the 1 s before stimulation vs 0–0.5 s after (p<0.01). Given that firing rate distributions were right-skewed, firing rates are displayed as kernel density estimates on a log-scale and were log-transformed prior to analysis. Linear models revealed a main effect of Region (F1,187 = 14.56, ***p<0.001; dmPFC neurons had higher baseline firing rates than BLA neurons) and Facilitation vs. Suppression (F1,187 = 6.11, *p=0.014; Facilitated neurons had higher baseline firing rates than Suppressed neurons), but no effect of Session or interactions. Exploratory two-sample t-tests revealed that facilitated neurons may have had higher baseline firing rates during the Photostim-Reinforced session in both dmPFC (t33 = 2.78, *p=0.036, corrected for four multiple comparisons using Holm’s procedure) and the BLA (t71 = 2.40, #p=0.057, corrected). Data from eYFP mice is not shown given how few neurons passed statistical criteria for significant modulation.
-
Figure 6—figure supplement 4—source data 1
The baseline firing rate of neurons in each brain region of ChR2 mice that were modulated by photostimulation either in the Photostim-Reinforced or Photostim-Unreinforced sessions, as shown in Figure 6-figure supplement 4A.
- https://cdn.elifesciences.org/articles/89093/elife-89093-fig6-figsupp4-data1-v1.zip
Figure 7 with 1 supplement

Cholinergic afferents suppress basolateral amygdala output through muscarinic receptors and feed-forward inhibition.
(A) Schematic of injection strategy to express ChR2 in cholinergic neurons of the basal forebrain (BF) and eYFP in GABAergic neurons of the BLA (BLAGABA) using conditional viral expression in ChAT::Cre × VGAT::Flpo mice (VGAT = vesicular GABAergic transporter), along with CTB-647 as a retrograde marker of neurons projecting to dorsomedial prefrontal cortex (dmPFC). (B) Confocal image of the basolateral amygdala (BLA) showing whole-cell patch-clamp recording arrangement in the BLA with optical stimulation of ChR2-expressing BF terminals. AP coordinate = –1.58. (C) High-magnification images of neurobiotin-filled recorded BLA neurons expressing CTB-647 (BLA-mPFC; upper panels) and eYFP (BLAGABA, lower panels). (D) Passive membrane properties of BLA-mPFC and BLAGABA neurons. BLA-mPFC neurons had significantly greater capacitance (unpaired t-test: t42 = 11.90, ***p<0.001, n = 20 BLA-mPFC, n = 24 BLAGABA, from nine mice), smaller membrane resistance (unpaired t-test: t42=6.326, ***p<0.001, n = 20 BLA-mPFC, n = 24 BLAGABA, from nine mice), and more negative resting membrane potential (unpaired t-test: t29 = 2.857, **p=0.0078, n = 13 BLA-mPFC, n = 18 BLAGABA, from eight mice) than BLAGABA neurons. (E) Example trace and frequency histogram showing suppression of firing in BLA-mPFC neurons and facilitation of firing of BLAGABA neurons following optical stimulation of cholinergic terminals (470 nm light, 20 Hz; scale bars = 20 mV, 5 s). (F) Membrane potential of BLA-mPFC (upper traces) and BLAGABA neurons (lower traces) in response to 1 s 470 nm light delivered at 5, 10, and 20 Hz in current-clamp. (G) At each stimulation frequency, the amplitude of the fast excitatory postsynaptic potential (EPSP) was greater in BLAGABA neurons (green) compared with BLA-mPFC neurons (magenta; two-way ANOVA, main effect of cell type: F1,40 = 95.59, ***p<0.001; n = 7, 7, and 15 BLA-mPFC neurons at 5, 10, and 20 Hz, n = 5, 5, and 7 BLAGABA neurons at 5, 10, and 20 Hz, from nine mice), while the slower inhibitory postsynaptic current (IPSP) was greater in BLA-mPFC neurons (two-way ANOVA, main effect of cell type: F1,40 = 47.29, ***p<0.001; n = 7, 7, and 15 BLA-mPFC neurons at 5, 10, and 20 Hz, n = 5, 5, and 7 BLAGABA neurons at 5, 10, and 20 Hz, from nine mice). (H) Response of BLA-mPFC (upper traces) and BLAGABA neurons (lower traces) to a single 5 ms pulse of 470 nm light, with application of TTX/4AP to isolate monosynaptic currents. (I) Following application of TTX/4AP, the EPSP was maintained in BLAGABA neurons (green; unpaired t-test: t15 = 0.367, p=0.719, n = 8 [ACSF] and n = 9 [TTX/4AP] BLAGABA cells from four mice), while the IPSP was maintained in BLA-mPFC neurons (magenta; unpaired t-test: t16 = 0.094, p=0.926, n = 9 [ACSF] and n = 9 [TTX/4AP] BLA-mPFC cells from three mice). (J) Example traces showing inhibition of the IPSP in BLA-mPFC neurons (upper panels) by the muscarinic receptor antagonist scopolamine (10 µM) (dark gray), but not nicotinic antagonists (dihydro-ß-erythroidine 10 µM, methyllycaconitine 0.1 µM, mecamylamine 10 µM) (light gray), and inhibition of the EPSP in BLAGABA neurons (lower panels) by nicotinic receptor antagonists, but not muscarinic. (K) Proposed circuit model showing BF inhibition of BLA output by ACh acting at nicotinic receptors on BLAGABA neurons and muscarinic receptors on projection neurons. Dashed lines represent local BLAGABA neuron synapses onto BLA projector neurons from prior literature (Lee and Kim, 2019; Woodruff and Sah, 2007).
-
Figure 7—source data 1
Passive membrane properties for the patched cells, as shown in Figure 7D.
- https://cdn.elifesciences.org/articles/89093/elife-89093-fig7-data1-v1.zip
-
Figure 7—source data 2
The EPSP and IPSP amplitudes for patched cells, as shown in Figure 7G, I.
- https://cdn.elifesciences.org/articles/89093/elife-89093-fig7-data2-v1.zip
Figure 7—figure supplement 1
Traces from individual neuron ex vivo slice recordings.
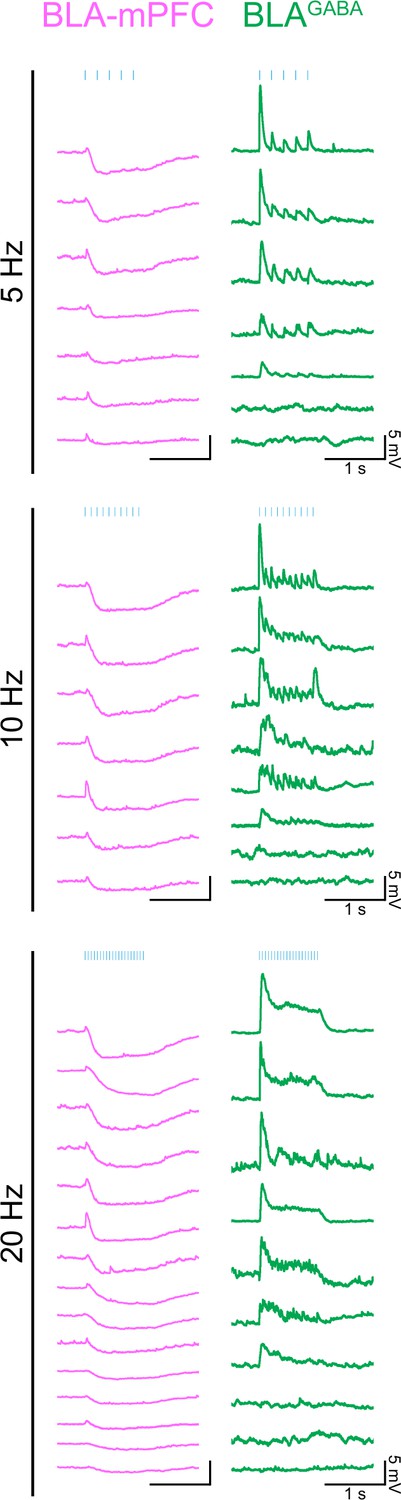
Sample traces from individual BLA-mPFC projector neurons (left, magenta) and BLAGABA (right, green) neurons showing membrane potential responses to 1 s of 5 ms pulses of 470 nm light delivered at 5, 10, or 20 Hz in current clamp. In some cells, photostimulation generated action potentials qualifying them as responsive; however, an excitatory postsynaptic potential (EPSP) amplitude could not be derived. Of BLA-mPFC projector neurons, 19/19 were qualitatively determined to be responsive. Of BLAGABA neurons, 20/23 were responsive.
Tables
Key resources table
| Reagent type (species) or resource | Designation | Source or reference | Identifiers | Additional information |
|---|---|---|---|---|
| Strain, strain background (Mus musculus) | B6N.ChAT-IRES-Cre | Jackson Laboratory | IMSR_JAX:018957 | |
| Strain, strain background (M. musculus) | B6.Cg-Slc32a1tm1.1(flpo)Hze/J | Jackson Laboratory | IMSR_JAX:029591 | |
| Strain, strain background (M. musculus) | C57BL/6NJ | Jackson Laboratory | IMSR_JAX:005304 | |
| Strain, strain background (AAV) | AAV5-EF1a-DIO-hChR2(H134R)-eYFP | UNC Vector Core | AV4313X | |
| Strain, strain background (AAV) | AAV5-EF1a-DIO-eYFP | UNC Vector Core | AV4310G | |
| Strain, strain background (AAV) | AAVDJ-EF1a-DIO-GCaMP6s | Stanford Vector Core | 2612 | |
| Strain, strain background (AAV) | AAV5-Syn-FLEX-rc [ChrimsonR-tdTomato] | Addgene | 62723-AAV5 | |
| Strain, strain background (AAV) | AAV1-CAG-FLEX-tdTomato | UNC Vector Core | AAV-CAG-FLEX-tdTomato | |
| Strain, strain background (AAV) | AAV9-hSyn-Ach4.3 (h-A06) | ViGene | h-A06 | |
| Chemical compound | Tetrodotoxin | Tocris | 4368-28-9 | |
| Chemical compound | 4-Aminopyridine | Sigma-Aldrich | 504-24-5 | |
| Chemical compound | Scopolamine | Sigma-Aldrich | S0929-1G | |
| Chemical compound | Mecamylamine hydrochloride | Sigma-Aldrich | M9020-5MG | |
| Chemical compound | Methyllycaconitine citrate salt | Sigma-Aldrich | M168-5MG | |
| Chemical compound | Dihydro-ß-erythroidine | Tocris | 2349 | |
| Chemical compound | VECTASHIELD HardSet Antifade Mounting Medium with DAPI | VectorLabs | H-1500 | Mounting medium |
| Antibody | Anti-goat-Alexa Fluor 647 (donkey polyclonal) | Jackson ImmunoResearch | 705-605-147 | 1:500 |
| Antibody | Anti-choline acetyltransferase (goat polyclonal) | EMD Millipore | AB144P-1ML | 1:100/1:200 |
| Chemical compound | Buprenorphine hydrochloride | MIT Veterinary Pharmacy | NDC 12496-0757-5 | Analgesic |
| Software | MATLAB | MathWorks | https://www.mathworks.com/ | |
| Software | R | R Foundation for Statistical Computing | http://www.R-project.org/ | |
| Software | Adobe Illustrator | Adobe | https://www.adobe.com/products/illustrator.html | |
| Software | Offline Sorter | Plexon | https://plexon.com/products/offline-sorter/ | |
| Software | Ethovision XT | Noldus | https://www.noldus.com/ethovision-xt | |
| Software | pClamp 10.4 software | Molecular Devices | https://www.moleculardevices.com/products/axon-patch-clamp-system/acquisition-and-analysis-software/pclamp-software-suite | |
| Other | Optic fiber | Thorlabs | TS1843490 | See ‘General stereotaxic surgery methods’ |
| Other | Ferrules | Kientec Systems | FSS-LC-330 | See OFT, RTPP tests in ‘Materials and methods’ |
| Other | Small animal stereotaxic frame | David Kopf Instruments | Model 942 | See ‘General stereotaxic surgery methods’ |
| Other | USB cameras | ELP | ELP-USBFHD01M-RL36 | See ‘ Pupillometry’ |
| Other | 0.10 mL Microsyringe | World Precision Instruments | NANOFIL-NF33BL-2 | See ‘General stereotaxic surgery methods’ |
| Other | Microsyringe Pump UMP3 and Controller Micro4 | World Precision Instruments | UMP3-3 | See ‘General stereotaxic surgery methods’ |
| Other | Peristaltic pump for ex vivo recordings | Minipuls 3 Gilson | F155001 | See ‘Ex vivo electrophysiology recordings’ |
| Other | Miniature Inert Liquid Solenoid Valve | Parker Hannifin | 003-0218-900 | See ‘ Behavioral system control’ |
| Other | ATmega328 Arduino | Digi-Key Electronics | 1050-1001-ND | See ‘Head-fixed behavioral and optogenetic equipment’ |
| Other | Speaker | Digi-Key Electronics | GF0401M-ND | See ‘Cued tone task methods’ |
| Other | Laser Shutter Heads | Stanford Research Systems | SR475 | See ‘Optogenetic photostimulation of basal forebrain cholinergic neurons during head-fixed behavior’ |
| Other | Rotary Encoder | US Digital | E2-200-250-NE-D-D-B | See ‘Treadmill’ |
| Other | Multifunction I/O Device | National Instruments | USB-6211 | See ‘General stereotaxic surgery methods’ |
| Other | Pulse stimulator | A.M.P.I. | Master-8 | See ‘Optogenetic photostimulation of basal forebrain cholinergic neurons during head-fixed behavior’ |
| Other | 5 mm White LED | Digi-Key Electronics | C513A-WSN-CY0Z0341-ND | See ‘Head-fixed behavioral and optogenetic equipment’ |
| Other | Electrodes: 22.9 µm nichrome wire | California Fine Wire | Stablohm 675 | See ‘In vivo electrophysiology recordings’ |
| Other | Gold Non-Cyanide | Sifco asc | 80535500 | See ‘In vivo electrophysiology recordings’ |
| Other | Open Ephys Acquisition Board | Open Ephys | C3324 | See ‘In vivo electrophysiology recordings’ |
| Other | HM430 Microtome | Thermo Fisher Scientific | 910010 | See ‘In vivo electrophysiology histology,’ ‘Ex vivo electrophysiology histology,’ ‘Immunohistochemistry’ |
| Other | Confocal Laser-Scanning microscope | Olympus | FV1000 | See ‘In vivo electrophysiology histology,’ ‘Ex vivo electrophysiology histology,’ ‘Immunohistochemistry’ |
| Other | Diode Blue 473 nm Laser | OptoEngine LLC | MBL-III-473/1-100mW | See ‘Optogenetic photostimulation of basal forebrain cholinergic neurons during head-fixed behavior, OFT, RTPP’ |
| Other | Horizontal puller for glass microelectrodes for ex vivo recordings | Sutter | P-1000 | See ‘Ex vivo electrophysiology recordings’ |
| Other | Multiclamp amplifier for ex vivo recordings | Molecular Devices | 700B | See ‘Ex vivo electrophysiology recordings’ |
| Other | Microscope for ex vivo recordings | Olympus | BX51 | See ‘Ex vivo electrophysiology recordings’ |
Additional files
Download links
A two-part list of links to download the article, or parts of the article, in various formats.
Downloads (link to download the article as PDF)
Open citations (links to open the citations from this article in various online reference manager services)
Cite this article (links to download the citations from this article in formats compatible with various reference manager tools)
Reward contingency gates selective cholinergic suppression of amygdala neurons
eLife 12:RP89093.
https://doi.org/10.7554/eLife.89093.2


