Mouthparts of the bumblebee (Bombus terrestris) exhibit poor acuity for the detection of pesticides in nectar
- Department of Biology, University of Oxford, United Kingdom
- Department of Life Sciences, Imperial College, United Kingdom
Figures
Figure 1 with 2 supplements
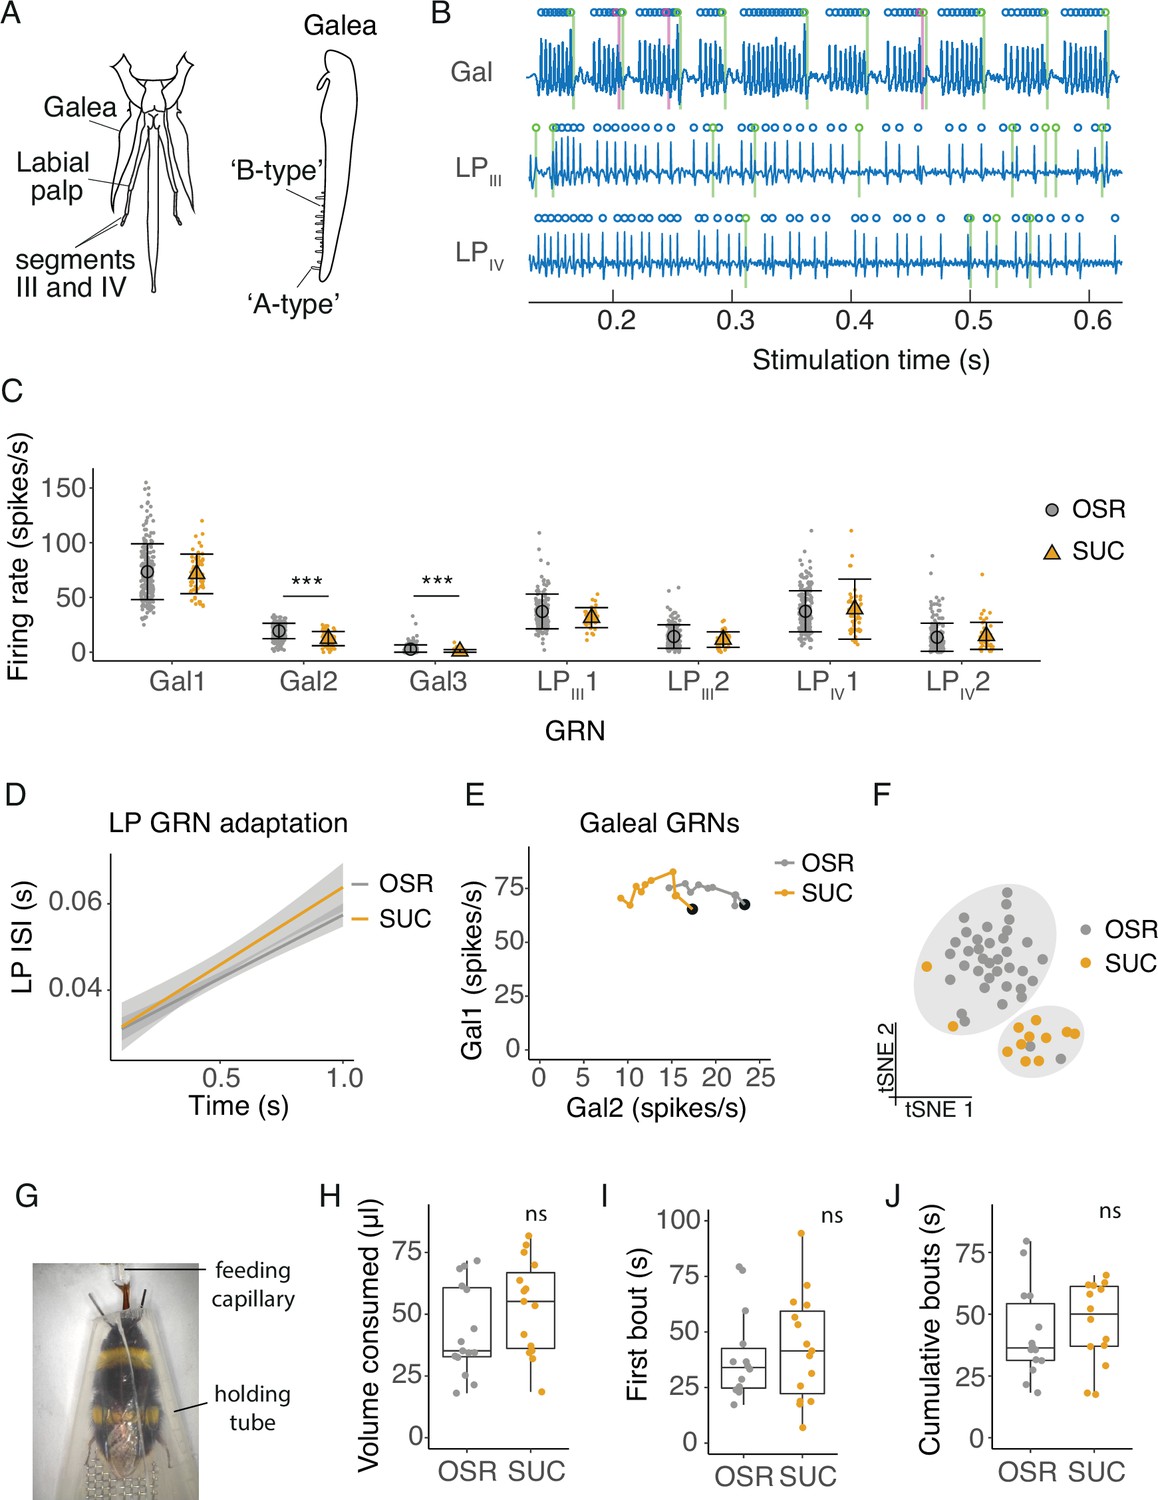
Electrophysiological and behavioural responses to sucrose and oilseed rape (OSR) nectar.
(A) Diagram of the bumblebee’s mouthparts from which tip-recordings were made, including the galea, and segments III and IV of the labial palps. Tip-recordings were made from the longer ‘A-type’ sensilla. (B) Filtered electrophysiological recordings from galeal (Gal), labial palp segment III (LPIII), and labial palp segment IV (LPIV) sensilla. Spikes from GRN 1 at each location are labeled with blue circles, GRN 2 spikes in green, and GRN 3 spikes in magenta (only two GRNs present in labial palp recordings). (C) Average firing rates of GRNs from sensilla on the galea (Gal), segment III of the labial palps (LPIII), and segment IV (LPIV) over 1 s of stimulation with 10% OSR or an equimolar (0.173 M) sucrose solution (SUC, n=315 sensilla from 37 bees). Mean and standard deviation illustrated with black symbols and bars, individual sensillum responses shown with coloured points. Asterisks represent significant differences between SUC and OSR (***, p < 0.0001). (D) Linear regression of inter-spike intervals per 0.1 s bin of labial palp GRNs versus time. Slope of regression is the adaptation rate and shading is standard error. There was no significant difference between the adaptation rate when stimulated with OSR versus SUC. (E) Firing rates of Gal1 versus Gal2 over 1 s stimulation with 10% OSR and SUC. Points represent mean rate in each 100 ms bin across all trials. A black marker highlights the first bin (i.e. time = 100ms). Post hoc comparisons showed that Gal2 firing rates were significantly different between stimuli. (F) t-SNE of all GRN responses for each animal following stimulation with OSR (gray) or SUC (orange) and k-means clusters (k=2, predicted by Monte Carlo reference-based consensus clustering) in gray shading. (G) Image of an untethered bumblebee in a holding tube feeding from a capillary in the 2-min feeding assay. (H) Total volume consumed of 1.79 M SUC or 100% OSR of freely moving bumblebees during 2 min (n = 15 bees per group). (I) The duration of the first feeding bout duration of bumblebees feeding on SUC or OSR. (J) The cumulative duration of feeding bouts within a 2-min period. For H-J, boxes show 25th, 50th and 75th percentile with 1.5x interquartile range (IQR) whiskers, with data from individual bees as coloured circles.
Figure 1—figure supplement 1
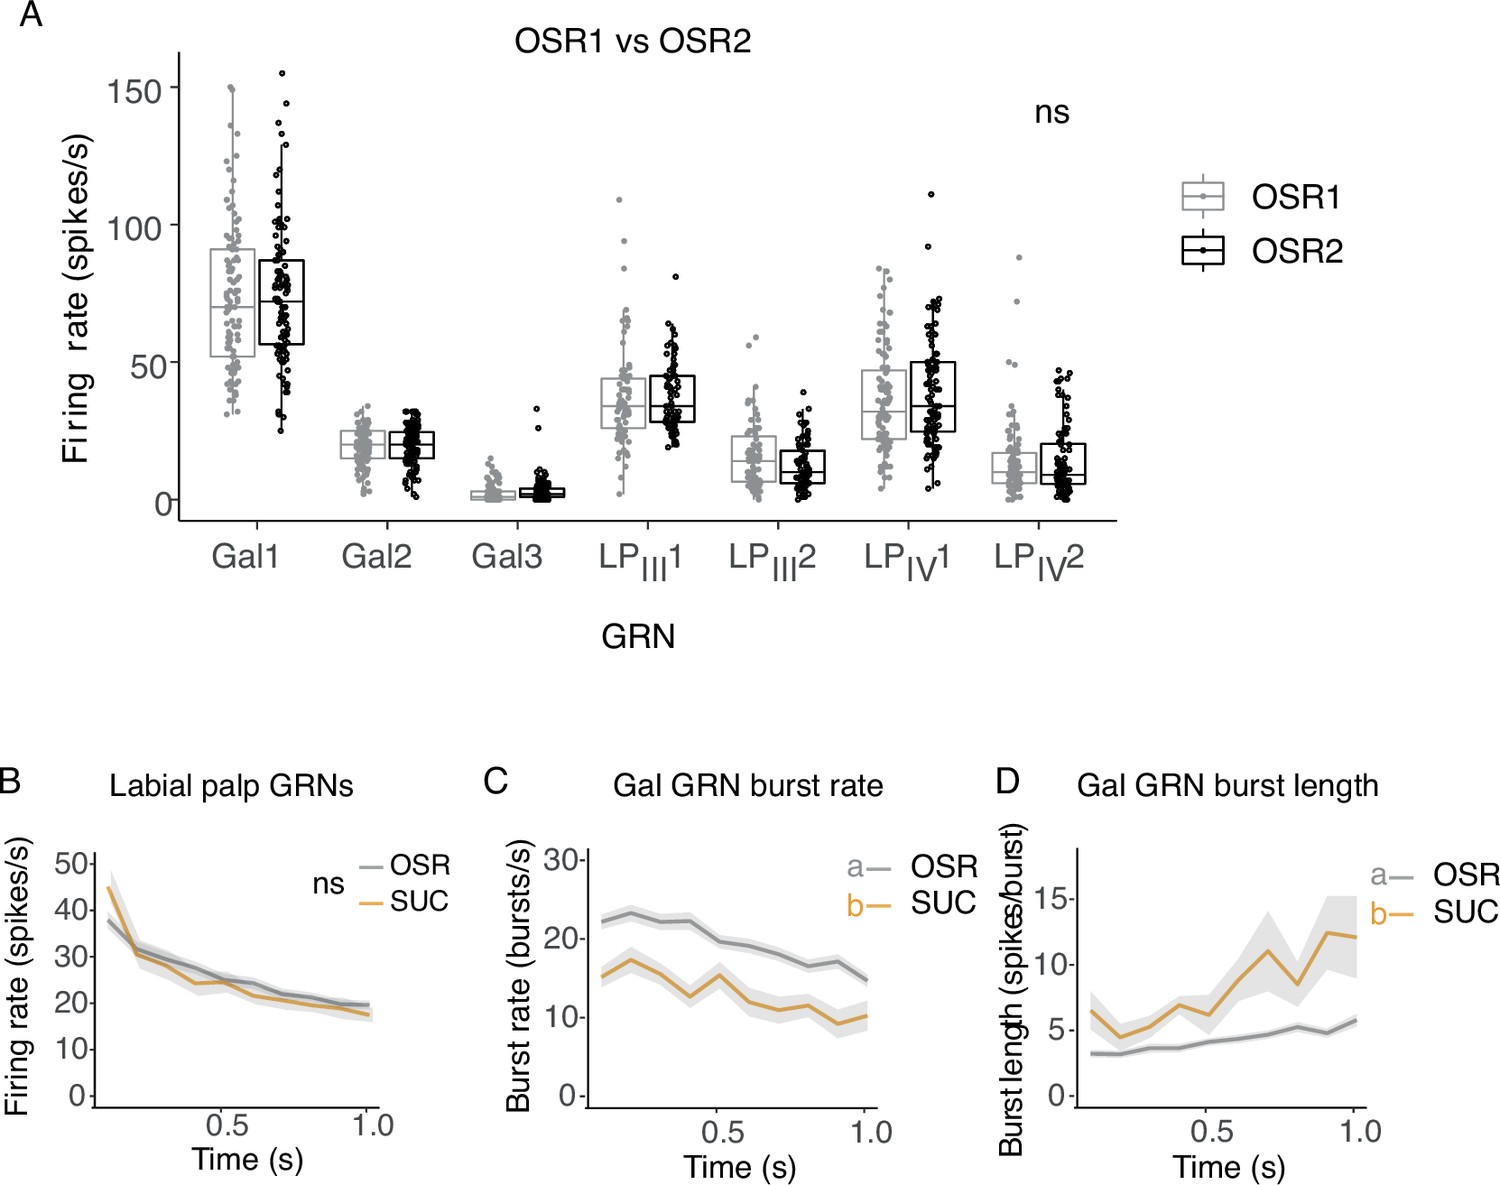
Electrophysiological responses to OSR.
(A) Electrophysiological responses of GRNs were tested using a control solution of 10% OSR at the beginning and end of each session to ensure that the pesticides were not damaging the GRNs and that the responses remained stable. There were no differences in GRN responses to the first and last stimulations with OSR on any GRN (LME, stimulus: F1,1267=0.1145, p=0.735, GRN: F6,1267=569.98, p<0.0001, n=315 sensilla from 37 bees). Boxes show 25th, 50th and 75th percentile with 1.5x IQR whiskers, with data from individual bees as coloured circles.(B) Labial palp GRN firing rate histogram over 1 s stimulation with OSR or SUC with mean (line) and standard error of the mean shading. There was no significant difference in labial palp GRN responses (n=12 bees, LME, F1,462=2.08, p=0.150). (C) Bursting rate histogram in 0.1 s bins following stimulation with OSR or SUC, with SEM in gray shading (n=12 bees, LME, F1,469=150, p<0.0001). (D) Average burst length (number of Gal1 spikes per burst) per 0.1 s bin following stimulation with OSR or SUC, with SEM in gray shading (n=12 bees, LME, F1,487=94.4, p<0.0001).
Figure 1—figure supplement 2
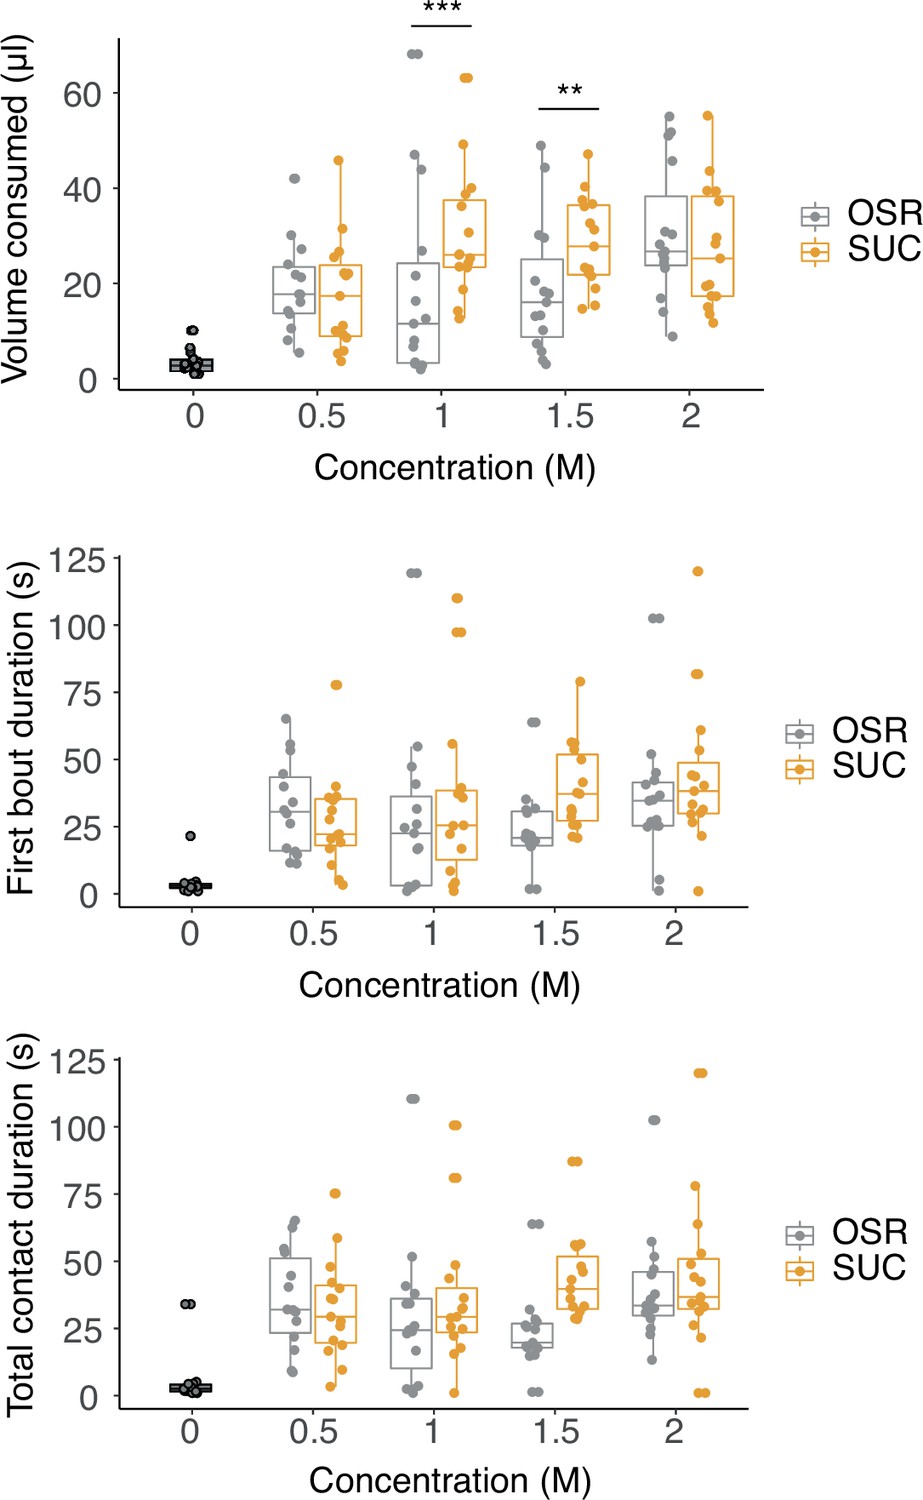
OSR and sucrose concentration gradients.
Feeding behaviour over 2 min was recorded using a range of sucrose and OSR concentrations (0, 0.5, 1.0, 1.5, and 2.0 M). Volume consumed (A, stimulus*concentration: F4,133=4.51, p=0.0019), first bout duration (B, stimulus: F1,136=2.05, p=0.16; concentration: F4,138=27.5, p<0.0001), and cumulative contact duration (C, stimulus: F1,137=2.20, p=0.14; concentration: F4,138=40.4, p<0.0001) did not differ between stimuli, n=15 bees per stimulus. For A-C, boxes show 25th, 50th and 75th percentile with 1.5x IQR whiskers, with data from individual bees as coloured circles.
Figure 2 with 1 supplement
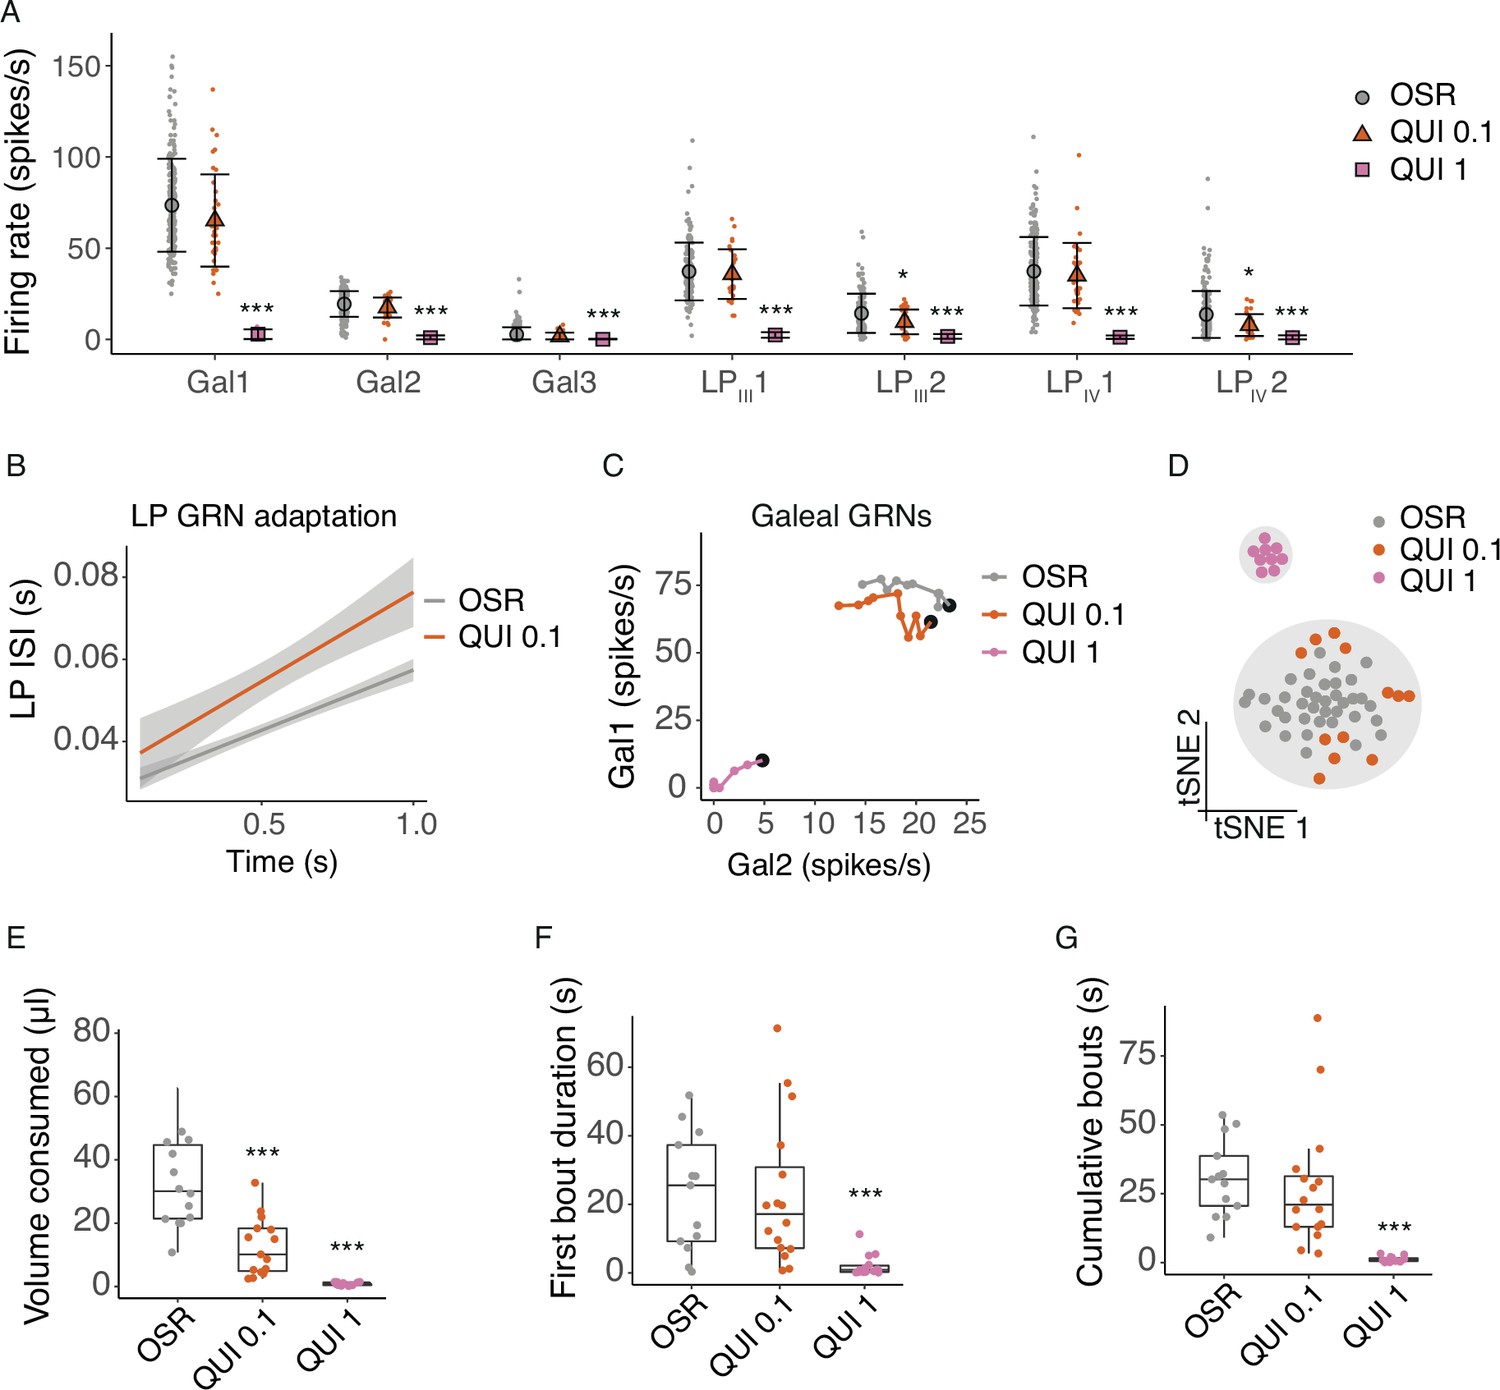
Quinine shuts down GRN and behavioural responses to sugars.
(A) Average firing rates of 7 GRNs from the galea (Gal), and labial palps (LPIII, LPIV) over a 1 s stimulations with 10% OSR (OSR), 10% OSR plus 0.1 mM quinine (QUI 0.1), and 10% OSR plus 1 mM quinine (QUI 1). Mean and standard deviation illustrated with black symbols and bars, responses of individual sensilla shown with coloured points (n = 55 sensilla from 17 bees). Asterisks represent significant differences between stimulus and OSR (*, <0.05; ** <0.001; ***, <0.0001). (B) Linear regressions of inter-spike intervals per 0.1 s bin of labial palp GRNs versus time illustrating the adaptation rate, with SEM in grey shading. The addition of 0.1 mM QUI to OSR significantly affected labial palp adaptation. 1 mM QUI not shown as there was insufficient spiking to calculate adaptation. (C) Firing rates of Gal1 versus Gal2 over 1 s stimulation. Points represent mean rate in each 100ms bin across all trials. A black marker highlights the first bin (i.e. time = 100 ms). Post hoc comparisons showed that only Gal1 (not Gal2) firing rates were significantly different at 0.1 mM QUI, while both were affected by 1.0 mM QUI. (D) t-SNE of all GRN responses for each animal following stimulation with 10% OSR, QUI 0.1 or QUI 1, and k-means clusters (k=2, predicted by Monte Carlo reference-based consensus clustering) in gray shading. (E) Volume consumed by freely-moving bumblebees of 100% OSR, OSR plus 0.1 mM QUI, or OSR plus 1 mM QUI over a 2 min period (n = 15 bees/group). Asterisks denote results of Dunnett’s test (***, p<0.0001). (F) First bout duration when feeding on OSR, QUI 0.1 or QUI 1 (n=15 bees/group). Asterisks denote results of Dunnett’s test (***, p<0.0001). (G) Cumulative bout duration over a 2 min period of bumblebees feeding on OSR, QUI 0.1 or QUI 1 (n=15 bees/group). Asterisks denote results of Dunnett’s test (***, p<0.0001). For E-G, boxes show 25th, 50th and 75th percentile with 1.5x IQR whiskers, with data from individual bees as coloured circles.
Figure 2—figure supplement 1
Temporal responses of GRNs to quinine.
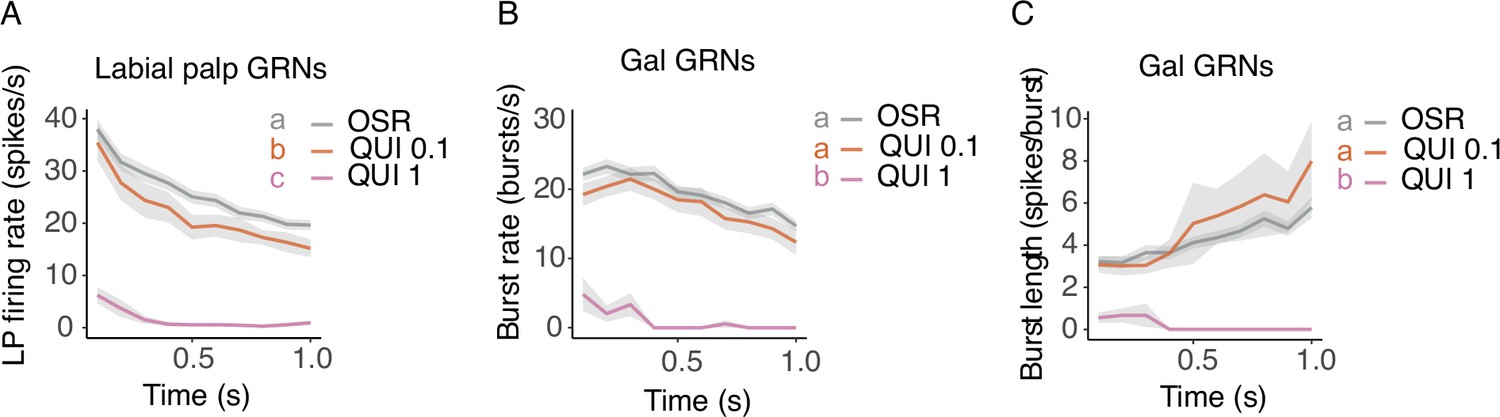
(A) Firing rate histogram showing the average firing rate of labial palp GRNs in 0.1 s bins following stimulation with 10% OSR, QUI 0.1 or QUI 1, with standard error of the mean (SEM) in gray shading (n = 55 sensilla from 17 bees, LME, stimulus F2,554=576 p<0.0001). Results from estimated marginal means post hoc tests denoted by letters. (B) Bursting rate histogram in 0.1 s bins following stimulation with 10% OSR, QUI 0.1 or QUI 1, with SEM in gray shading (n=12 bees, F2,563=500, P<0.0001). Results from estimated marginal means post hoc tests denoted by letters. (C) Average burst length (number of Gal1 spikes per burst) per 0.1 s bin following stimulation with 10% OSR, QUI 0.1 or QUI 1, with SEM in gray shading (n=12 bees, LME F2,574=97.9, P<0.0001). Results from estimated marginal means post hoc tests denoted by letters.
Figure 3 with 2 supplements
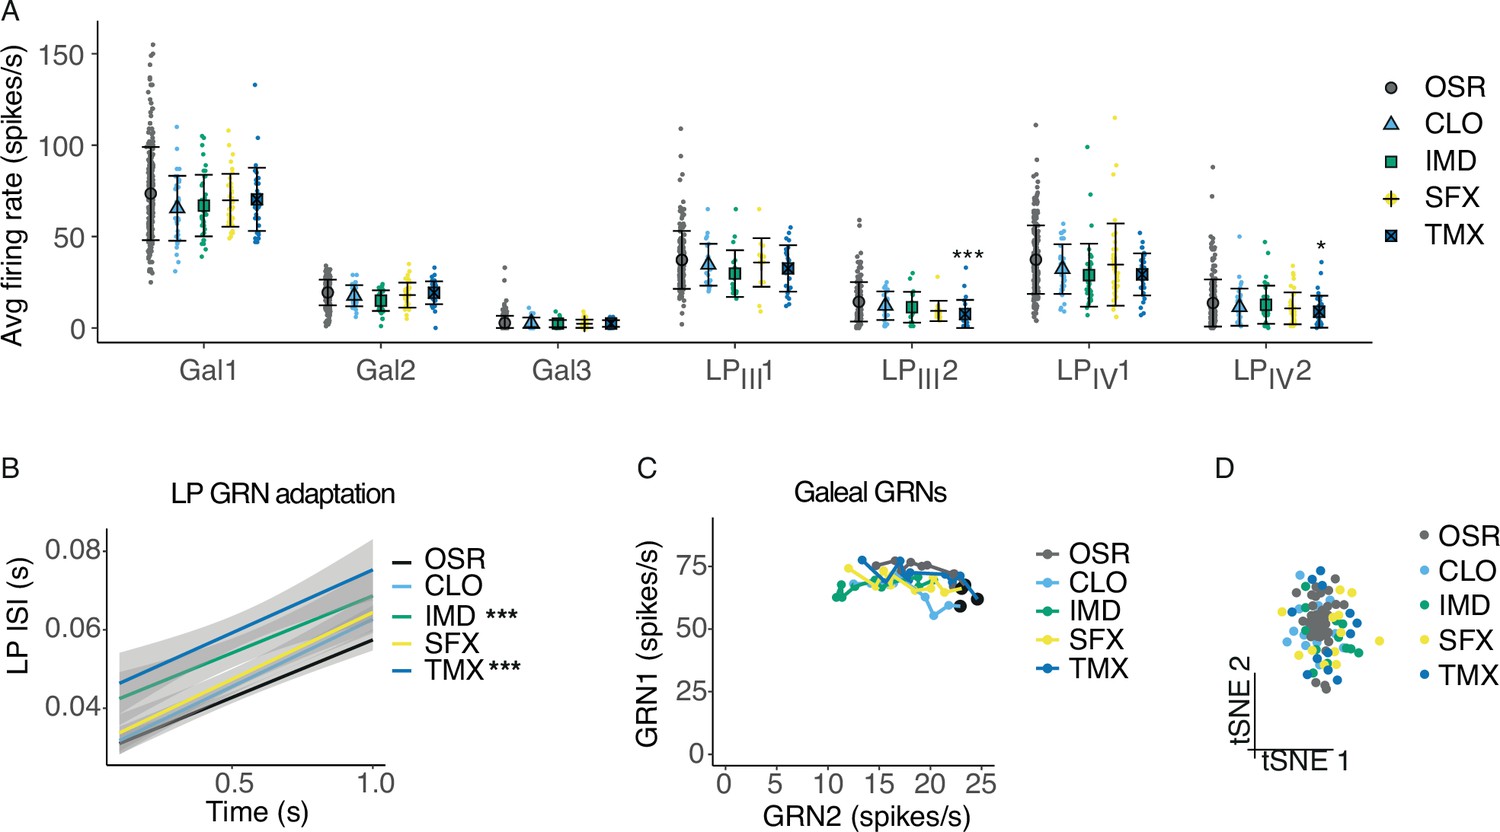
Pesticides affect the temporal code of bumblebee GRNs.
(A) Average firing rates of 7 GRNs from the galea (Gal) and labial palps (LPIII, LPIV) over a 1 s stimulation with 10% OSR (OSR), or OSR plus 0.1 mM clothianidin (CLO), imidacloprid (IMD), sulfoxaflor (SFX), or thiamethoxam (TMX, n = 331 sensilla from 37 bees). Mean and standard deviation illustrated with black bars, and data shown with coloured points. Asterisks represent significant differences between stimulus and OSR (*, <0.05; ** <0.001; ***, <0.0001). (B) Linear regressions of inter-spike intervals per 0.1s bin of labial palp GRNs versus time illustrating the adaptation rate, with SEM in grey shading. Asterisks represent significant differences between stimulus and OSR (*** p<0.0001). (C) Firing rates of Gal1 versus Gal2 over 1 s stimulation. Points represent mean rate in each 100 ms bin across all trials. A black marker highlights the first bin (i.e., time = 100 ms). Post hoc comparisons showed that only Gal1 firing rates were significantly different for CLO and IMD versus OSR, and Gal2 firing rates were affected by IMD only. (D) t-SNE of all GRN responses for each animal following stimulation with OSR, CLO, IMD, SFX, or TMX. Monte Carlo reference-based consensus clustering predicted an optimal cluster count of k=1 on the t-SNE.
Figure 3—figure supplement 1
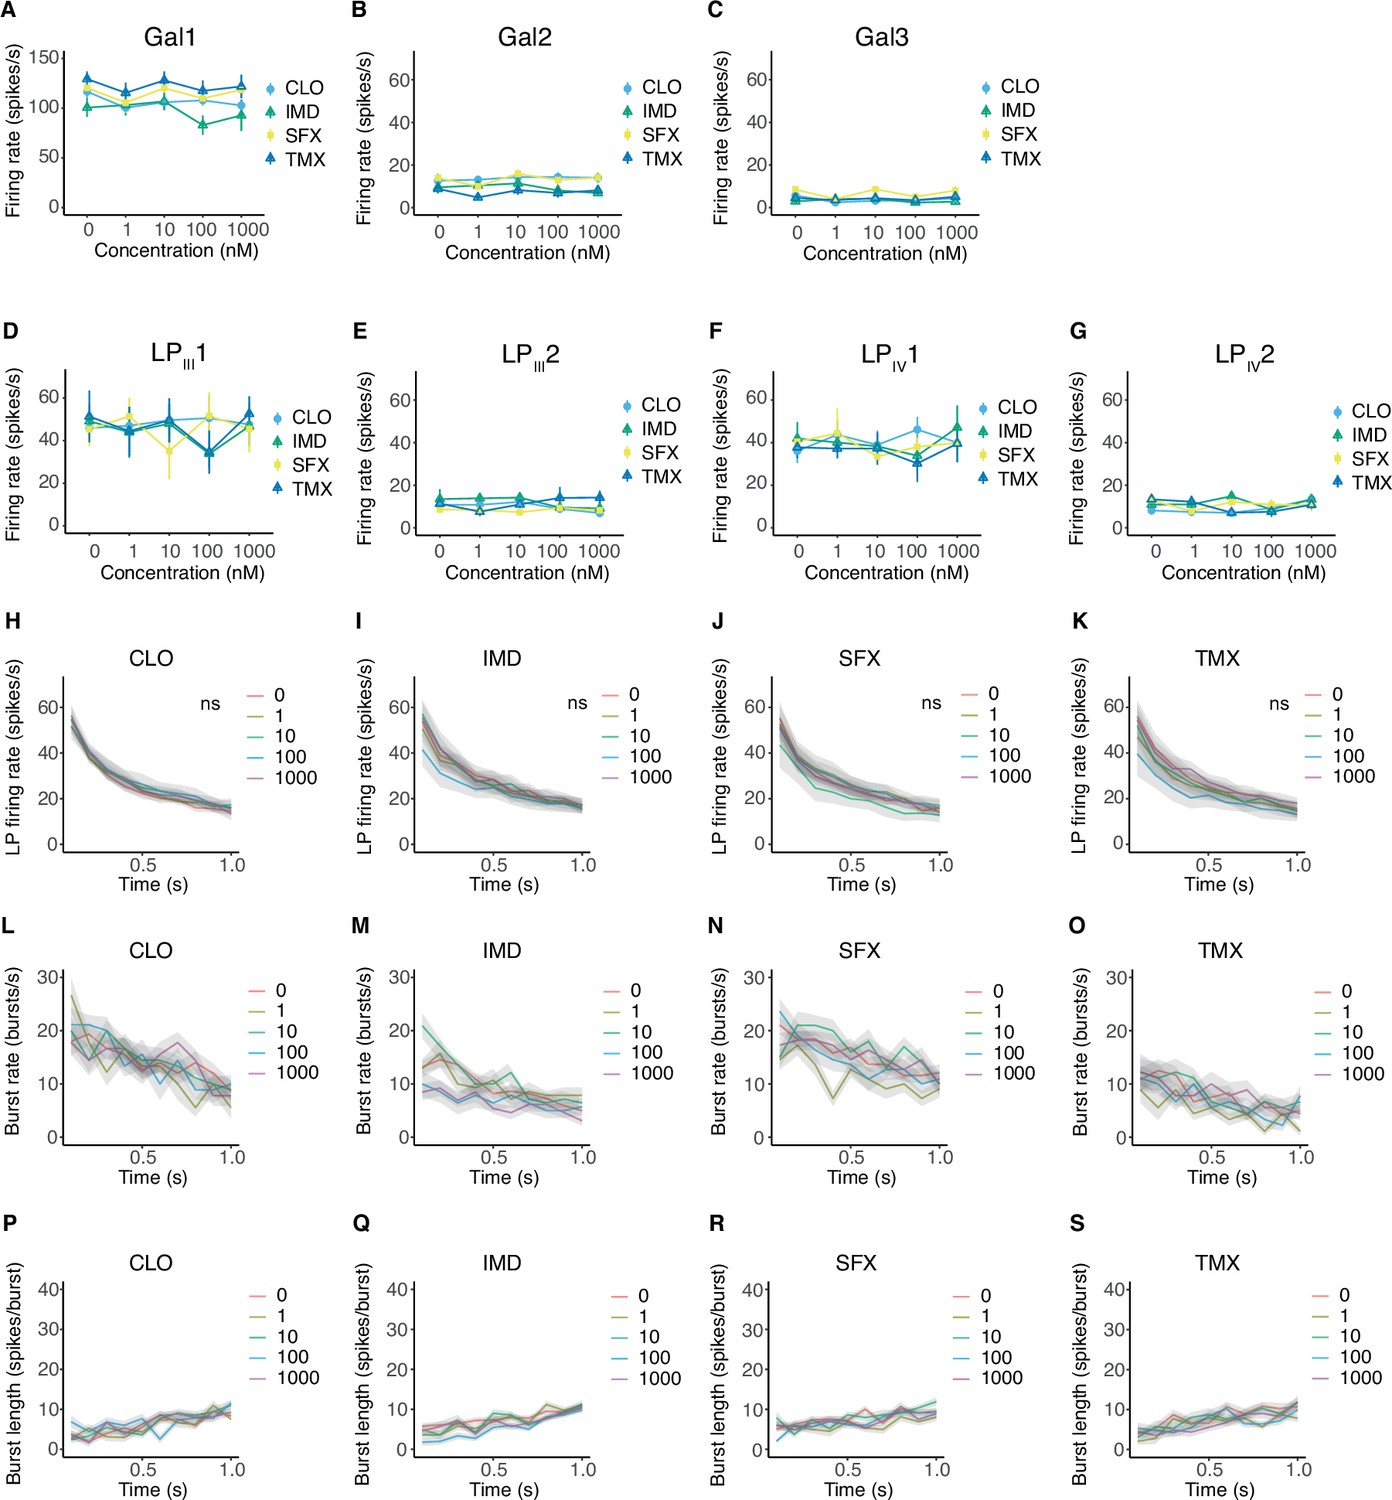
Galeal and labial palp GRN cannot detect low concentrations of pesticides in nectar.
(A–G) Average firing rate over 1 s of galeal and labial palp GRNs across a concentration gradient of pesticides mixed with a 10% dilution of OSR. Galeal GRN1 plots show mean + standard error. There was no significant effect of concentration on GRN firing across locations (F1,2727=0.51, p=0.48, n=18–28 sensilla per stimulus) while there was a significant interaction between stimulus type and GRN (F18,2716=8.22, p<0.0001). Post hoc estimated marginal means revealed significant differences of galeal GRN2 and GRN3 firing rates between stimuli. (H–K) Firing rate histograms of labial palp GRNs in 100ms bins over 1 s of stimuluation with CLO (H, concentration: F1,832=1.95, p=0.16; time: F1,832=0.11, p=0.74, n=18), IMD (I, concentration: F1,823=3.55, p=0.064; time: F1,823=696.67, p<0.0001, n=28), SFX (J, concentration: F1,863=0.51, p=0.48; time: F1,863=645.44, p<0.0001, n=22) TMX (K, concentration: F1,833=0.32, p=0.57; time: F1,833=635.30, n=18). (L–O) Burst rate (GRN2 rate) histograms over 1 s of stimulation were not affected by CLO (L, concentration: F1,832=1.947, p=0.163; time: F1,832=493.36, p<0.0001, n=18), IMD (M, concentration: F1,823=3.435, p=0.0642; time: F1,823=696.67, p<0.0001, n=28), SFX (N, concentration: F1,863 = 0.507, p=0.477; time: F1,823=645.44, p<0.0001, n=22), and TMX (O, concentration: F1,833=0.318, p=0.573; time: F1,833=635.03, p<0.0001, n=18). (P–S) The number of GRN1 spikes per burst was affected by imidacloprid but not other pesticides (P, CLO, concentration: F1,1011=3.05, p=0.0811; time: F1,1011=6.99, p=0.0083, n=18, Q, IMD, concentration: F1,1529=12.82, p=0.00035; time: F1,1529=33.88, p<0.0001, n=28, R, SFX, concentration: F1,1231=1.83, p=0.18; time: F1,1231=0.47, p=0.0012, n=22, S, TMX, concentration: F1,1231=1.83, p=0.18; time: F1,1231=0.47, p=0.0012, n=18).
Figure 3—figure supplement 2
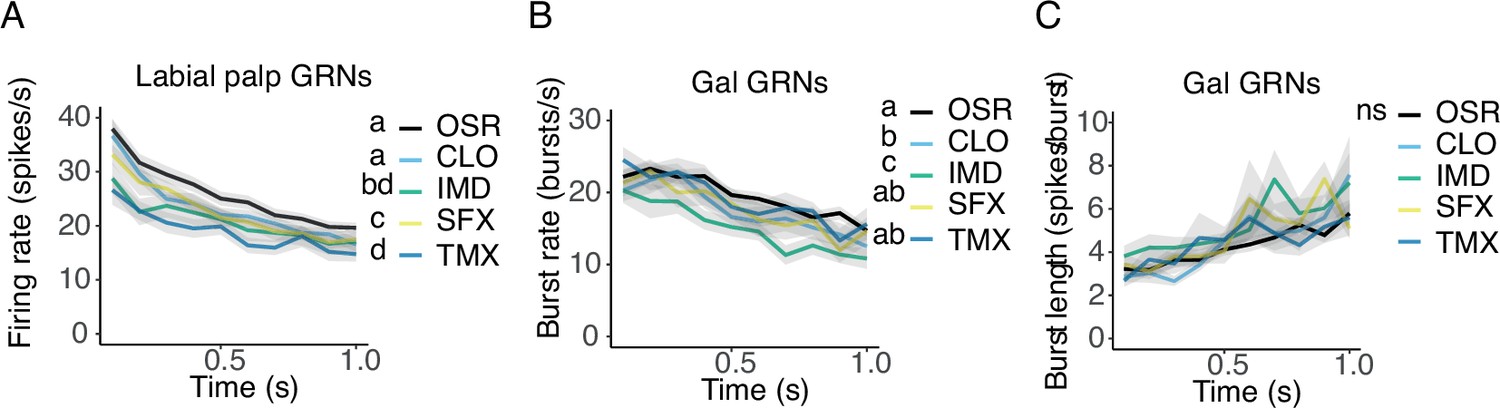
Temporal responses of GRNs to high concentrations of pesticides.
(A) Firing rate histogram showing the average firing rate of labial palp GRNs in 0.1 s bins following stimulation with OSR, CLO, IMD, SFX, or TMX, with standard error of the mean (SEM) in gray shading (n=12 bees, LME, stimulus: F4,817=44.2, p<0.0001; time: F1,808=884, p<0.0001). Results from estimated marginal means post hoc tests denoted by letters. (B) Bursting rate histogram in 0.1 s bins following stimulation with OSR, CLO, IMD, SFX, or TMX, with SEM in gray shading (n=12 bees, LME, stimulus: F4,825=13.3, p<0.0001; bin: F1,808=401, p<0.0001). Results from estimated marginal means post hoc tests denoted by letters. (C) Average burst length (number of Gal1 spikes per burst) per 0.1 s bin following stimulation with OSR, CLO, IMD, SFX, or TMX, with SEM in gray shading (n=12 bees, LME, stimulus: F4,841=1.69, p=0.150; time: F4,841=1.69, p=0.150). Results from estimated marginal means post hoc tests denoted by letters.
Figure 4
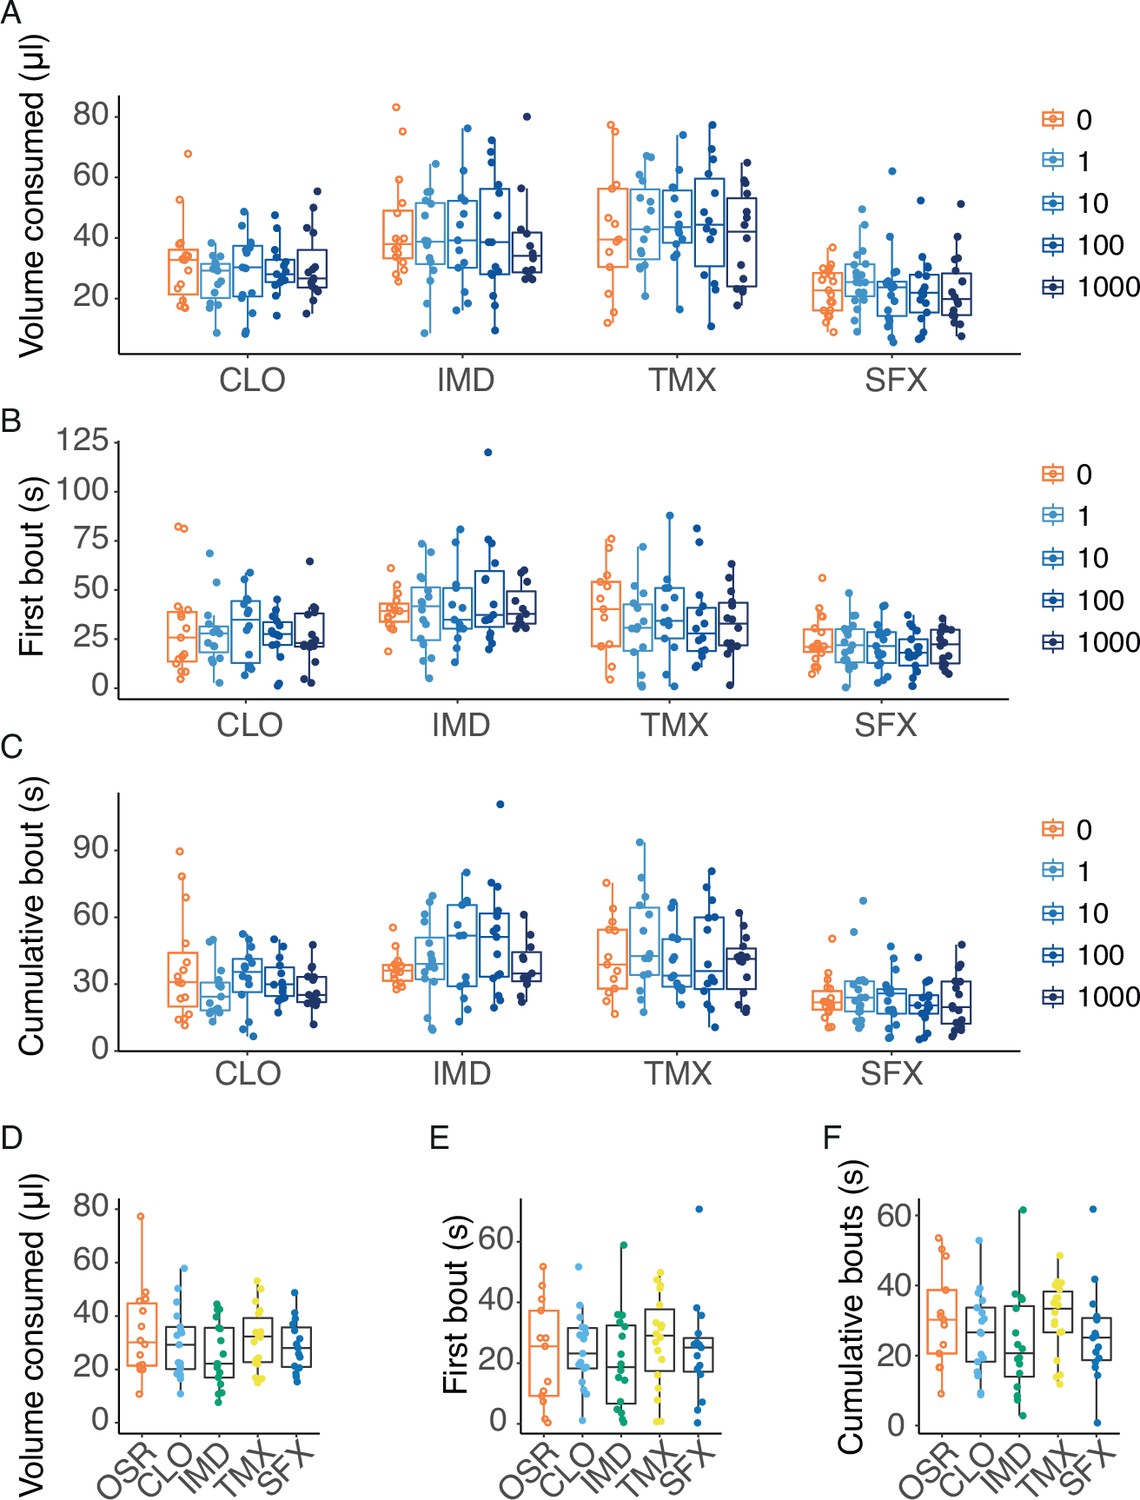
Bumblebees do not avoid consuming pesticides in nectar at field relevant concentrations.
(A) The total volume consumed by freely moving bumblebees during 2 min of 100% OSR solutions containing increasing concentrations (nM) of CLO, IMD, TMX and SFX (n=15 bees per group). (B) First feeding bout duration of OSR mixtures with increasing concentrations (nM) of pesticides (CLO, IMD, SFX, TMX, n=15 bees per group). (C) Cumulative feeding duration during 2 min of OSR mixtures with increasing concentrations (nM) of pesticides (n=15 bees per group). (D) Total volume consumed of OSR or OSR plus 0.1 mM CLO, IMD, TMX or SFX over 2 min by freely moving bumblebees (n=15 bees per group). (E) First bout duration of bumblebees feeding on OSR and OSR mixed with 0.1 mM pesticides (n=15 bees per group). (F) Cumulative bout duration over 2 min by bees feeding on OSR and OSR mixed with 0.1 mM pesticides (n=15 bees per group). Boxes show 25th, 50th and 75th percentile with 1.5x IQR whiskers, with data from individual bees as coloured circles.
Additional files
Download links
A two-part list of links to download the article, or parts of the article, in various formats.
Downloads (link to download the article as PDF)
Open citations (links to open the citations from this article in various online reference manager services)
Cite this article (links to download the citations from this article in formats compatible with various reference manager tools)
Mouthparts of the bumblebee (Bombus terrestris) exhibit poor acuity for the detection of pesticides in nectar
eLife 12:RP89129.
https://doi.org/10.7554/eLife.89129.3


