Lactate transporter MCT1 in hepatic stellate cells promotes fibrotic collagen expression in nonalcoholic steatohepatitis
- Program in Molecular Medicine, University of Massachusetts Chan Medical School, United States
- RNA Therapeutics Institute, University of Massachusetts Chan Medical School, United States
- Department of Neurology, Johns Hopkins School of Medicine, United States
Figures
Figure 1

MCT1 depletion attenuates transforming growth factor 1β (TGF-β1)-stimulated collagen 1 production in human LX2 stellate cells.
Cells were transfected with either NTC-siRNA or MCT1-siRNA for 6 hr. Then, cells were maintained in serum-starved media with or without 10 ng/ml of recombinant human TGF-β1 for 48 hr and harvested. (A) SLC16A1/MCT1 mRNA expression levels. (B) Collagen 1 protein levels. Quantification was added below. (C) Representative fibrogenic marker genes, ACTA2, and COL1A1 expression levels were monitored (mean ± SD, t-test, one-way ANOVA, *: p<0.05, **: p<0.01, ***: p<0.001, ****: p<0.0001).
-
Figure 1—source data 1
MCT1 depletion attenuates transforming growth factor 1β (TGF-β1)-stimulated collagen 1 production in human LX2 stellate cells.
- https://cdn.elifesciences.org/articles/89136/elife-89136-fig1-data1-v1.zip
Figure 2
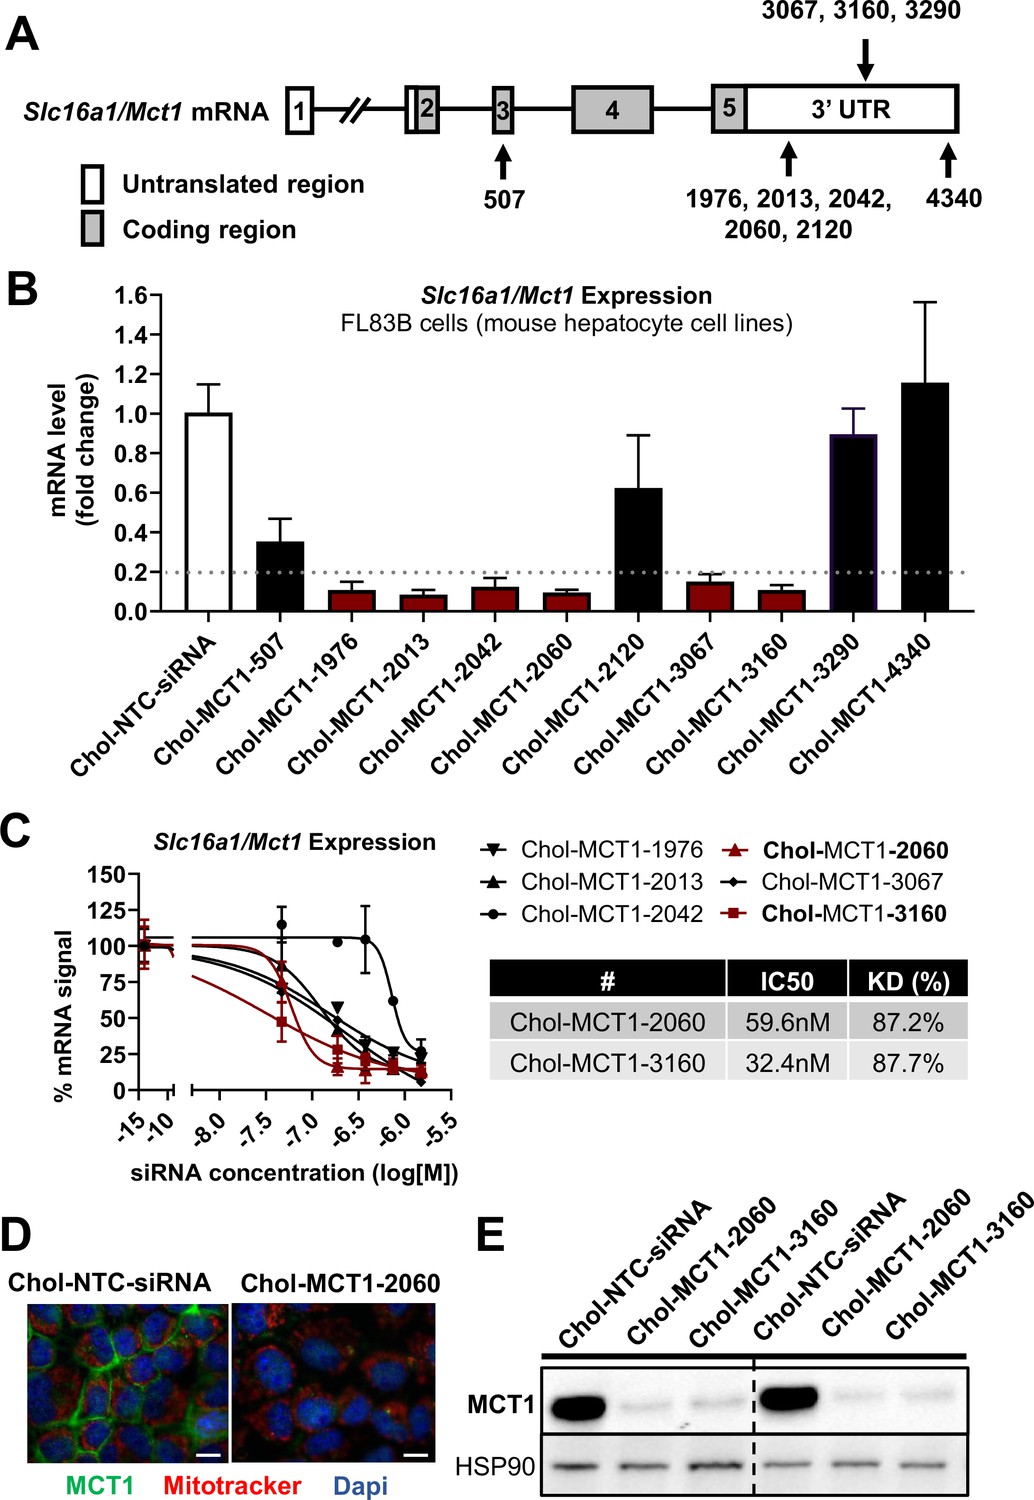
Screening of chemically modified Chol-MCT1-siRNA in vitro.
(A) Targeted regions of multiple Chol-MCT1-siRNA candidates on Slc16a1/Mct1 transcript. (B) Silencing efficacy of each Chol-MCT1-siRNA candidate (1.5 µM) on Slc16a1/Mct1 mRNA expression levels was monitored 72 hr after the treatment in mouse hepatocyte cell lines, FL83B in vitro. Chol-NTC-siRNA was used as a control (mean ± SD). (C) Dose-response potency test was performed to identify the most potent Chol-MCT1-siRNA compound. IC50 values were determined using six serially diluted concentrations of each compound starting from 1.5 µM (mean ± SD). IC50 values and knockdown % of the two most potent compounds were shown in the table below. (D) 72 hr after the treatment of Chol-MCT1-2060 compounds (1.5 µM), MCT1 protein expression levels were visually monitored by immunofluorescence (scale bar: 10 µm). (E) 72 hr after the treatment of either Chol-MCT1-2060 or Chol-MCT1-3160 compounds (1.5 µM), their silencing efficacy on MCT1 protein expression levels was examined by western blotting.
-
Figure 2—source data 1
Screening of chemically modified Chol-MCT1-siRNA in vitro.
- https://cdn.elifesciences.org/articles/89136/elife-89136-fig2-data1-v1.zip
Figure 3 with 1 supplement
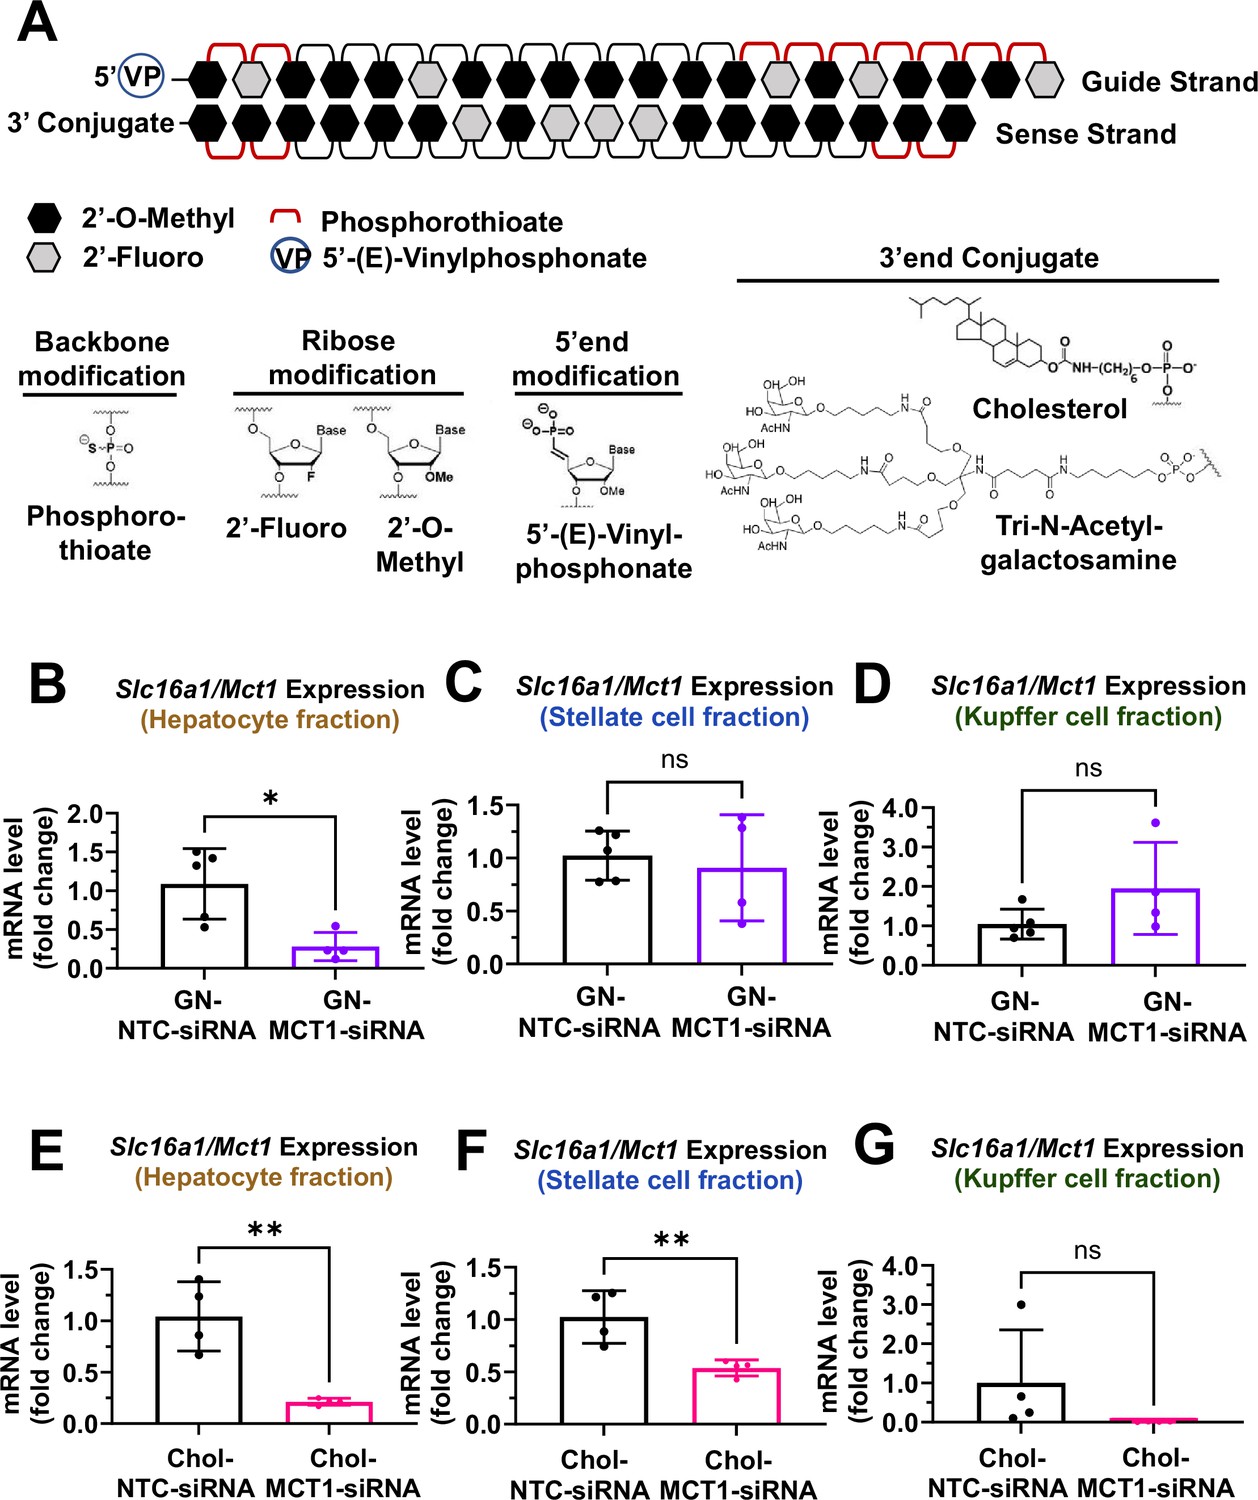
Biodistribution of Chol- and GN-MCT1-siRNA in the liver.
Male C57BL/6 wild-type mice (16–18 weeks, n=4) were subcutaneously injected with 10 mg/kg of each siRNA, twice within 15 days, while fed a chow diet. Mice were sacrificed on day 15. (A) Chemical structure of the fully chemically modified siRNA that was used for further in vivo studies: Chol-MCT1-siRNA and GN-MCT1-siRNA. (B, E) Primary hepatocytes, (C, F) stellate cells, and (D, G) Kupffer cells were isolated from each mouse using different gravity centrifugations and gradient solutions after the liver perfusion. Slc16a1/Mct1 mRNA expression levels in each cell-type fraction were measured (mean ± SD, t-test, *: p<0.05, **: p<0.01).
-
Figure 3—source data 1
Biodistribution of Chol- and GN-MCT1-siRNA in the liver.
- https://cdn.elifesciences.org/articles/89136/elife-89136-fig3-data1-v1.zip
Figure 3—figure supplement 1
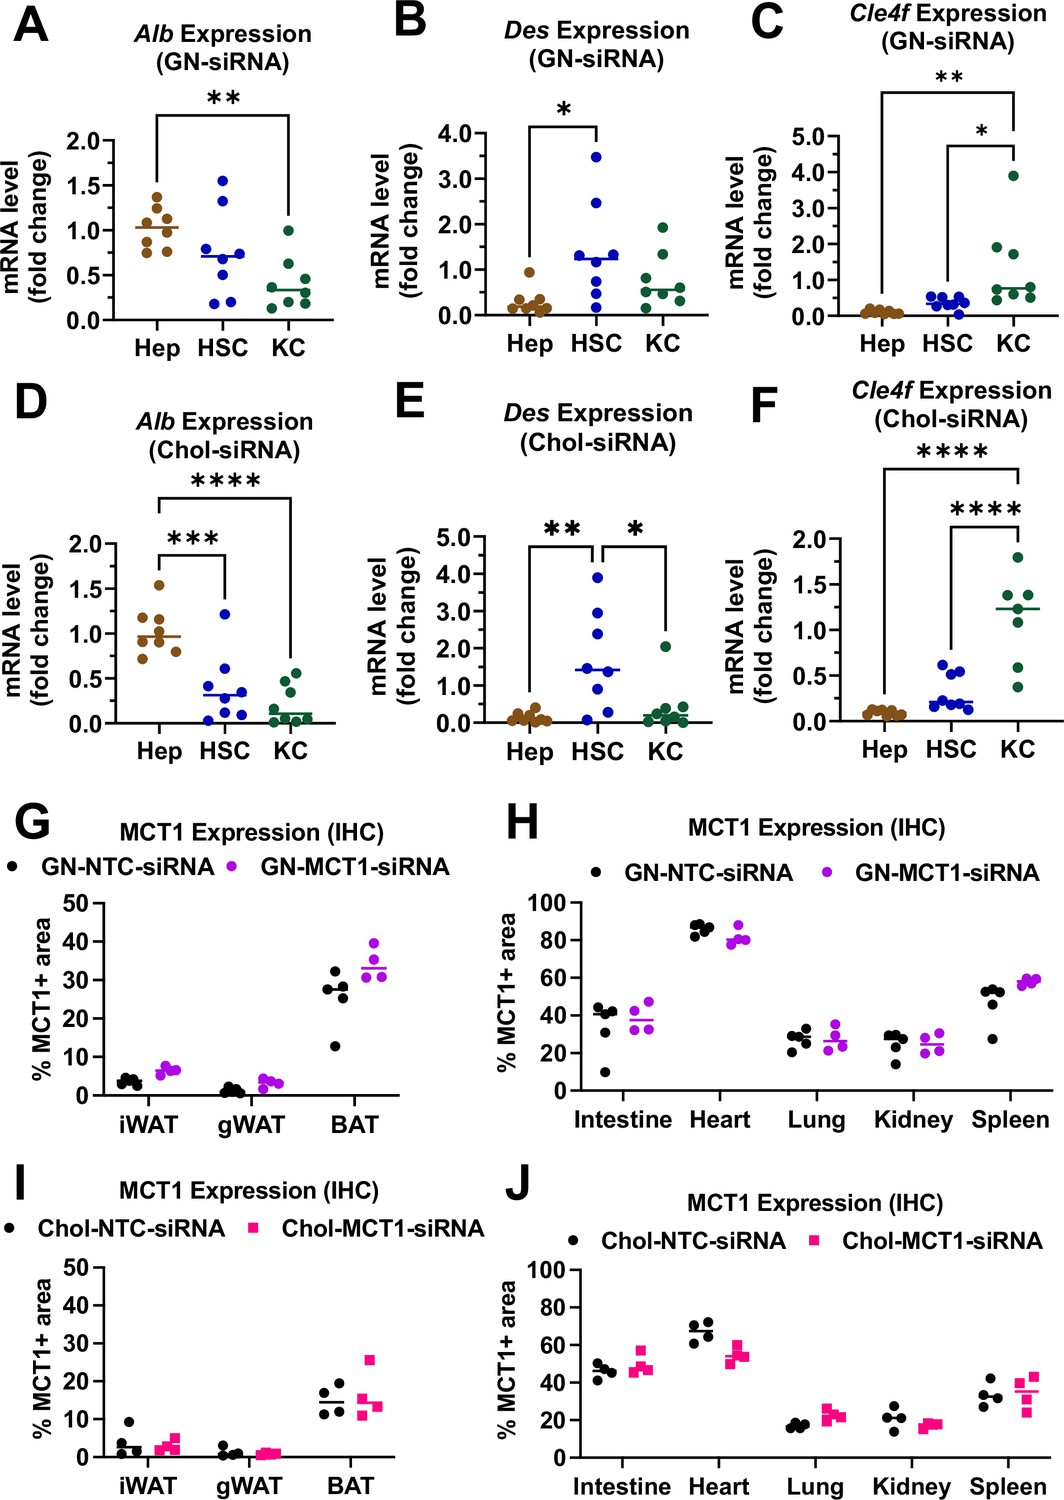
Biodistribution of GN-MCT1-siRNA and Chol-MCT1-siRNA.
Male C57BL/6 wild-type mice (16–18 weeks, n=4) were subcutaneously injected with 10 mg/kg of siRNAs twice within 15 days. Livers were perfused through inferior vena cava and multiple liver cells were isolated using different gravity centrifugations and gradient solutions. (A, D) Purity of isolated hepatocytes, (B, E) hepatic stellate cells, (C, F) and Kupffer cells was validated with representative marker genes, Alb, Des, and Clec4f expression, respectively (mean ± SD, one-way ANOVA, *: p<0.05, **: p<0.01, ***: p<0.001, ****: p<0.0001). (G, H) MCT1 protein expression levels in multiple fat tissues (inguinal white adipose tissue [iWAT], gonadal white adipose tissue [gWAT], and brown adipose tissue [BAT]) were monitored by immunohistochemistry. % MCT1 positive areas were quantified. (I, J) MCT1 protein expression levels in multiple tissues (heart, lung, kidney, spleen, and intestine) were monitored by immunohistochemistry. % MCT1 positive areas were quantified.
-
Figure 3—figure supplement 1—source data 1
Biodistribution of GN-MCT1-siRNA and Chol-MCT1-siRNA.
- https://cdn.elifesciences.org/articles/89136/elife-89136-fig3-figsupp1-data1-v1.zip
Figure 4 with 2 supplements

Hepatic MCT1 depletion did not resolve steatosis in a genetically obese nonalcoholic steatohepatitis (NASH) mouse model.
(A) Male ob/ob mice (10 weeks, n=6) were subcutaneously injected with 10 mg/kg of siRNA once every 10 days. Mice were fed a Gubra Amylin NASH (GAN) diet for 3 weeks and sacrificed. (B) Livers were stained with MCT1 antibody and the representative images of each group are shown (scale bar: 50 µm). (C) % of MCT1 positive area shown in immunohistochemistry images were quantified. (D) Hepatic Slc16a1/Mct1 mRNA level was measured by real-time quantitative PCR (rt-qPCR) upon each siRNA administration. (E) Plasma lactate levels were monitored. (F) Mean size of lipid droplets was quantified from H&E images (mean, sem). (G) Mean number of lipid droplets was quantified from H&E images (mean, sem). (H) Liver triglyceride (TG) levels were examined in each group (mean ± SD or otherwise noted, t-test, *: p<0.05, ***: p<0.001, ****: p<0.0001).
-
Figure 4—source code 1
Hepatic MCT1 depletion did not resolve steatosis in a genetically obese nonalcoholic steatohepatitis (NASH) mouse model.
- https://cdn.elifesciences.org/articles/89136/elife-89136-fig4-code1-v1.zip
-
Figure 4—source data 1
Hepatic MCT1 depletion did not resolve steatosis in a genetically obese nonalcoholic steatohepatitis (NASH) mouse model.
- https://cdn.elifesciences.org/articles/89136/elife-89136-fig4-data1-v1.zip
Figure 4—figure supplement 1
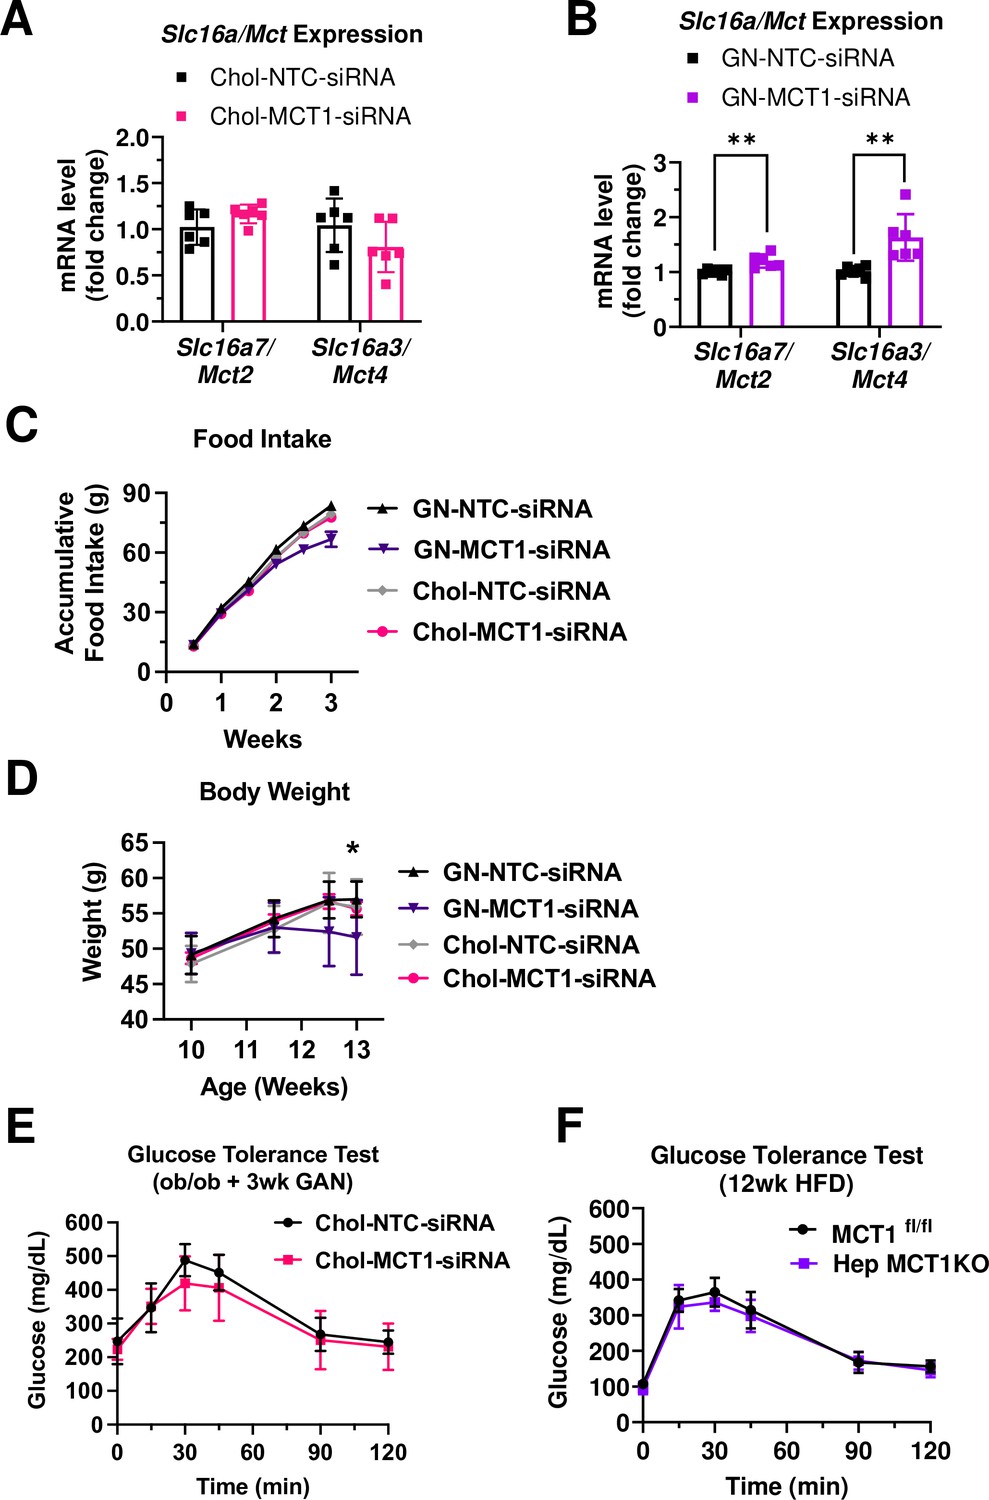
GN-MCT1-siRNA induced a complementary effect on monocarboxylate transporter (MCT) isoform expression and decreased food intake and body weight.
Male ob/ob mice (10 weeks, n=6) were subcutaneously injected with 10 mg/kg of siRNA once every 10 days. Mice were fed a Gubra Amylin NASH (GAN) diet for 3 weeks. (A, B) The complementary effect of Slc16a1/Mct1 depletion on Slc16a7/Mct2 and Slc16a3/Mct4 mRNA expressions was examined. (C) Accumulative food intake and (D) body weight were monitored during the study. (E) GTT was performed after 16 hr of fasting in third week of the GAN diet. (F) Male MCT1fl/fl mice (n=6) were intravenously injected with 1×10¹¹ gc of either AAV-TBG-Cre or AAV-Lrat-Cre. Mice were fed a high-fat diet for 12 weeks. Then, GTT was performed after 16 hr of fasting (mean ± SD, t-test, *: p<0.05, **: p<0.01).
-
Figure 4—figure supplement 1—source data 1
GN-MCT1-siRNA induced a complementary effect on monocarboxylate transporter (MCT) isoform expression and decreased food intake and body weight.
- https://cdn.elifesciences.org/articles/89136/elife-89136-fig4-figsupp1-data1-v1.zip
Figure 4—figure supplement 2
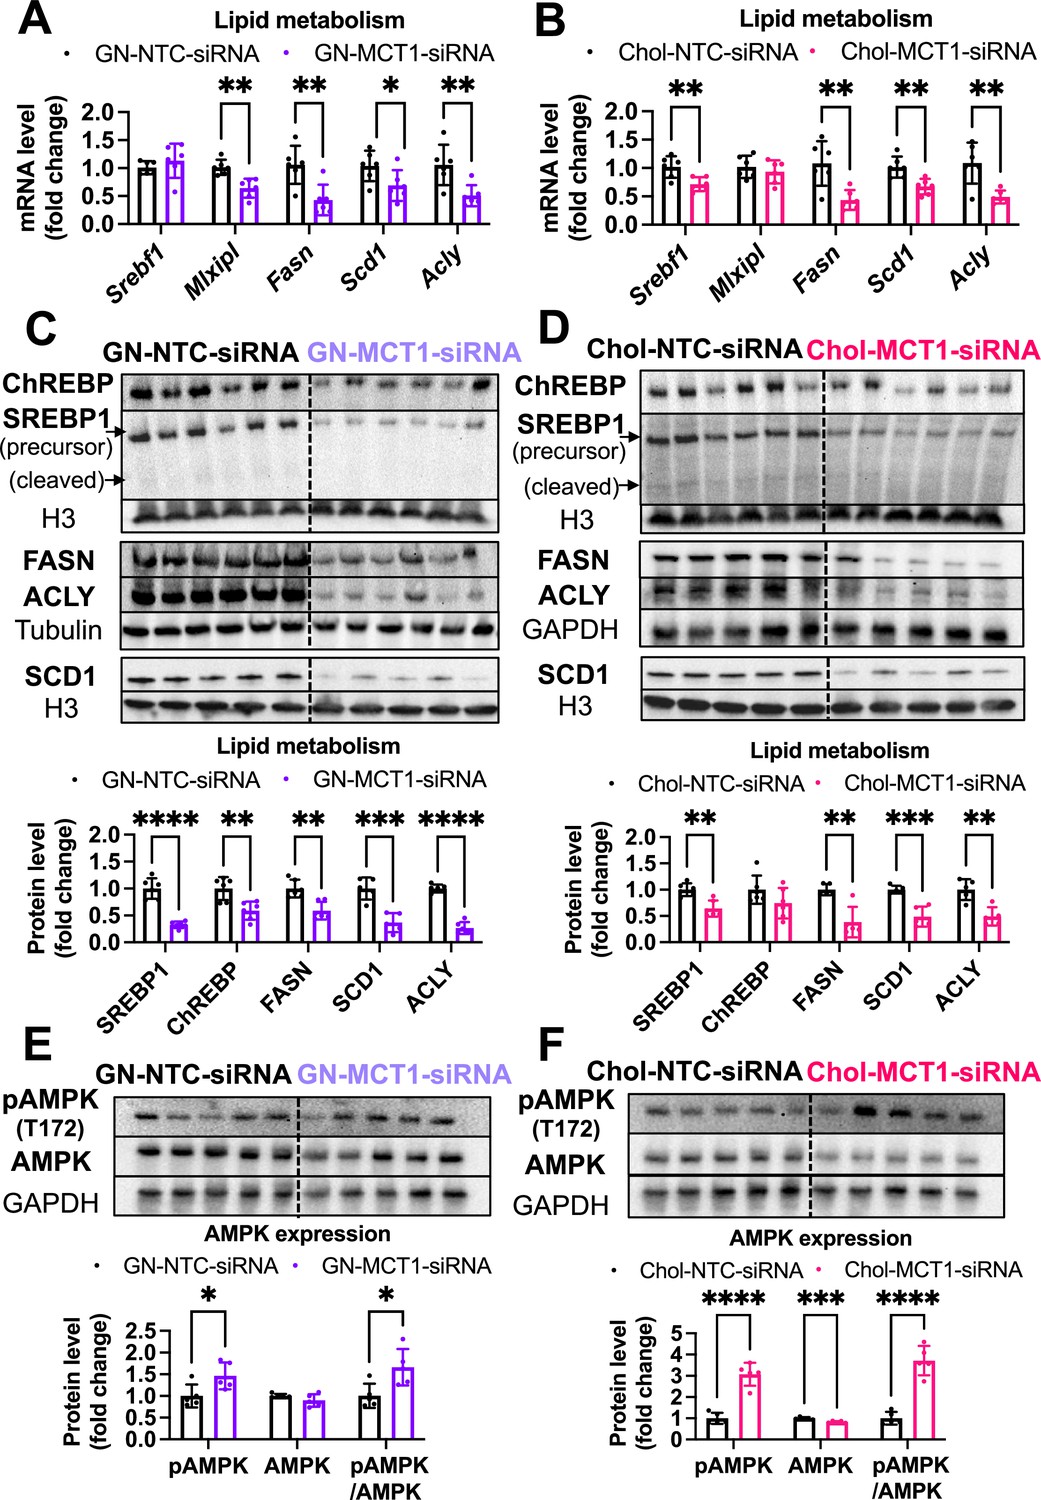
Both Chol-MCT1-siRNA and GN-MCT1-siRNA significantly decreased hepatic DNL gene expression.
Male ob/ob mice (10weeks, n=6) were subcutaneously injected with 10mg/kg of siRNA once every 10days. Mice were fed a Gubra Amylin NASH (GAN) diet for 3weeks and sacrificed. Representative DNL gene expression levels were measured in (A, B) mRNA and (C, D) protein upon Chol-siRNA or GN-siRNA administration, respectively. Protein expression levels were quantified. (E, F) Phosphorylated AMPK (pAMPK) and AMPK protein levels and their expression ratio were quantified (mean ± SD, t-test, *: p<0.05, **: p<0.01, ***: p<0.001, ****: p<0.0001).
-
Figure 4—figure supplement 2—source data 1
Both Chol-MCT1-siRNA and GN-MCT1-siRNA significantly decreased hepatic DNL gene expression.
- https://cdn.elifesciences.org/articles/89136/elife-89136-fig4-figsupp2-data1-v1.zip
Figure 5 with 2 supplements
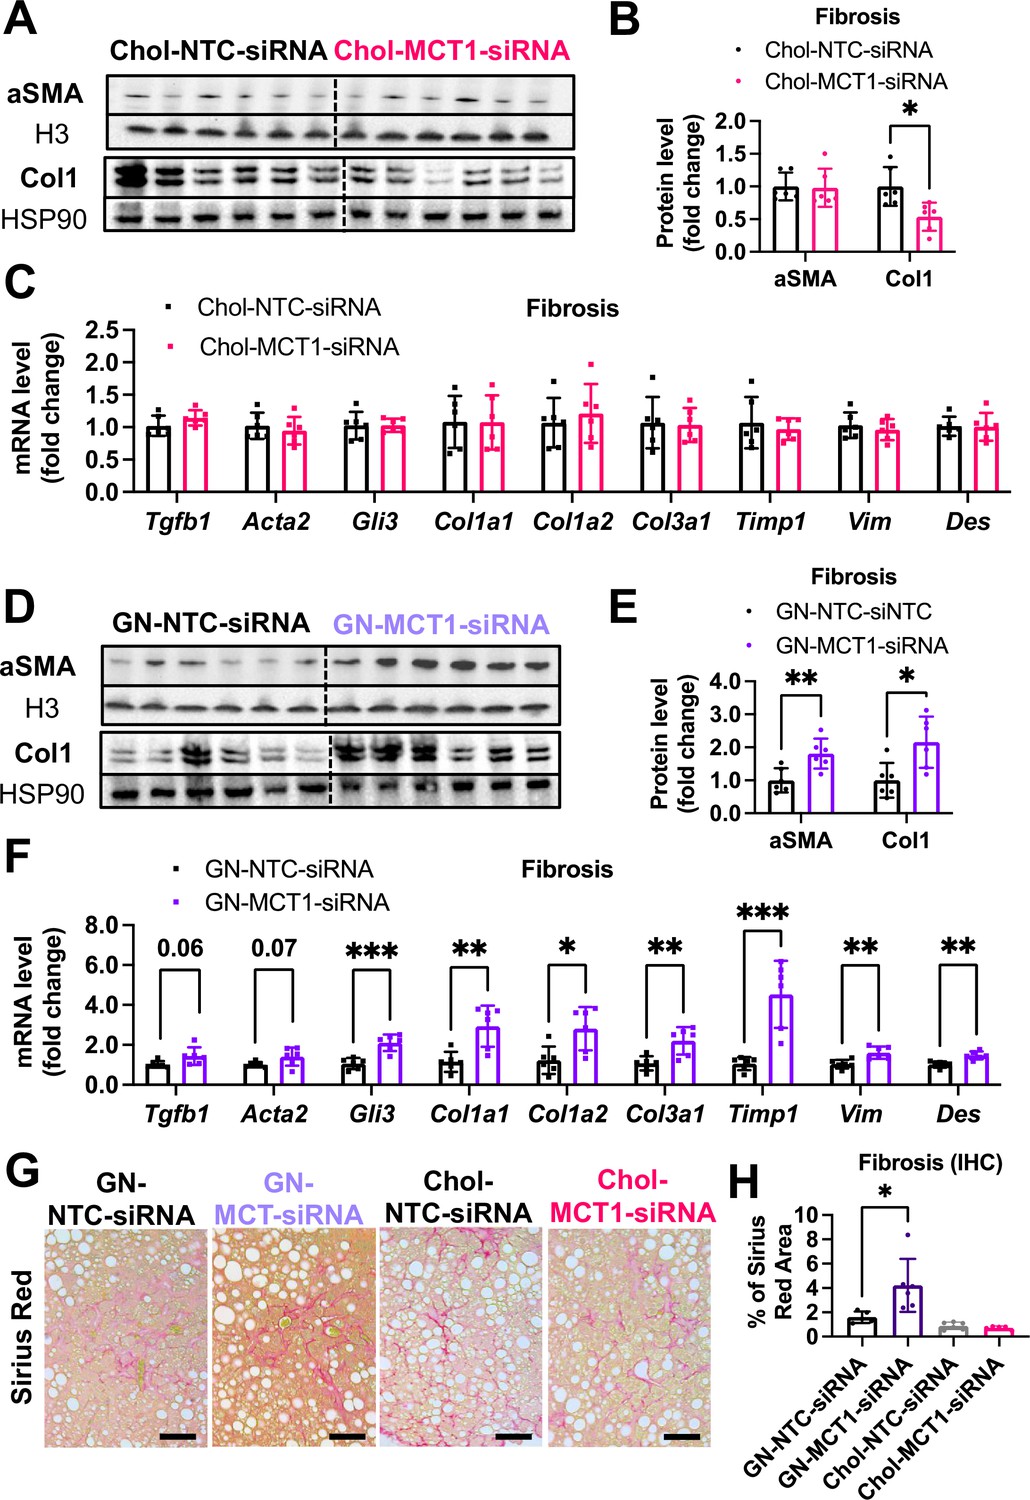
Opposite effects of Chol-MCT1-siRNA versus GN-MCT1-siRNA on fibrotic type 1 collagen expression.
Male ob/ob mice (10weeks, n=6) were subcutaneously injected with 10mg/kg of siRNA once every 10days. Mice were fed a Gubra Amylin NASH (GAN) diet for 3weeks and sacrificed. Representative fibrogenic gene expression levels were measured for (A, B) mRNA and (C, D) protein. (E, F) Protein expression levels were quantified. (G) Livers were stained with Sirius Red and the representative images of each group are shown (scale bar: 200 µm). (H) % of Sirius Red positive areas were quantified (mean ± SD, t-test, *: p<0.05, **: p<0.01, ***: p<0.001).
-
Figure 5—source code 1
Opposite effects of Chol-MCT1-siRNA versus GN-MCT1-siRNA on fibrotic type 1 collagen expression.
- https://cdn.elifesciences.org/articles/89136/elife-89136-fig5-code1-v1.zip
-
Figure 5—source data 1
Opposite effects of Chol-MCT1-siRNA versus GN-MCT1-siRNA on fibrotic type 1 collagen expression.
- https://cdn.elifesciences.org/articles/89136/elife-89136-fig5-data1-v1.zip
Figure 5—figure supplement 1
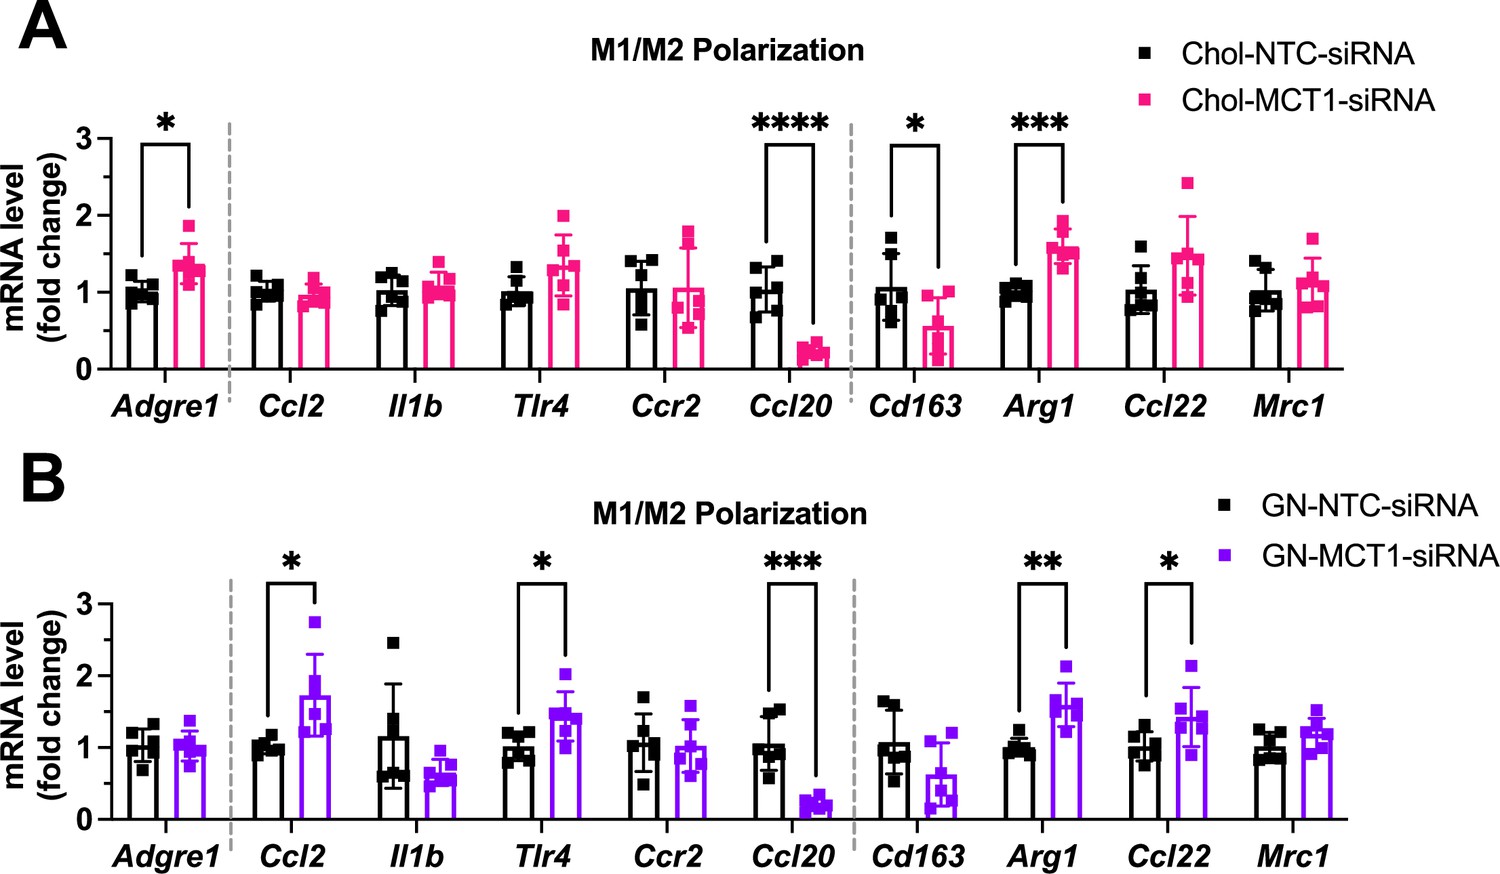
A comparable level of M1/M2 macrophage polarization upon Chol-MCT1-siRNA and GN-MCT1-siRNA administration.
Male ob/ob mice (10weeks, n=6) were subcutaneously injected with 10mg/kg of siRNA once every 10days. Mice were fed a Gubra Amylin NASH (GAN) diet for 3weeks and sacrificed. Representative pro-inflammatory M1 markers and pro-fibrogenic M2 macrophage gene expression levels were measured in (A, B) upon Chol-siRNA or GN-siRNA administration, respectively (mean ± SD, t-test, *: p<0.05, **: p<0.01, ***: p<0.001, ****: p<0.0001).
-
Figure 5—figure supplement 1—source data 1
A comparable level of M1/M2 macrophage polarization upon Chol-MCT1-siRNA and GN-MCT1-siRNA administration.
- https://cdn.elifesciences.org/articles/89136/elife-89136-fig5-figsupp1-data1-v1.zip
Figure 5—figure supplement 2
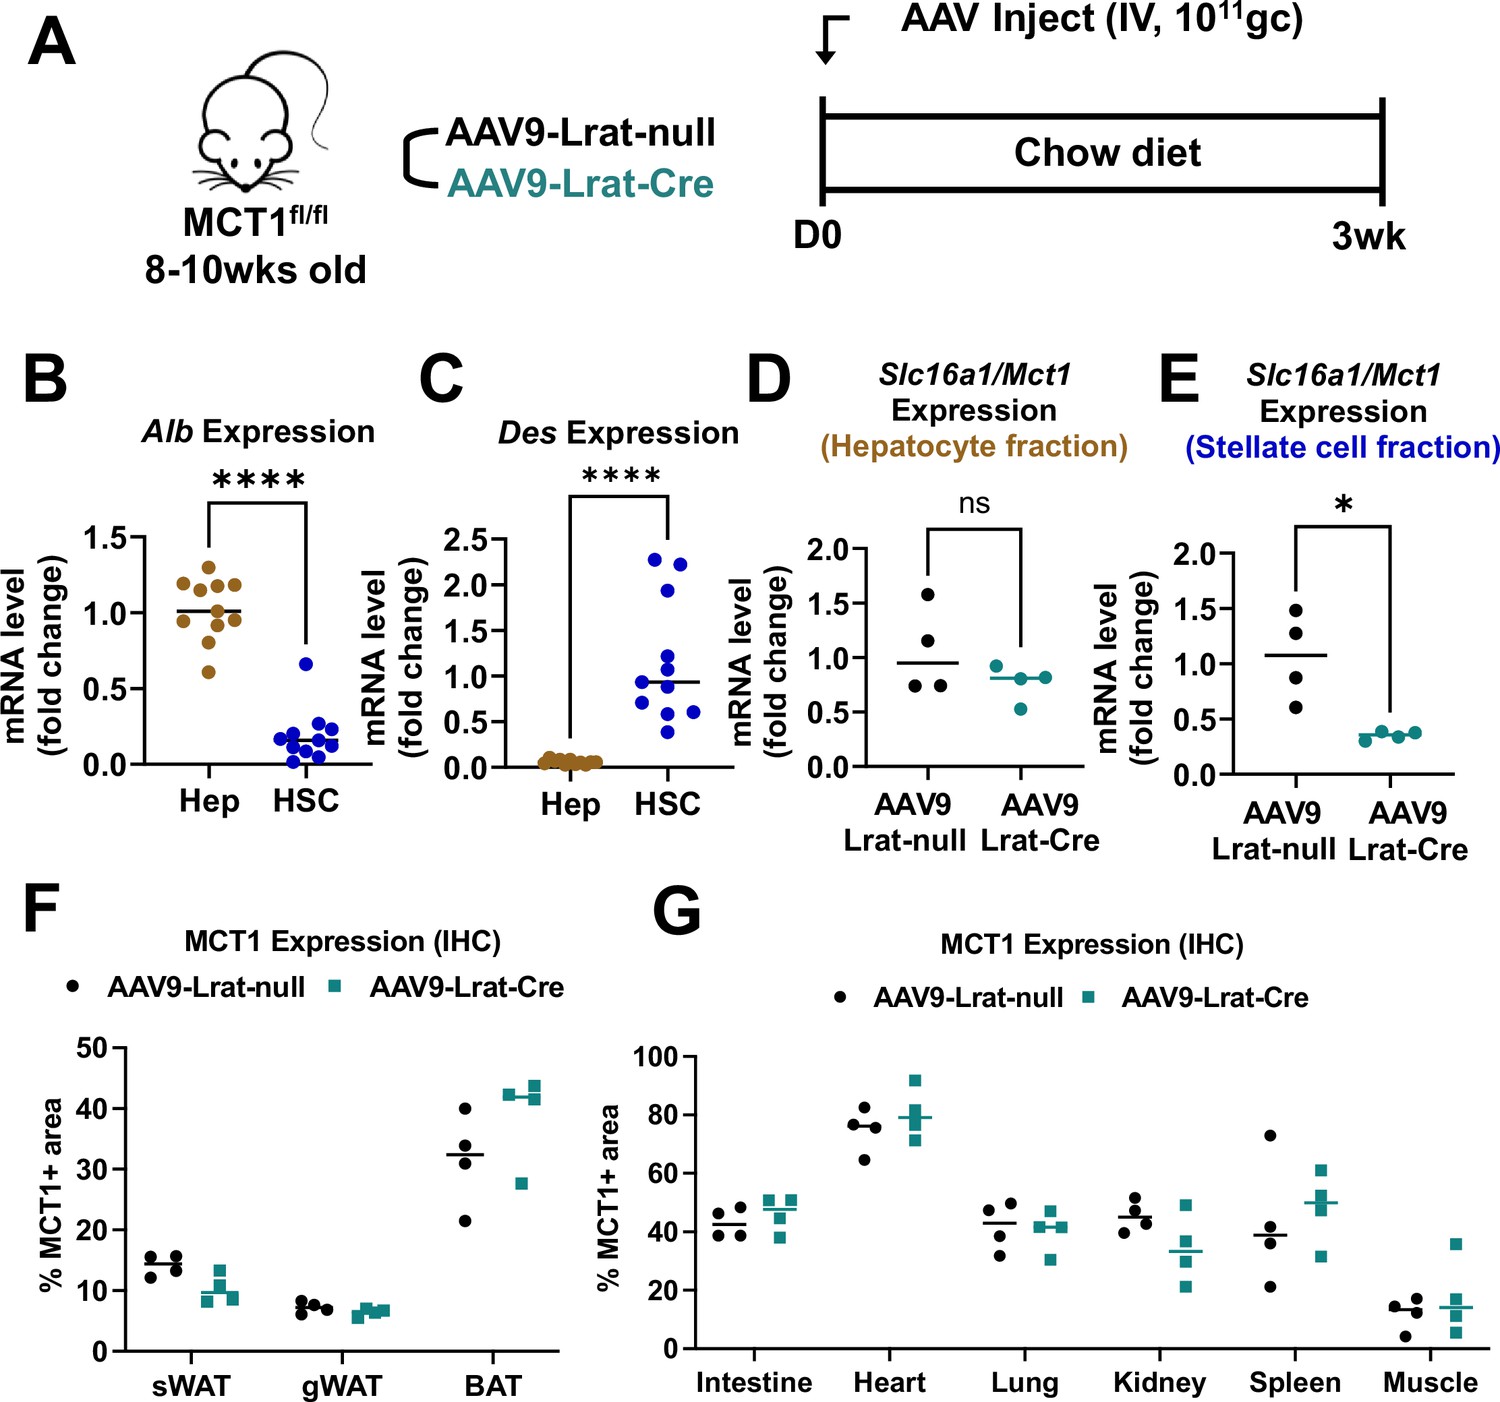
Intravenous injection of AAV9-Lrat-Cre in MCT1fl/fl mice specifically targets hepatic stellate cells.
(A) Male mice (9–10 weeks, n=4) were intravenously injected with 1×10¹¹ gc of either AAV9-Lrat-null or AAV9-Lrat-Cre. Mice were fed a chow diet for 3 weeks and sacrificed. Isolation of either (B) primary hepatocytes or (C) stellate cells was validated with each cell type’s representative marker, albumin and desmin, respectively. Slc16a1/Mct1 mRNA expression levels in (D) hepatocyte or (E) stellate cell fractions were examined (mean ± SD, t-test, *: p<0.05, ****: p<0.0001). (F) MCT1 protein expression levels in multiple fat tissues (inguinal white adipose tissue [iWAT], gonadal white adipose tissue [gWAT], and brown adipose tissue [BAT]) were monitored by immunohistochemistry. % MCT1 positive areas were quantified. (G) MCT1 protein expression levels in multiple tissues (heart, lung, kidney, spleen, and intestine) were monitored by immunohistochemistry. % MCT1 positive areas were quantified.
-
Figure 5—figure supplement 2—source data 1
Intravenous injection of AAV9-Lrat-Cre in MCT1fl/fl mice specifically targets hepatic stellate cells.
- https://cdn.elifesciences.org/articles/89136/elife-89136-fig5-figsupp2-data1-v1.zip
Figure 6

MCT1 depletion did not resolve steatosis in the choline-deficient, high-fat diet (CDHFD)-induced nonalcoholic steatohepatitis (NASH) model.
(A) Male MCT1fl/fl mice (8 weeks, n=10) were intravenously injected with 2×10¹¹ gc of AAV-TBG-Cre or AAV-Lrat-Cre or both. The same amount of AAV-TBG-null or AAV-Lrat-null was used as a control. A week after the injection, mice were fed a CDHFD for 8 weeks and sacrificed. (B) Slc16a1/Mct1 mRNA expression levels in whole livers were examined. (C) Food intake and (D) body weights were monitored. (E) CDHFD-induced steatosis was monitored by H&E (scale bar: 200 µm). (F) % of lipid droplet areas was quantified (mean ± SD, one-way ANOVA, *: p<0.05, **: p<0.01, ***: p<0.001, ****: p<0.0001).
-
Figure 6—source code 1
MCT1 depletion did not resolve steatosis in the choline-deficient, high-fat diet (CDHFD)-induced nonalcoholic steatohepatitis (NASH) model.
- https://cdn.elifesciences.org/articles/89136/elife-89136-fig6-code1-v1.zip
-
Figure 6—source data 1
MCT1 depletion did not resolve steatosis in the choline-deficient, high-fat diet (CDHFD)-induced nonalcoholic steatohepatitis (NASH) model.
- https://cdn.elifesciences.org/articles/89136/elife-89136-fig6-data1-v1.zip
Figure 7

Hepatocyte-specific MCT1KO accelerated fibrosis, while hepatic stellate cell-specific MCT1KO decreased it.
Male MCT1fl/fl mice (6 weeks, n=10) were intravenously injected with 2×10¹¹ gc of AAV-TBG-Cre or AAV-Lrat-Cre or both. The same amount of AAV-TBG-null or AAV-Lrat-null was used as a control. A week after the injection, mice were fed a choline-deficient, high-fat diet (CDHFD) for 8 weeks and sacrificed. (A) Collagen 1 protein levels were compared between the control and the hepatocyte MCT1KO groups. (B) Collagen 1 protein levels were compared between the control and the hepatic stellate cell MCT1KO groups. (C) Collagen 1 protein levels were compared between the control group and MCT1KO in both hepatocyte and hepatic stellate cell groups. (D) Livers were stained with trichrome and the representative images of each group were shown (scale bar: 100 µm). (E) Trichrome staining images were quantified. (F) Liver stiffness was monitored 4 weeks after CDHFD feeding via shear wave elastography (SWE). (G) Liver stiffness was monitored 8 weeks after CDHFD feeding via SWE. (H) Alanine transaminase (ALT) levels were measured in every CDHFD-fed group (mean ± SD, t-test, one-way ANOVA, *: p<0.05, **: p<0.01, ***: p<0.001, ****: p<0.0001).
-
Figure 7—source code 1
Hepatocyte-specific MCT1KO accelerated fibrosis, while hepatic stellate cell-specific MCT1KO decreased it.
- https://cdn.elifesciences.org/articles/89136/elife-89136-fig7-code1-v1.zip
-
Figure 7—source data 1
Hepatocyte-specific MCT1KO accelerated fibrosis, while hepatic stellate cell-specific MCT1KO decreased it.
- https://cdn.elifesciences.org/articles/89136/elife-89136-fig7-data1-v1.zip
Figure 8 with 3 supplements

Lactate enhances the transforming growth factor 1β (TGF-β1)-stimulatory effect in the presence of pyruvate in human LX2 stellate cells.
Cells were treated with increasing doses of sodium lactate (0, 2.5, 5, 10, 20, 40 mM) for 48 hr. Dose-response effect of sodium lactate on (A) COL1A1 mRNA and (B) collagen 1 protein levels were monitored. Lactate effect on TGF-β1-stimulated collagen production was also examined. LX2 cells were treated with three conditions with or without TGF-β1 (10 ng/ml) treatment for 48 hr: (1) control (DMEM/high glucose media only), (2) sodium pyruvate (1 mM), and (3) the combination of sodium pyruvate (1 mM) and sodium lactate (10 mM). (C) Collagen 1 protein levels. (D) Quantification of collagen 1 protein levels. (E) COL1A1 mRNA expression levels. To test if MCT1 depletion can inhibit both endogenous and exogenous lactate-mediated collagen 1 production, cells were transfected with either NTC-siRNA or MCT1-siRNA for 6 hr. Then, cells were maintained in serum-starved media with or without 10 ng/ml of recombinant human TGF-β1 for 48 hr and harvested. (F) Collagen 1 protein levels upon sodium pyruvate-deprived condition. (G) Collagen 1 protein levels upon sodium pyruvate (1 mM) and sodium lactate (10 mM) condition (mean ± SD, one-way ANOVA, *: p<0.05, **: p<0.01, ***: p<0.001, ****: p<0.0001).
-
Figure 8—source data 1
Lactate enhances the transforming growth factor 1β (TGF-β1)-stimulatory effect in the presence of pyruvate in human LX2 stellate cells.
- https://cdn.elifesciences.org/articles/89136/elife-89136-fig8-data1-v1.zip
Figure 8—figure supplement 1
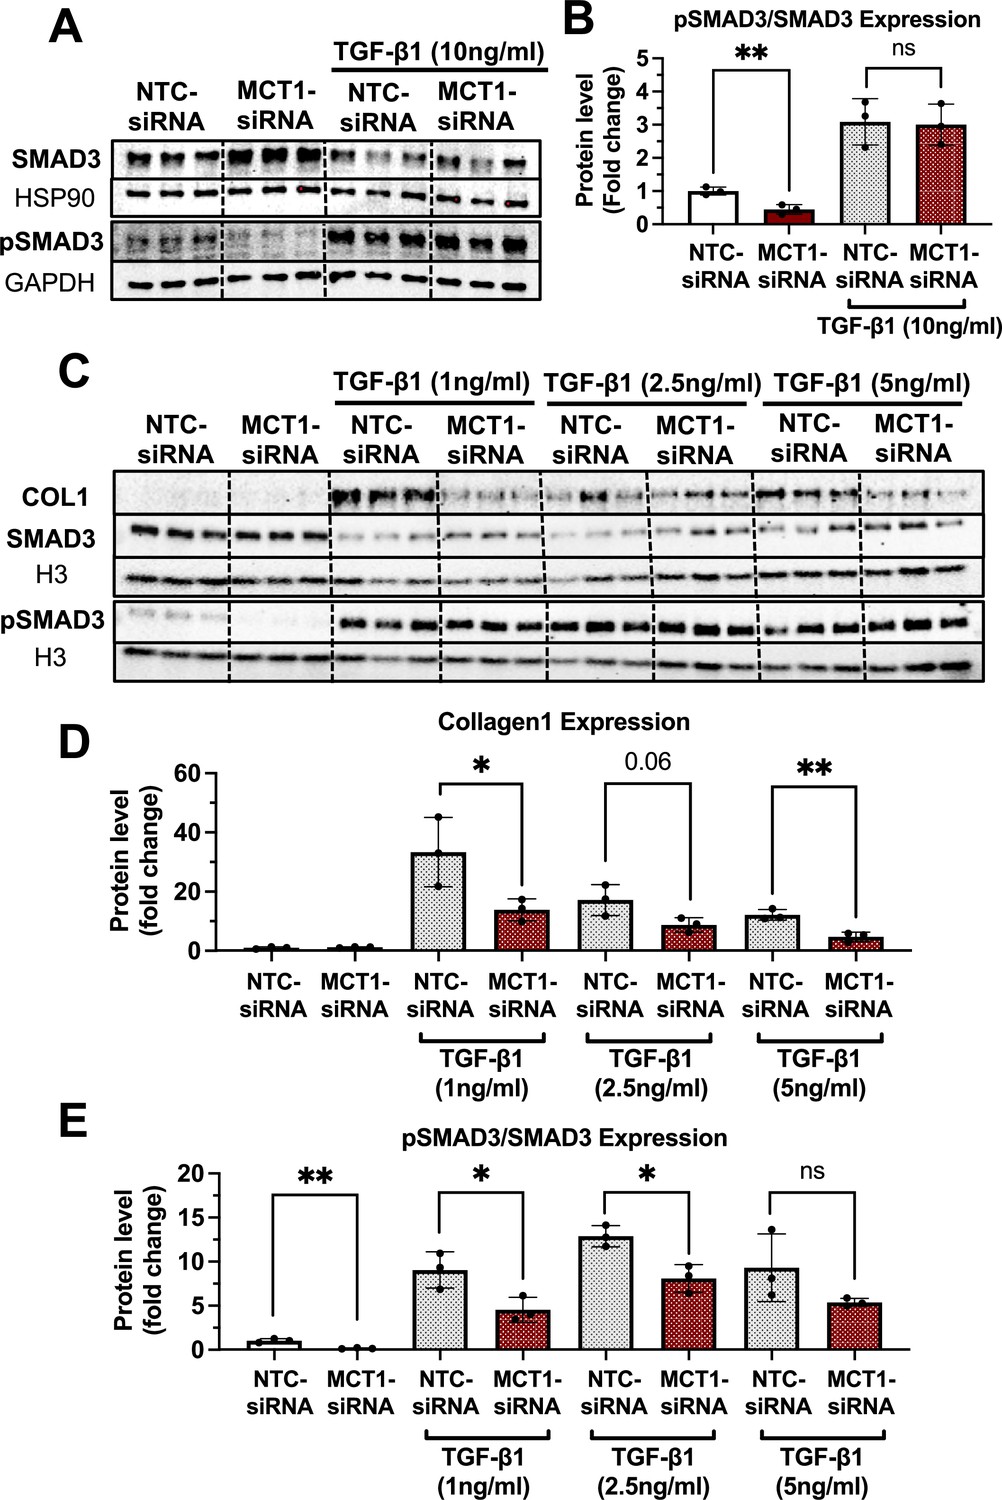
MCT1 promotes SMAD3 phosphorylation/activation in human LX2 stellate cells.
Cells were transfected with either NTC-siRNA or MCT1-siRNA for 6 hr. Then, cells were maintained in serum-starved media with or without 10 ng/ml of recombinant human transforming growth factor 1β (TGF-β1) for 48 hr and harvested. (A, B) SMAD3 and phosphorylated SMAD3 (pSMAD3) protein levels and their expression ratio were quantified. (C) With either NTC-siRNA or MCT1-siRNA pretreatment for 6 hr, different concentrations of TGF-β1 (0, 1, 2.5, 5 ng/ml) were treated to the cells for 48 hr. Collagen 1, SMAD3, and pSMAD3 protein levels were monitored. (D) Quantification of collagen 1 protein levels. (E) Quantification of pSMAD and SMAD3 ratio (mean ± SD, t-test, *: p<0.05, **: p<0.01).
-
Figure 8—figure supplement 1—source data 1
MCT1 promotes SMAD3 phosphorylation/activation in human LX2 stellate cells.
- https://cdn.elifesciences.org/articles/89136/elife-89136-fig8-figsupp1-data1-v1.zip
Figure 8—figure supplement 2
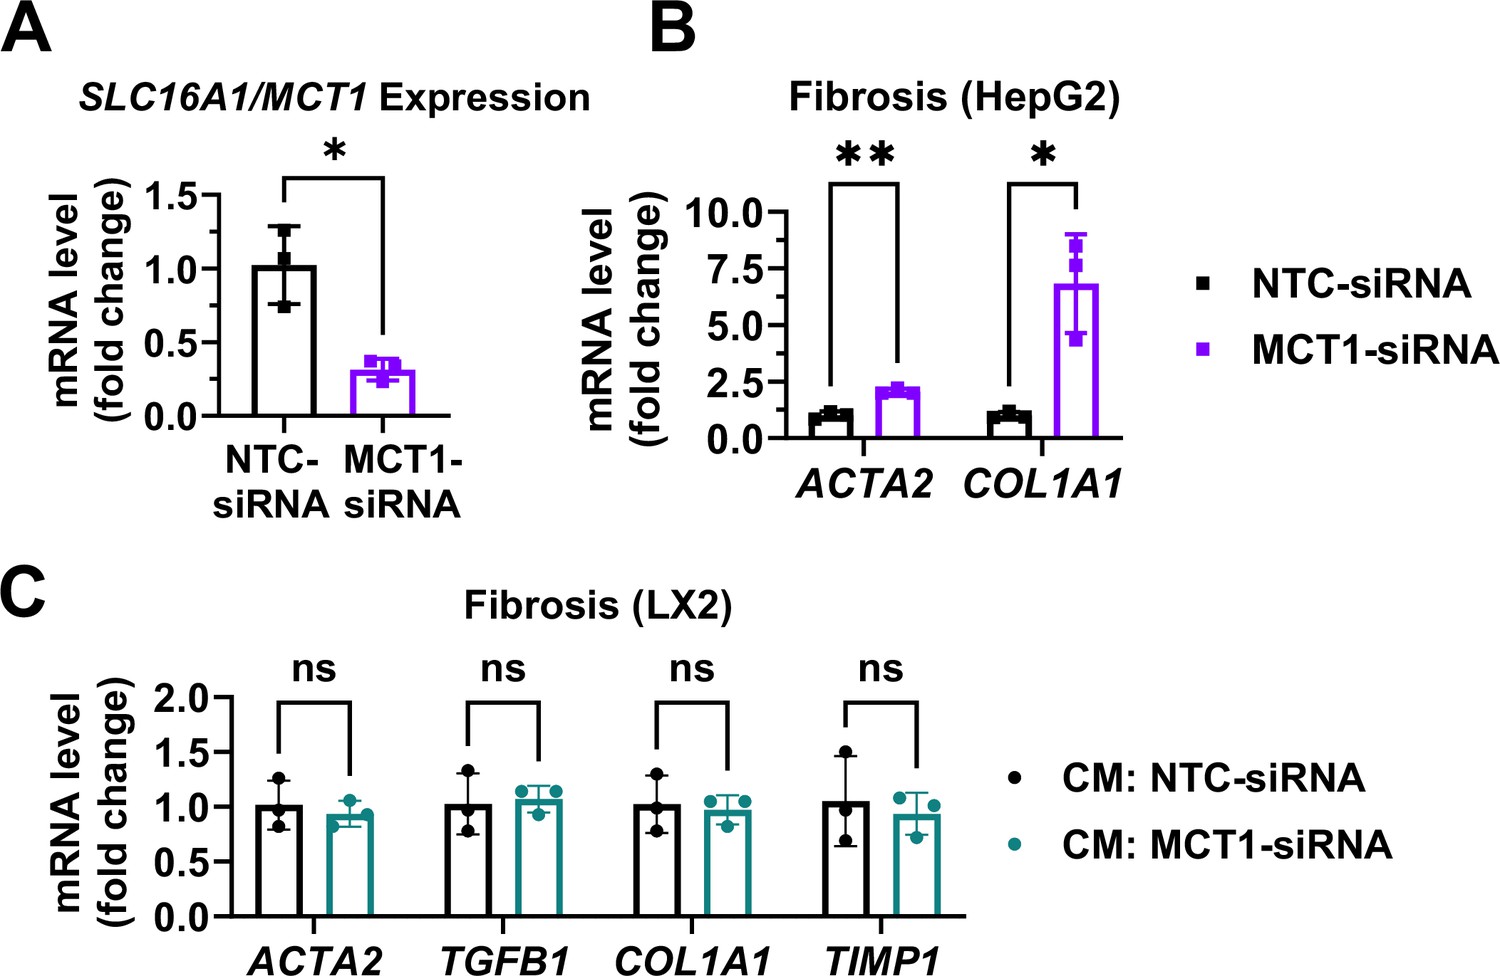
MCT1 silencing enhanced fibrogenic gene expression levels in human hematoma cell lines, HepG2.
Cells were transfected with either NTC-siRNA or MCT1-siRNA for 6 hr. 48 hr later, cells were harvested, and media were collected. LX2 cells were provided with the conditioned media (40% conditioned media+60% fresh media) and harvested in 48 hr. (A) SLC16A1/MCT1 mRNA expression levels were measured in HepG2 cells upon MCT1-siRNA treatment. (B) Fibrogenic gene expression levels were measured in HepG2 cells upon MCT1-siRNA treatment. (C) Fibrogenic gene expression levels were measured in LX2 cells upon conditioned media treatment (mean ± SD, t-test, *: p<0.05, **: p<0.01).
-
Figure 8—figure supplement 2—source data 1
MCT1 silencing enhanced fibrogenic gene expression levels in human hematoma cell lines, HepG2.
- https://cdn.elifesciences.org/articles/89136/elife-89136-fig8-figsupp2-data1-v1.zip
Figure 8—figure supplement 3
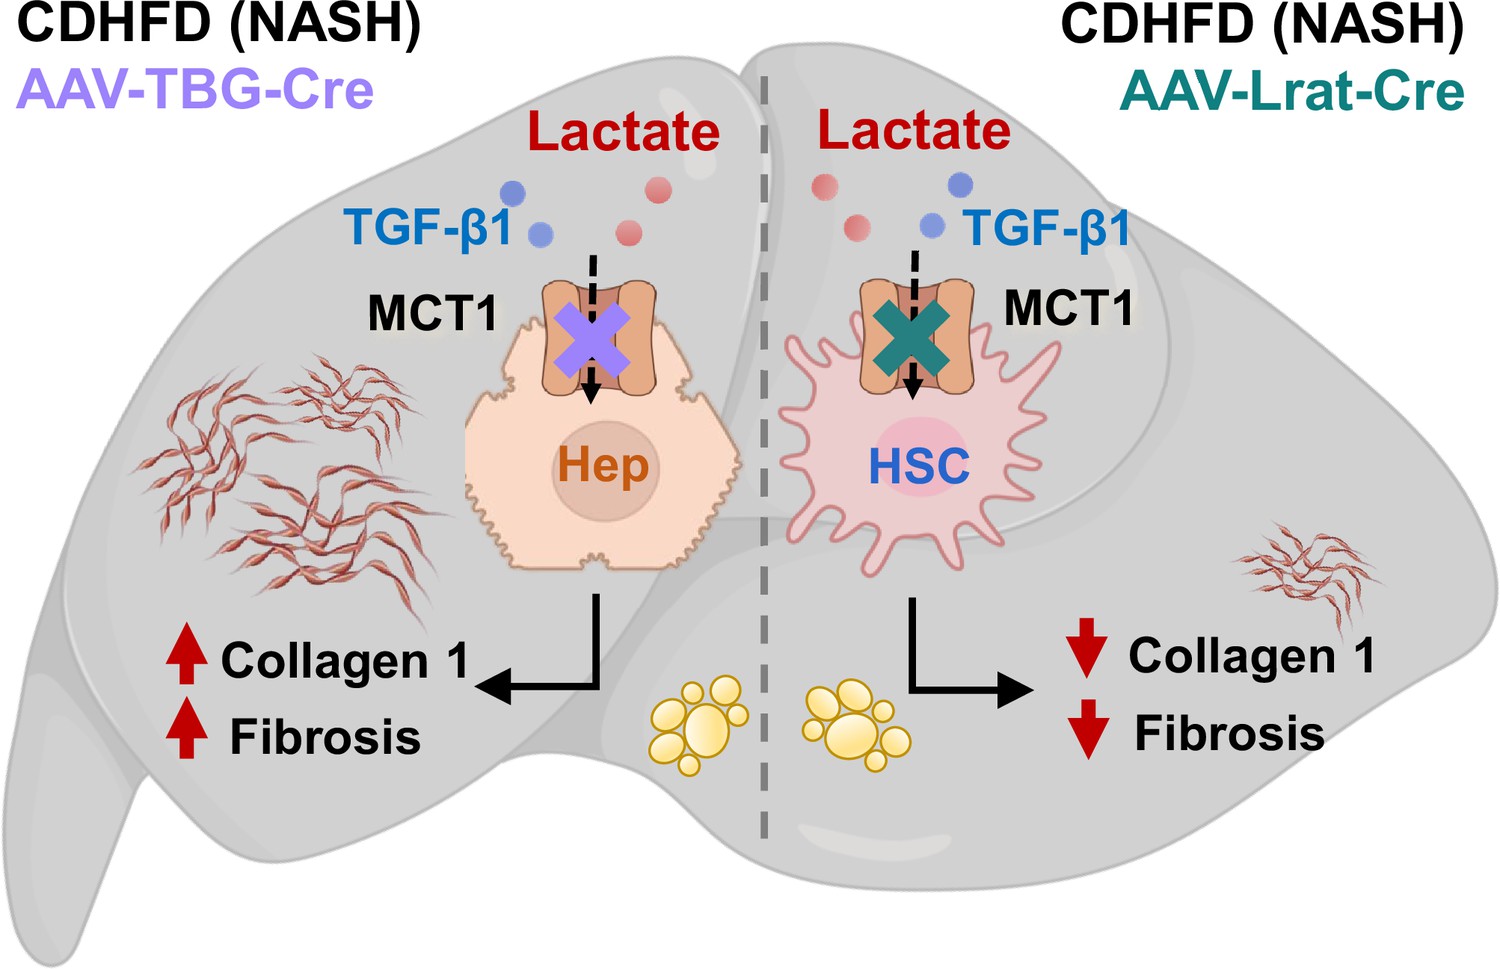
Graphical abstract.
Hepatocyte MCT1KO enhances fibrosis, while stellate cell MCT1KO decreases it.
© 2024, BioRender Inc. This figure was created with BioRender.com, and published under a CC-BY-NC-ND license with permission.
Tables
Table 1
Sequences of chemically modified siRNA candidates targeting MCT1 used in in vitro screening.
siRNAs utilized in in vitro screening were a double-strand oligonucleotide comprised of 15 sense and 20 antisense nucleotides. The sequences of each candidate’s antisense and sense strands were listed (P: 5’-phosphate, #: phosphorothioate, m: 2’-O-methyl, f: 2’-fluoro, Chol: tetra-ethylenglycol-cholesterol conjugate).
| Antisense strands: | |
|---|---|
| Oligo ID | Chemically modified RNA sequence |
| MCT1-507 | P(mU)#(fG)#(mU)(fU)(mA)(fC)(mA)(fG)(mA)(fA)(mA)(fG)(mA)#(fA)#(mG)#(fC)#(mU)#(fG)#(mC)#(fG) |
| MCT1-1976 | P(mU)#(fA)#(mA)(fA)(mC)(fU)(mU)(fA)(mA)(fG)(mG)(fC)(mA)#(fC)#(mA)#(fU)#(mA)#(fU)#(mU)#(fA) |
| MCT1-2013 | P(mU)#(fU)#(mU)(fA)(mA)(fA)(mA)(fG)(mU)(fU)(mA)(fA)(mG)#(fG)#(mC)#(fU)#(mC)#(fU)#(mC)#(fU) |
| MCT1-2042 | P(mU)#(fU)#(mU)(fA)(mA)(fA)(mA)(fC)(mA)(fA)(mA)(fU)(mG)#(fA)#(mA)#(fU)#(mU)#(fC)#(mA)#(fG) |
| MCT1-2060 | P(mU)#(fU)#(mU)(fC)(mC)(fU)(mU)(fU)(mU)(fA)(mA)(fA)(mA)#(fU)#(mG)#(fA)#(mC)#(fA)#(mU)#(fU) |
| MCT1-2120 | P(mU)#(fU)#(mU)(fA)(mC)(fA)(mA)(fA)(mC)(fA)(mA)(fC)(mA)#(fA)#(mC)#(fA)#(mA)#(fA)#(mA)#(fC) |
| MCT1-3067 | P(mU)#(fU)#(mU)(fU)(mC)(fU)(mG)(fC)(mC)(fU)(mC)(fU)(mA)#(fU)#(mU)#(fC)#(mA)#(fG)#(mA)#(fA) |
| MCT1-3160 | P(mU)#(fU)#(mC)(fU)(mU)(fA)(mC)(fA)(mC)(fA)(mA)(fG)(mG)#(fU)#(mU)#(fU)#(mU)#(fA)#(mA)#(fA) |
| MCT1-3290 | P(mU)#(fA)#(mU)(fA)(mU)(fU)(mA)(fG)(mA)(fA)(mA)(fG)(mG)#(fU)#(mU)#(fA)#(mA)#(fA)#(mA)#(fU) |
| MCT1-4340 | P(mU)#(fU)#(mG)(fA)(mA)(fU)(mU)(fU)(mG)(fU)(mA)(fU)(mG)#(fA)#(mG)#(fA)#(mA)#(fU)#(mA)#(fA) |
| Sense strands: | |
| Oligo ID | Chemically modified RNA sequence |
| Chol-MCT1-507 | (fC)#(mU)#(fU)(mC)(fU)(mU)(fU)(mC)(fU)(mG)(fU)(mA)(fA)#(mC)#(fA)-Chol |
| Chol-MCT1-1976 | (fU)#(mG)#(fU)(mG)(fC)(mC)(fU)(mU)(fA)(mA)(fG)(mU)(fU)#(mU)#(fA)-Chol |
| Chol-MCT1-2013 | (fG)#(mC)#(fC)(mU)(fU)(mA)(fA)(mC)(fU)(mU)(fU)(mU)(fA)#(mA)#(fA)-Chol |
| Chol-MCT1-2042 | (fU)#(mU)#(fC)(mA)(fU)(mU)(fU)(mG)(fU)(mU)(fU)(mU)(fA)#(mA)#(fA)-Chol |
| Chol-MCT1-2060 | (fC)#(mA)#(fU)(mU)(fU)(mU)(fA)(mA)(fA)(mA)(fG)(mG)(fA)#(mA)#(fA)-Chol |
| Chol-MCT1-2120 | (fG)#(mU)#(fU)(mG)(fU)(mU)(fG)(mU)(fU)(mU)(fG)(mU)(fA)#(mA)#(fA)-Chol |
| Chol-MCT1-3067 | (fA)#(mA)#(fU)(mA)(fG)(mA)(fG)(mG)(fC)(mA)(fG)(mA)(fA)#(mA)#(fA)-Chol |
| Chol-MCT1-3160 | (fA)#(mA)#(fC)(mC)(fU)(mU)(fG)(mU)(fG)(mU)(fA)(mA)(fG)#(mA)#(fA)-Chol |
| Chol-MCT1-3290 | (fA)#(mA)#(fC)(mC)(fU)(mU)(fU)(mC)(fU)(mA)(fA)(mU)(fA)#(mU)#(fA)-Chol |
| Chol-MCT1-4340 | (fC)#(mU)#(fC)(mA)(fU)(mA)(fC)(mA)(fA)(mA)(fU)(mU)(fC)#(mA)#(fA)-Chol |
Table 2
Sequences of the selected final chemically modified siRNA candidates targeting MCT1 used for in vivo studies.
MCT1-3160 was selected for the final construct for in vivo studies. MCT1-siRNAs utilized in in vivo study was a double-strand oligonucleotide comprised of 18 sense and 20 antisense nucleotides. To sense strands, either Chol- or GN- was attached (VP: 5′-(E)-vinyl phosphonate, #: phosphorothioate, m: 2′-O-methyl, f: 2′-fluoro, Chol: tetra-ethylenglycol-cholesterol conjugate, GN: tri-N-acetyl-galactosamine).
| Antisense strands: | |
|---|---|
| Oligo ID | Chemically modified RNA sequence |
| MCT1-3160 | VP(mU)#(fU)#(mC)(mU)(mU)(fA)(mC)(mA)(mC)(mA)(mA)(mG)(mG)#(fU)#(mU)#(fU)#(mU)#(mA)#(mA)#(fA) |
| Sense strands: | |
| Oligo ID | Chemically modified RNA sequence |
| Chol-MCT1-3160 | (mU)#(mA)#(mA)(mA)(mA)(mC)(mC)(fU)(fU)(fG)(mU)(fG)(mU)(mA)(mA)(mG)#(mA)#(mA)-Chol |
| GN-MCT-3160 | (mU)#(mA)#(mA)(mA)(mA)(mC)(mC)(fU)(fU)(fG)(mU)(fG)(mU)(mA)(mA)(mG)#(mA)#(mA)-GN |
Table 3
List of primers used for real-time quantitative PCR (rt-qPCR).
| Mouse primers: | ||
|---|---|---|
| Gene | Forward | Reverse |
| Slc16a1/Mct1 | TGTTAGTCGGAGCCTTCATTTC | CACTGGTCGTTGCACTGAATA |
| Slc16a1Mct1 (Exon 2,3 overlapping) | TGCAACGACCAGTGAAGTATC | GCTGCCGTATTTATTCACCAAG |
| Slc16a7/Mct2 | CCATCAGTAGTGTGTTGGTGAA | TCTATCACGCTGTTGCTGTAAG |
| Slc16a3/Mct4 | AGTGCCATTGGTCTCGTG | CATACTTGTAAACTTTGGTTGCATC |
| Srebf1 | GGAGCCATGGATTGCACATT | GGCCCGGGAAGTCACTGT |
| Mlxipl | TCTGCAGATCGCGTGGAG | CTTGTCCCGGCATAGCAAC |
| Fasn | GGAGGTGGTGATAGCCGGTAT | TGGGTAATCCATAGAGCCCAG |
| Scd1 | CCGGAGACCCCTTAGATCGA | TAGCCTGTAAAAGATTTCTGCAAACC |
| Acly | TGGTGGAATGCTGGACAA | GCCCTCATAGACACCATCTG |
| Tgfb1 | CTCCCGTGGCTTCTAGTGC | GCCTTAGTTTGGACAGGATCTG |
| Ihh | CTCTTGCCTACAAGCAGTTCA | CCGTGTTCTCCTCGTCCTT |
| Acta2 | ATGCTCCCAGGGCTGTTTTCC | GTGGTGCCAGATCTTTTCCATGTCG |
| Gli2 | CAACGCCTACTCTCCCAGAC | GAGCCTTGATGTACTGTACCAC |
| Gli3 | CACAGCTCTACGGCGACTG | CTGCATAGTGATTGCGTTTCTTC |
| Col1a1 | GCTCCTCTTAGGGGCCACT | CCACGTCTCACCATTGGGG |
| Col1a2 | GTAACTTCGTGCCTAGCAACA | CCTTTGTCAGAATACTGAGCAGC |
| Col3a1 | CTGTAACATGGAAACTGGGGAAA | CCATAGCTGAACTGAAAACCACC |
| Timp1 | CTCAAAGACCTATAGTGCTGGC | CAAAGTGACGGCTCTGGTAG |
| Alb | TGCTTTTTCCAGGGGTGTGTT | TTACTTCCTGCACTAATTTGGCA |
| Des | CTAAAGGATGAGATGGCCCG | GAAGGTCTGGATAGGAAGGTTG |
| Clec4f | GAGGCCGAGCTGAACAGAG | TGTGAAGCCACCACAAAAAGAG |
| B2m | CATGGCTCGCTCGGTGAC | CAGTTCAGTATGTTCGGCTTCC |
| F4/80 | CTTTGGCTATGGGCTTCCAGTC | GCAAGGAGGACAGAGTTTATCGTG |
| Ccl2 | AGGTCCCTGTCATGCTTCTG | AAGGCATCACAGTCCGAGTC |
| Il1b | TTTGACAGTGATGAGAATGACC | CTCTTGTTGATGTGCTGCTG |
| Tlr4 | ATGGCATGGCTTACACCACC | GAGGCCAATTTTGTCTCCACA |
| Ccr2 | ATCCACGGCATACTATCAACATC | CAAGGCTCACCATCATCGTAG |
| Ccl20 | GCCTCTCGTACATACAGACGC | CCAGTTCTGCTTTGGATCAGC |
| Cd163 | ATGGGTGGACACAGAATGGTT | CAGGAGCGTTAGTGACAGCAG |
| Arg1 | CTCCAAGCCAAAGTCCTTAGAG | AGGAGCTGTCATTAGGGACATC |
| Ccl22 | AGGTCCCTATGGTGCCAATGT | CGGCAGGATTTTGAGGTCCA |
| Cd206 | CTCTGTTCAGCTATTGGACGC | TGGCACTCCCAAACATAATTTGA |
| Human primers: | ||
| Gene | Forward | Reverse |
| SLC16A1/MCT1 | TGGAAGACACCCTAAACAAGAG | AAAGCCTCTGTGGGTGAATAG |
| ACTA2 | AGCGTGGCTATTCCTTCGT | CTCATTTTCAAAGTCCAGAGCTACA |
| TGFB1 | CAACGAAATCTATGACAAGTTCAAGCAG | CTTCTCGGAGCTCTGATGTG |
| COL1A1 | ACGTCCTGGTGAAGTTGGTC | ACCAGGGAAGCCTCTCTCTC |
| TIMP1 | AATTCCGACCTCGTCATCAGG | ATCCCCTAAGGCTTGGAACC |
| ACTB | GATGAGATTGGCATGGCTTT | GAGAAGTGGGGTGGCTT |
Table 4
List of antibodies used in this study.
| Reagent | Source | Identifier |
|---|---|---|
| Anti-MCT1 | Proteintech | Cat # 20139-1-AP |
| Anti-FASN | Cell Signaling | Cat # 3180s |
| Anti-ACLY | Cell Signaling | Cat # 4332 |
| Anti-SCD1 | Cell Signaling | Cat # 2794s |
| Anti-ChREBP | Novus Bio | Cat # NB400-135 |
| Anti-SREBP1 | Millipore | Cat # MABS1987 |
| Anti-GAPDH-HRP | Cell Signaling | Cat # 8884s |
| Anti-H3 | Cell Signaling | Cat # 4499s |
| Anti-Tubulin | Sigma-Aldrich | Cat # T5168 |
| Anti-pAMPK (T172) | Cell Signaling | Cat # 2535s |
| Anti-AMPKα | Cell Signaling | Cat # 2793s |
| Anti-αSMA | Cell Signaling | Cat # 19,245s |
| Anti-Collagen 1 | Southern Biotech | Cat # 1310–01 |
| Anti-HSP90-HRP | Cell Signaling | Cat # 79,631s |
| Anti-SMAD3 | Cell Signaling | Cat # 9523S |
| Anti-pSMAD3 | Abcam | Cat # AB52903 |
| Goat Anti-Rabbit IgG-HRP | Invitrogen | Cat # 65-6120 |
| Goat Anti-Mouse IgG-HRP | Invitrogen | Cat # 65-6520 |
| Goat Anti-Mouse IgG-HRP | Thermo Fisher | Cat # G21040 |
| Mouse Anti-Goat IgG-HRP | Santa Cruz | Cat # sc-2354 |
| Goat-anti-Rabbit-488 | Thermo Fisher | Cat # A11008 |
| ProLong Gold Antifade Mountant | Thermo Fisher | Cat # P36931 |
Additional files
Download links
A two-part list of links to download the article, or parts of the article, in various formats.
Downloads (link to download the article as PDF)
Open citations (links to open the citations from this article in various online reference manager services)
Cite this article (links to download the citations from this article in formats compatible with various reference manager tools)
Lactate transporter MCT1 in hepatic stellate cells promotes fibrotic collagen expression in nonalcoholic steatohepatitis
eLife 12:RP89136.
https://doi.org/10.7554/eLife.89136.3


