A modified BCG with depletion of enzymes associated with peptidoglycan amidation induces enhanced protection against tuberculosis in mice
- DST/NRF Centre of Excellence for Biomedical TB Research, Faculty of Health Sciences, University of the Witwatersrand, National Health Laboratory Service, South Africa
- Center for Tuberculosis Research, Department of Medicine, Johns Hopkins School of Medicine, United States
- Department of Chemistry, University of Virginia, United States
Figures
Figure 1 with 5 supplements
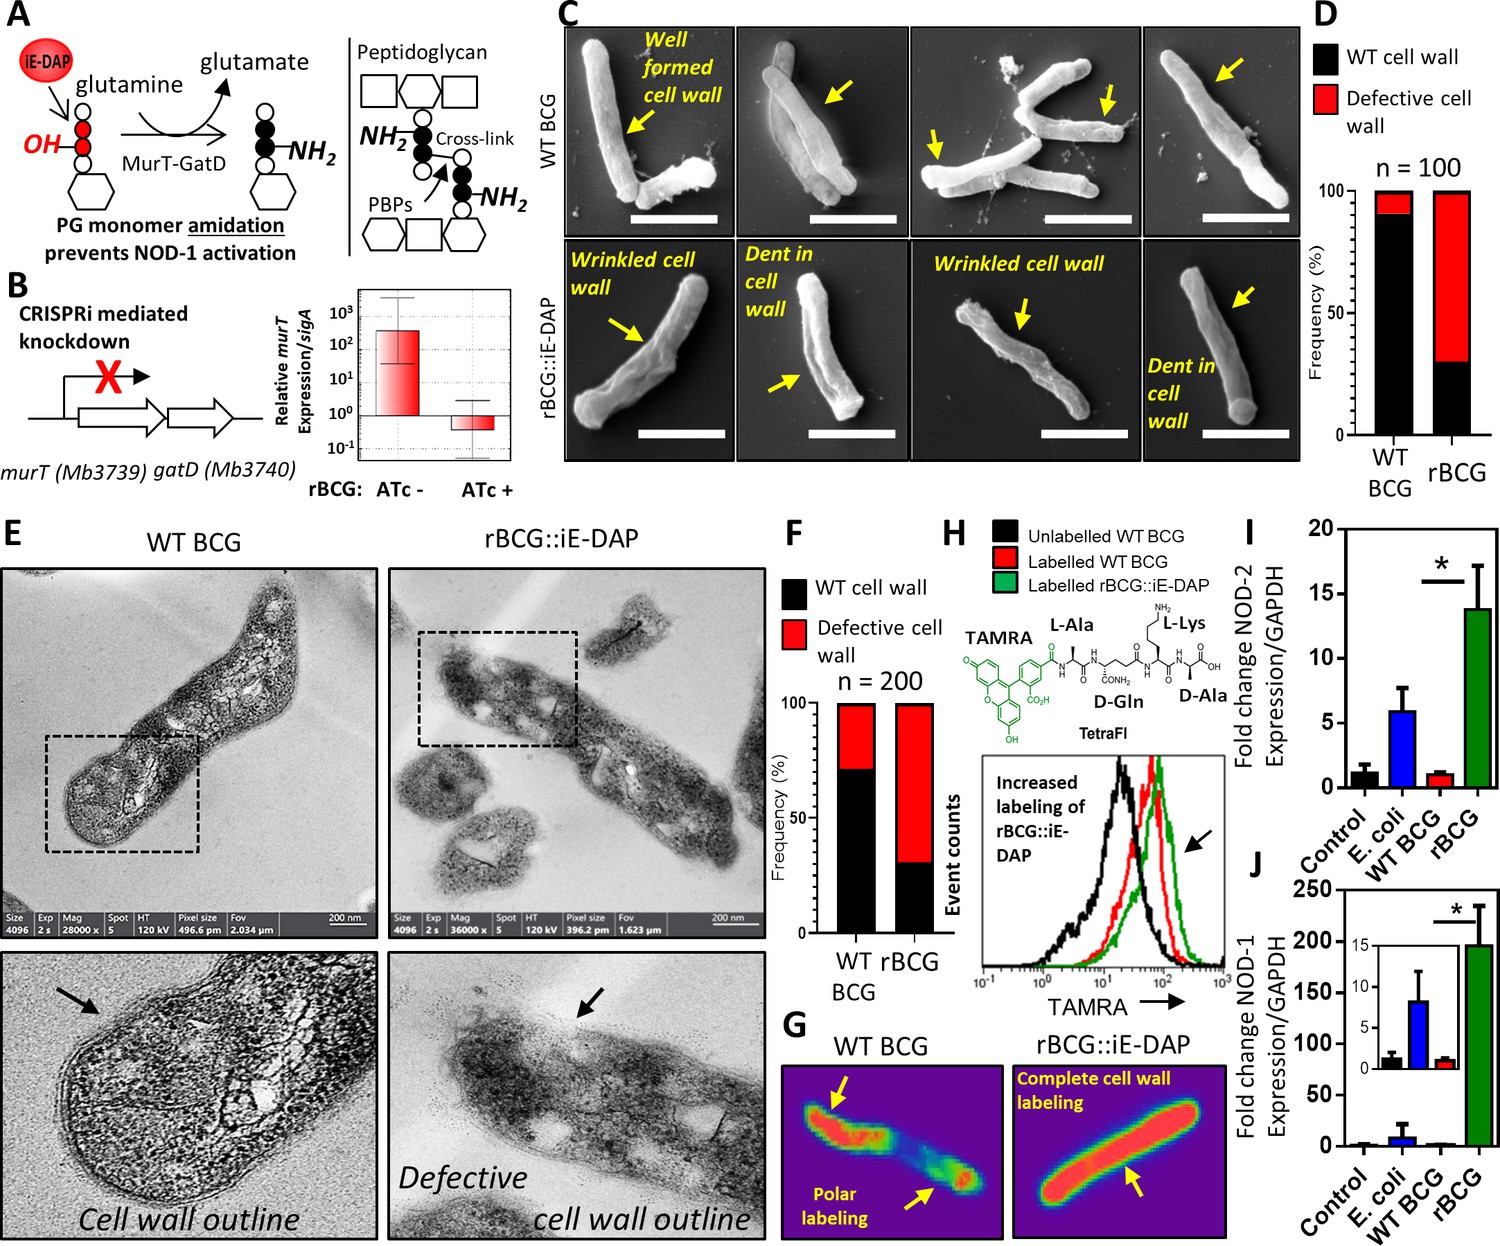
Phenotypic characterization of rBCG::iE-DAP and NOD-1 activation.
(A) Schematic representation of MurT-GatD mediated PG precursor amidation. (B) murT gene expression measured by quantitative PCR in rBCG::iE-DAP. (C) Scanning electron micrographs of WT BCG (n=45 micrographs, 100 cells counted) and rBCG::iE-DAP (n=48 micrographs, 100 cells counted) grown in media supplemented with 200 ng/ml ATc. Scale bar = 1 µm. (D) Frequency of cells with cell wall defects as seen by SEM. (E) Transmission electron micrographs of WT BCG (n=45 micrographs, 200 cells counted) and rBCG::iE-DAP (n=45 micrographs, 200 cells counted) grown in media supplemented with 200 ng/ml ATc. Scale bar = 200 nm. (F) Frequency of cells with cell wall defects as seen by TEM. (G) MurT-GatD depleted cells labeled with fluorescent BODIPY-FL vancomycin. (H) Flow cytometry analysis of WT BCG and rBCG::iE-DAP cells labelled with a PG amidation reporter probe TAMRA-L-Ala-D-glutamine-L-Lys-D-Ala (TetraFI). (I) nod-2 gene expression measured by quantitative PCR in INFγ activated THP-1 macrophages stimulated with E. coli, WT BCG and rBCG::iE-DAP. (J) nod-1 gene expression measured by quantitative PCR in INFγ activated THP-1 macrophages infected with E. coli, WT BCG and rBCG::iE-DAP. Three independent biological repeats (n=3) were assessed. Student t-test was used for statistical analysis. The error bars represent the standard deviation relative to the mean. *: p-value <0.01.
-
Figure 1—source data 1
Phenotypic characterization of rBCG::iE-DAP and NOD-1 activation.
- https://cdn.elifesciences.org/articles/89157/elife-89157-fig1-data1-v2.zip
Figure 1—figure supplement 1

Molecular structures of iE-DAP and iQ-DAP.
iE-DAP is a NOD-1 ligand and modification of iE-DAP (A) to iQ-DAP (B) leads to evasion of NOD-1 activation.
Figure 1—figure supplement 2
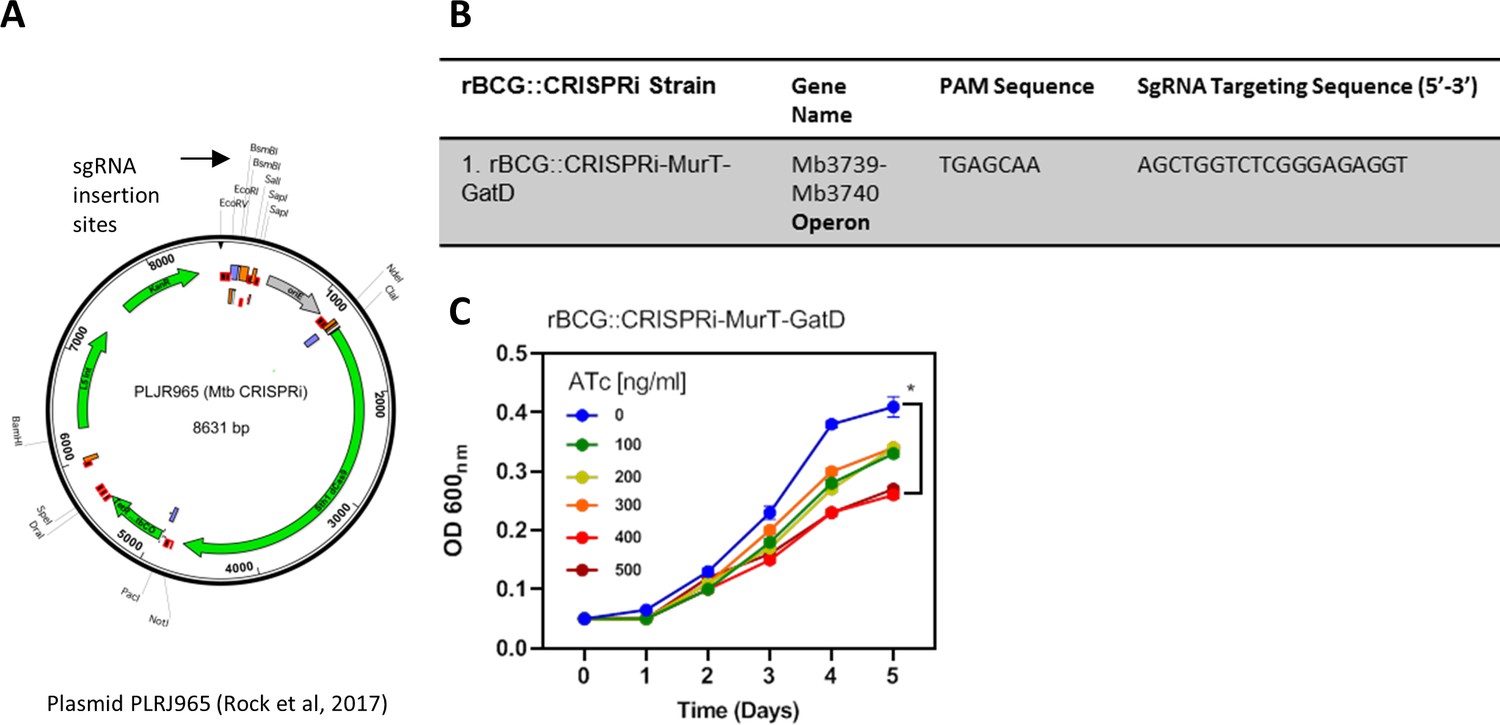
CRISPRi depletion of MurT-GatD in rBCG::iE-DAP.
(A) Plasmid PLRJ965 encoding dCas9 endonuclease from S. thermophiles and for expression of inserted sgRNA. (B) Table with gene targets and sgRNA targeting sequences. (C) Growth kinetics of rBCG::iE-DAP grown in a range of ATc [0–500 ng/ml]. rBCG::iE-DAP grown media without ATc grows at a similar rate as WT BCG. Activation of the CRISPRi platform in rBCG::iE-DAP with ATc [100–500 ng/ml] resulted in reduced growth in a concentration dependent manner. Three independent biological repeats (n=3) were assessed. Student t-test was used for statistical analysis. The error bars represent the standard deviation relative to the mean. *: p-value <0.01.
-
Figure 1—figure supplement 2—source data 1
Growth kinetics of rBCG:: iE-DAP.
- https://cdn.elifesciences.org/articles/89157/elife-89157-fig1-figsupp2-data1-v2.zip
Figure 1—figure supplement 3
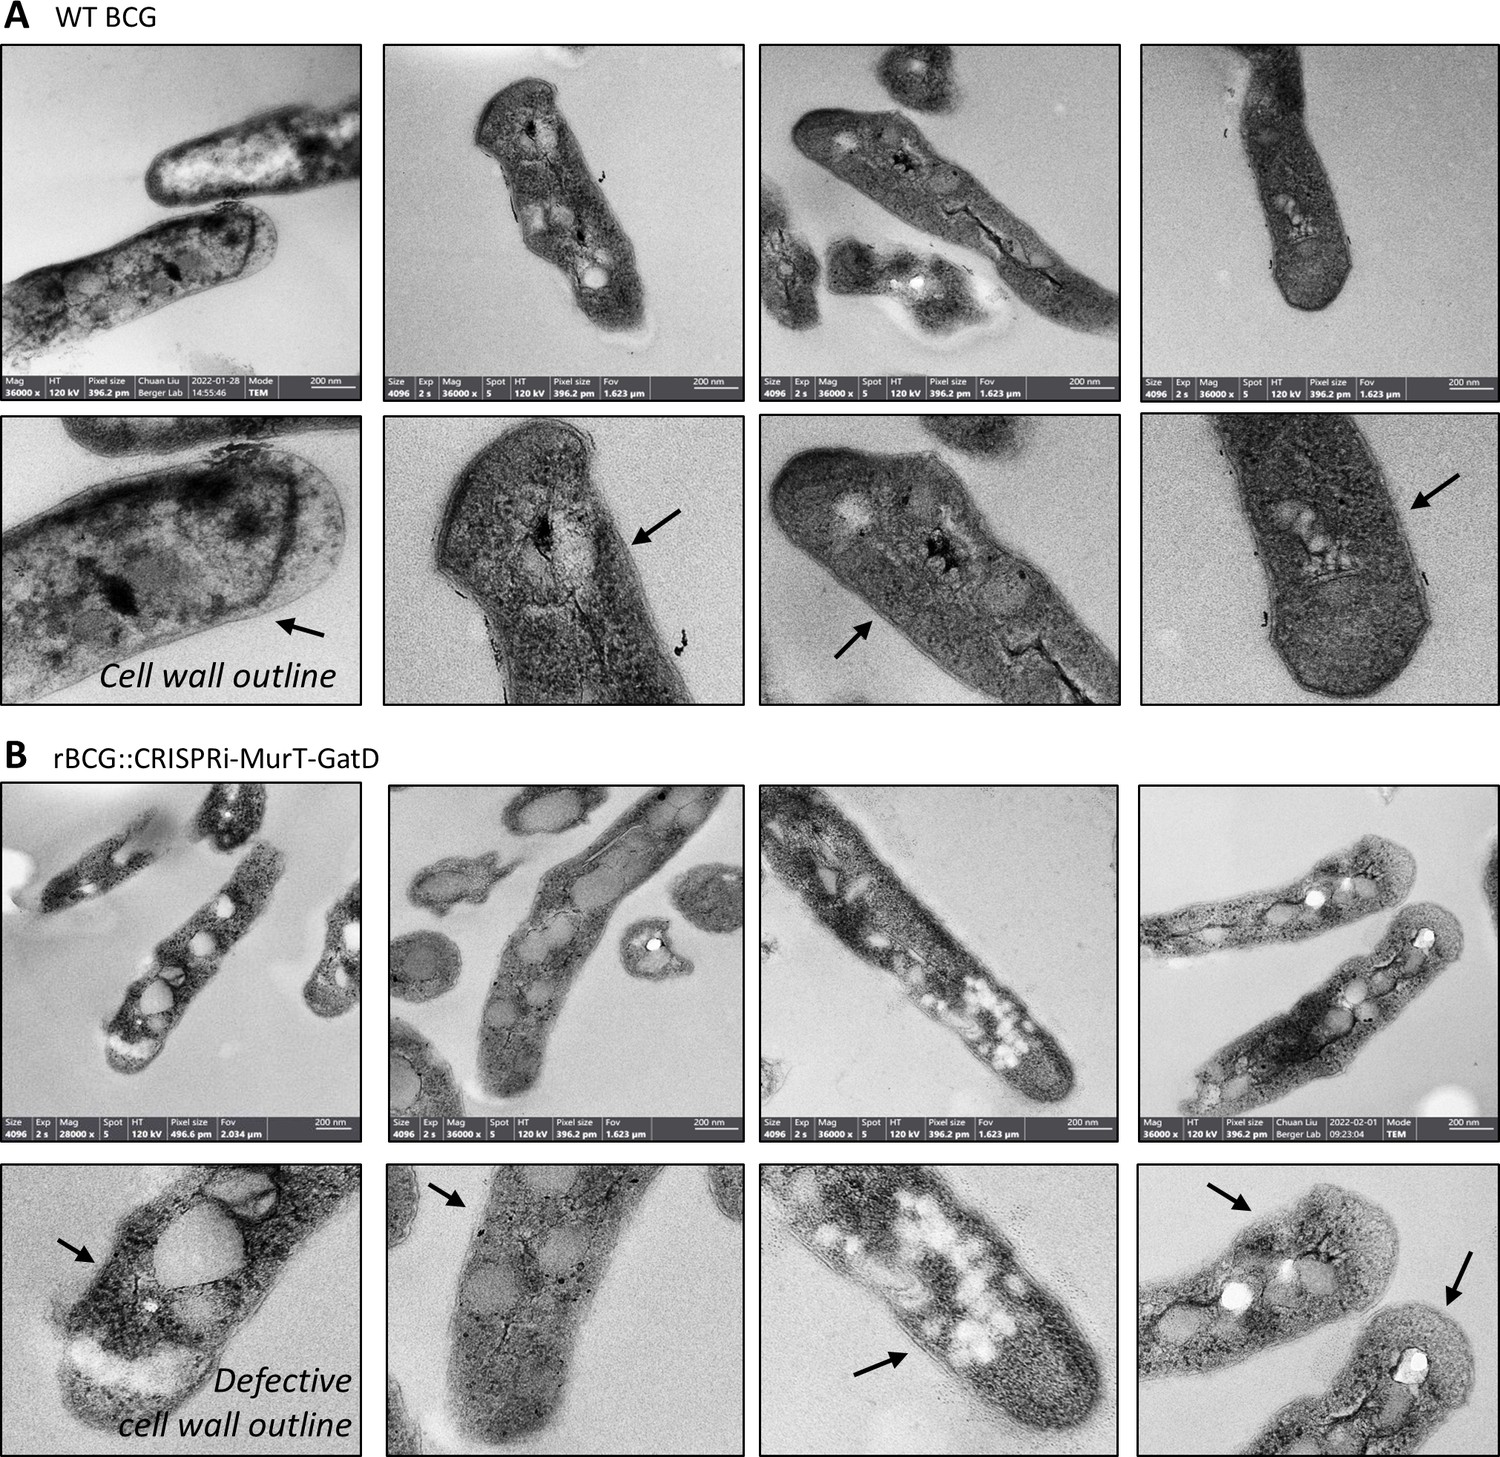
TEM reveals defective cell wall of rBCG::iE-DAP.
Transmission electron micrographs of WT BCG (A) and rBCG::iE-DAP (B) grown in media supplemented with 200 ng/ml ATc. Depletion of MurT-GatD causes cell wall defects. Three independent biological repeats were assessed (n=3). Scale bar = 200 nm.
Figure 1—figure supplement 4
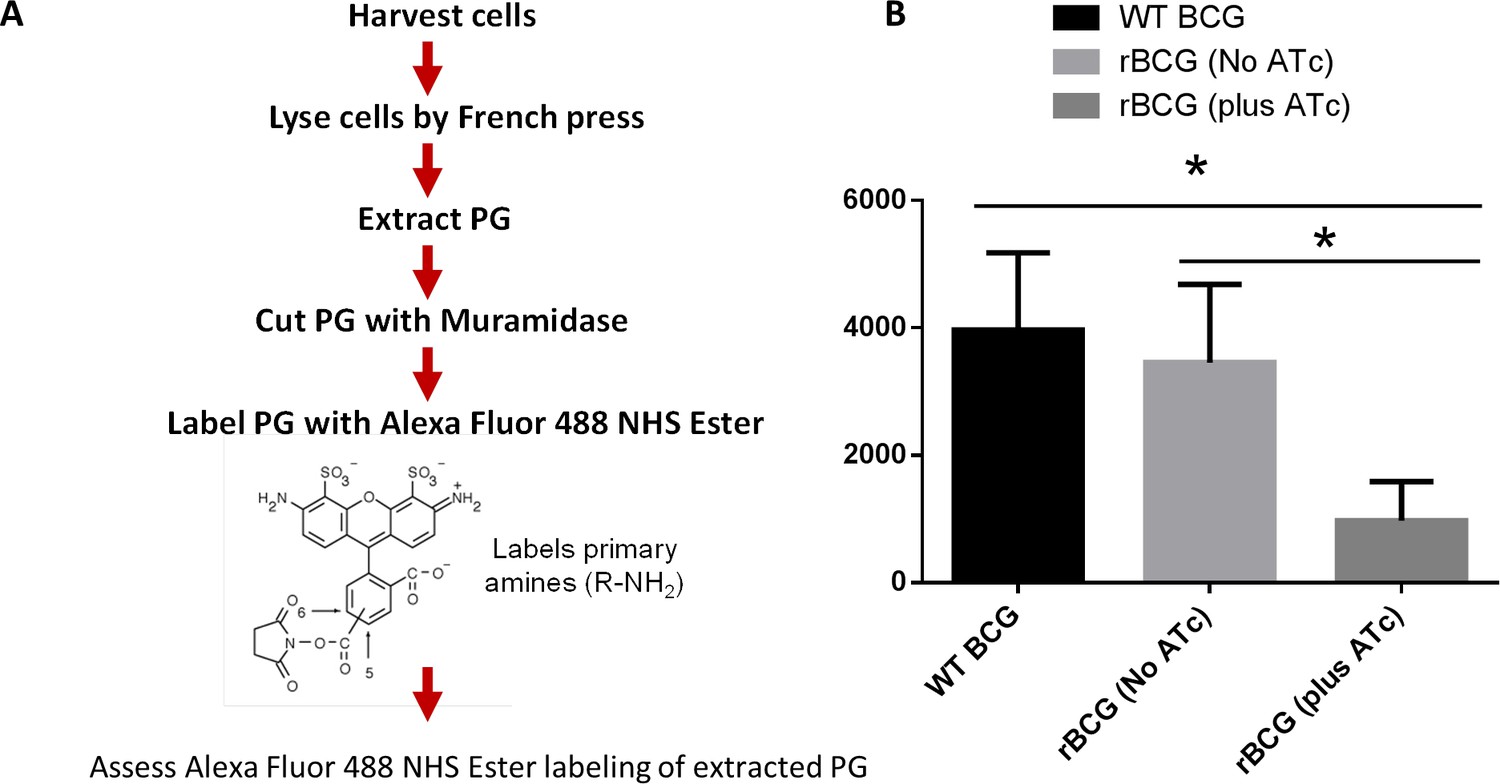
Depletion of MurT and GatD causes reduced PG amidation.
(A) Flow chart representation of the protocol used for assessing PG amidation in MurT-GatD depleted cells by Alexa Fluor 488 NHS Ester labelling of PG in comparison with control cells (ATc- and WT BCG). The Alexa Fluor 488 NHS Ester labels primary amines (R–NH2) also found in PG as a result of amidation. (B). Quantification of Alexa Fluor 488 NHS Ester labeled PG from MurT-GatD depleted cells in comparison to the no ATc control cells. MurT-GatD depletion causes decreased PG amidation which results in decreased labeling with Alexa Fluor 488 NHS Ester. Three independent biological repeats (n=3) were assessed. Student t-test was used for statistical analysis. The error bars represent the standard deviation relative to the mean. *: p-value <0.01.
-
Figure 1—figure supplement 4—source data 1
Depletion of MurT and GatD causes reduced PG amidation.
- https://cdn.elifesciences.org/articles/89157/elife-89157-fig1-figsupp4-data1-v2.zip
Figure 1—figure supplement 5
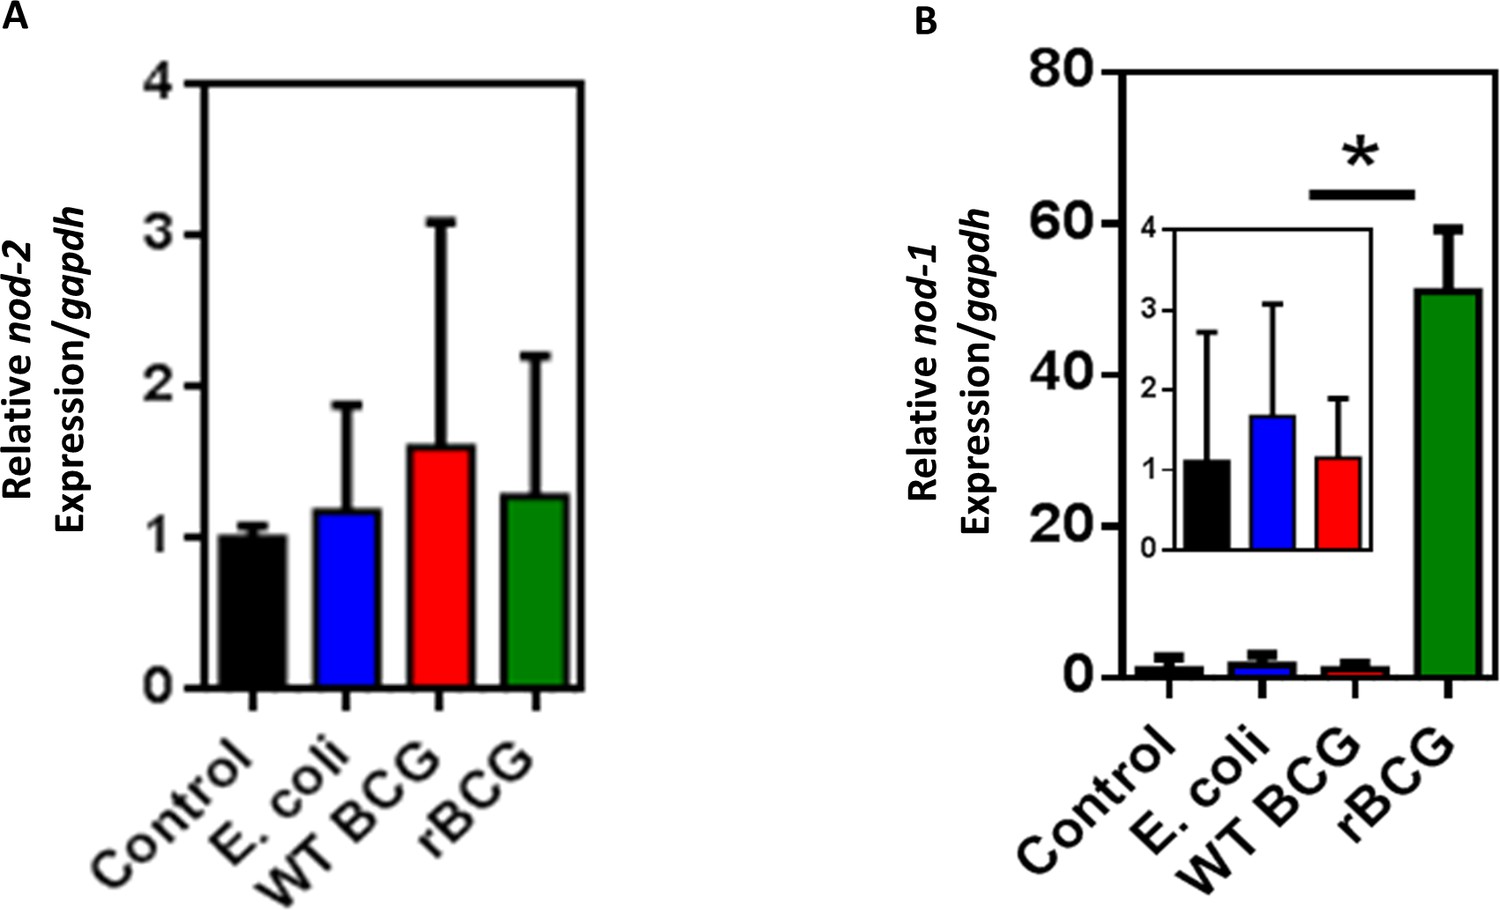
qPCR of nod-1 and nod-2 expression in non-activated THP-1 macrophages.
(A) nod-2 gene expression measured by quantitative PCR in non-activated THP-1 macrophages stimulated with E. coli, WT BCG and rBCG::iE-DAP. (B) nod-1 gene expression measured by quantitative PCR in non-activated THP-1 macrophages infected with E. coli, WT BCG and rBCG::iE-DAP. Three independent biological repeats (n=3) were assessed. Student t-test was used for statistical analysis. The error bars represent the standard deviation relative to the mean. *: p-value <0.01.
-
Figure 1—figure supplement 5—source data 1
qPCR of nod-1 and nod-2 expression in THP-1 macrophages.
- https://cdn.elifesciences.org/articles/89157/elife-89157-fig1-figsupp5-data1-v2.zip
Figure 2 with 2 supplements
Survival of rBCG::iE-DAP in IFNγ activated bone marrow derived macrophages (BMDMs), training of monocytes and activation with doxycycline.
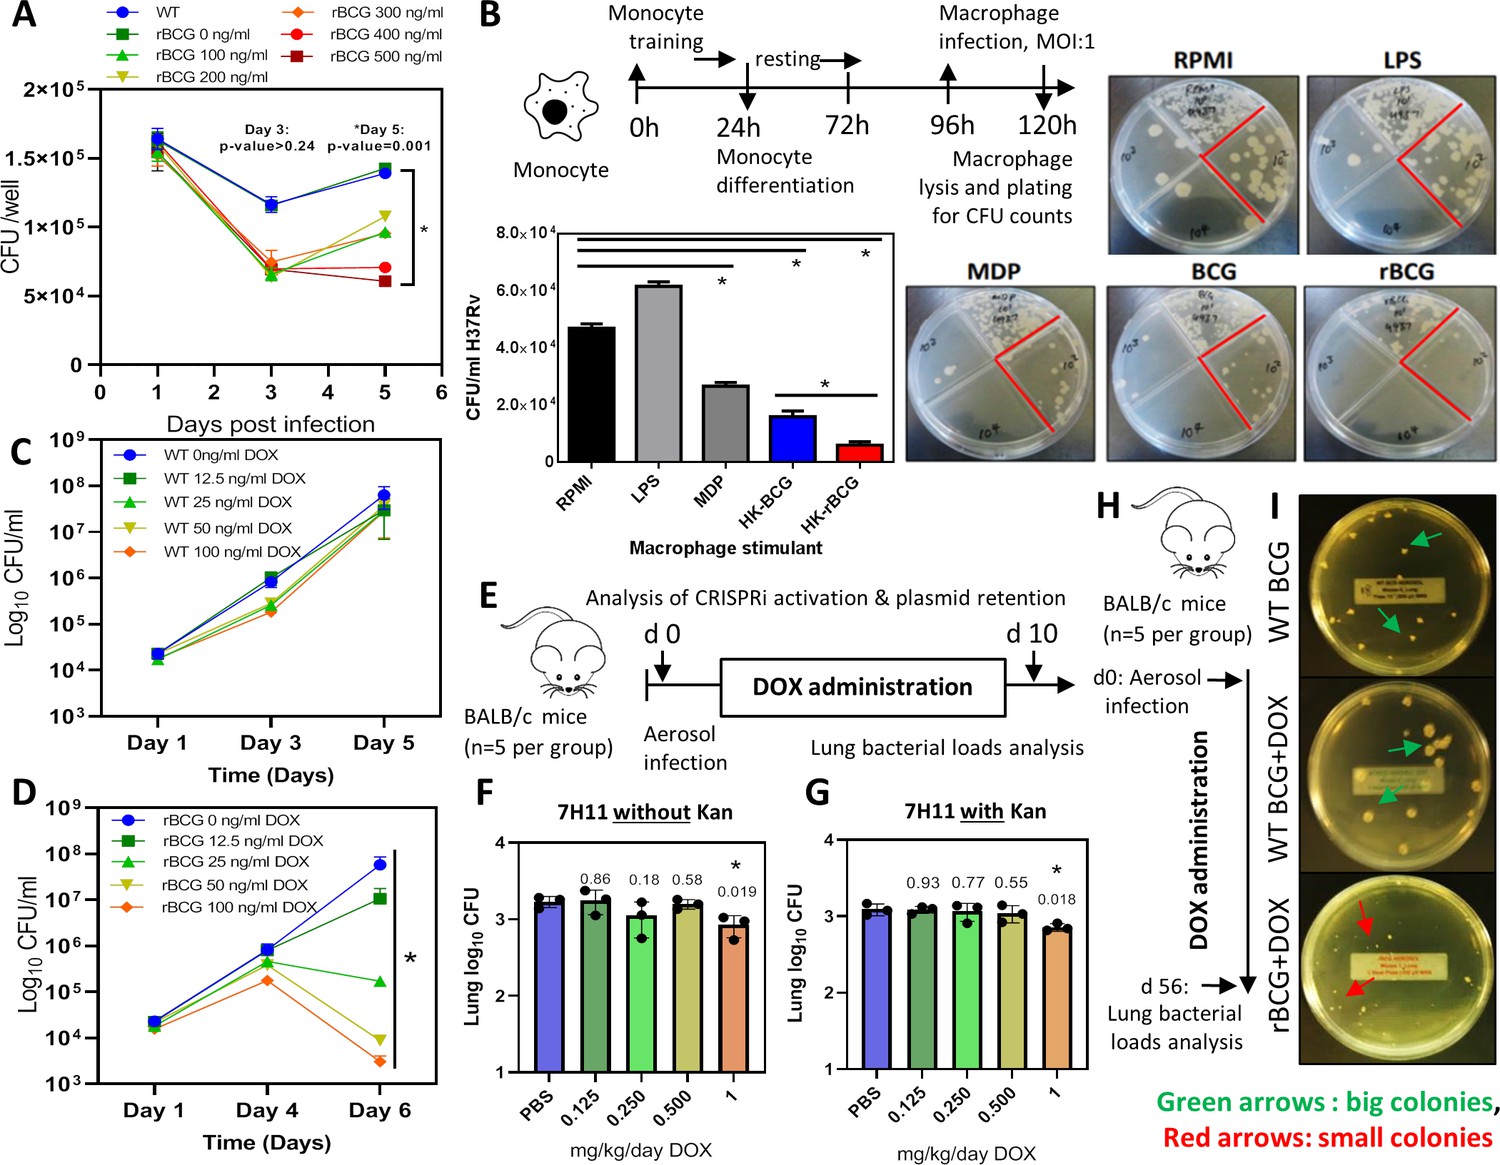
(A) IFNγ-activated BMDMs (1x10⁶ cells) were infected at MOI: 1 with WT BCG and rBCG::iE-DAP. ATc was added to culture media for induction of the CRISPRi system in rBCG::iE-DAP at concentrations ranging from 100 ng/ml – 500 ng/ml and growth of the strains was assessed after 3 and 5 days. (B) Training of U937 monocytes with heat-killed (HK)-rBCG::iE-DAP compared to HK-WT BCG. Shown is also the representative plates for the experiment. (C, D) CFU counts of in vitro grown WT BCG and of rBCG::iE-DAP grown in complete 7H9 medium at varying concentrations of Dox. (E) Determination of the Dox concentration for activation of rBCG::iE-DAP in vivo. Mice were aerosol infected with ~2.5 log10 CFU of rBCG and Dox (0.125–1 mg/kg/day) - was administered by oral gavage for 10 days. (F, G) CFU counts from the experiment shown in panel E. Lung homogenates were plated on both 7H11 with (G) and without (F) kanamycin (25 µg/ml) to assess the loss of the CRISPRi plasmid during in vivo growth. p-values are given above the graphs. (H) Aerosol infection of mice with ~2.5 log10 CFU of WT BCG, rBCG::iE-DAP and administration of Dox (1 mg/kg/day) for 8 weeks. (I) Plates showing the colony size of rBCG::iE-DAP+Dox compared to WT BCG or WT BCG+Dox, recovered from the lungs of aerosol infected mice from the experiment shown in panel H. Three independent biological repeats (n=3) were assessed for the in vitro experiments, the error bars represent the standard deviation relative to the mean. Five mice per group (n=5) were used for the in vivo experiments. Student t-test was used for statistical analysis. The error bars represent the standard deviation relative to the mean. *: p-value <0.05.
-
Figure 2—source data 1
Activation of rBCG::iE-DAP in BMDMs, training of monocytes and activation with doxycycline.
- https://cdn.elifesciences.org/articles/89157/elife-89157-fig2-data1-v2.zip
Figure 2—figure supplement 1

Analysis of secreted TNFα levels from non-activated and IFN-activated BMDMs infected with WT BCG and rBCG::iE-DAP at MOI 1:20.
Increased TNF secretion was observed from rBCG::iE-DAP infected IFN-activated BMDMs cultured in media supplemented with 500 ng/ml ATc. LPS was used as a control. Three independent biological repeats (n=3) were assessed. Student t-test was used for statistical analysis. The error bars represent the standard deviation relative to the mean *: p-value <0.01.
-
Figure 2—figure supplement 1—source data 1
TNFα ELISA of non-activated and IFNγ-activated BMDMs infected with WT BCG and rBCG:: iE-DAP.
- https://cdn.elifesciences.org/articles/89157/elife-89157-fig2-figsupp1-data1-v2.zip
Figure 2—figure supplement 2
Efficacy of 1 mg/kg/day dose of doxycycline for CRISPRi activation.
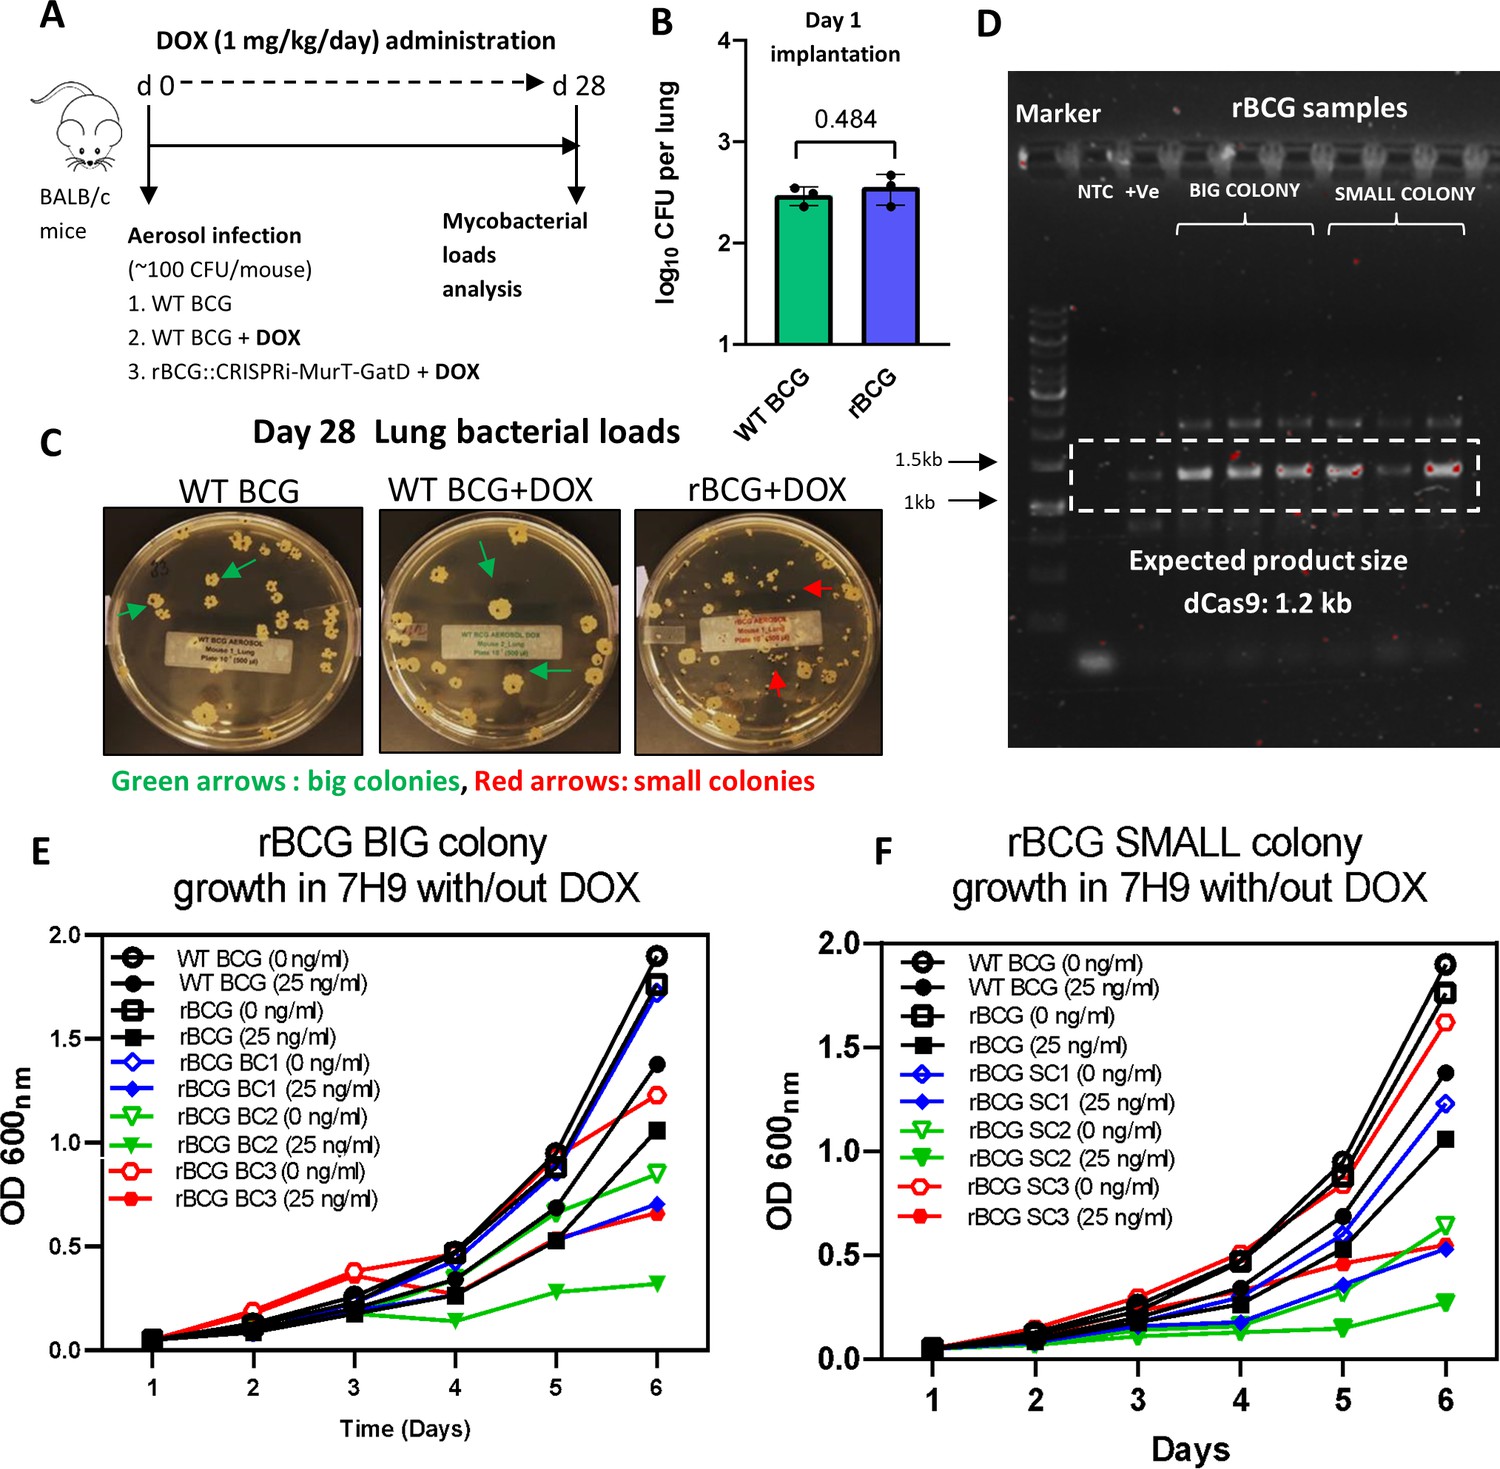
(A) Schematic representation of mice aerosol infection with WT BCG and rBCG::iE-DAP and analysis of the efficacy of 1 mg/kg/day dose of doxycycline for CRISPRi-MurT-GatD activation in vivo. (B) Day 1 implantation of WT BCG and rBCG::iE-DAP in the lungs of aerosol infected mice. (C) Day 28 bacterial loads of WT BCG and rBCG::iE-DAP aerosol infected mice. (D) PCR amplification of dCas9 in recovered Big (BC) or Small (SC) rBCG::iE-DAP colonies. Lane 1 is 1 kb plus DNA molecular weight marker. (E, F) Growth kinetics of big and small colonies of rBCG::iE-DAP vs WT BCG in liquid broth supplemented with Doxycycline. Three independent biological repeats (n=3) were assessed for the in vitro experiment. Five mice per group (n=5) were used for the in vivo experiments. Statistical analysis was conducted using student t-test. The error bars represent the standard deviation relative to the mean. *: p-value:<0.01.
-
Figure 2—figure supplement 2—source data 1
Efficacy of 1 mg/kg/day dose of doxycycline for CRISPRi Figure 2—figure supplement 2d activation.
- https://cdn.elifesciences.org/articles/89157/elife-89157-fig2-figsupp2-data1-v2.zip
Figure 3
Analysis of rBCG::iE-DAP strain attenuation.
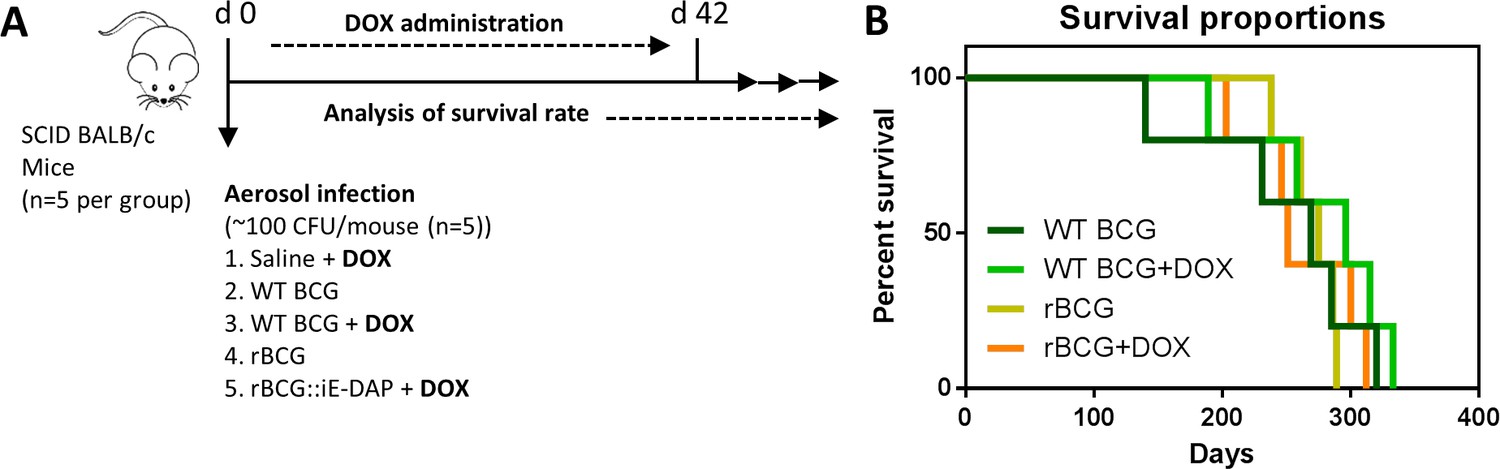
(A) Schematic representation of SCID mice aerosol infection with WT BCG and rBCG::iE-DAP for analysis of strain attenuation. rBCG::iE-DAP activation in vivo was performed by administration of Dox at 1 mg/kg/day. SCID mice (n=5 per group) were aerosol infected with ~2.5 log10 CFU of WT BCG or rBCG::iE-DAP, a WT BCG+Dox group was included as a control. (B) Percent survival of SCID mice following low-dose challenge with WT BCG and rBCG compared to WT BCG+Dox or rBCG+Dox groups. Five mice per group (n=5) were used for the in vivo experiments. student t-test was used for statistical analysis.
-
Figure 3—source data 1
Analysis of rBCG::iE-DAP strain attenuation.
- https://cdn.elifesciences.org/articles/89157/elife-89157-fig3-data1-v2.zip
Figure 4 with 1 supplement
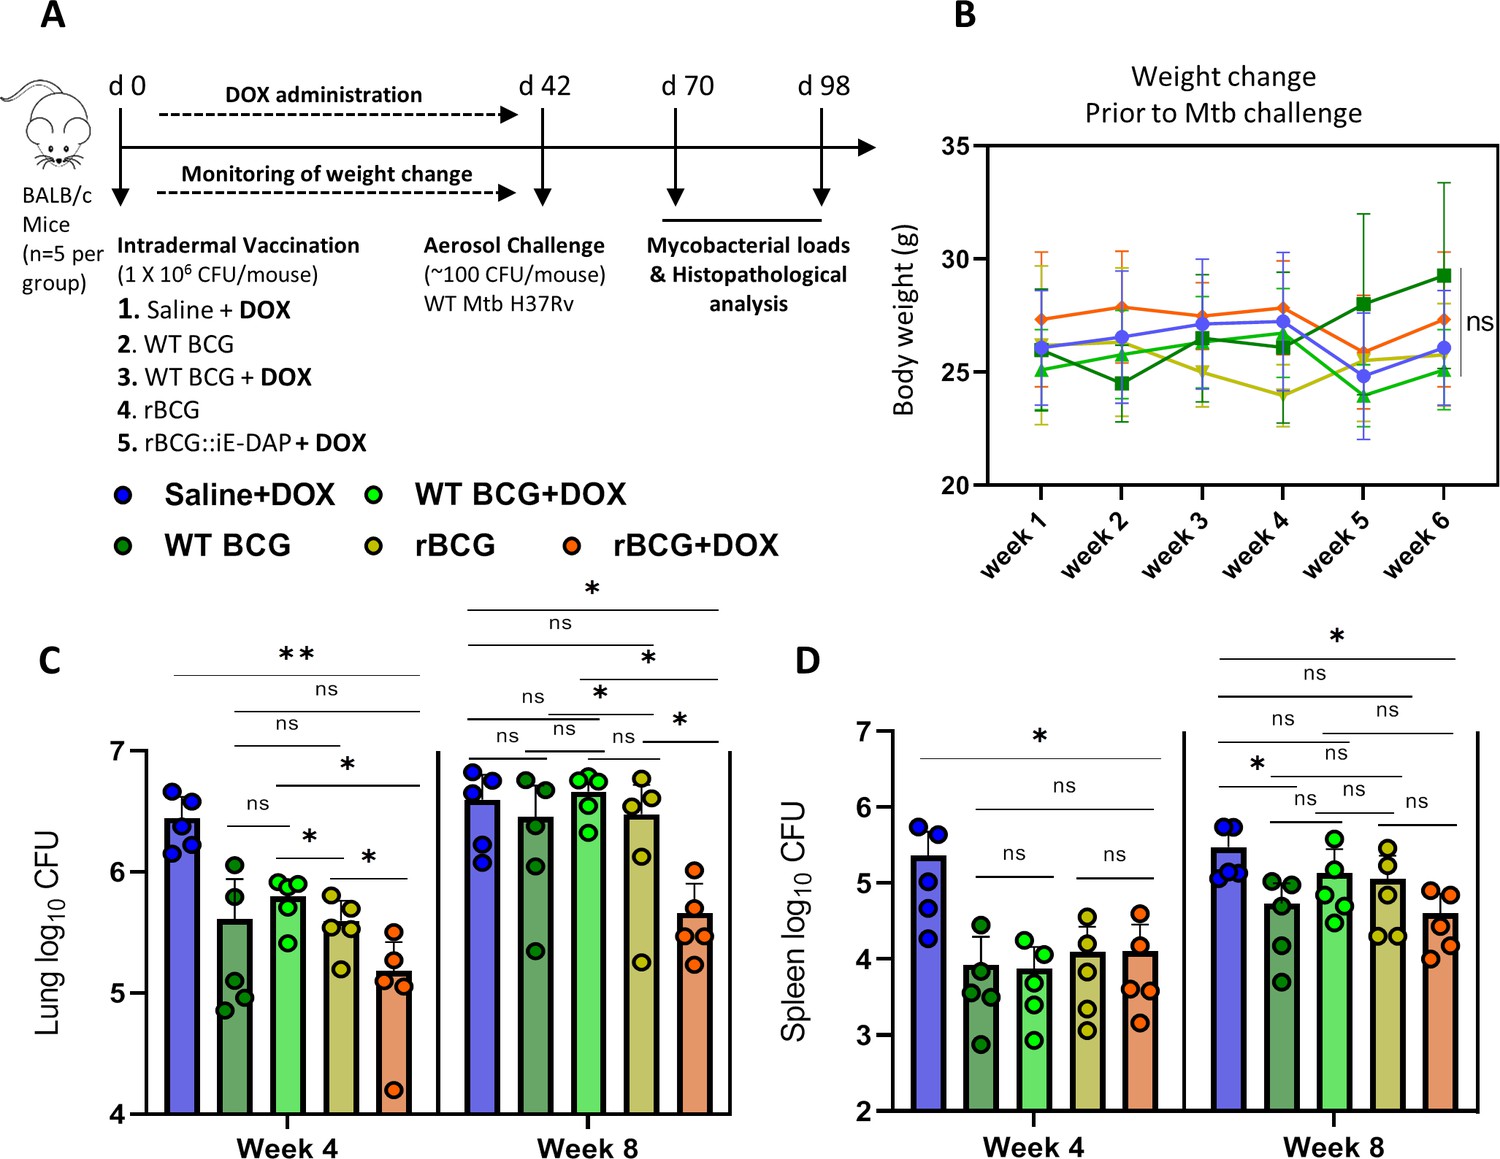
Efficacy of rBCG::iE-DAP in comparison to standard WT BCG for protection against Mtb H37Rv infection in mice.
(A) Schematic representation of the mouse immunization and Mtb H37Rv challenge protocol. (B) Percentage weight change at week 6 (day 42) immediately prior to Mtb challenge. (C, D) Lung and Spleen bacterial burdens at week 4 and week 8 post-challenge with Mtb. Five mice per group (n=5) were used for the in vivo experiments. Student t-test was used for statistical analysis. The error bars represent the standard deviation relative to the mean. *: p-value <0.05, **: p-value <0.01.
-
Figure 4—source data 1
Efficacy of rBCG::iE-DAP in comparison to standard WT BCG for protection against Mtb H37Rv infection in mice.
- https://cdn.elifesciences.org/articles/89157/elife-89157-fig4-data1-v2.zip
Figure 4—figure supplement 1
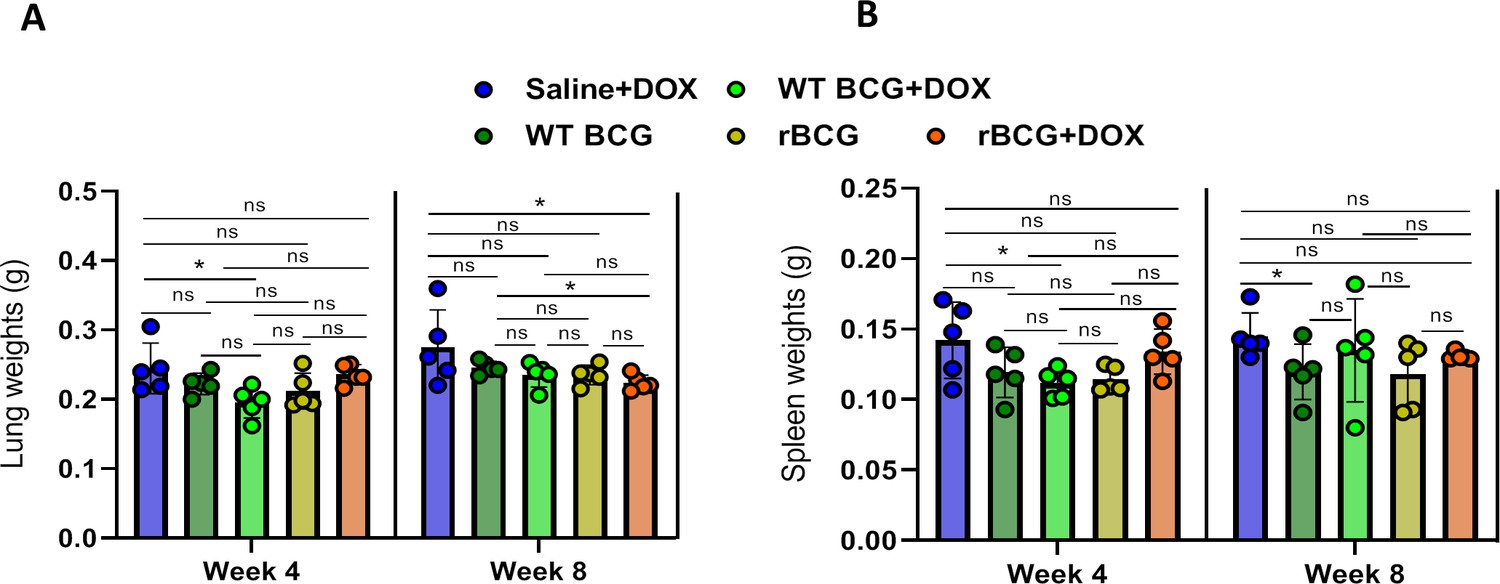
Lumg and spleen weights post-challenge with Mtb.
(A) Lung weights at week 4 and week 8 post-challenge with Mtb. (B) Spleen weights at week 4 and week 8 post-challenge with Mtb. Five mice per group (n=5) were used for the in vivo experiments. Statistical analysis was conducted using student t-test. The error bars represent the standard deviation relative to the mean. *: p-value:<0.01.
-
Figure 4—figure supplement 1—source data 1
Lung and spleen weights post-challenge with Mtb.
- https://cdn.elifesciences.org/articles/89157/elife-89157-fig4-figsupp1-data1-v2.zip
Figure 5
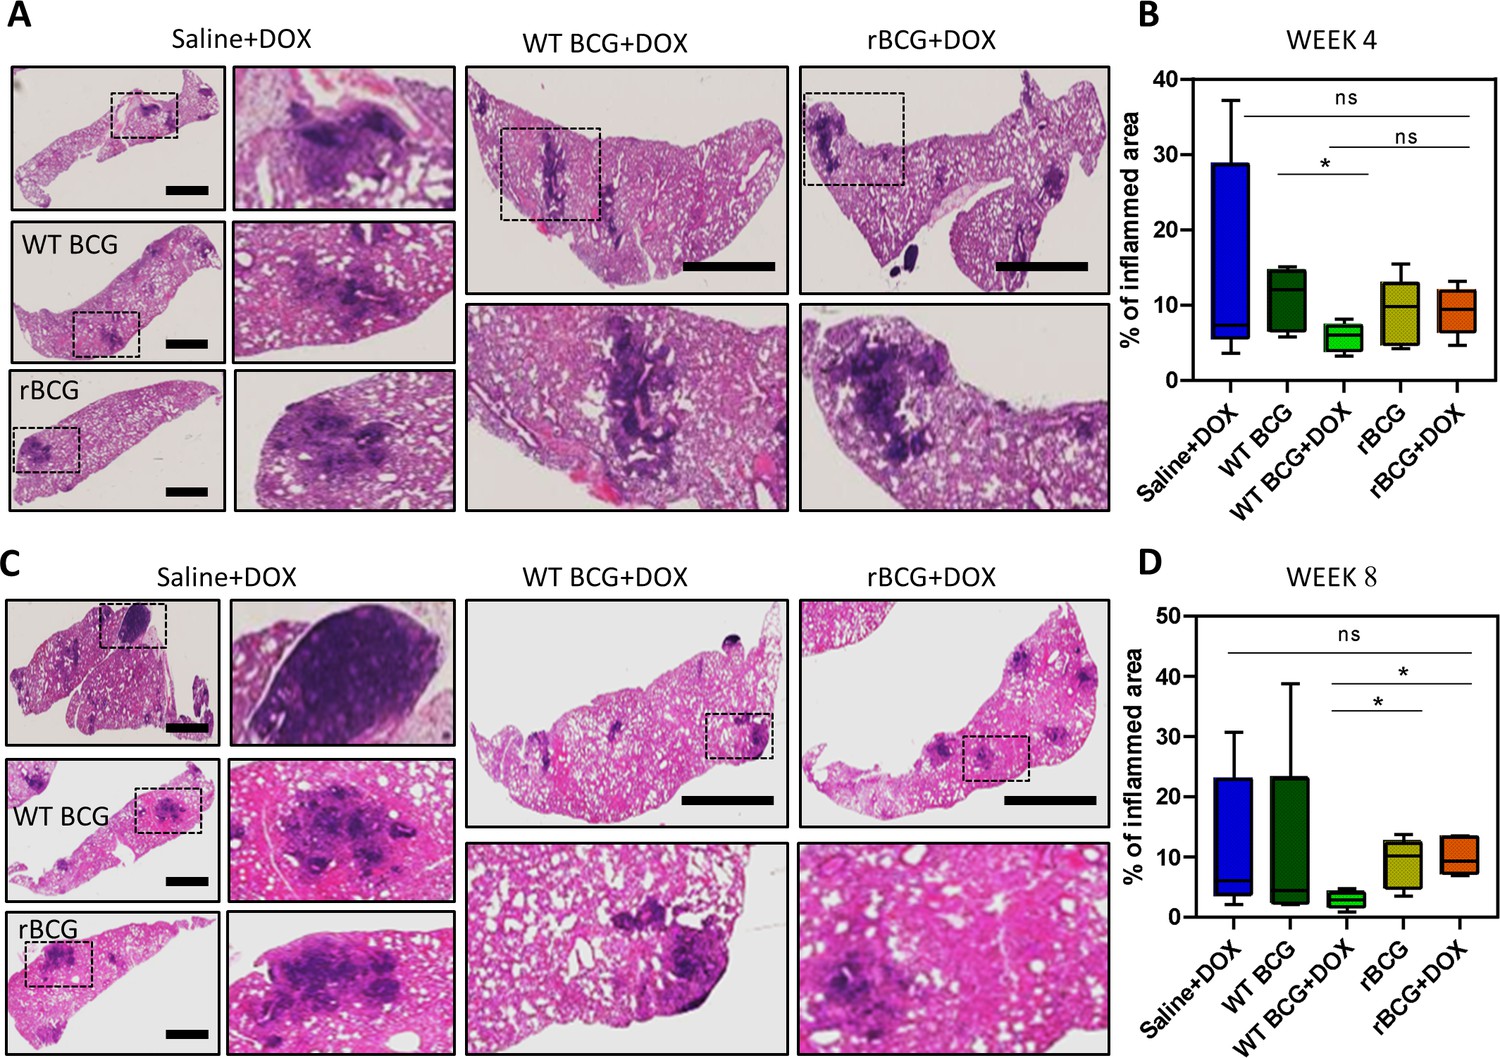
Histopathological analysis of lung samples.
(A) Histological haematoxylin and eosin (H&E) staining of lung samples at week 4 post Mtb challenge. Scale bar = 2.5 mm. (B) Analysis of percentage of inflamed area (indicated with black boxes) from each mouse lung per immunized group (n=5 per group), shows that rBCG::iE-DAP+Dox immunized mice present with early lung inflammation compared to WT BCG+Dox. (C) H&E staining of lung samples at week 8 post Mtb H37Rv infection. Scale bar = 2.5 mm. (D) Analysis of percentage of inflamed area from each mouse lung (n=5 per group). The percentage inflamed area was evaluated using ImageJ software (NIH) and plotted as whisker box-plots (whiskers represent minimum and maximum values) and a student t-test was used for statistical analysis. Lung sections were derived from 5 mice per group (n=5) from Figure 4a experiments. Statistical analysis was conducted using student t-test. The error bars represent the standard deviation relative to the mean. *: p-value <0.05.
-
Figure 5—source data 1
Histopathological analysis of lung samples.
- https://cdn.elifesciences.org/articles/89157/elife-89157-fig5-data1-v2.zip
Tables
Table 1
Minimum inhibitory concentrations of cell wall targeting antibiotics on rBCG::iE-DAP.
| Drug (µg/ml) | WT BCG (MIC) | rBCG (MIC) |
|---|---|---|
| Amoxicillin | >64 | >64 |
| Amoxicillin-Clavulanate | >64 | 8 |
| Meropenem | 32 | 2 |
| Vancomycin | 8 | 4 |
| Ethionamide | >64 | 32 |
-
Table 1—source data 1
Minimum inhibitory concentrations of cell wall targeting antibiotics.
- https://cdn.elifesciences.org/articles/89157/elife-89157-table1-data1-v2.zip
Key resources table
| Reagent type (species) or resource | Designation | Source or reference | Identifiers | Additional information |
|---|---|---|---|---|
| strain, strain background (Mycobacterium bovis BCG pasteur) | WT BCG | Gift from Dr Peter Sander (Institute of Medical Microbiology, University of Zurich, Zurich, Switzerland) | BCG Pasteur SmR | |
| strain, strain background (recombinant BCG::iE-DAP) | rBCG::iE-DAP | This paper | rBCG::iE-DAP | |
| strain, strain background (Mycobacterium tuberculosis H37Rv) | Mtb H37RvS | Centre of Excellence for Biomedical TB Research (Wits University, Johannesburg) | Mtb H37RvS | |
| strain, strain background (Mycobacterium tuberculosis H37Rv) | Mtb H37Rv | Center for Tuberculosis Research (Johns Hopkins University School of Medicine) | Mtb H37Rv | |
| cell line (THP-1 monocytes) | THP-1 monocytes | Gift from Dr Janine Scholefield (Council for Scientific and Industrial Research, South Africa) | Cells authenticated by the supplier by morphology. Mycoplasma contamination test: negative | |
| cell line (U937 promonocytes) | U937 monocytes | Gift from Dr Janine Scholefield (Council for Scientific and Industrial Research, Pretoria, South Africa) | Cells authenticated by the supplier by morphology. Mycoplasma contamination test: negative | |
| strain, strain background (BALB/c mice) | BALB/c mice | The Jackson laboratory (USA) | BALB/cJ strain #000651 | RRID:IMSR_JAX:000651 |
| strain, strain background (BALB/c SCID mice) | BALB/c SCID mice | The Jackson laboratory (USA) | CBySmn.Cg-Prkdcscid/J strain#: 001803 | RRID:IMSR_JAX:001803 |
Additional files
Download links
A two-part list of links to download the article, or parts of the article, in various formats.
Downloads (link to download the article as PDF)
Open citations (links to open the citations from this article in various online reference manager services)
Cite this article (links to download the citations from this article in formats compatible with various reference manager tools)
A modified BCG with depletion of enzymes associated with peptidoglycan amidation induces enhanced protection against tuberculosis in mice
eLife 13:e89157.
https://doi.org/10.7554/eLife.89157


