Mechanism of substrate binding and transport in BASS transporters
- School of Life Sciences, University of Warwick, United Kingdom
- Department of Physics, Arizona State University, United States
- Malvern Panalytical Ltd, United Kingdom
Figures
Figure 1 with 2 supplements
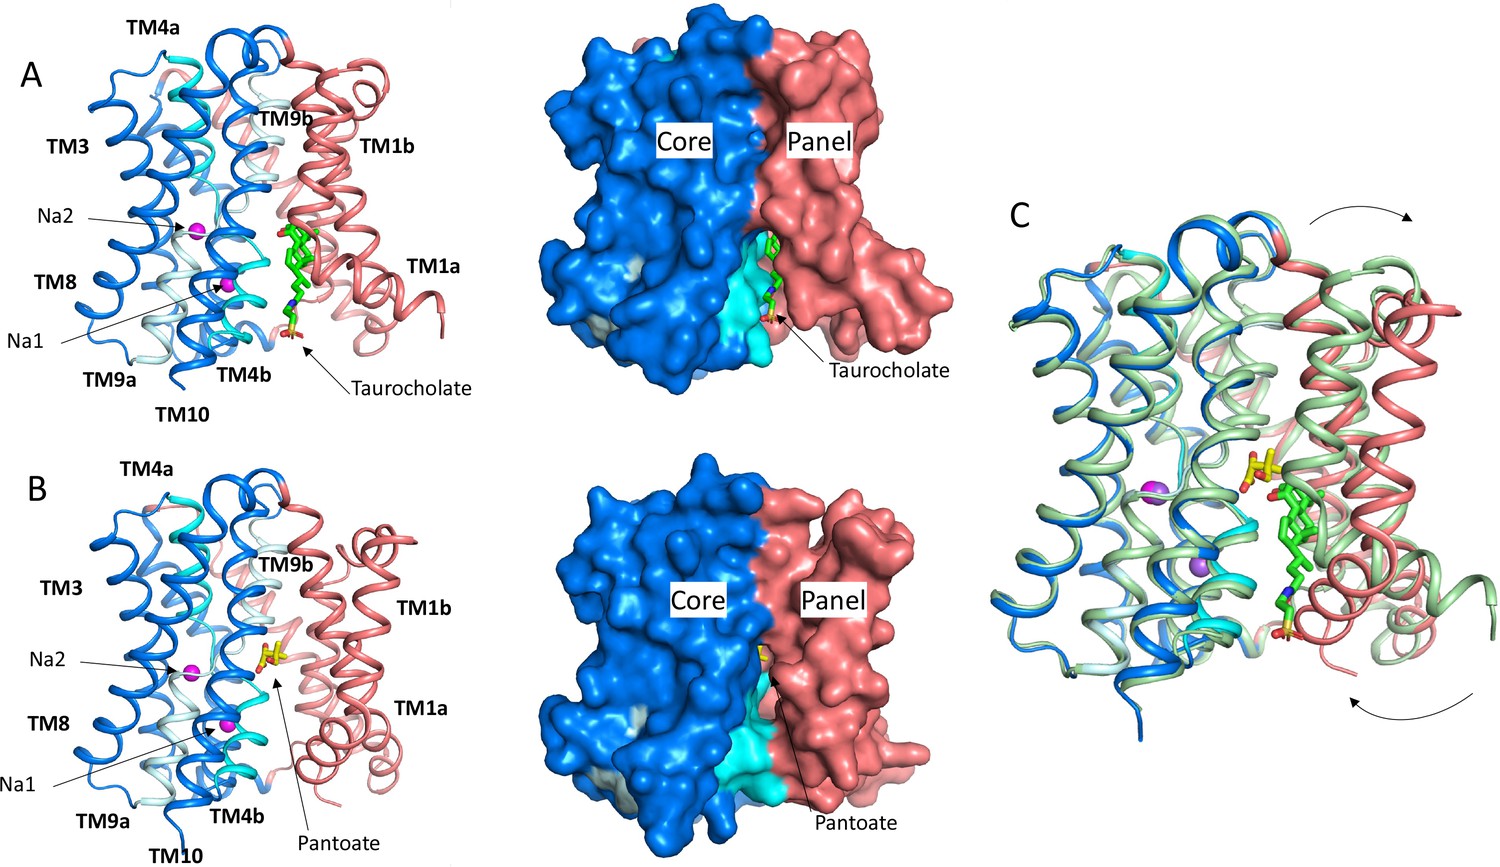
Structure of ASBTNM.
(A) Structure of ASBTNM in complex with taurocholate ASBTNM(TCH) (Hu et al., 2011). The panel domain is coloured salmon. The core domain is coloured blue with the cross-over helices, TM4 and TM9 in cyan and pale blue, respectively. The taurocholate is shown in a stick representation with green carbon atoms and the sodium ions are shown as magenta spheres. Left, cartoon representation, Right, surface representation. (B) As A for the structure in complex with pantoate (ASBTNM(Pan)). The pantoate is depicted with yellow carbon atoms. (C) Superposition of ASBTNM(Pan) (colouring as A) on ASBTNM(TCH) (pale green carbon atoms). The arrows show the movement of TM1.
Figure 1—figure supplement 1
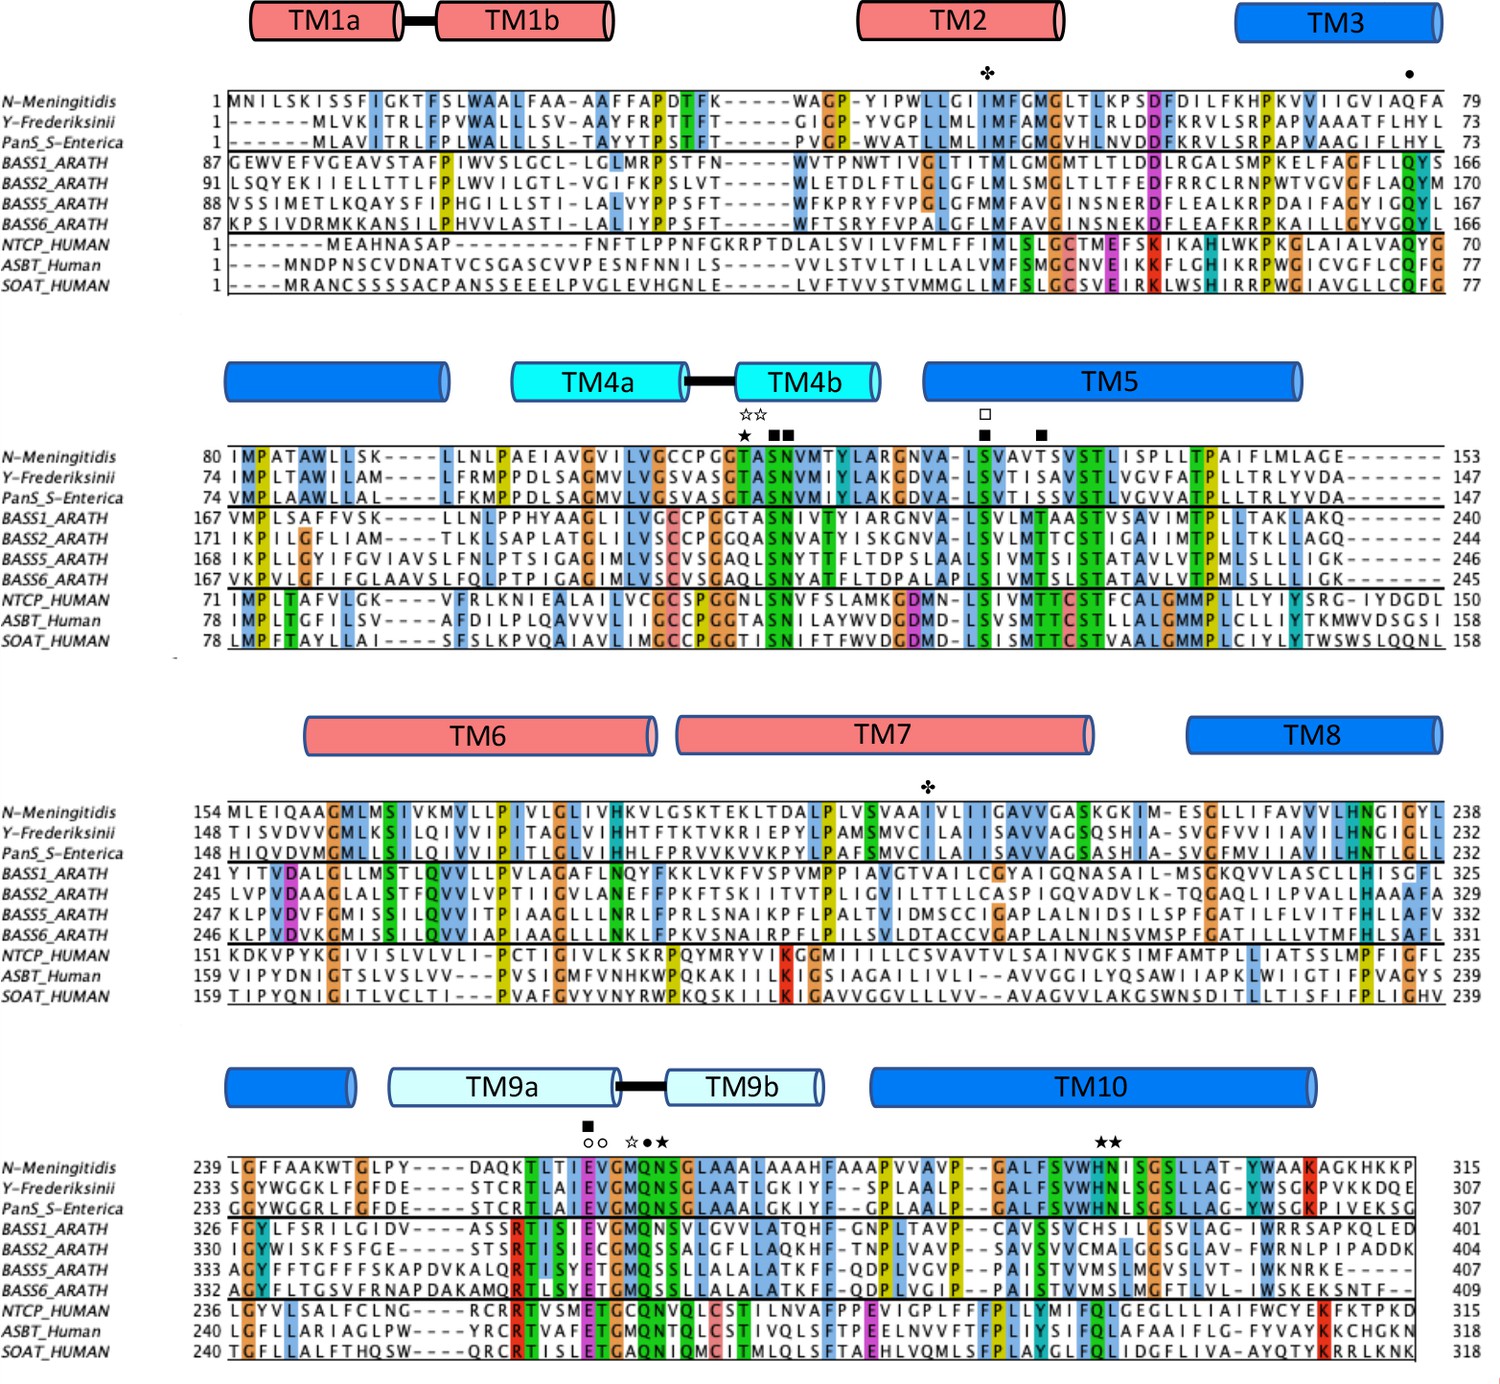
Sequence alignment.
Sequence alignment of ASBTNM (Q9K0A9) against the bacterial transporters ASBTYF (4N7W) and PanS Q8ZKL0, and with selected bile acid sodium symporter (BASS) transporters from humans (sodium taurocholate cotransporting polypeptide [NTCP] Q14973, apical sodium dependent bile acid transporter [ASBT] Q12908 sodium-dependent organic anion transporter [SOAT] Q3KNW5) and Arabidopsis thaliana (BASS 1 Q93YR2, BASS 2 Q1EBV7, BASS 5 F4JPW1, BASS 6 Q8VYY4). The plant and human BASS transporters chosen are the best characterised in the family and are most likely to be sodium-coupled transporters based on the conservation of the sodium binding residues. The secondary structure in ASBTNM is shown with the transmembrane helices coloured as in Figure 1. Bacterial, plant, and human transporters are grouped separately with residues completely conserved within each group coloured according to the ClustalW colouring scheme in Jalview (Waterhouse et al., 2009). Starred residues denote hydrogen bonding to the pantoate with a solid (★) for side chain interactions and an open star (☆) for main chain. The symbol ✤ denotes a residue within van der Waals distance of the pantoate. Interactions with Na1 are denoted by squares with solid squares (◻◼) denoting interactions with the side chain and open squares (◻) for interactions through the main chain carbonyl oxygen. Interactions with Na2 are denoted by circles with filled circles (●) denoting interactions with the side chain and open circles (◯) for interactions through the main chain carbonyl oxygen.
Figure 1—video 1
Morph between ASBTNM(Pan) and ASBTNM(TCH).
The colouring is shown as in Figure 1. The sodium ions and pantoate from the ASBTNM(Pan) structure are held rigid during the morph of the protein atoms.
Figure 2
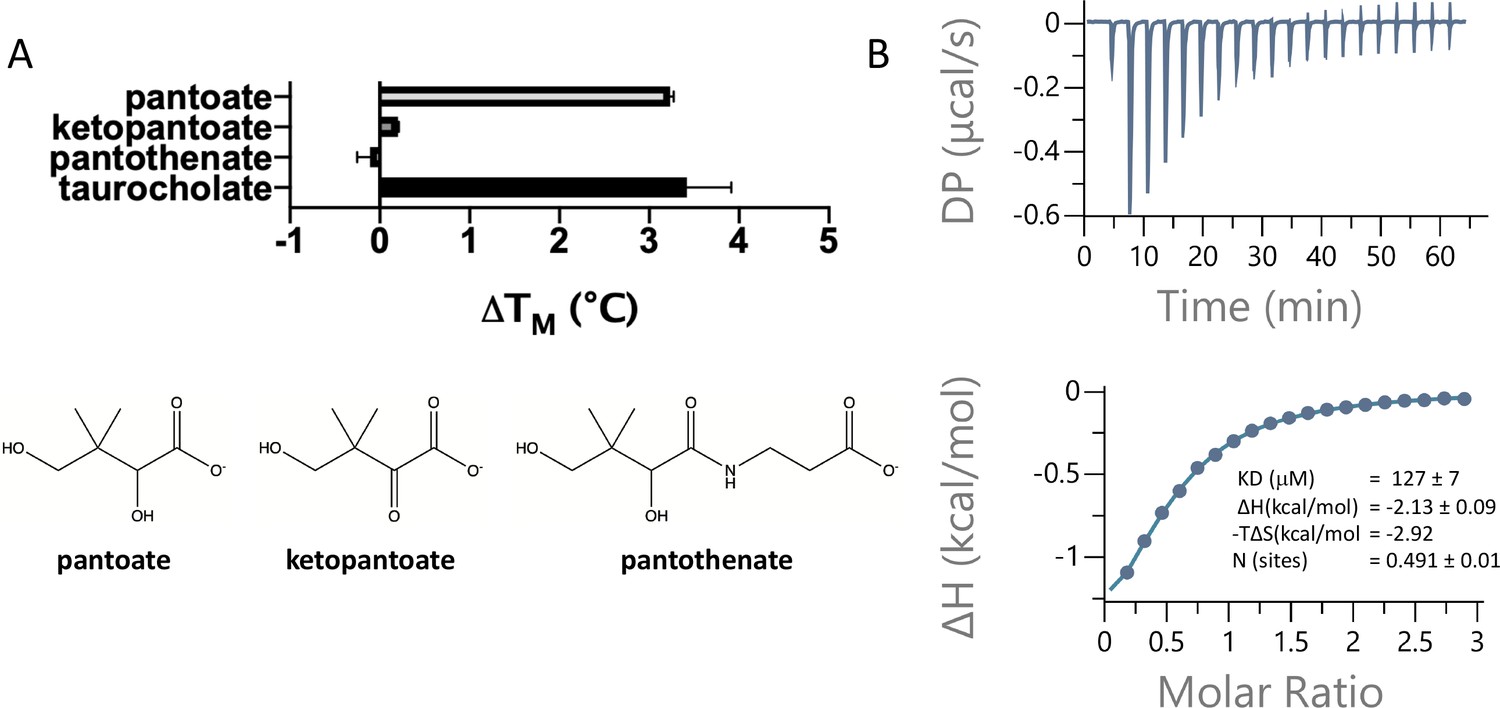
Pantoate binding to ASBTNM.
(A) Results from thermostability assay showing that pantoate stabilises ASBTNM to a similar extent to taurocholate. The compounds are shown below. The mean and standard deviations are shown based on three individual experiments. (B) Pantoate binding to ASBTNM measured by isothermal calorimetry.
Figure 3 with 1 supplement
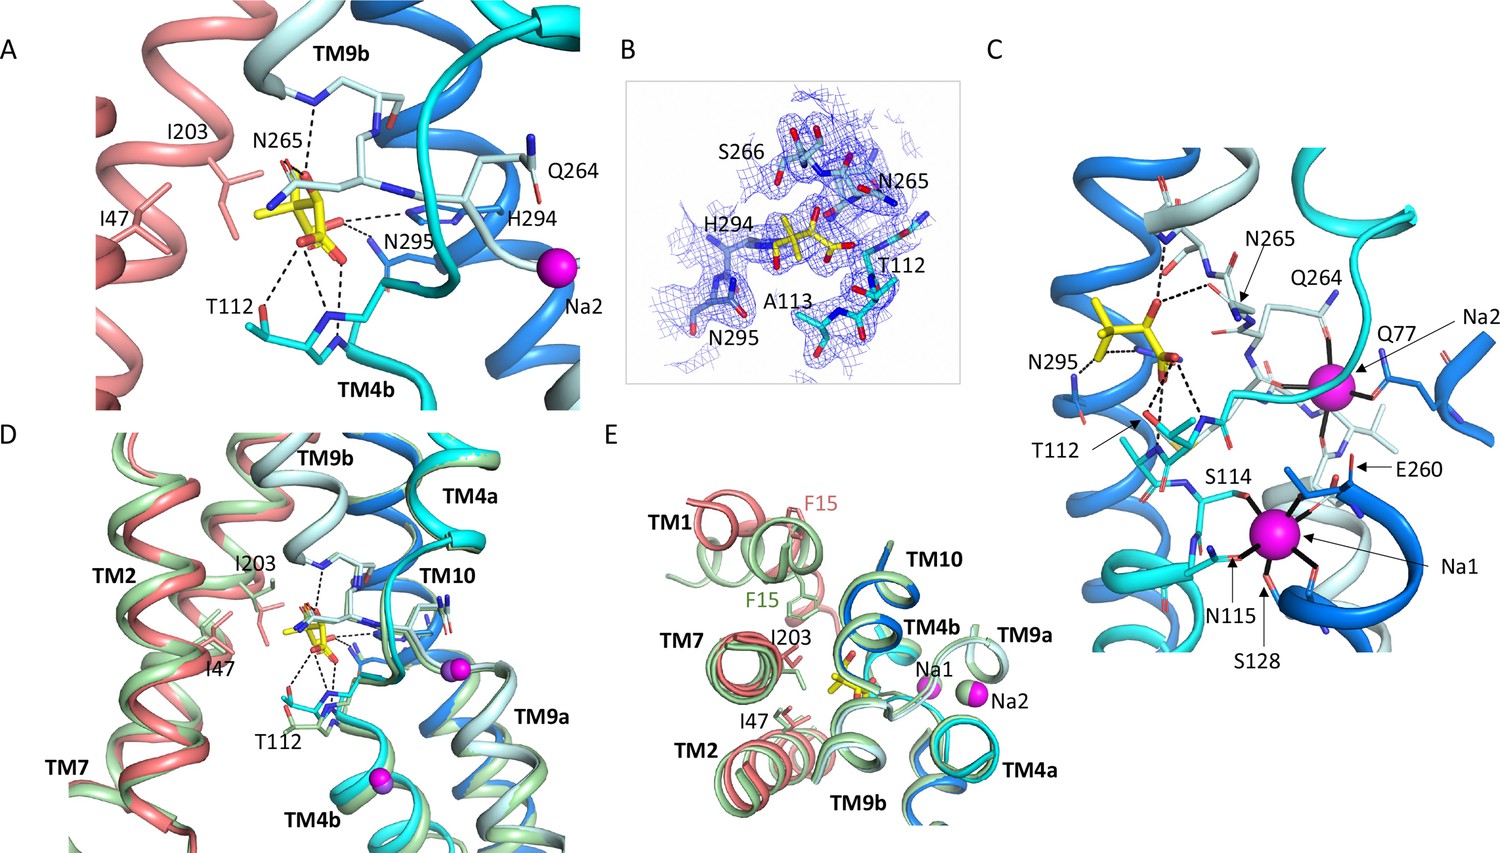
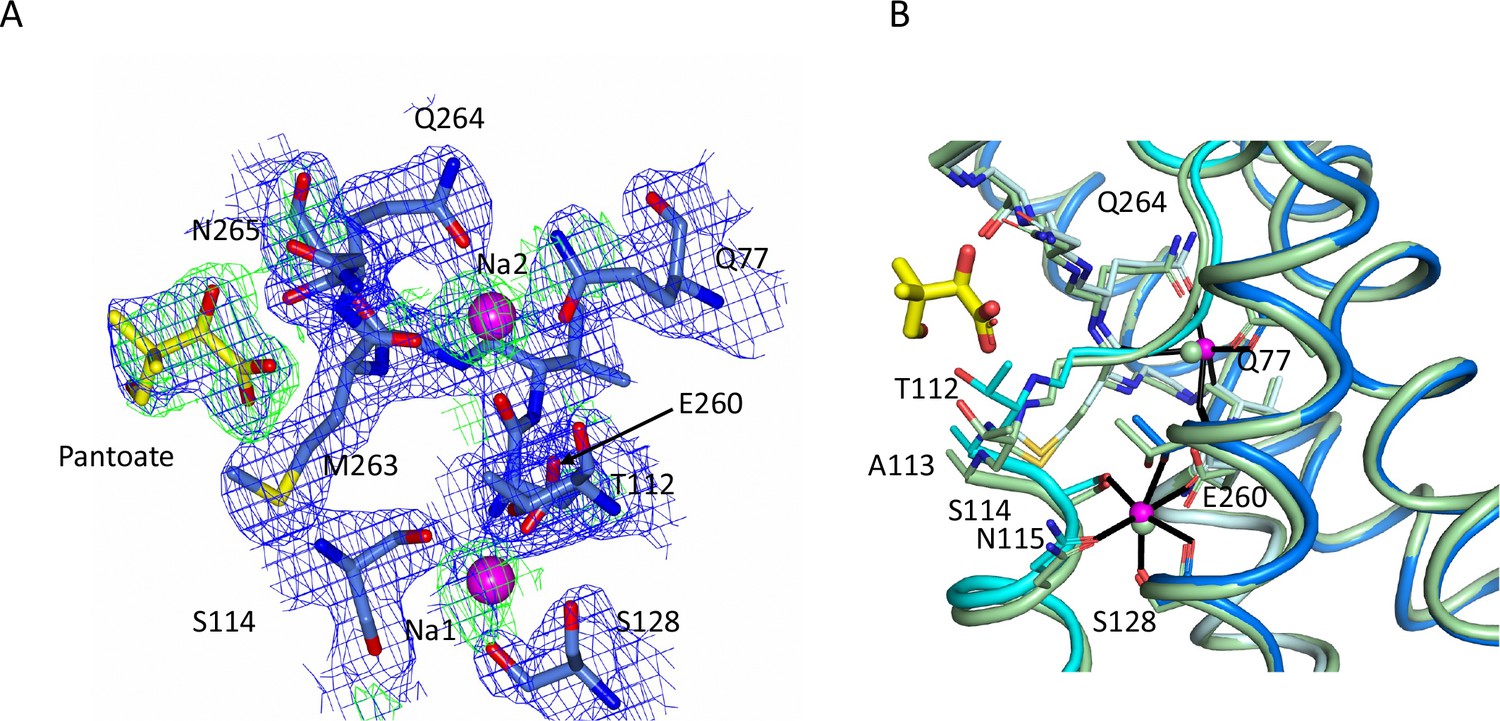
Pantoate binding site.
(A) The pantoate binding site in the ASBTNM(Pan) structure, coloured as in Figure 1. Hydrogen bonds are shown as dashed lines. (B) 2mFo-Fc density for the refined structure. The density is contoured at 1σ. (C) View of the ASBTNM(Pan) structure highlighting the juxtaposition of the residues interacting with the sodium ions and those interacting with the pantoate. (D) Superposition of the ASBTNM(TCH) structure (pale green) on the ASBTNM(Pan) structure highlighting the difference in position of TM4b and especially Thr 112 between the two structures. (E) As D but shown from the extracellular side highlighting the differences in position of Ile 203 and Phe 15.
Figure 3—figure supplement 1
Sodium site for the ASBTNM(Pan) structure.
(A) Electron density associated with the sodium ions and pantoate. The 2mFo-DFc density (blue) was calculated based on phases from the refined structure and was contoured at 1σ. The mFo-DFc density (green) contoured at 2.5σ was calculated from a map where the structure had been refined with simulated annealing after omission of the sodium ions and pantoate. The methyl-propanol moiety is less well defined than the hydroxyacetate. (B) Superposition of the ASBTNM(Pan) structure (coloured as in Figure 1) on the ASBTNM(TCH) structure (pale green carbon atoms).
Figure 4 with 1 supplement
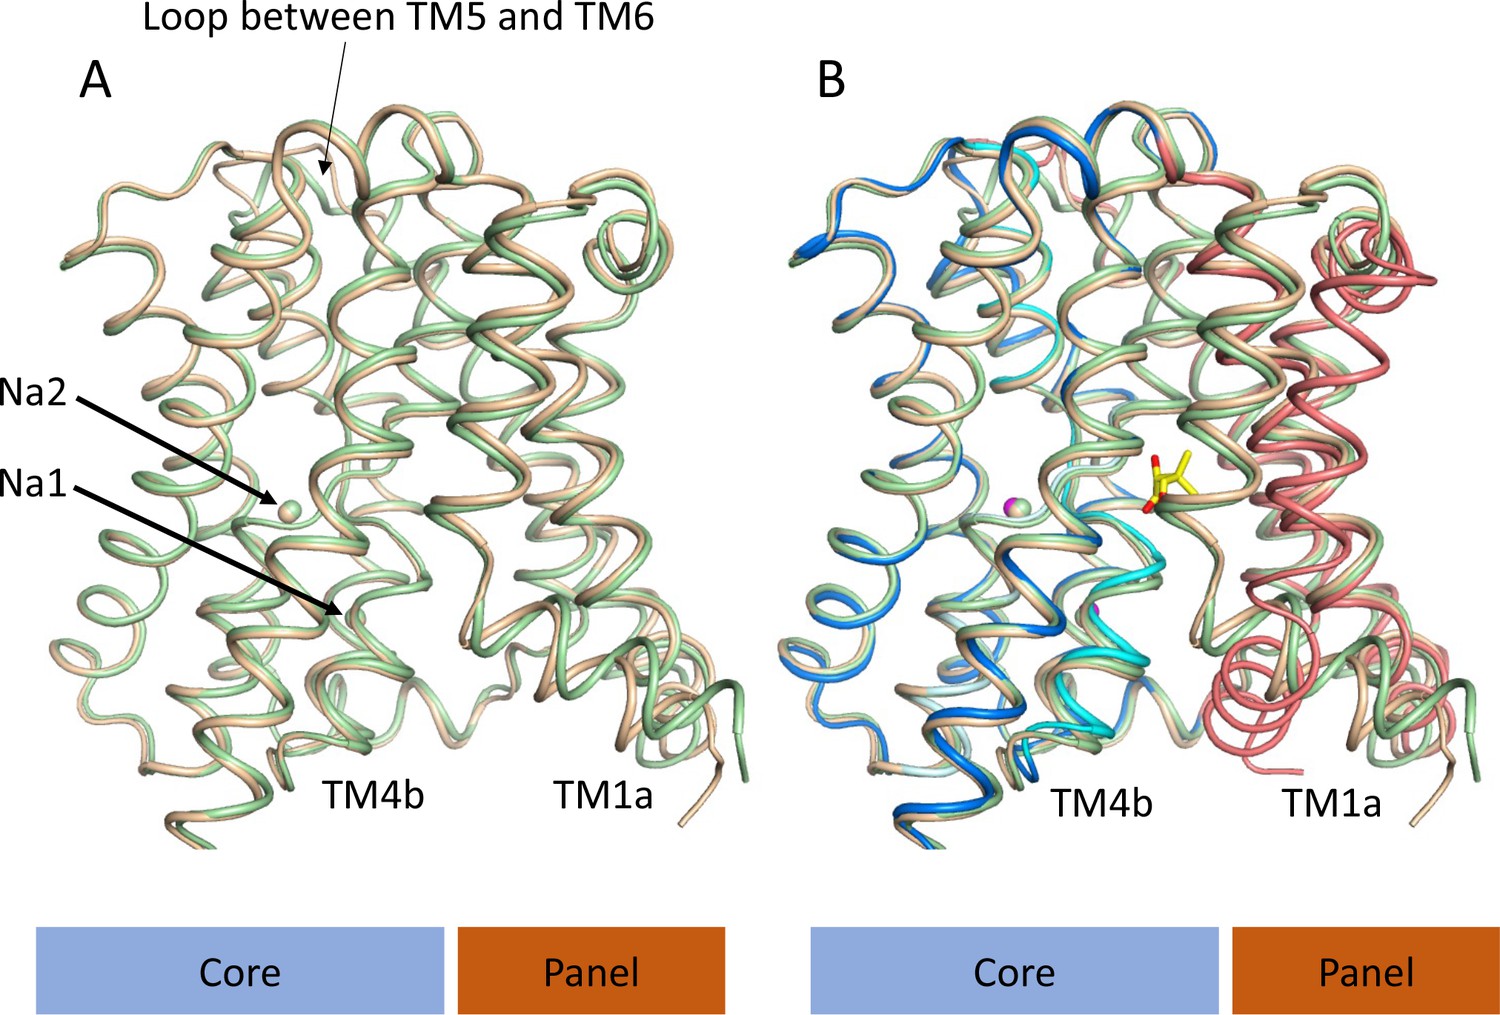
Structure of ASBTNM without pantoate or taurocholate.
(A) Superposition of ASBTNM(ns) (wheat) on ASBTNM(TCH) (pale green) highlighting the similarity of the two structures. The main differences are in the position of TM1, where TM1a adopts a slightly different angle with respect to TM1b, and in the loop between TMs 5 and 6, which links the core domain to the panel domain. (B) As A with the addition of the ASBTNM(Pan) structure (coloured as in Figure 1). The difference in the position of TM1 and TM4b, with respect to the two structures without pantoate is evident.
Figure 4—figure supplement 1
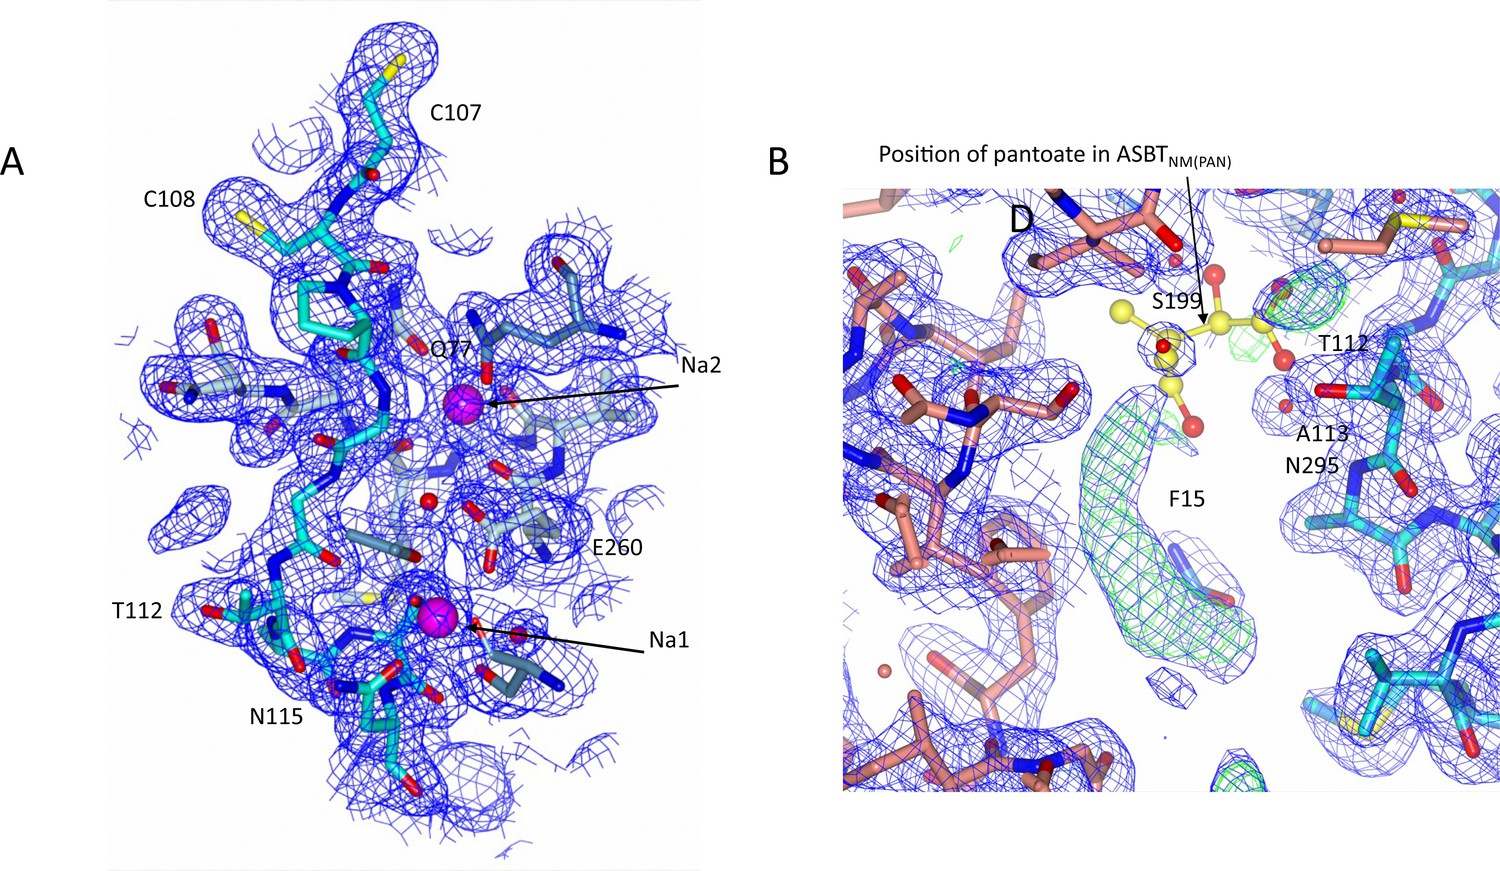
Electron density associated with ASBTNM(ns).
(A) Electron density in the vicinity of the sodium ions. The 2mFo-DFc density was calculated based on phases from the refined structure and was contoured at 1σ. (B) There is additional electron density in the open cleft of the ASBTNM(ns) structure, which has been modelled as the hydrophobic tail of monoolein. For reference the position of the pantoate from the ASBTNM(Pan) structure has been inserted with yellow carbon atoms. The 2mFo-DFc density (blue) is contoured at 1σ and the mFo-DFc density (green) at 3σ.
Figure 5 with 1 supplement
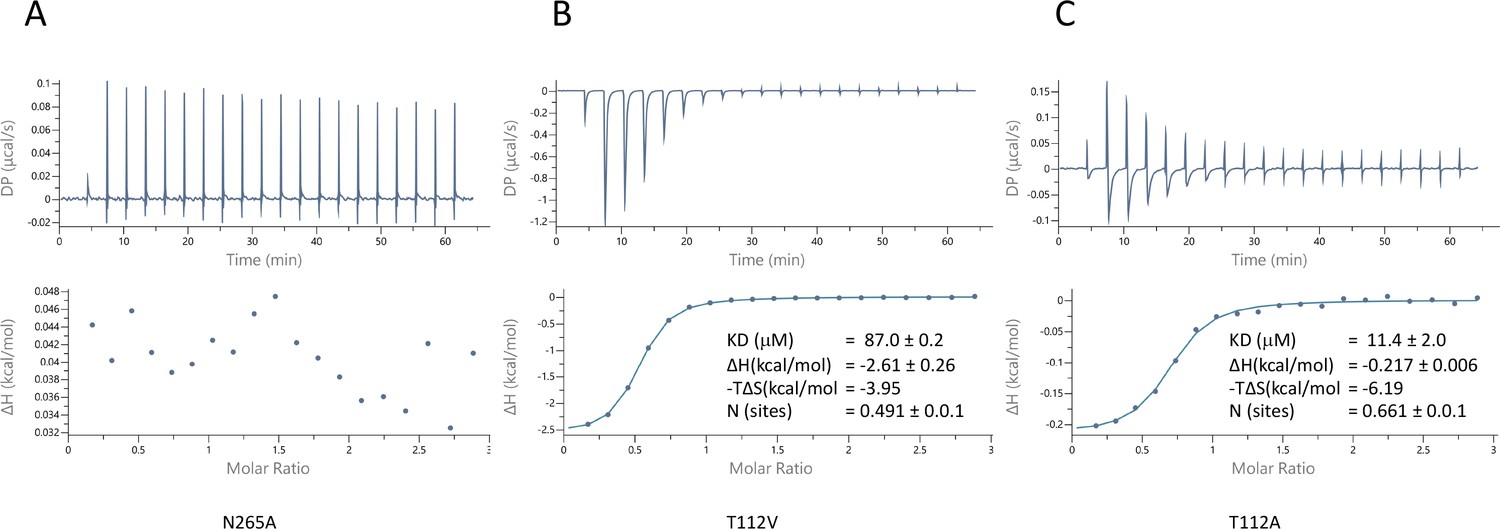
Characterisation of pantoate binding to mutants of ASBTNM.
Pantoate binding to ASBTNM mutants measured by isothermal calorimetry.
Figure 5—figure supplement 1
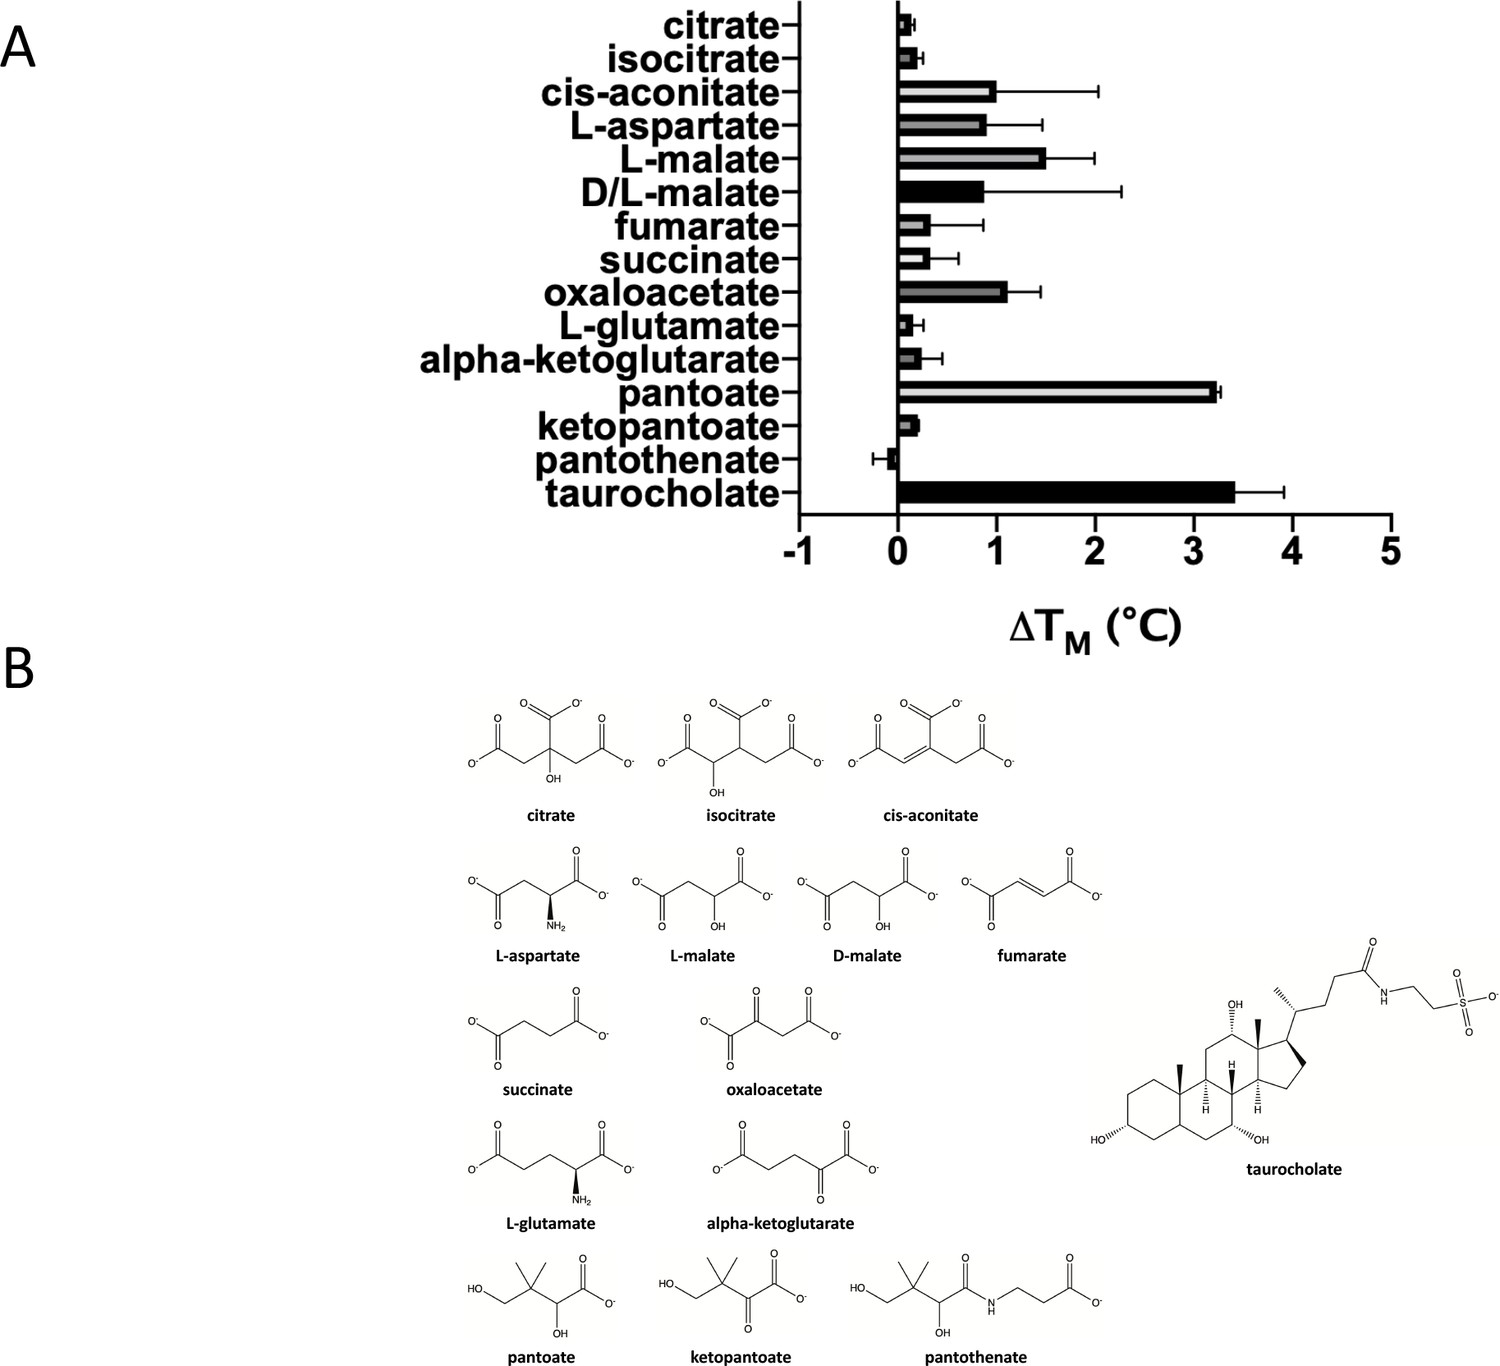
Testing a panel of compounds for potential binding to ASBTNM.
(A) Compounds were subjected to the stability assay. These compounds include citrate, which has been observed in two different crystal structures of ASBTYF (Wang et al., 2021; Zhou et al., 2014), other compounds from the citric acid cycle, all of which have a carboxylic acid group in common with pantoate and citrate, aspartate given that a gene encoding aspartate kinase is located next to the gene encoding ASBTYF in Y. frederiksinii, and glutamate. The mean and standard deviations are shown based on three individual experiments. (B) Chemical formula of the compounds tested.
Figure 6 with 2 supplements
Molecular dynamics simulations.
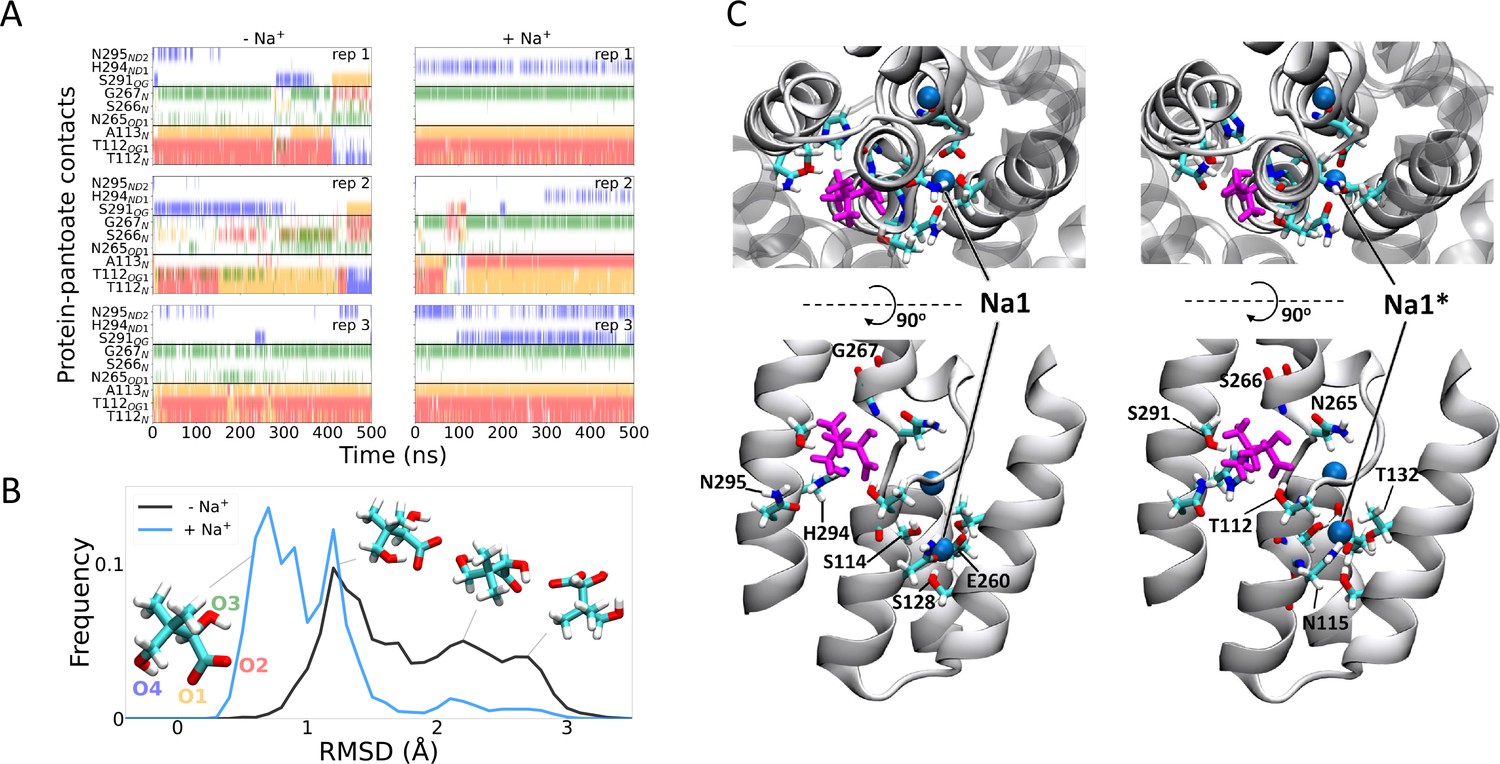
(A) Hydrogen bonds between the pantoate and protein followed over the course of the simulations starting without (left) or with (right) sodium bound. Red, yellow, green, and blue indicate a contact with the O1, O2, O3, and O4 atoms of pantoate, respectively (as shown in B). Contacts are shown for all residues with contacts in greater than 10% of any simulation. (B) Histograms of pantoate heavy-atom root mean square deviation (RMSD) over three simulations starting with (blue) or without (black) bound sodium, calculated following Cα alignment of the protein around the binding site (residues 108–117 [TM4], 199–207 [TM9], and 287–296 [TM10]). Representative snapshots of pantoate, relative to the starting position on the left are shown. (C) Representative snapshots showing bound pantoate (magenta) and sodium (blue spheres), showing the location of the canonical sodium binding site 1 and the alternate site 1*. ASBT is shown with cartoon representation; for clarity, only helices contributing to the binding sites (TMs 4, 5, 9, 10) are shown in the lower (side view) panels. Residues making up the pantoate and Na1 binding sites are shown in stick representation.
Figure 6—figure supplement 1
Root mean square deviation (RMSD) of protein and pantoate during simulations.
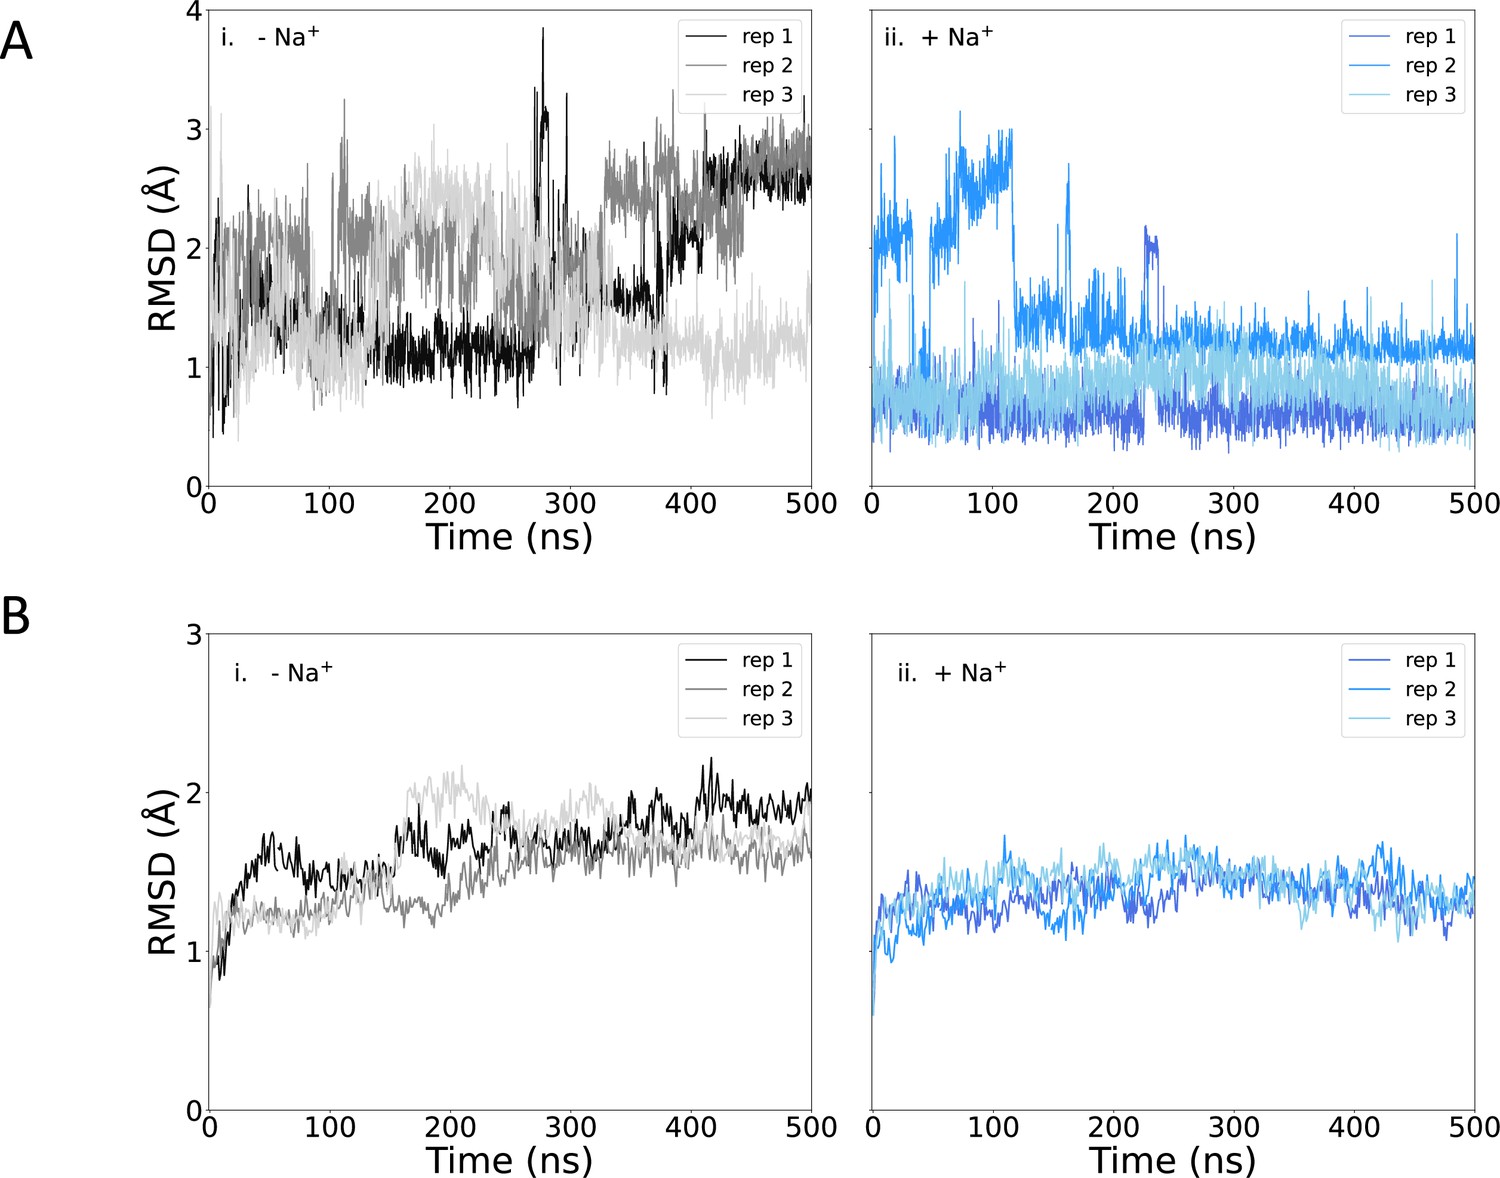
(A) Pantoate heavy-atom RMSD relative to the initial structure for each repeat simulation starting without (i) or with (ii) sodium bound. The RMSD was calculated following the alignment of protein structures, using the Cα atoms of residues surrounding the pantoate binding site (residues 108–117 [TM4], 199–207 [TM9], and 287–296 [TM10]). (B) Protein Cα RMSD over all simulations for simulations starting without (i) or with (ii) sodium bound, relative to the initial structure.
Figure 6—figure supplement 2
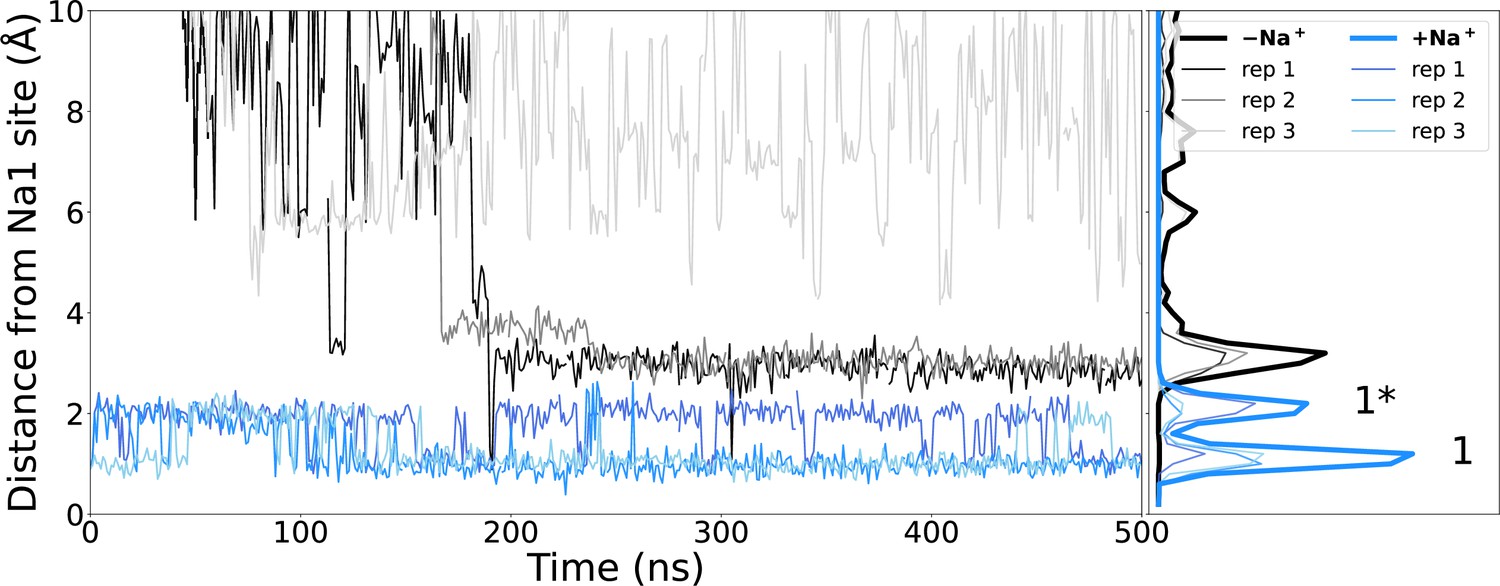
Sodium binding during simulations.
Distance of closest sodium ion to the Na1 binding site (measured as the centre of mass of Cα atoms of residues making the Na1 binding site – S114, N115, S128, T132, and E260) throughout simulations starting with (blue) or without (black) sodium bound. The locations of ions while in the canonical Na1 site (1) or the alternate Na1* (1*) site are indicated.
Figure 7 with 2 supplements
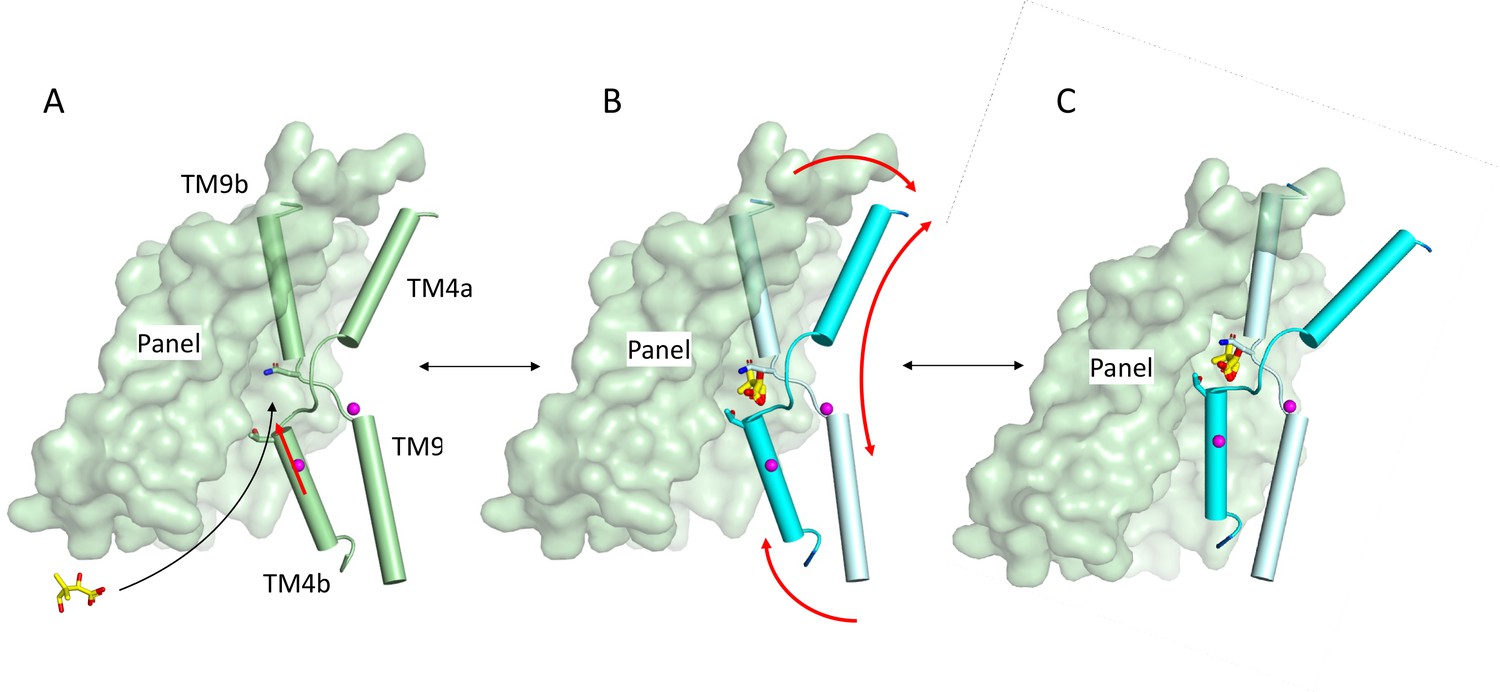
Schematic of mechanism.
Pantoate binding to the cross-over region between TM4b and TM9b of the substrate-free structure (A) elicits a conformational change in TM4b (red arrow) (B). The change in conformation of the core region of the protein may allow greater freedom of movement of the panel domain relative to the core enabling it to swing upwards in an elevator movement (C) (red arrows in B). The position of the core relative to the panel domain in C was based on the relative positions of the two domains in the outward-facing structure of ASBTYF.
Figure 7—figure supplement 1
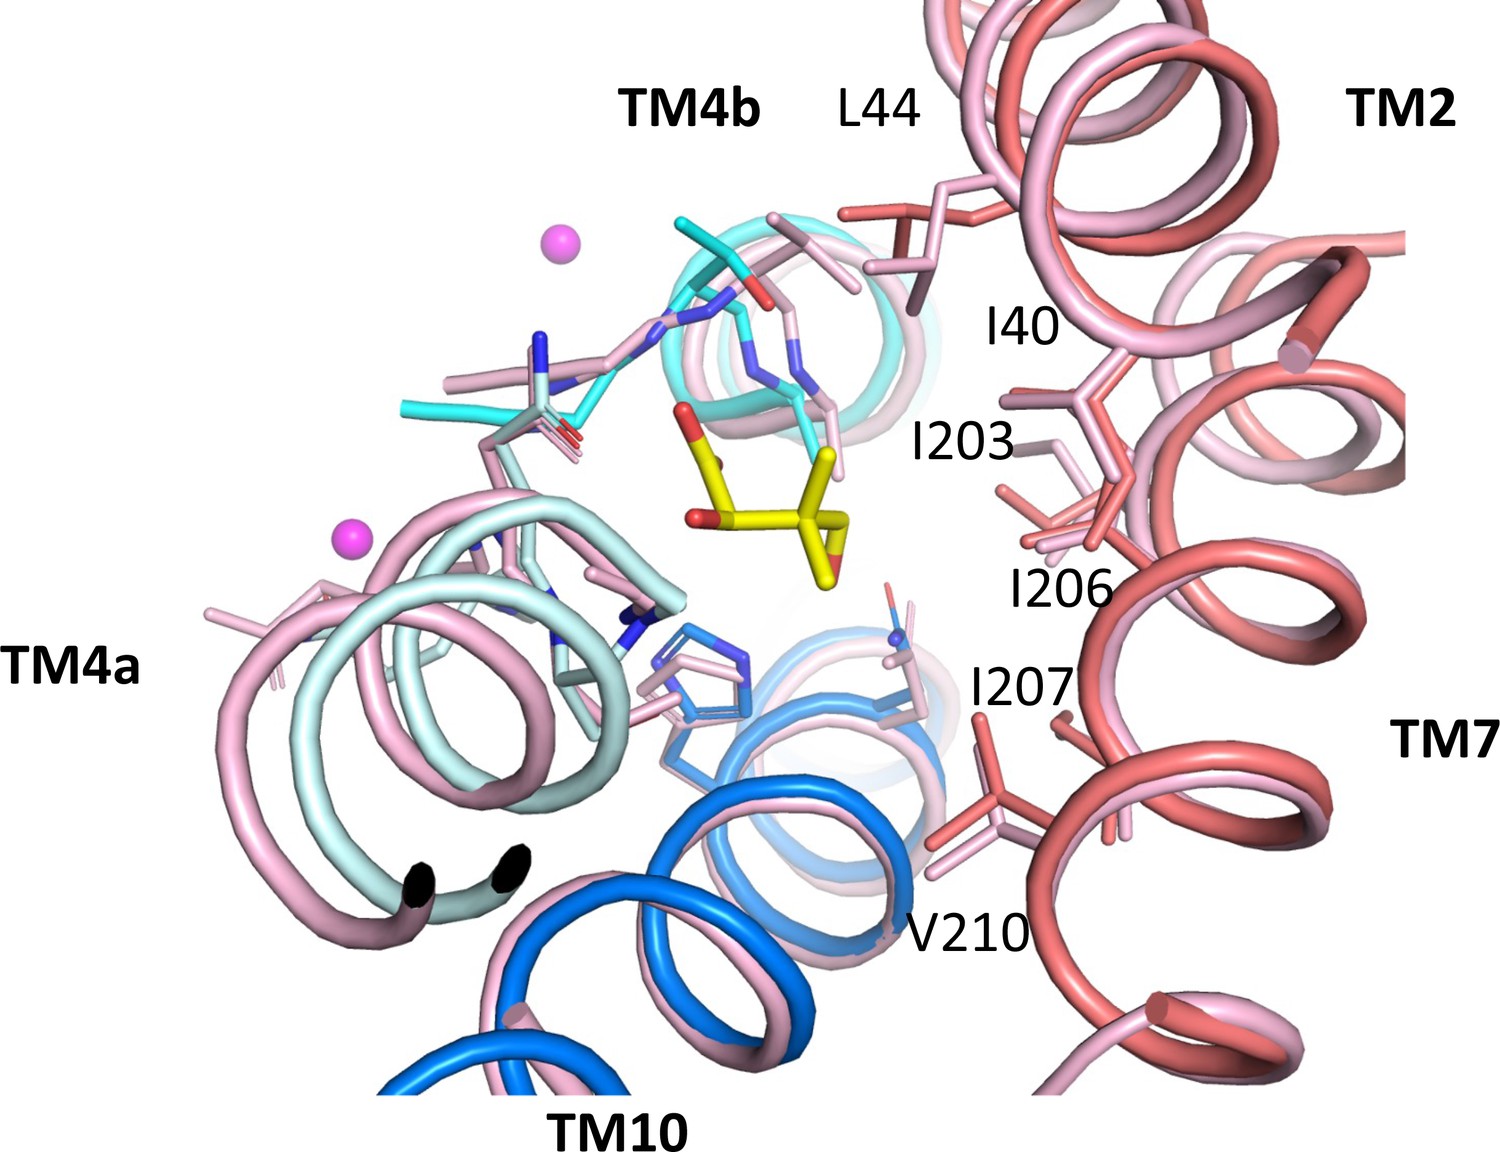
Pantoate binding to an outward-facing state model.
Pantoate binding region of ASBTNM(Pan) and panel domain of ASBTNM(TCH) superposed separately on the core and panel regions of the outward-facing structure of ASBTYF (4N7X; pink). Pantoate would easily be accommodated in the outward-facing structure. Numbering is shown for ASBTNM.
Figure 7—video 1
Morph between ASBTNM(Pan) and ASBTNM(ns) focussed on TM4b.
The colouring is shown as in Figure 1. The sodium ions and pantoate from the ASBTNM(Pan) structure are held rigid during the morph of the protein atoms.
Author response image 1

The 2mFo-DFc density is at 1σ, the mFo-DFc density is at 2.
5σ.
Tables
Table 1
Data processing and refinement statistics.
| ASBTNM(Pan) | ASBTNM(ns) | |
|---|---|---|
| Wavelength (Å) | 0.9999 | 0.9999 |
| Resolution range | 43.78–2.3 (2.382–2.3) | 58.96–2.1 (2.175–2.1)* |
| Space group | C2 | P 21 21 21 |
| Unit cell: a, b, c (Å),α, β, γ (°) | 85.0 89.4 53.1 90 124.4 90 | 49.5 80.6 86.5 90 90 90 |
| Total reflections | 55,444 (3034) | 146,457 (14,741) |
| Unique reflections | 14,273 (1201) | 20,744 (2032) |
| Multiplicity | 3.9 (2.5) | 7.1 (7.3) |
| Completeness (%) | 97.7 (82.8) | 99.4 (99.3) |
| Mean I/sigma(I) | 5.7 (1.7) | 6.7 (2.0) |
| Wilson B-factor | 36 | 30 |
| R-merge | 0.1181 (0.4632) | 0.1356 (0.8541) |
| R-meas | 0.1368 (0.5779) | 0.1467 (0.9198) |
| R-pim | 0.06752 (0.3397) | 0.05402 (0.3316) |
| CC1/2 | 0.988 (0.804) | 0.957 (0.658) |
| CC* | 0.997 (0.944) | 0.989 (0.891) |
| Reflections used in refinement | 14,259 (1201) | 20,691 (2027) |
| Reflections used for R-free | 774 (55) | 1089 (96) |
| R-work | 0.2284 (0.3488) | 0.2115 (0.2933) |
| R-free | 0.2648 (0.4564) | 0.2387 (0.2885) |
| CC(work) | 0.937 (0.861) | 0.929 (0.846) |
| CC(free) | 0.927 (0.678) | 0.835 (0.907) |
| Number of non-hydrogen atoms | 2324 | 2412 |
| Macromolecules | 2276 | 2282 |
| Ligands | 34 | 135 |
| Solvent | 25 | 34 |
| Protein residues | 310 | 310 |
| RMS (bonds) | 0.002 | 0.002 |
| RMS (angles) | 0.44 | 0.53 |
| Ramachandran favoured (%) | 98.05 | 99.03 |
| Ramachandran allowed (%) | 1.95 | 0.97 |
| Ramachandran outliers (%) | 0 | 0 |
| Rotamer outliers (%) | 0.85 | 0.84 |
| Clashscore | 2.52 | 3.25 |
| Average B-factor | 52.2 | 41.5 |
| Macromolecules | 52.3 | 40.3 |
| Ligands | 46.0 | 69.4 |
| Solvent | 47.6 | 42.8 |
| Number of TLS groups | 1 | 1 |
-
*
Statistics for the highest resolution shell are shown in parentheses.
Key resources table
| Reagent type (species) or resource | Designation | Source or reference | Identifiers | Additional information |
|---|---|---|---|---|
| Gene (Nesseria meningitidis) | ASBTNM | https://doi.org/10.1038/nature10450 | ASBTNM | |
| Recombinant DNA reagent | PWaldo GFPd-3C (plasmid) | Hatton et al., 2022 | Modified from original PWaldo GFPd vector https://doi.org/10.1110/ps.051466205 | |
| Strain, strain background (Escherichia coli) | Lemo21(DE3) | New England Biolabs | ||
| Chemical compound | Pantoate | Merck Life Science UK | (R)-Pantoic acid sodium salt |
Additional files
Download links
A two-part list of links to download the article, or parts of the article, in various formats.
Downloads (link to download the article as PDF)
Open citations (links to open the citations from this article in various online reference manager services)
Cite this article (links to download the citations from this article in formats compatible with various reference manager tools)
Mechanism of substrate binding and transport in BASS transporters
eLife 12:RP89167.
https://doi.org/10.7554/eLife.89167.3


