The genetic and dietary landscape of the muscle insulin signalling network
- Charles Perkins Centre, School of Life and Environmental Sciences, University of Sydney, Australia
- Faculty of Medicine and Health, University of Sydney, Australia
Figures
Figure 1 with 3 supplements

Phosphoproteomics of insulin signalling in mouse skeletal muscle.
(a) Workflow for skeletal muscle phosphoproteomics of insulin signalling. (b) Quantification of skeletal muscle phosphoproteomics. (c) Volcano plot identifying insulin-regulated phosphopeptides. The greatest log2(insulin/unstimulated) fold change across strain-diet combinations is plotted against significance (insulin stimulation main effect, three-way ANOVA). Three phosphopeptides with -log10 q-values greater than 35 were removed for visual clarity. (d–g) Example insulin-regulated phosphopeptides. The protein and phosphorylated amino acid are indicated, as well as the number of phosphosites on the phosphopeptide (e.g. ‘P1’). n=4–6 biological replicates.
Figure 1—figure supplement 1
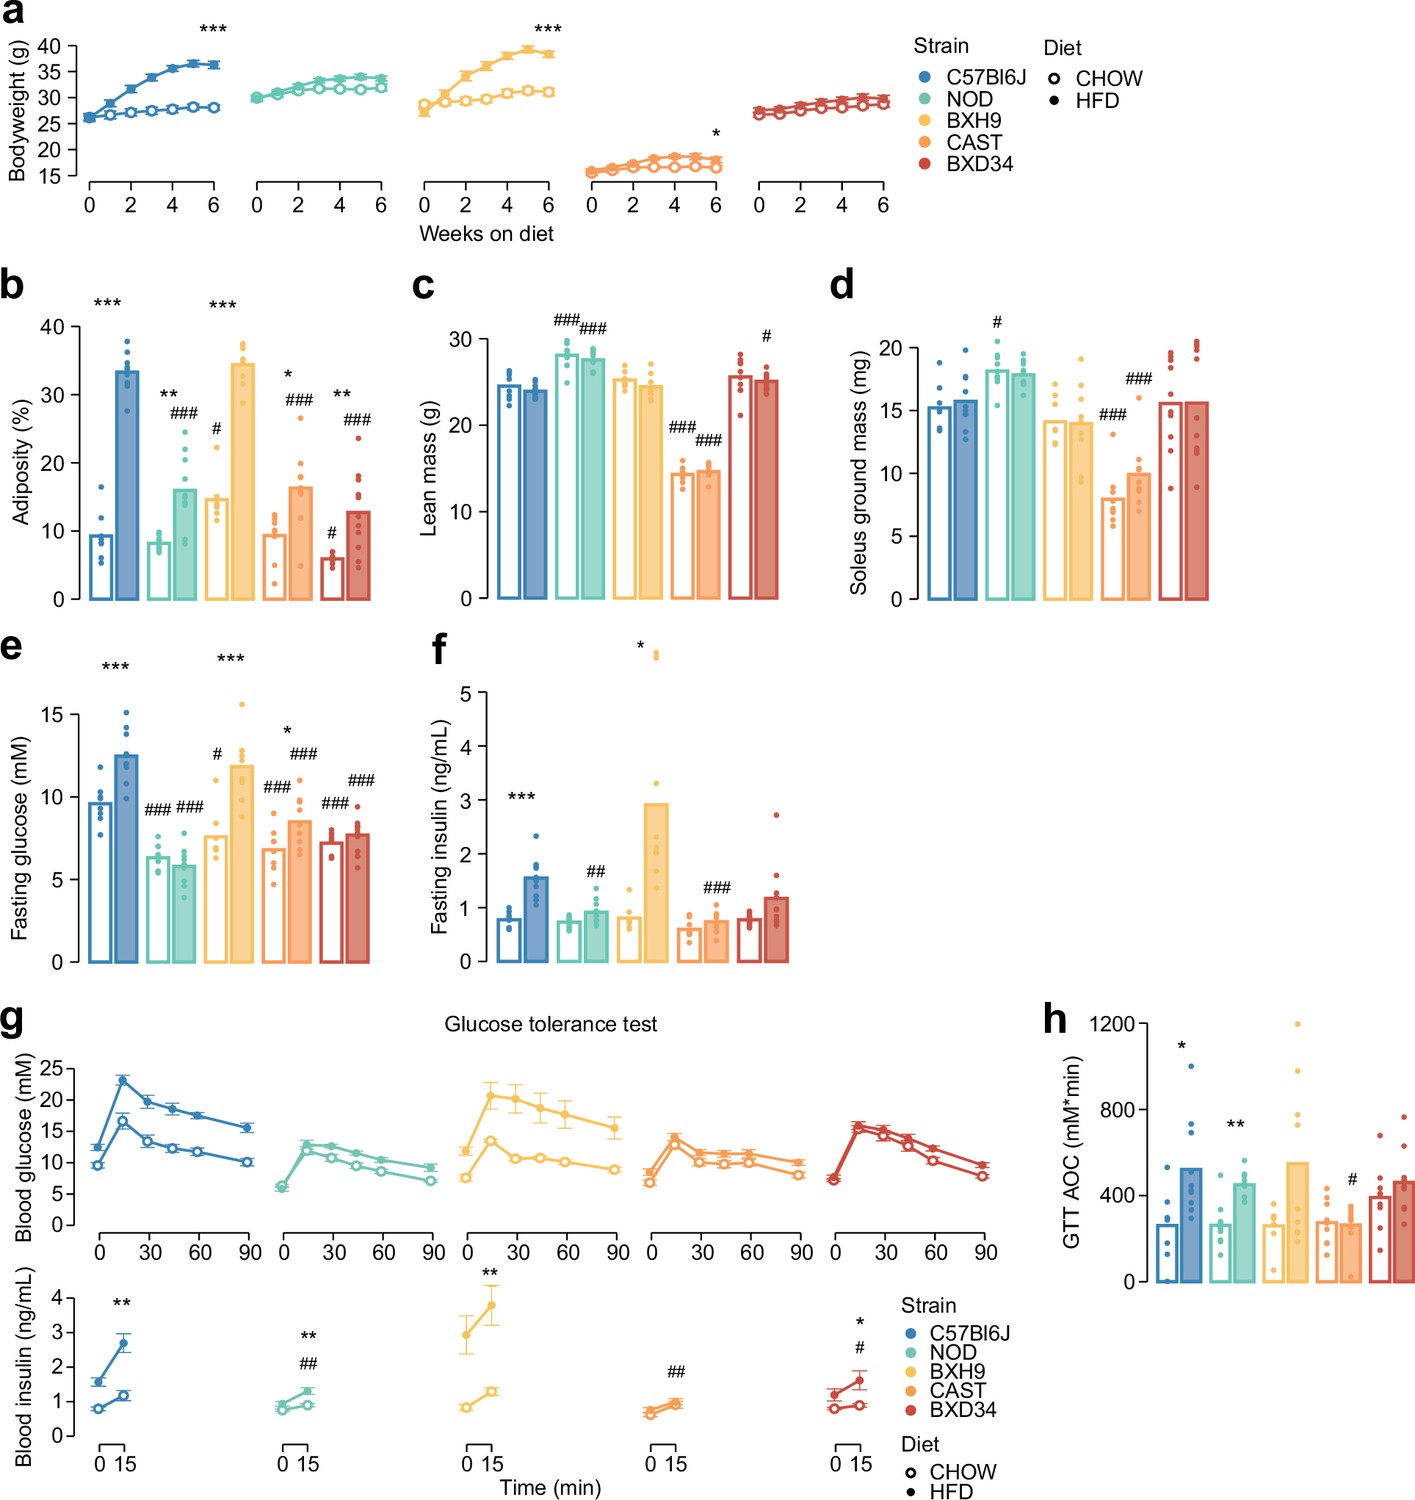
Genetics and diet alter morphometric and metabolic phenotypes.
(a) Mouse body weight was measured during a 6-week diet regimen. Two-sided t-tests were performed to compare HFD to CHOW within each strain after 6 weeks, following Benjamini-Hochberg p-value adjustment (*). (b–d) Measurement of (b) adiposity, (c) lean mass, (d) ground soleus mass, (e) fasting blood glucose, and (f) fasting blood insulin at the end of the diet regimen. (g) At the end of the diet regimen a glucose tolerance test was performed. (h) The area of the blood glucose curve (GTT AOC) was calculated. In (b–h), two-sided t-tests were performed to compare HFD to CHOW within each strain (*) or to compare each strain to C57Bl6J within either diet (#). p-Values were adjusted by the Benjamini-Hochberg procedure. Error bars indicate SEM. In (g) t-tests were only performed on 15 min blood insulin levels. No comparisons across strains on CHOW were significant. n=8–11 biological replicates. */#: 0.01≤p<0.05, **/##: 0.001≤p<0.01, ***/###: p<0.001.
Figure 1—figure supplement 2
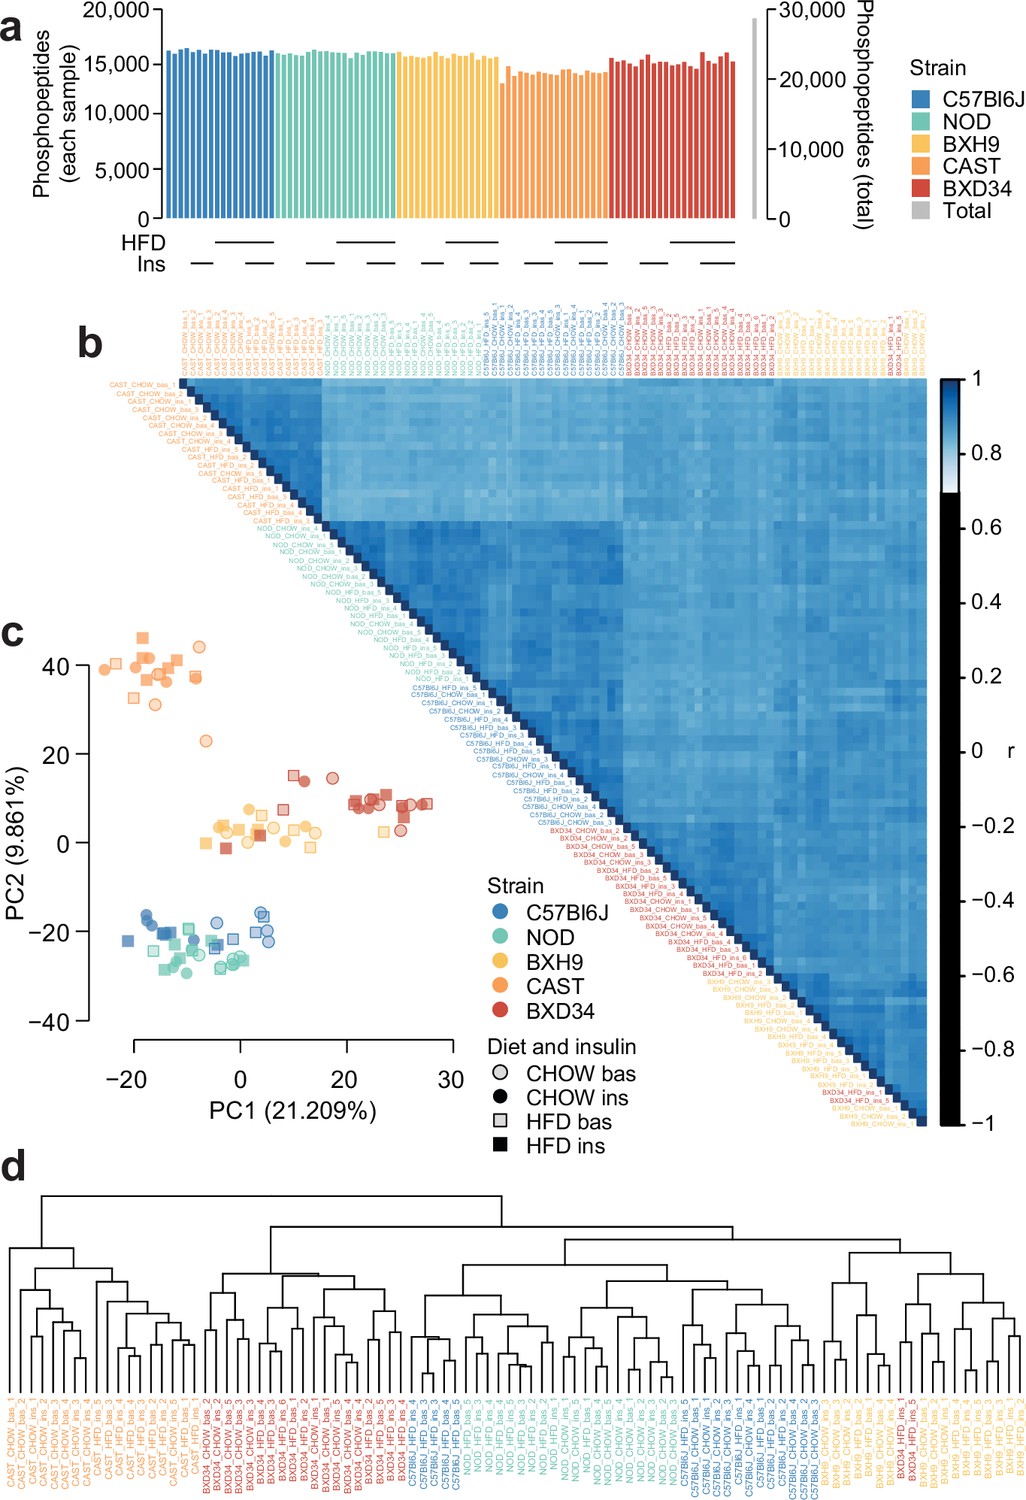
Quality control analysis of phosphoproteomics data.
(a) The number of unique class I phosphopeptides quantified in each sample and in total. (b) Pearson’s correlation was performed between each pair of samples. Samples are ordered by hierarchical clustering. (c) Principal component analysis was performed on the phosphoproteome. The first two principal components (PC1 and PC2) are plotted for each sample and the percentage of overall variance explained by each principal component is indicated. ‘bas’: unstimulated, ‘ins’: insulin-stimulated. (d) Hierarchical clustering was performed on all samples.
Figure 1—figure supplement 3
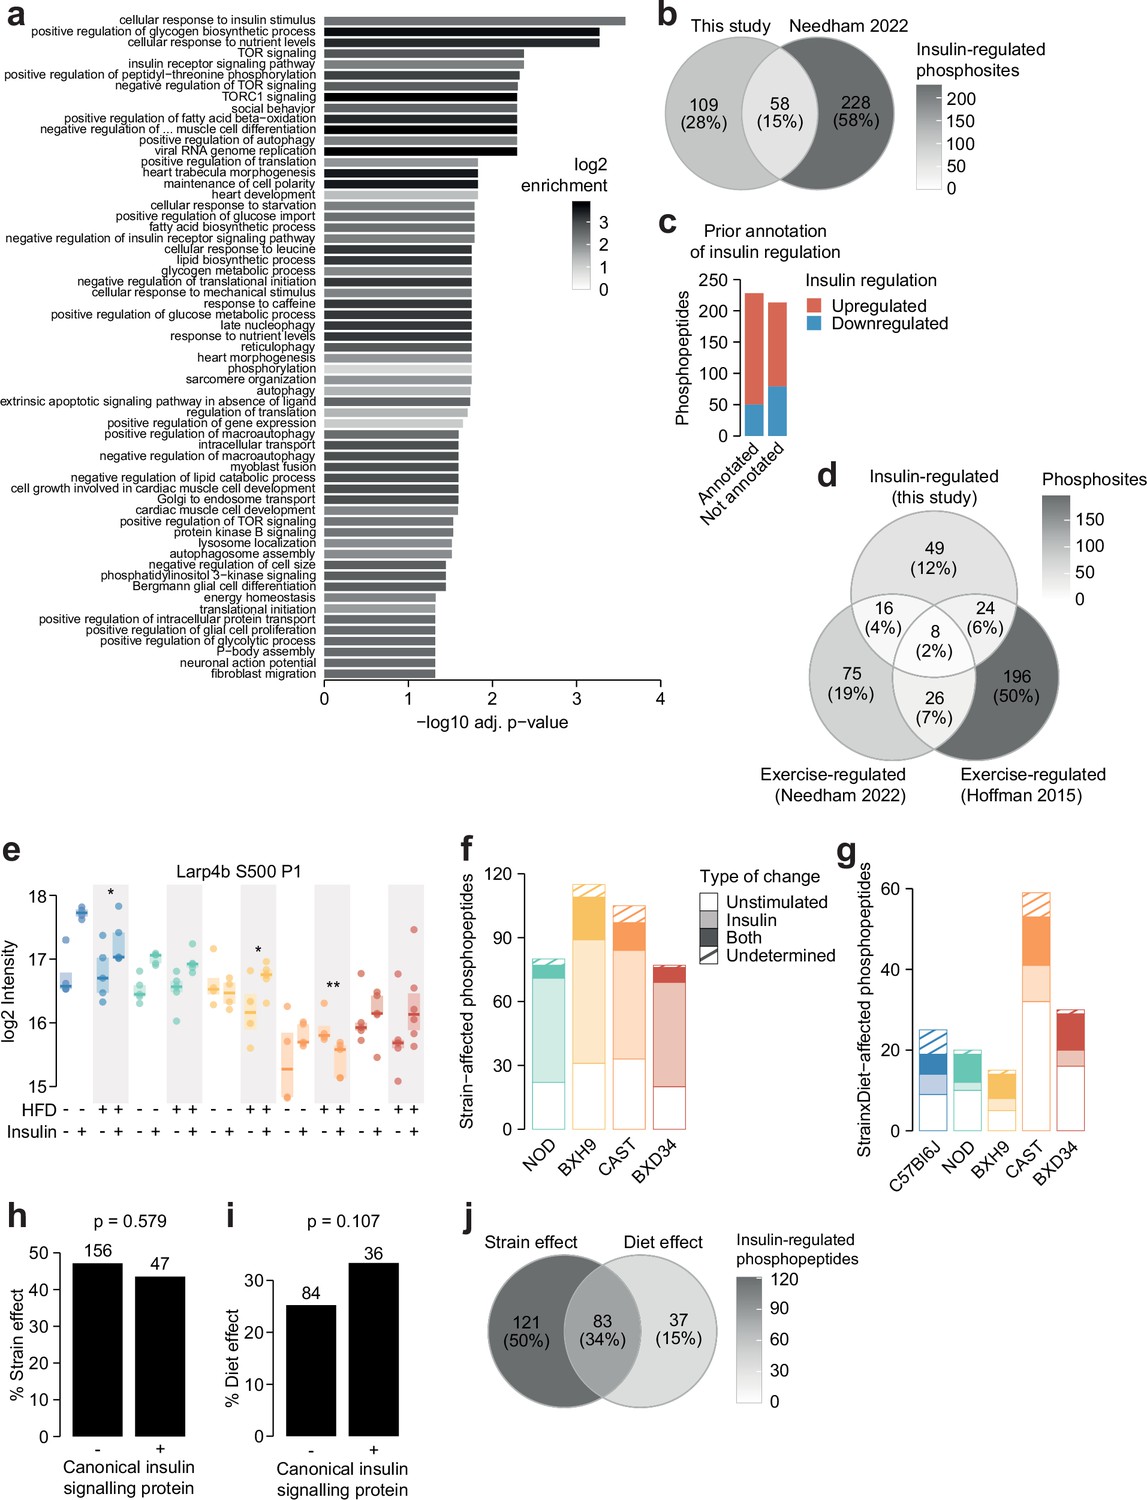
Characterisation of the insulin-regulated phosphoproteome.
(a) The enrichment of Gene Ontology (GO) biological processes in genes containing insulin-regulated phosphopeptides relative to the entire phosphoproteome (one-sided Fisher’s exact test, Benjamini-Hochberg p-value adjustment). Only significant pathways are shown (adj. p<0.05). The pathway ‘negative regulation of vascular-associated smooth muscle cell differentiation’ is abbreviated. (b) The number of phosphosites regulated by insulin in this study or a previous phosphoproteomic study of human skeletal muscle (Needham et al., 2022). Only phosphosites quantified in both studies were considered. (c) The number of insulin-regulated phosphopeptides with prior annotation of insulin regulation in the PhosphositePlus database (Hornbeck et al., 2015). (d) The number of phosphosites regulated by insulin in this study or regulated by exercise in two human phosphoproteomics studies (Needham et al., 2022; Hoffman et al., 2015). Only phosphosites quantified in all three studies were considered. (e) A phosphopeptide where HFD-feeding enhanced insulin responses in BXH9 but suppressed insulin responses in C57Bl6J and CAST. A two-way ANOVA was performed on insulin response values followed by two-sided t-tests comparing HFD to CHOW within each strain (q-values: *). (f) Phosphopeptides with a Strain effect were examined to determine whether the effect was due to altered unstimulated phosphorylation (‘Unstimulated’; Strain/C57Bl6J fold change >1.3 in unstimulated samples), altered insulin-stimulated phosphorylation (‘Insulin’; Strain/C57Bl6J fold change >1.3 in insulin-stimulated samples), or both (‘Both’). A proportion of phosphopeptides passed neither of these filters (‘Undetermined’). (g) The same analysis was performed on Strain×Diet-affected phosphopeptides, using the HFD/CHOW fold changes in either unstimulated or insulin-stimulated samples for each strain. (h–i) The percentage of (h) Strain effects and (i) Diet effects (Uniform diet or Strain×Diet effect) among canonical or non-canonical insulin signalling proteins. p-Values indicate two-sided Fisher’s exact tests. The number of phosphopeptides in each group is shown. (j) The overlap of Strain and Diet effects.
Figure 2
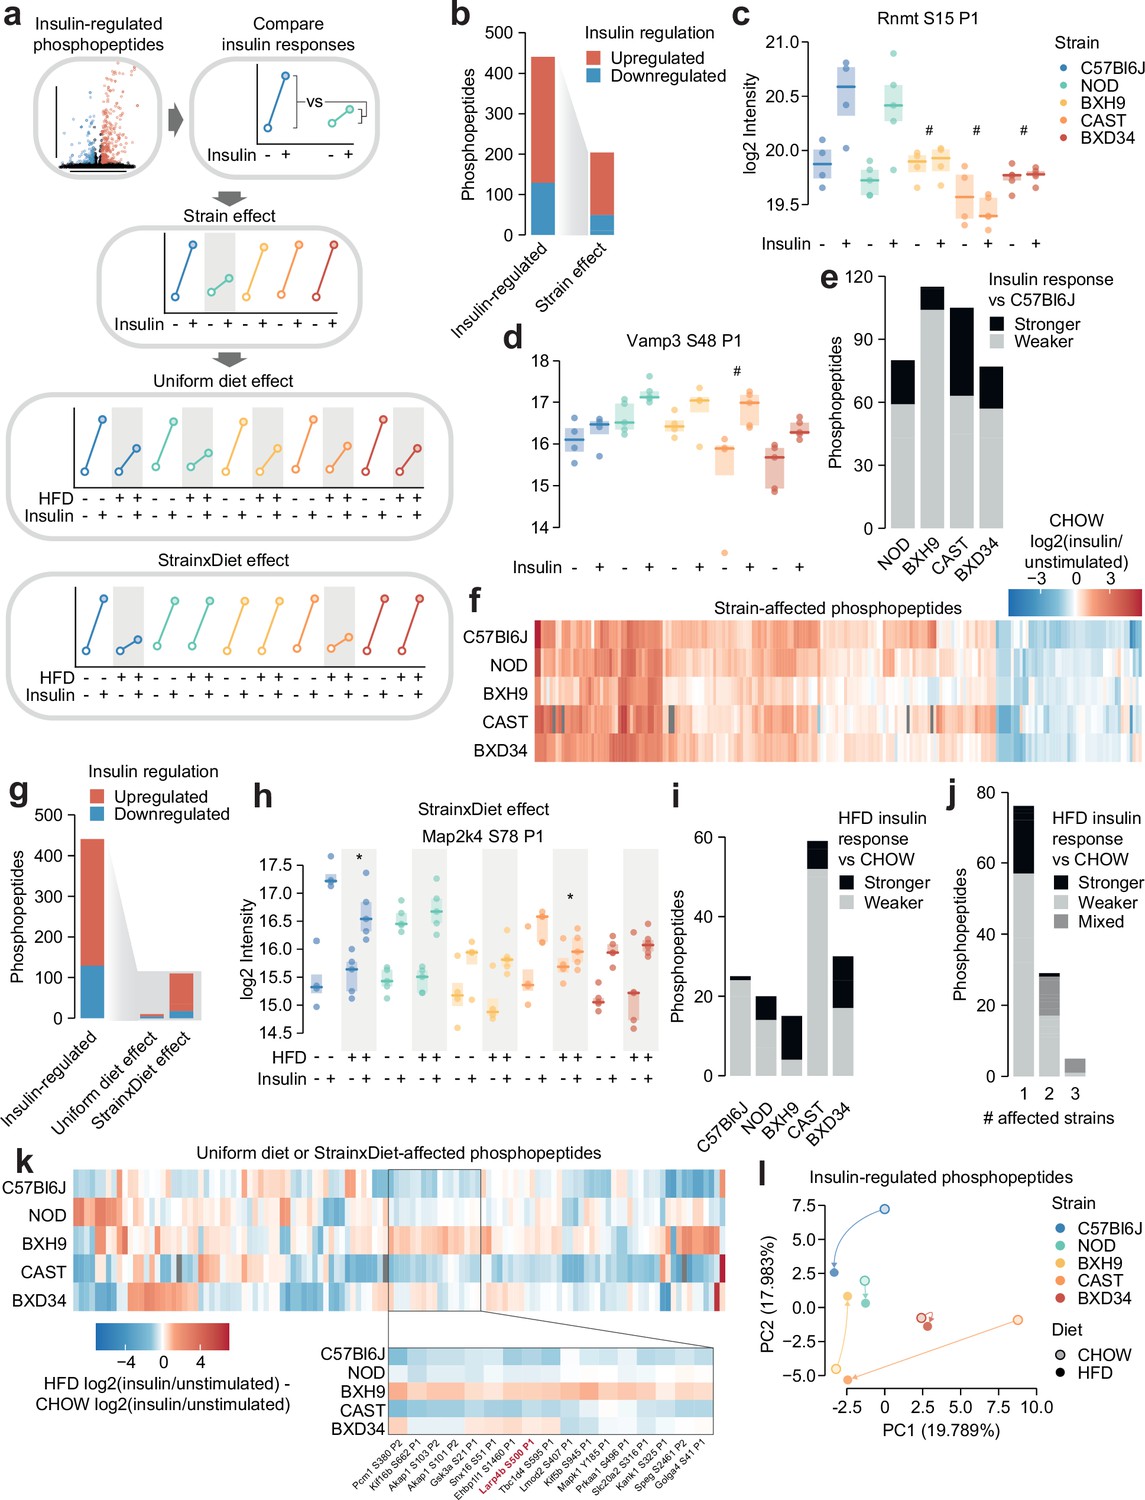
Genetics and diet modulate insulin signalling.
(a) Schematic for identifying effects of strain and diet on insulin signalling. (b) The number of total insulin-regulated phosphopeptides and those with a Strain effect. (c–d) Two phosphopeptides with Strain effects. ANOVAs were performed on CHOW insulin responses following two-sided t-tests comparing each strain to C57Bl6J (q-values: #). Only CHOW values are shown. (e) The number of phosphopeptides with stronger or weaker insulin regulation in each strain compared to C57Bl6J. (f) Heatmap displaying all insulin-regulated phosphopeptides with a Strain effect. Missing values are coloured grey. (g) The number of total insulin-regulated phosphopeptides and those with diet effects. (h) A phosphopeptide with a Strain×Diet effect. A two-way ANOVA was performed on insulin response values followed by two-sided t-tests comparing HFD to CHOW within each strain (q-values: *). (i–j) The number of phosphopeptides with a Strain×Diet effect in (i) each strain, or (j) each number of strains. Colour indicates whether the insulin response in HFD is stronger vs CHOW, weaker vs CHOW, or both in different strains (‘Mixed’). (k) Heatmap displaying all insulin-regulated phosphopeptides with a Uniform diet effect or Strain×Diet effect. Inset displays example sites where BXH9 effects contrasted other strains. (l) Principal component analysis (PCA) of all insulin-regulated phosphopeptides using the log2(insulin/unstimulated) fold changes for each strain-diet combination. The percentage of total variance explained by each principal component is indicated. */#: 0.01≤q<0.05, **/##: 0.001≤q<0.01, ***/###: q<0.001. n=4–6 biological replicates.
Figure 3
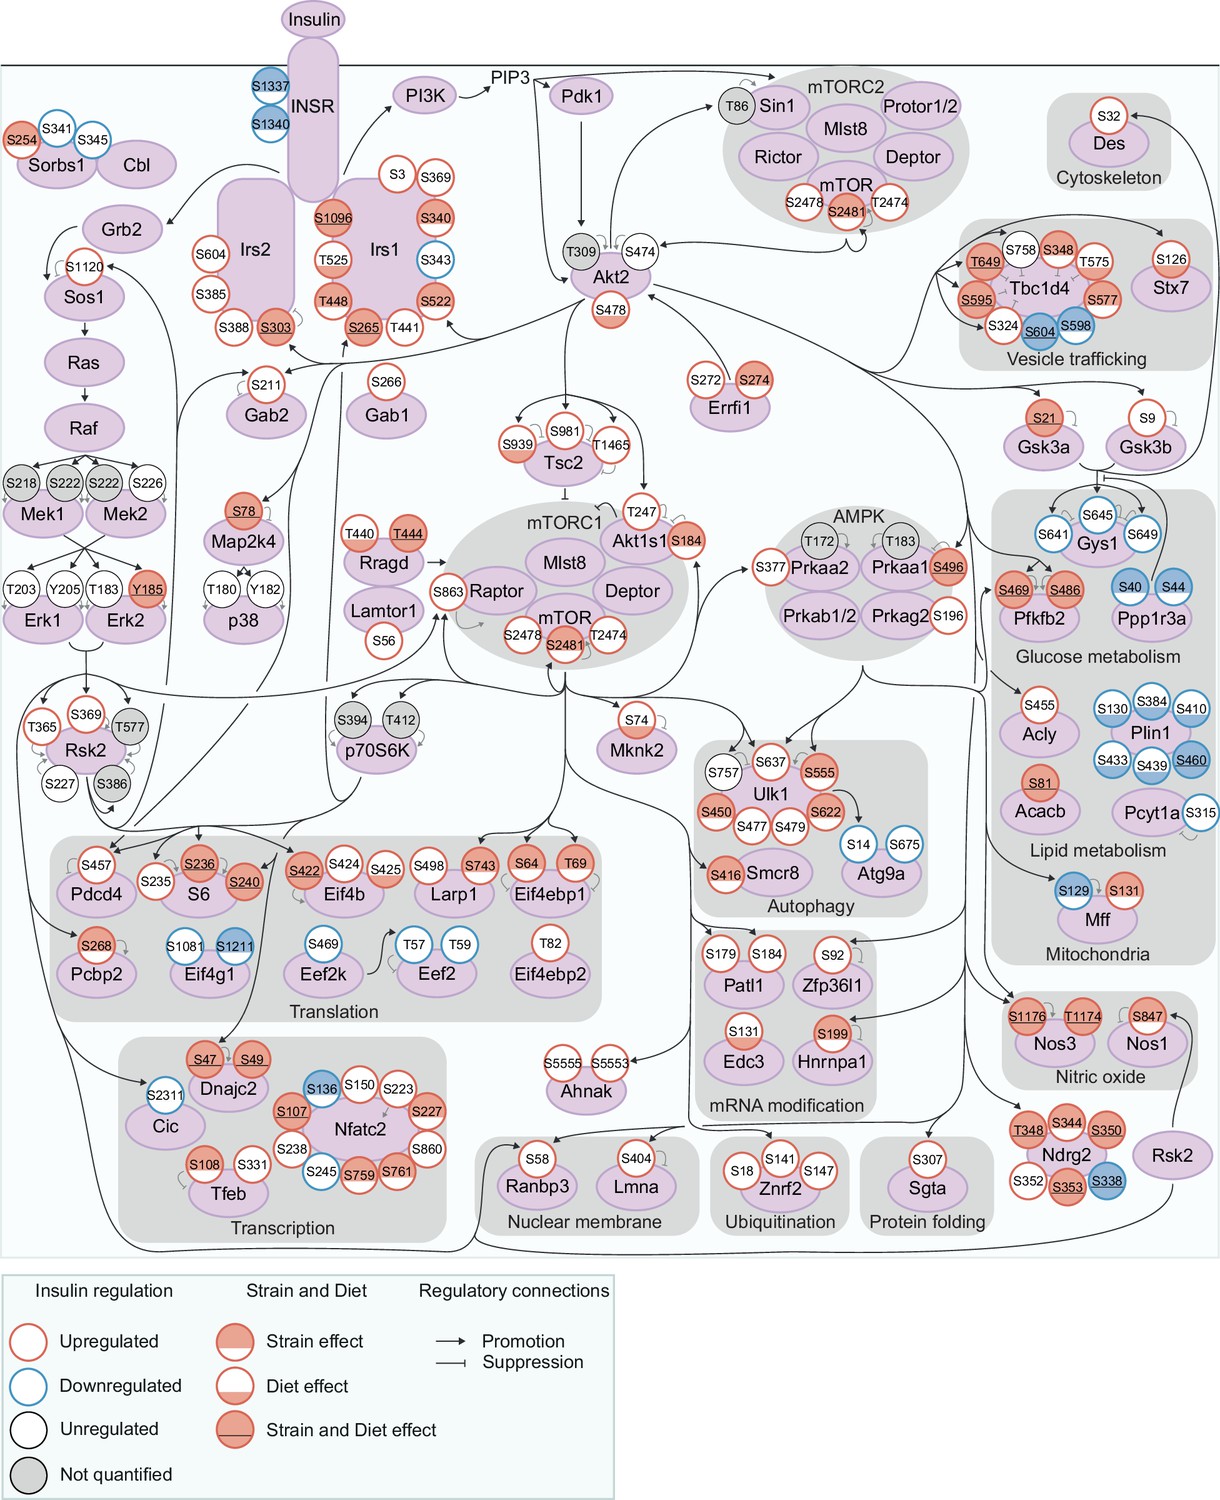
Exploring genetic and dietary modulation of the insulin signalling network.
A curated network of 160 insulin-regulated phosphosites. Phosphosites are depicted as circles where the outline colour denotes the direction of insulin regulation, and the inner colour denotes the presence of Strain effects or Diet effects (either a Strain×Diet or Uniform diet effect). Black arrows indicate regulatory relationships from proteins to other proteins or phosphosites. Grey lines indicate phosphosite regulatory roles.
Figure 4

Genetics and diet rewire insulin-regulated kinase signalling.
(a) Kinase substrate enrichment analysis (KSEA) (Hernandez-Armenta et al., 2017) of five canonical insulin-regulated kinases using insulin response values and kinase substrate annotations from PhosphositePlus (Hornbeck et al., 2015). (b–c) Kinase enrichment scores were tested for (b) Strain effects (CHOW ANOVA adjusted p<0.05) or (c) Strain×Diet effects (two-way ANOVA interaction effect adjusted p<0.05) and Uniform diet effects (Diet main effect adjusted p<0.05, interaction effect adjusted p≥0.05). n=4–6 biological replicates.
Figure 5 with 2 supplements

Biological variation reveals functional organisation of the insulin signalling network.
(a) Pairwise Pearson’s correlation of the insulin response values of insulin-regulated Akt substrates. Substrates were separated into four clusters by hierarchical clustering followed by tree cutting. (b) The correlation between insulin response values of the Akt substrates Tsc2 S939 and Akt1s1 T247. Linear regression is indicated with 95% confidence intervals. (c) Rationale for performing weighted gene correlation network analysis (WGCNA). (d) Pairwise Pearson’s correlation of all insulin-regulated phosphopeptides separated into WGCNA-derived subnetworks. The number of phosphopeptides in each subnetwork is indicated below the heatmap. (e) The ‘eigenpeptide’ of each subnetwork. The median of each strain-diet combination is shown. (f–h) The enrichment of (f) PhosphositePlus-derived kinase substrate annotations (Hornbeck et al., 2015), (g) Gene Ontology (GO) cellular compartments, and (h) GO biological processes within each subnetwork relative to the entire phosphoproteome (one-sided Fisher’s exact test, Benjamini-Hochberg p-value adjustment). (i) The time taken for phosphopeptides to reach maximum insulin-stimulated intensity in a previous study of insulin signalling dynamics (Humphrey et al., 2013). The number of phosphopeptides mapped into the study is indicated above each bar.
Figure 5—figure supplement 1
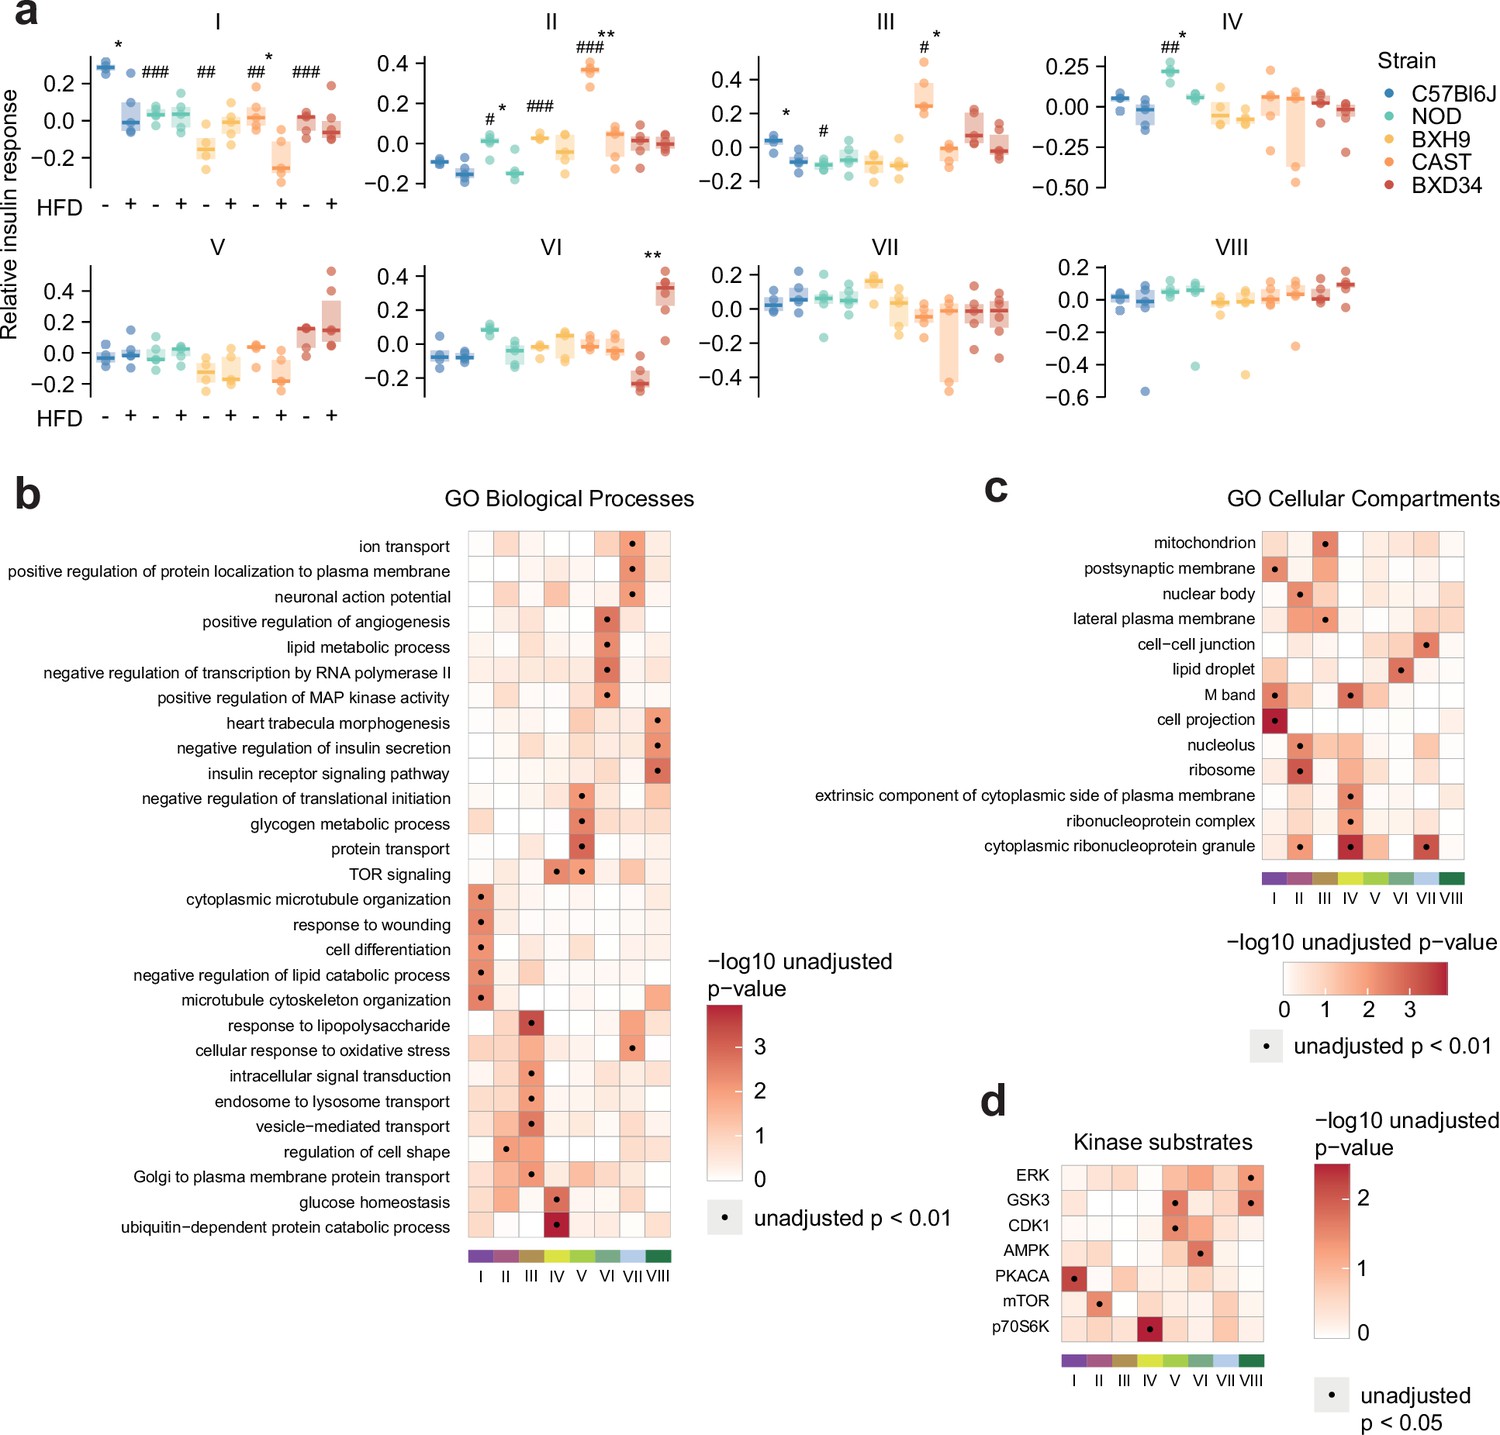
Characterising insulin signalling subnetworks.
(a) The eigenpeptides of each weighted gene correlation network analysis (WGCNA)-derived subnetwork. ANOVAs were performed on CHOW values following two-sided t-tests comparing each strain to C57Bl6J (Benjamini-Hochberg adjusted p-values: #), and two-way ANOVAs were performed on all values followed by two-sided t-tests comparing HFD to CHOW within each strain (adjusted p-values: *). (b–d) Rank-based enrichment of Gene Ontology (GO) biological pathways, GO cellular compartments, and PhosphositePlus kinase substrates using phosphopeptide module membership scores with the ‘geneSetTest’ function from the R package ‘limma’. Membership score is defined as the absolute Pearson’s correlation coefficient between a phosphopeptide’s insulin response and the subnetwork’s eigenpeptide. */#: 0.01≤p<0.05, **/##: 0.001≤p<0.01, ***/###: p<0.001.
Figure 5—figure supplement 2
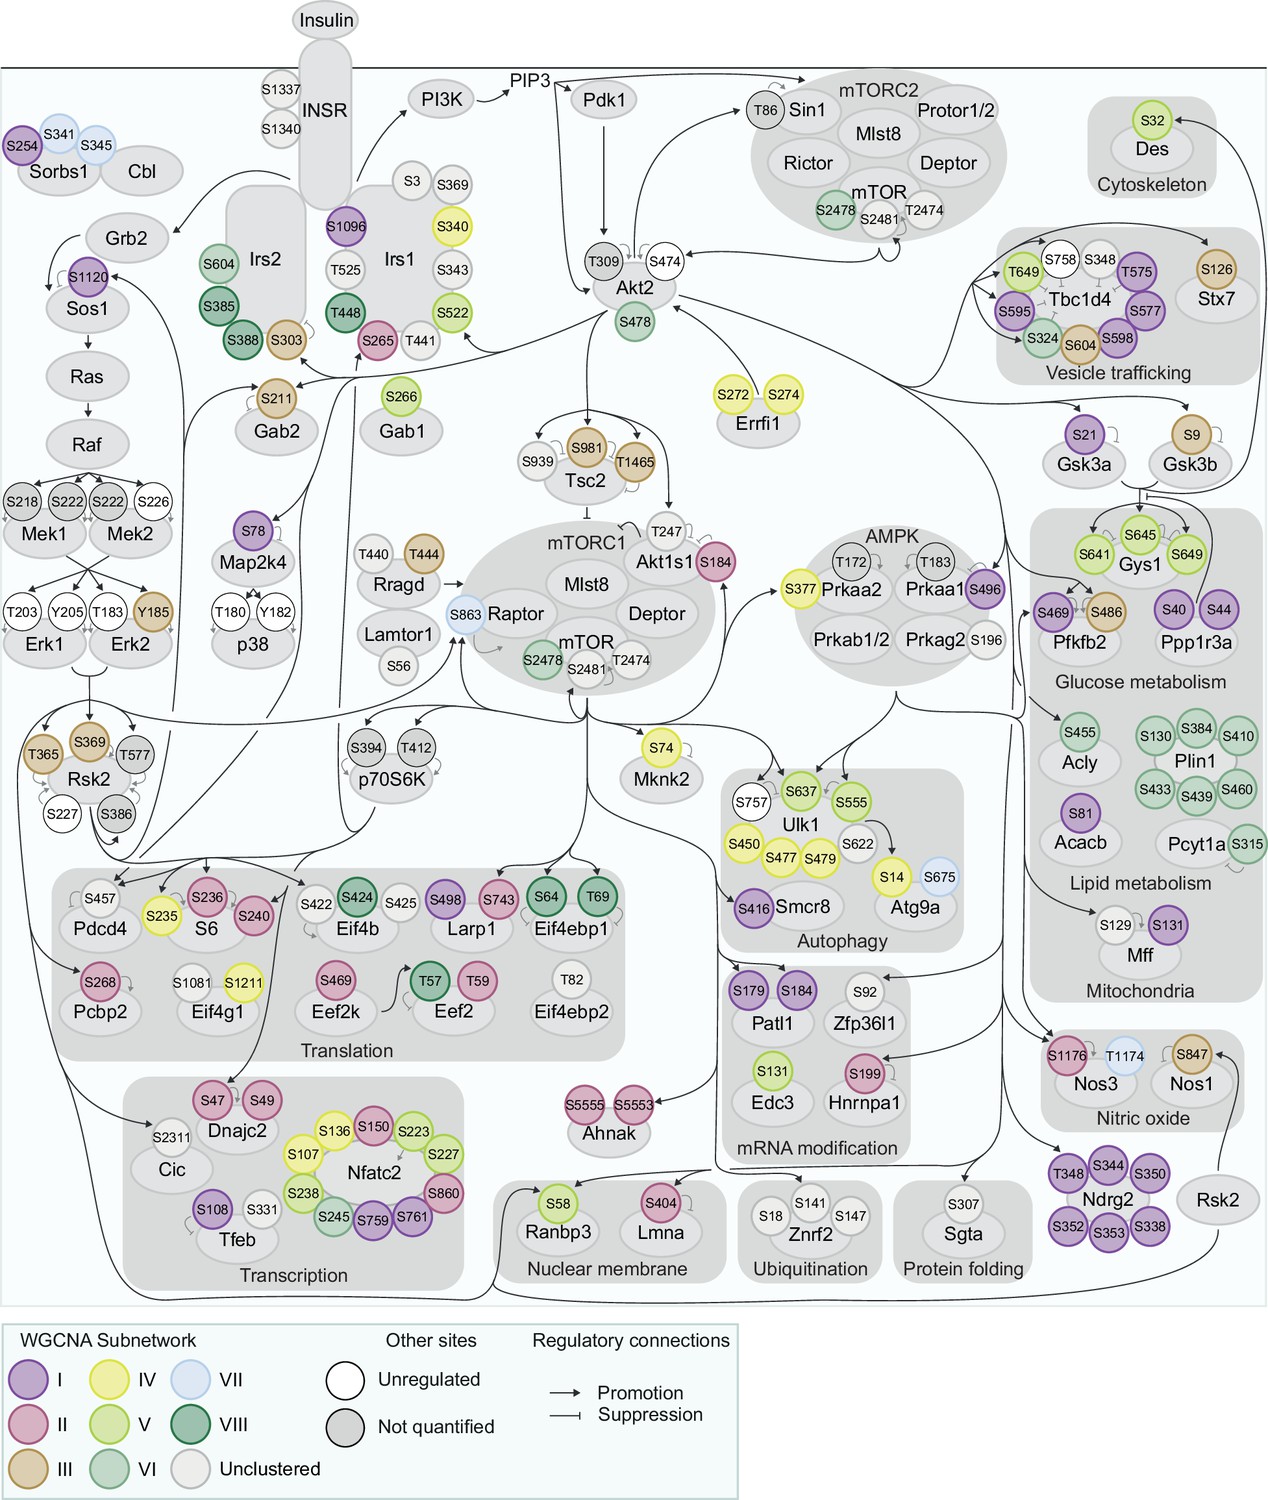
Organisation of insulin signalling subnetworks.
Figure 6 with 3 supplements
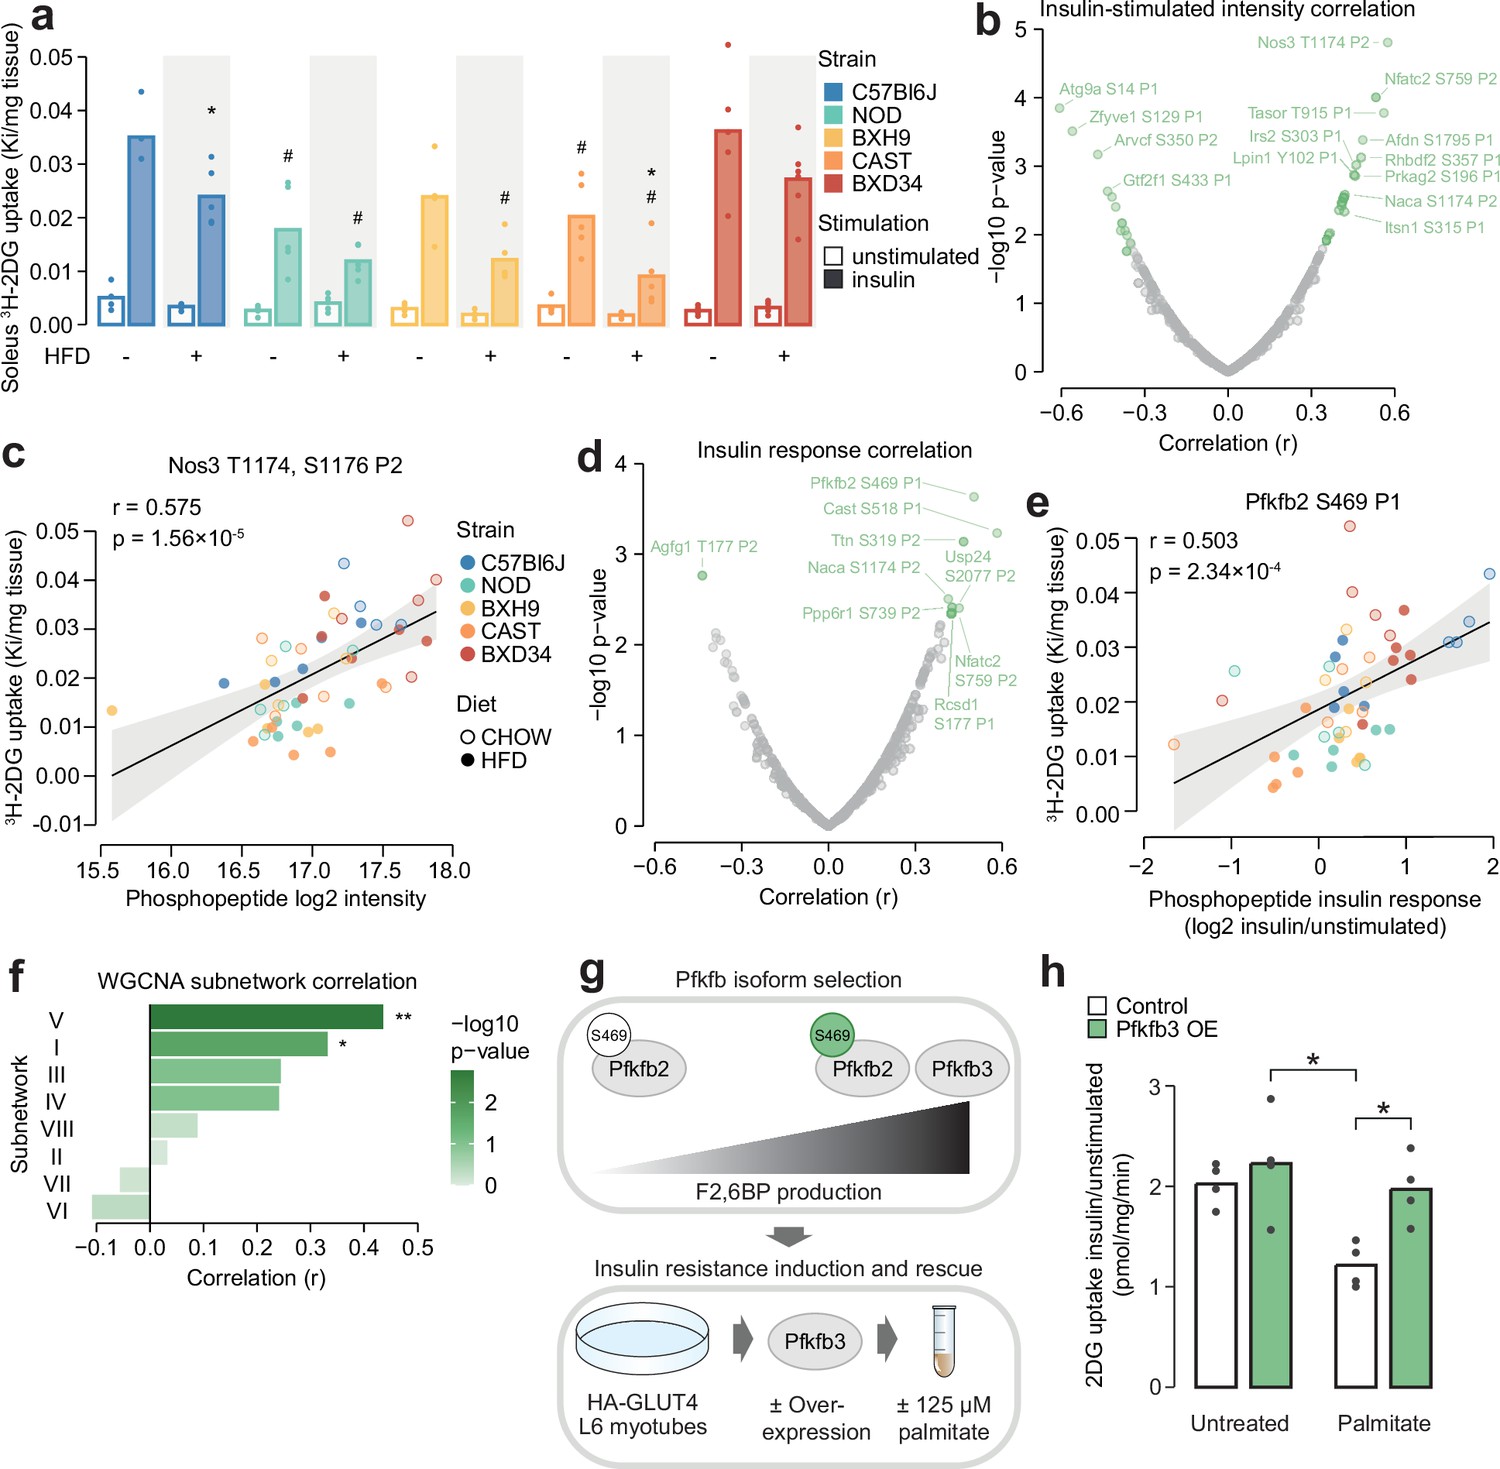
Leveraging biological variation to identify drivers of insulin responsiveness.
(a) The uptake of 3H-2DG into mouse soleus muscle after a 10 min injection of insulin (1 U/kg lean mass; ‘insulin’) or saline (‘unstimulated’) calculated as a rate constant (Ki). Two-sided t-tests were performed on insulin-stimulated uptake values to compare HFD to CHOW within each strain (adjusted p-value: *) or each strain to C57Bl6J within either diet (adjusted p-value: #). n=4–6 biological replicates. (b) Pearson’s correlation between log2 intensity of insulin-regulated phosphopeptides and 3H-2DG uptake within insulin-stimulated mice. Significantly correlated phosphopeptides (q-value <0.1, r>0.35 or r<–0.35) are coloured green and select correlated phosphopeptides are labelled. (c) Correlation of Nos3 T1174, S1176 insulin-stimulated intensity with insulin-stimulated 3H-2DG uptake. Linear regression is indicated with 95% confidence intervals. (d) As in (b), using phosphopeptide insulin response values. (e) Correlation of the Pfkfb2 S469 insulin response with insulin-stimulated 3H-2DG uptake. (f) Correlation of weighted gene correlation network analysis (WGCNA) subnetwork eigenpeptides with insulin-stimulated 3H-2DG uptake. Significant correlations are indicated (*). (g) Rationale and workflow for overexpressing Pfkfb3 to rescue palmitate-induced insulin resistance. (h) The fold change of unstimulated to insulin-stimulated glucose uptake (100 nM insulin, 20 min) in L6-GLUT4-HA myotubes with or without Pfkfb3 overexpression, treated with palmitate (125 µM, 16 hr) or BSA vehicle control. A two-way ANOVA was performed followed by Tukey’s post hoc tests (*). Not all significant comparisons are shown. n=4 biological replicates. */#: 0.01≤p<0.05, **/##: 0.001≤p<0.01, ***/###: p<0.001.
Figure 6—figure supplement 1
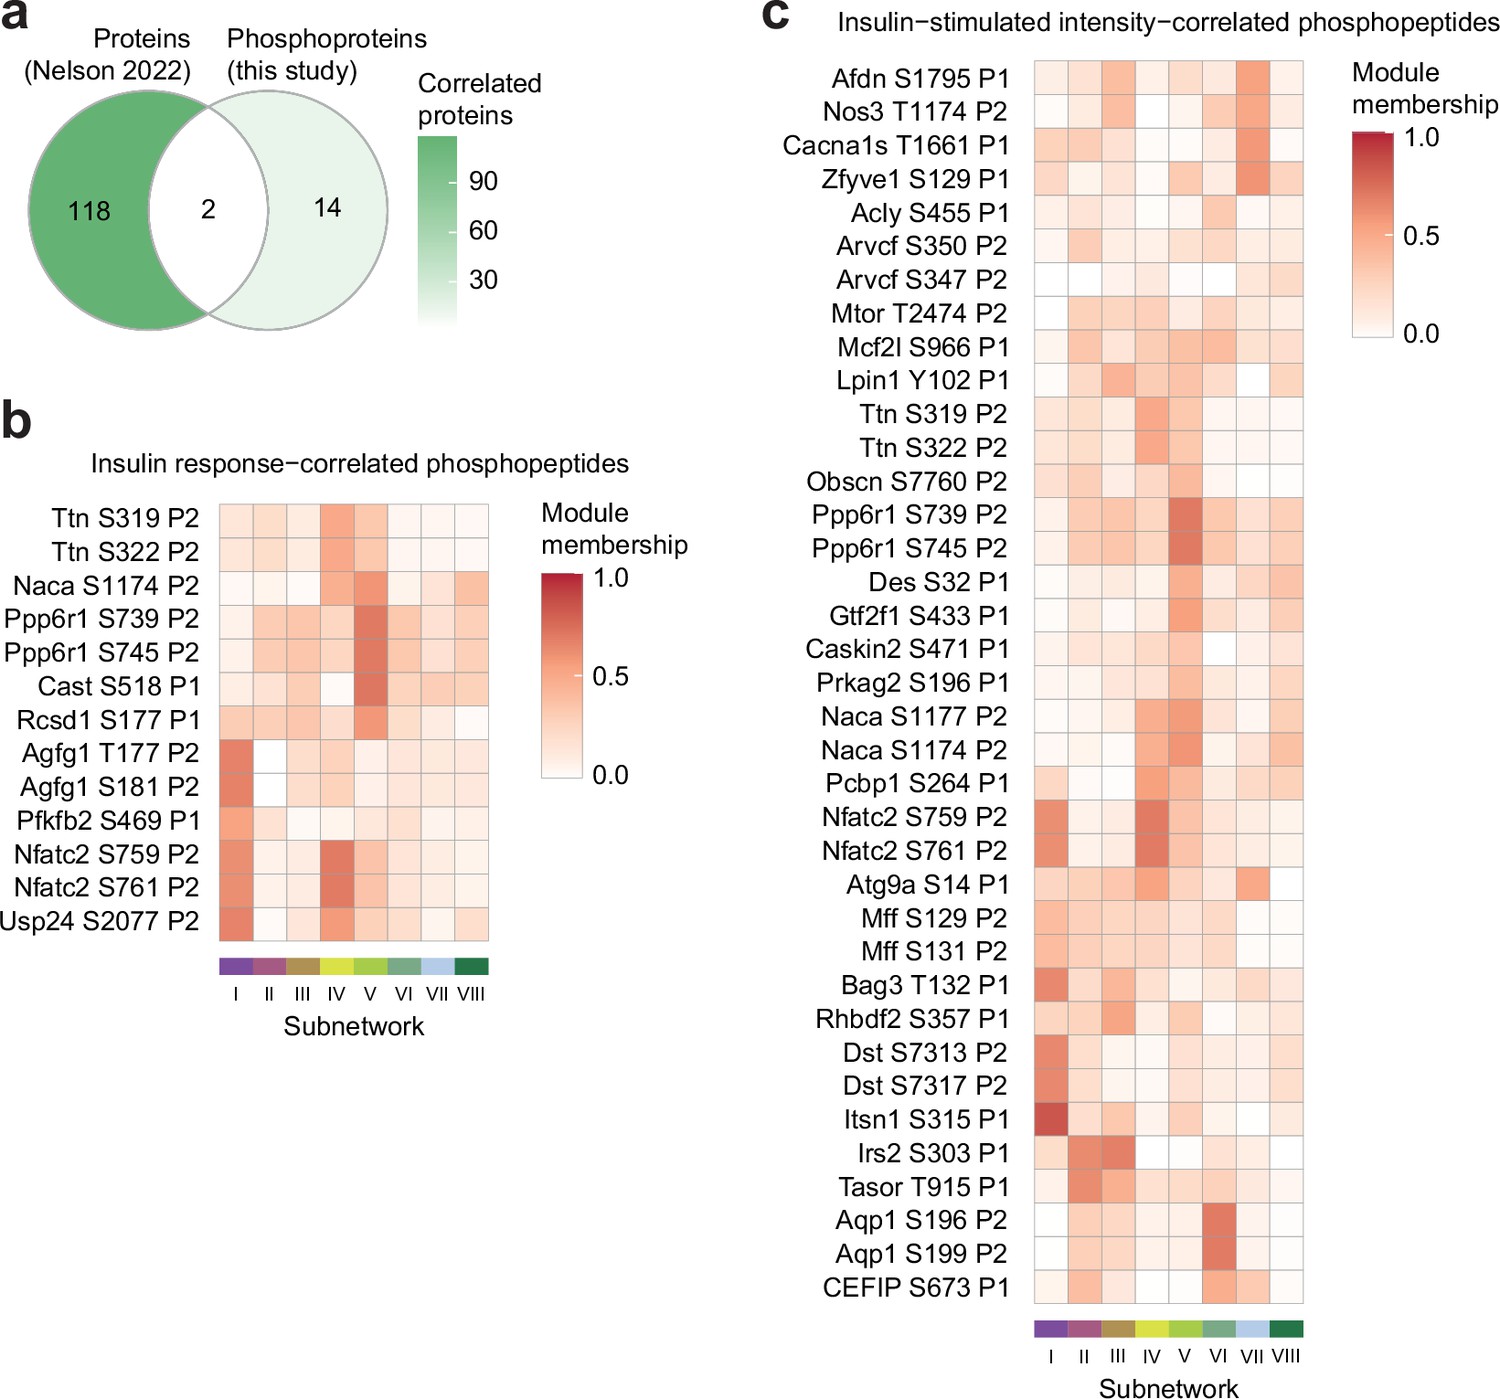
Characterisation of glucose uptake-correlated phosphosites.
(a) The intersection of proteins correlated with insulin-stimulated glucose uptake in the soleus of seven inbred mouse strains fed CHOW or HFD (Nelson et al., 2022) (p<0.1, r>0.35 or <–0.35), with proteins containing glucose uptake-correlated phosphopeptides in this study. Only (phospho)proteins quantified in both studies are shown. (b–c) The subnetwork membership scores for glucose uptake-correlated phosphopeptides using (b) insulin-stimulated phosphopeptide intensity, or (c) phosphopeptide insulin response values. Membership score is defined as the absolute Pearson’s correlation coefficient between a phosphopeptide’s insulin response and the subnetwork’s eigenpeptide.
Figure 6—figure supplement 2
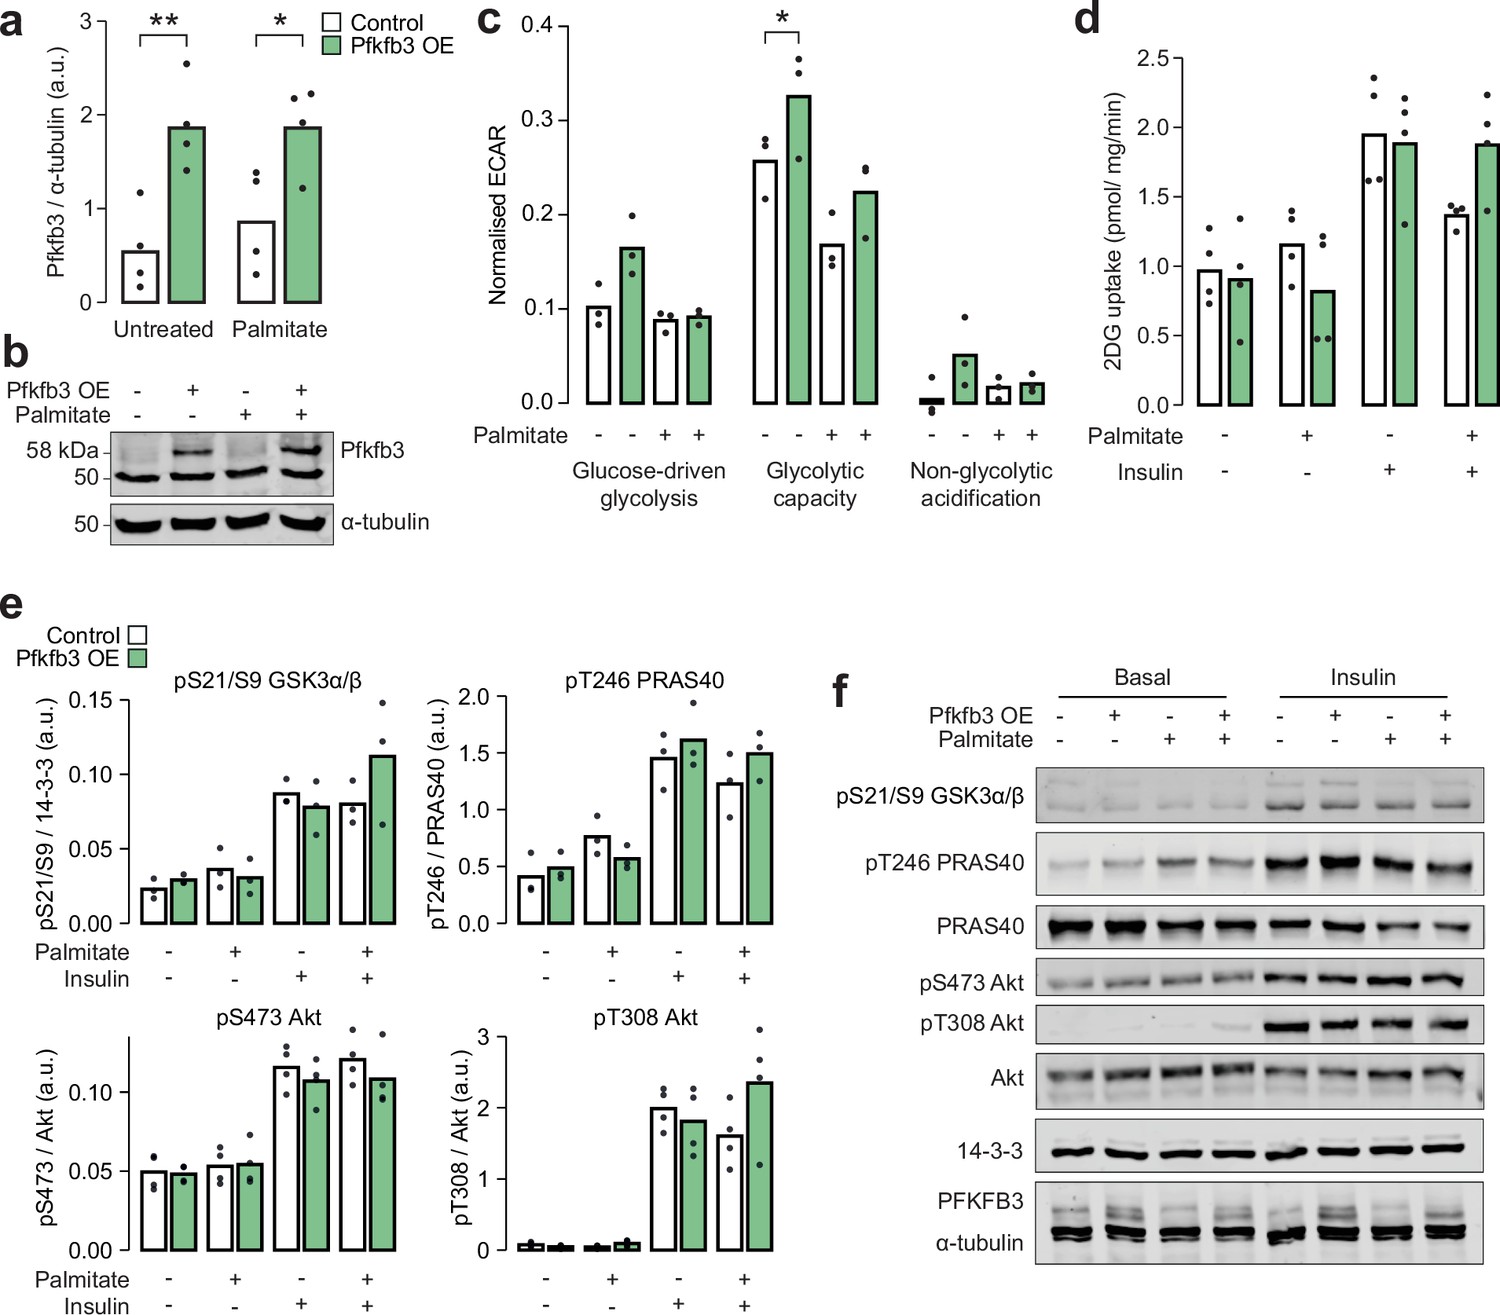
Overexpression of Pfkfb3 enhances glycolytic capacity and reverses palmitate-induced insulin resistance.
(a) Quantification and (b) representative blot for immunoblotting of Pfkfb3 in L6-GLUT4-HA myotubes with or without Pfkfb3 overexpression, treated with palmitate (125 µM, 16 hr) or BSA vehicle control. Two-way ANOVA was performed followed by Šidák’s post hoc tests assessing the effect of Pfkfb3 overexpression (*). n=4 biological replicates. (c) Extracellular acidification rate (ECAR) in L6-GLUT4-HA myotubes treated with glucose (10 mM, ‘glucose-driven glycolysis’), oligomycin (5 µg/mL, ‘glycolytic capacity’), or 2-deoxyglucose (50 mM, ‘non-glycolytic acidification’). A two-way ANOVA was performed followed by Tukey’s post hoc tests comparing conditions within each of the three treatments (*). Not all significant comparisons are shown. n=3 biological replicates. (d) Unstimulated and insulin-stimulated glucose uptake (100 nM insulin, 20 min) in L6-GLUT4-HA myotubes. Insulin/unstimulated fold changes are shown in Figure 6h. (e) Quantification and (f) representative blot for immunoblotting of insulin signalling phosphosites in unstimulated or insulin-stimulated (100 nM, 20 min) L6-GLUT4-HA myotubes. */#: 0.01≤p<0.05, **/##: 0.001≤p<0.01, ***/###: p<0.001.
-
Figure 6—figure supplement 2—source data 1
Unedited scans of western blots for panels (b) and (f).
- https://cdn.elifesciences.org/articles/89212/elife-89212-fig6-figsupp2-data1-v1.zip
-
Figure 6—figure supplement 2—source data 2
Pdf containing unedited scans of western blots alongside the edited scans in panels (b) and (f).
- https://cdn.elifesciences.org/articles/89212/elife-89212-fig6-figsupp2-data2-v1.zip
Figure 6—figure supplement 3
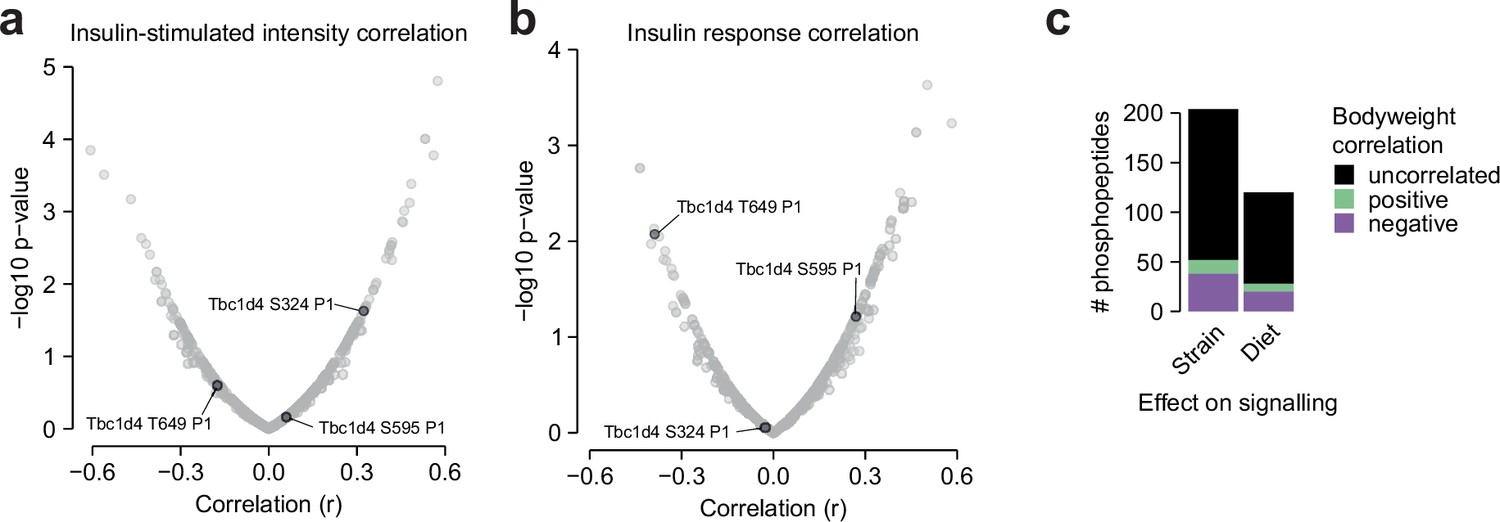
Additional glucose uptake correlation analysis.
(a–b) The correlation of insulin-stimulated glucose uptake with insulin-regulated phosphopeptides using (a) insulin-stimulated phosphopeptide intensity, or (b) phosphopeptide insulin response values, as displayed in Figure 6. Canonical regulatory phosphosites on Tbc1d4 are indicated. The fourth canonical regulatory site S758 was not analysed due to insufficient quantification (quantified in 4/94 samples). (c) The correlation of mouse body weight with the insulin responses of Strain or Diet-affected phosphopeptides either in CHOW-fed mice (Strain effects) or across both diets (Diet effects). The number of positively correlated (Pearson’s correlation, q<0.1, r>0.35) and negatively correlated (q<0.1, r<–0.35) phosphopeptides is shown.
Author response image 1

Phosphopeptide quantification following filtering.
a) The number of phosphopeptides quantified in each sample after filtering prior to statistical analysis.
Additional files
-
Supplementary file 1
Muscle phosphoproteomics.
(Page 1 ‘01_quantification’) Normalised LFQ intensities of class I phosphopeptides. (Page 2 ‘02_analysis’) Statistical analysis of phosphoproteome data.
- https://cdn.elifesciences.org/articles/89212/elife-89212-supp1-v1.xlsx
-
Supplementary file 2
Overlap between insulin and exercise-regulated phosphosites.
Insulin-regulated phosphosites from this study that were additionally regulated by exercise either in Needham et al., 2022 or Hoffman et al., 2015.
- https://cdn.elifesciences.org/articles/89212/elife-89212-supp2-v1.xlsx
-
Supplementary file 3
Insulin signalling subnetworks.
Weighted gene correlation network analysis (WGCNA)-derived subnetworks of insulin-regulated phosphopeptides.
- https://cdn.elifesciences.org/articles/89212/elife-89212-supp3-v1.xlsx
-
Supplementary file 4
Association of kinase enrichment with insulin-stimulated glucose uptake.
Pearson’s correlation of kinase substrate enrichment analysis (KSEA) enrichment scores with insulin-stimulated glucose uptake for all kinases with Strain or Diet effects. Correlation was performed on all values or on the medians of each strain-diet combination.
- https://cdn.elifesciences.org/articles/89212/elife-89212-supp4-v1.xlsx
-
MDAR checklist
- https://cdn.elifesciences.org/articles/89212/elife-89212-mdarchecklist1-v1.pdf
Download links
A two-part list of links to download the article, or parts of the article, in various formats.
Downloads (link to download the article as PDF)
Open citations (links to open the citations from this article in various online reference manager services)
Cite this article (links to download the citations from this article in formats compatible with various reference manager tools)
The genetic and dietary landscape of the muscle insulin signalling network
eLife 12:RP89212.
https://doi.org/10.7554/eLife.89212.3


