Hexokinase regulates Mondo-mediated longevity via the PPP and organellar dynamics
- Department of Molecular Genetics of Ageing, Max Planck Institute for Biology of Ageing, Germany
- Cologne Excellence Cluster on Cellular Stress Responses in Aging-Associated Diseases (CECAD), University of Cologne, Germany
Figures
Figure 1 with 1 supplement
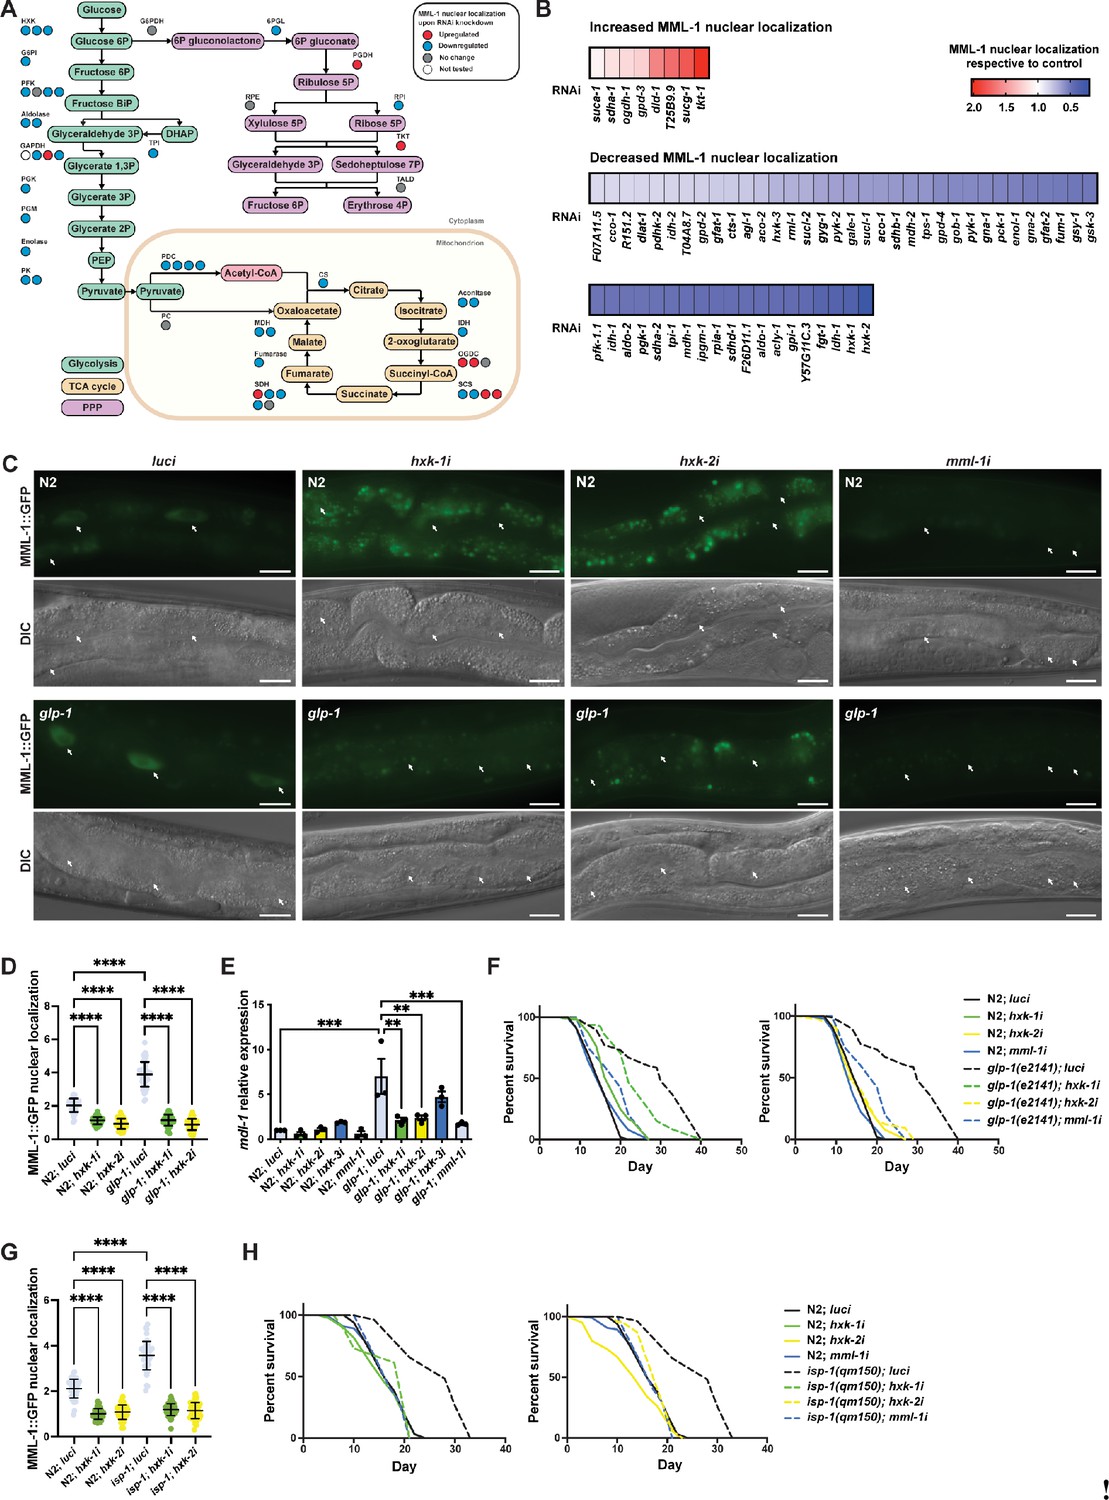
Hexokinases are required for germline longevity by regulating MML-1 localization and function.
(A) Screening for MML-1 regulators upon knockdown of glucose metabolism enzymes. For clarity, we only mapped the candidate genes involved in glycolysis, the TCA cycle, and PPP. See Supplementary file 1A for a complete list of genes tested. MML-1::GFP (dhIs989) nuclear localization was measured in intestinal cells of day 1 adult worms grown in the RNA interference (RNAi) egg-on. Each circle represents one gene encoding an isozyme or subunit of the complex. Circles are color-coded to indicate the increase (red) or decrease (blue) of MML-1::GFP nuclear localization upon knockdown of the enzymes compared to internal luci controls. DHAP, dihydroxyacetone phosphate; PEP, phosphoenolpyruvate; TCA cycle, tricarboxylic acid cycle; PPP, pentose phosphate pathway. (B) Quantification of MML-1 nuclear localization upon knockdown of glucose metabolism genes. Only genes that statistically affected MML-1 nuclear localization compared to the internal luci control are depicted (p<0.05; N≥2). (C, D) Representative images (C) and quantification (D) of MML-1 nuclear localization in wild type and the germlineless glp-1(e2141) longevity background upon knockdown of luci (control), hxk-1i, hxk-2i, and mml-1i. MML-1::GFP was quantified in nuclei from intestinal cells (white arrows) in day 1 adult worms (N=3). Scale bars, 10 μm. (E) Relative mRNA levels of MML-1 downstream target mdl-1 in young adult worms measured by qPCR (N=3). (F) Lifespans of wild type and glp-1(e2141) upon hxk-1 and hxk-2 knockdown. Lifespans for hxk-1 and hxk-2 knockdown were performed in the same experiment and plotted separately for clarity; therefore, control lifespans are shared between plots. (G) Quantification of MML-1 nuclear localization in wild-type and isp-1(qm150) mutants upon luci, hxk-1i, and hxk-2i in day 1 adult worms (N=3). (H) Lifespan of wild type and isp-1(qm150) upon hxk-1 and hxk-2 knockdown (N=2). Statistical significance was calculated with t-test in (A, B), one-way ANOVA in (D, G), two-tailed t-test in (E), and Log-rank (Mantel-Cox) test in (F, H). (D, G) bars represent mean ± SD, and (E) bars represent mean ± SEM.
-
Figure 1—source data 1
Raw data from Figure 1.
- https://cdn.elifesciences.org/articles/89225/elife-89225-fig1-data1-v1.xlsx
Figure 1—figure supplement 1
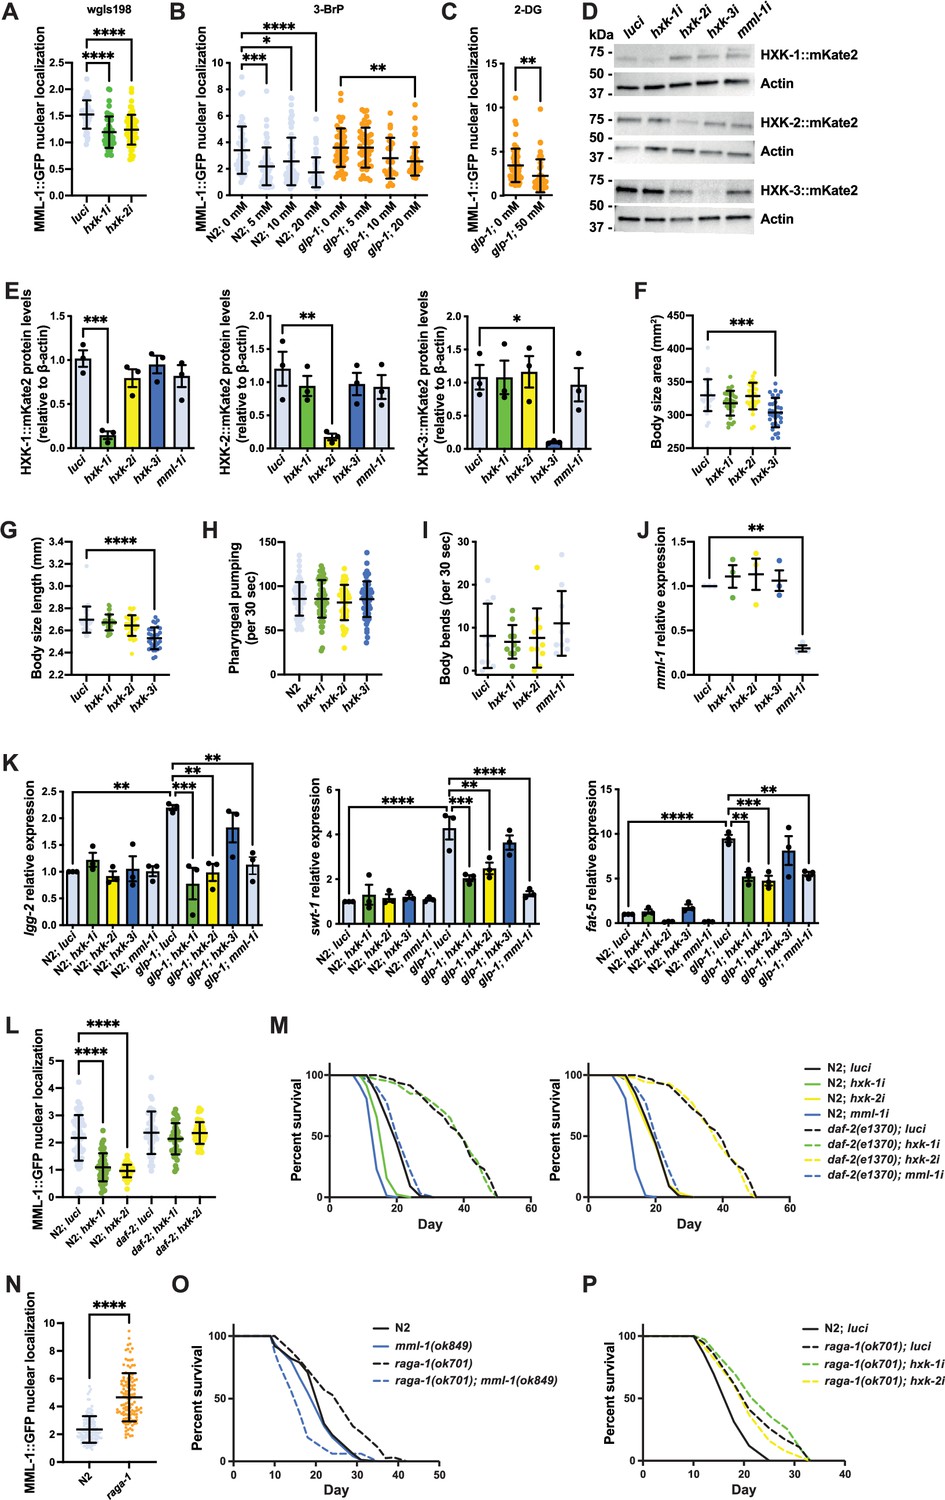
Hexokinases regulate MML-1 nuclear localization and transcriptional function.
(A) MML-1 nuclear localization in the fosmid line wgIs198 was quantified in intestinal cells of day 1 adult worms using hxk-1 and hxk-2 knockdown (n>25 worms; N=3). (B) Quantification of MML-1 nuclear localization in intestinal cells of day 1 adult wild-type and glp-1(e2141) worms supplemented with the glycolytic inhibitor 3-bromopyruvate (3-BrP) 5, 10, and 20 mM egg-on (n>25 worms; N=2). (C) Quantification of MML-1 nuclear localization in intestinal cells of day 1 adult glp-1(e2141) worms supplemented with the glycolytic inhibitor 2-deoxy-glucose (2-DG) 50 mM egg-on (n>25 worms; N=2). (D, E) Representative western blot (D) and densitometry analysis (E) of hexokinases basal levels under hxk-1i, hxk-2i, hxk-3i, and mml-1i. Protein levels were normalized to actin as a loading control (n>250 worms; N=3). (F–H) Measurements of body size area (F), length (G), and pharyngeal pumping rate (H) of day 1 adult worms grown under hexokinase knockdown (n>25 worms; N=3). (I) Motility assay of day 1 adult worms grown under hexokinase knockdown (n>25 worms; N=2). (J) Relative mml-1 mRNA levels under hexokinase knockdown measured by qPCR (n>300 worms; N=3). (K) Relative mRNA expression of MML-1 downstream targets lgg-2, swt-1, and fat-5 measured by qPCR (n>300 worms; N=3). (L) Quantification of MML-1 nuclear localization in wild-type and daf-2(e1370) mutants upon luci, hxk-1i, and hxk-2i in day 1 adult worms (n>25 worms; N=3). (M) Lifespan of wild type and daf-2(e1370) upon hxk-1 and hxk-2 knockdown (N=2). See Supplementary file 1B for statistical analysis. (N) Quantification of MML-1 nuclear localization in wild-type and raga-1(ok701) mutants in day 1 adult worms (n>25 worms; N=3). (O) Lifespan of wild-type, raga-1(ok701), mml-1(ok849), and raga-1 mml-1 double mutant (N=3). See Supplementary file 1B for statistical analysis. (P) Lifespan of wild type and raga-1(ok701) upon hxk-1 and hxk-2 knockdown (N=3). See Supplementary file 1B for statistical analysis. Statistical significance was calculated with t-test in (C, N), one-way ANOVA in (A, B, E–L), and Log-rank (Mantel-Cox) test in (M, O–P). (A–C, F–J, L, N) bars represent mean ± SD, and (E, K) bars represent mean ± SEM.
-
Figure 1—figure supplement 1—source data 1
Original western blots from Figure 1—figure supplement 1.
- https://cdn.elifesciences.org/articles/89225/elife-89225-fig1-figsupp1-data1-v1.zip
-
Figure 1—figure supplement 1—source data 2
Original western blots from Figure 1—figure supplement 1, labeled.
- https://cdn.elifesciences.org/articles/89225/elife-89225-fig1-figsupp1-data2-v1.zip
-
Figure 1—figure supplement 1—source data 3
Raw data from Figure 1—figure supplement 1.
- https://cdn.elifesciences.org/articles/89225/elife-89225-fig1-figsupp1-data3-v1.xlsx
Figure 2 with 1 supplement
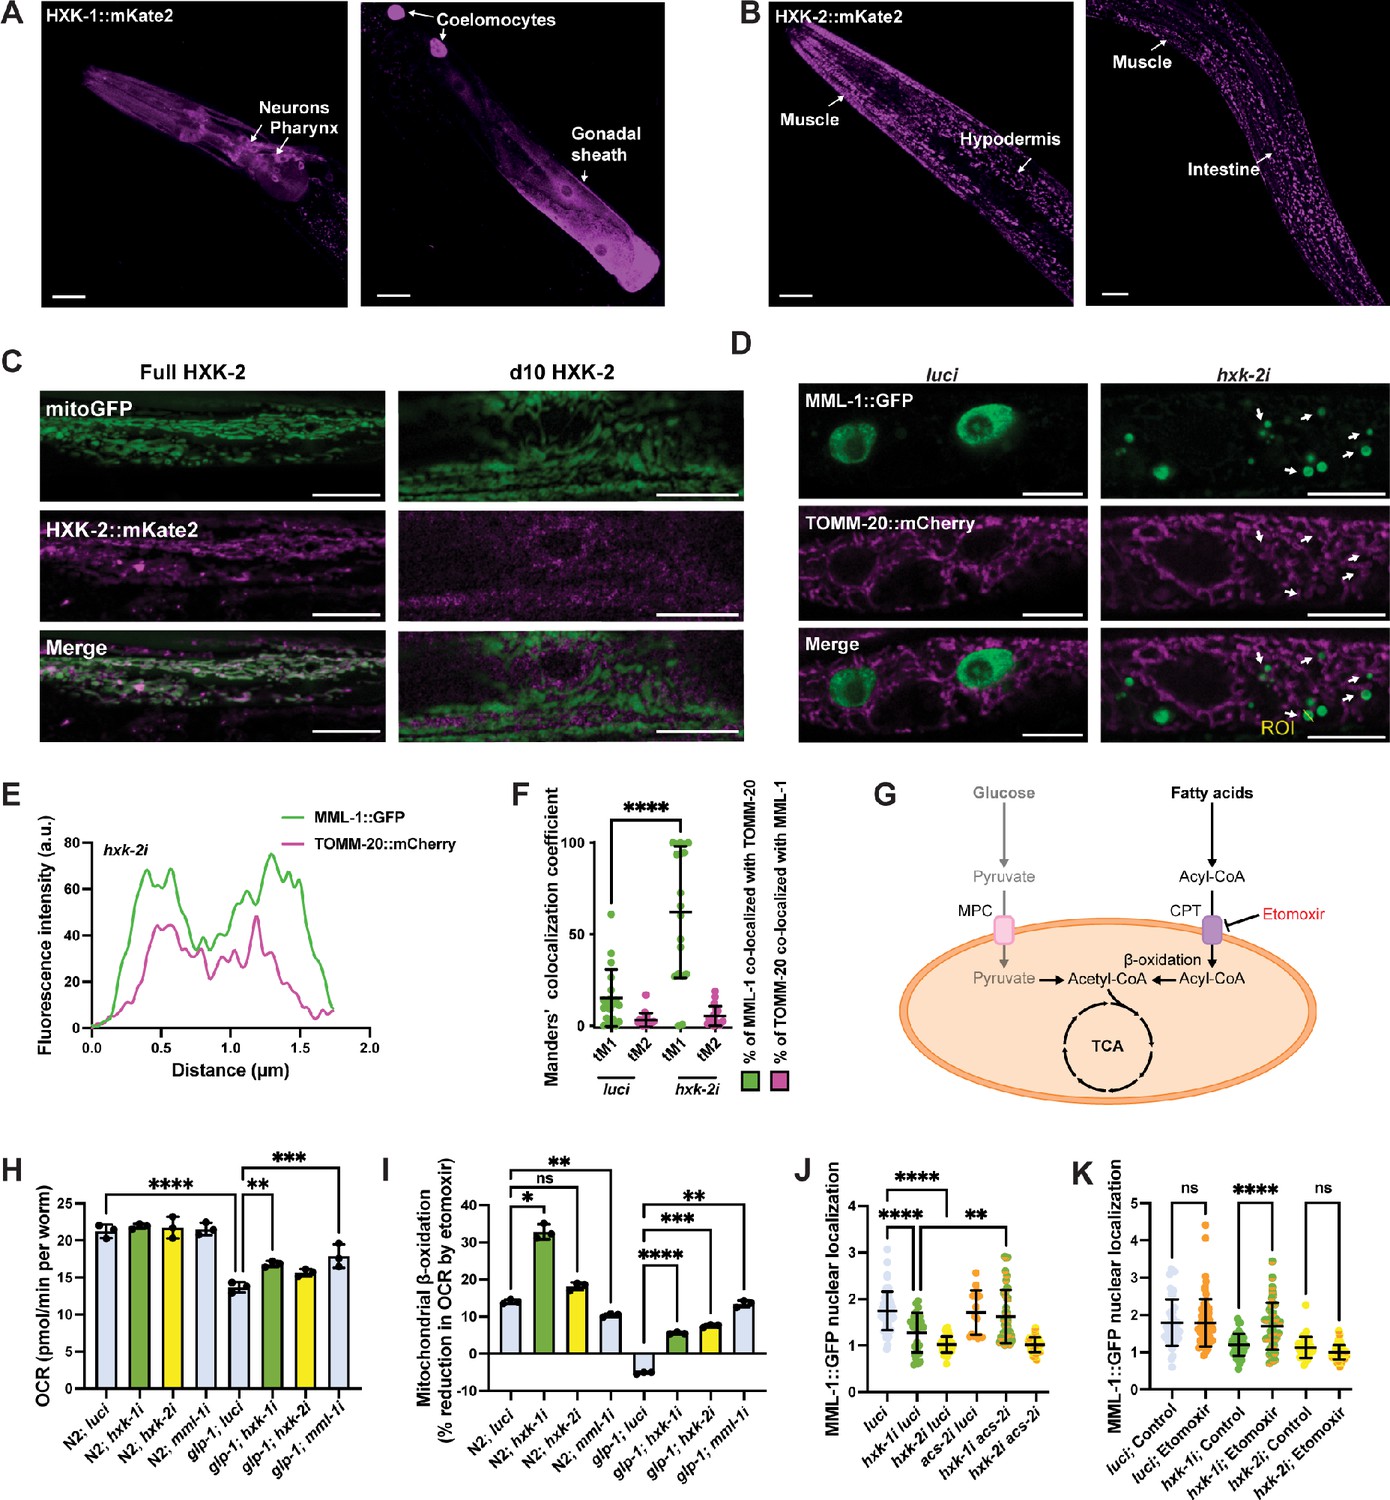
Enhanced mitochondrial β-oxidation suppresses MML-1 nuclear localization upon hxk-1 knockdown.
(A, B) Tissue expression of HXK-1::mKate2 (A) and HXK-2::mKate2 (B) isozymes. The primary tissues are identified with arrows. Scale bars, 20 μm. (C) Co-localization of mitochondrial reporter myo-3p::mitoGFP with full-length HXK-2::mKate2 and d10 HXK-2::mKate2 lacking the first 10 residues of the N-terminus. Scale bars, 10 μm. (D) Representative confocal images of day 1 adult worms expressing MML-1::GFP and the mitochondrial reporter ges-1p::TOMM-20::mCherry under luci and hxk-2i. Scale bars, 10 μm. (E) Intensity plot of the region of interest (ROI) from hxk-2i (D). (F) Co-localization of MML-1::GFP and TOMM-20::mCherry in luci and hxk-2i. The co-localization analysis was calculated with the thresholded Manders’ co-localization coefficients tM1 (GFP channel) and tM2 (mCherry channel) (N=3). (G) When glycolysis is reduced, cells rely on fatty acids for energy production. Free fatty acids are activated to acyl-CoA and transported to the mitochondria through the CPT in the mitochondrial outer membrane. The acyl-CoA is then metabolized to generate acetyl-CoA that can enter the tricarboxylic acid (TCA) cycle to produce energy. MPC, mitochondrial pyruvate carrier; CPT, carnitine palmitoyltransferase. (H, I) Oxygen consumption rate (OCR) under basal conditions (H) and after the addition of the mitochondrial β-oxidation inhibitor etomoxir (I). Mitochondrial β-oxidation is calculated as the percentage of decreased OCR after injecting etomoxir (N=3). (J) MML-1 nuclear localization of day 1 adult worms grown with double knockdown of hxk-1 or hxk-2 combined acs-2i (N=3). (K) MML-1 nuclear localization of day 1 adult worms grown upon hxk-1 and hxk-2 knockdown with supplementation of etomoxir 100 μM egg-on (N=3). Statistical significance was calculated with t-test in (F), and one-way ANOVA in (H–K). (F, J–K) bars represent mean ± SD, (H, I) bars represent mean ± SEM.
-
Figure 2—source data 1
Raw data from Figure 2.
- https://cdn.elifesciences.org/articles/89225/elife-89225-fig2-data1-v1.xlsx
Figure 2—figure supplement 1
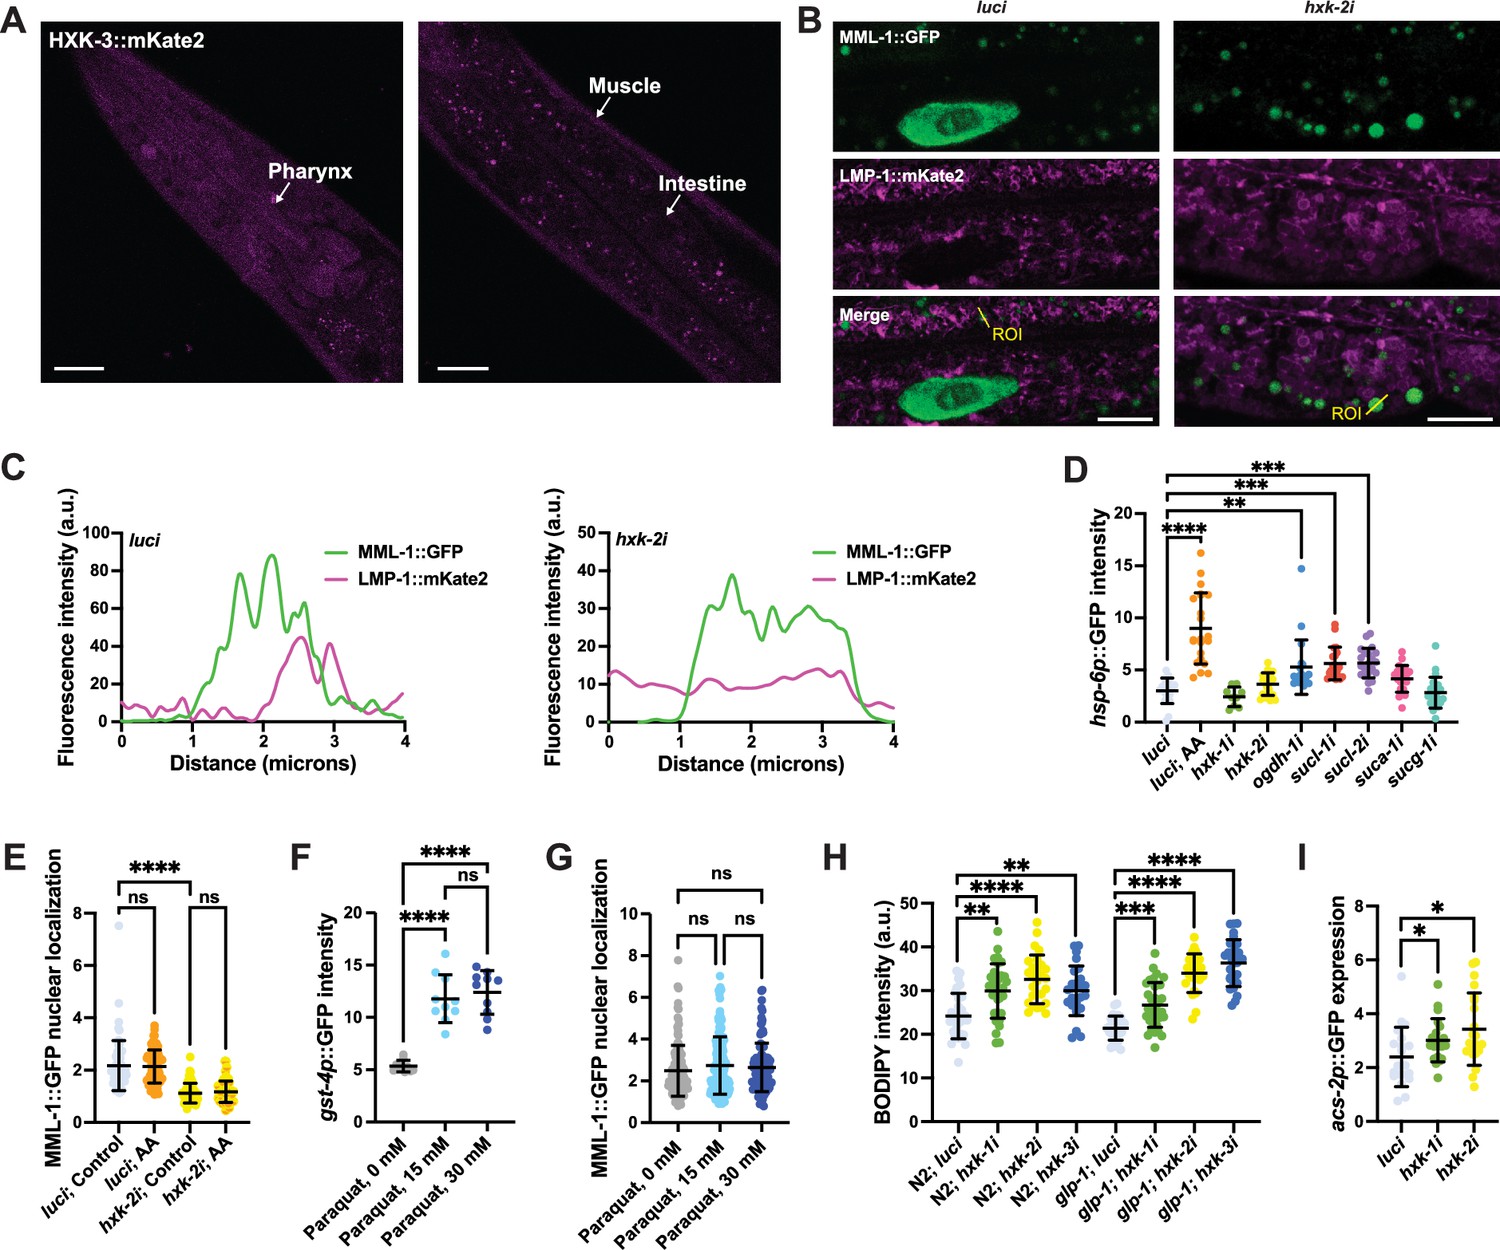
MML-1 regulation by glucose metabolism is independent of mitochondrial and oxidative stress response.
(A) Localization of HXK-3::mKate2 isozyme. The primary tissues are identified with arrows. Scale bars, 20 μm. (B) Representative confocal images of day 1 adult worms expressing MML-1::GFP and the lysosome/endosome reporter LMP-1::mKate2 under luci and hxk-2i. Scale bars, 10 μm. (C) Intensity plots of the regions of interest (ROIs) from (B) (n>10 MML-1-positive puncta per worm). (D) Quantification of mitochondrial stress response hsp-6p::GFP transcriptional reporter upon knockdown of candidate genes regulating MML-1 nuclear localization. Worms were imaged on day 1 of adulthood. As a positive control for induction of mitochondrial stress, worms were supplemented with antimycin A (AA) 10 μg/mL for 24 hr before imaging (N=3). (E) Quantification of MML-1::GFP nuclear localization of worms grown under luci and hxk-2i supplemented with AA at the L4 stage, and nuclear localization was measured after 24 hr (N=3). (F) Quantification of day 1 adult worms expressing gst-4p::GFP transcriptional reporter exposed to paraquat for 6 hr (N=3). (G) Quantification of MML-1::GFP nuclear localization of day 1 adult worms exposed to paraquat for 6 hr (N=3). (H) Neutral lipid content was measured on day 1 of adulthood by feeding worms with C1-BODIPY-C12 egg-on (N=3). (I) Quantification of day 1 adult worms expressing the transcriptional reporter acs-2p::GFP under hexokinase knockdown (N=3). Statistical significance was calculated with one-way ANOVA in (D–G). (D–G) bars represent mean ± SD.
-
Figure 2—figure supplement 1—source data 1
Raw data from Figure 2—figure supplement 1.
- https://cdn.elifesciences.org/articles/89225/elife-89225-fig2-figsupp1-data1-v1.xlsx
Figure 3 with 1 supplement
HXK-2 regulates MML-1 localization and function through inhibition of the pentose phosphate pathway (PPP).
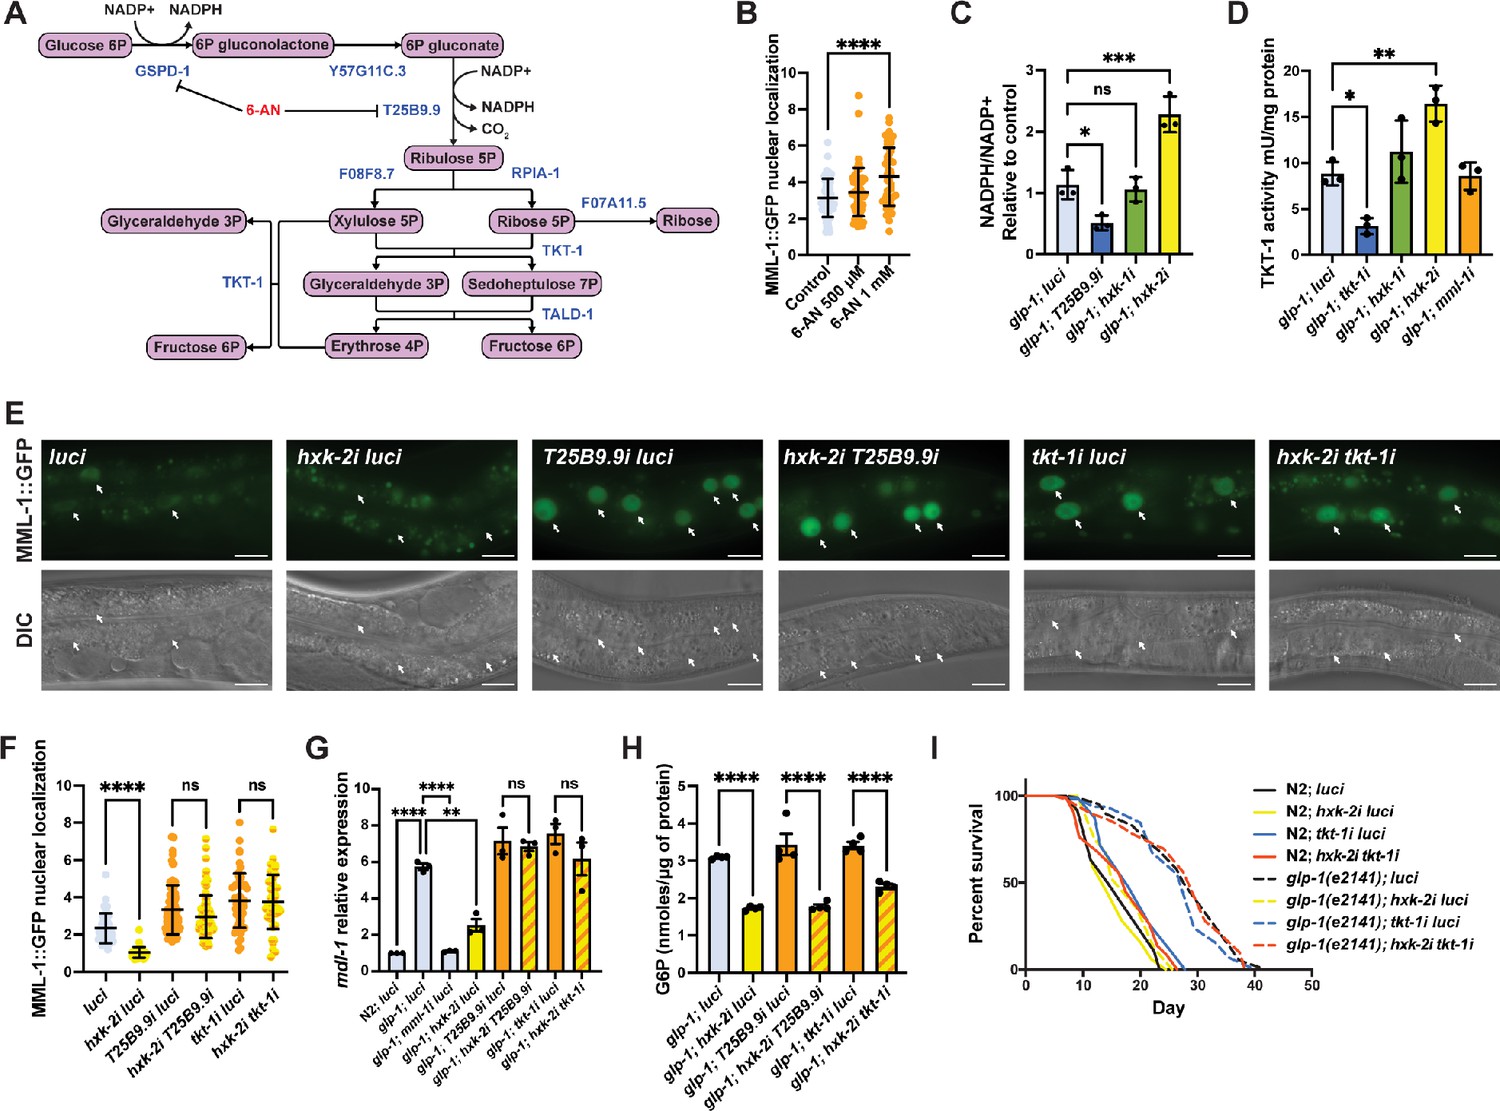
(A) The PPP is a cytosolic pathway that metabolizes glucose 6-phosphate (G6P) to produce NADPH and ribose-5P, and interconverts 3–7 carbon sugars. 6-Aminonicotinamide (6-AN) is a PPP inhibitor that acts on the NADPH-producing enzymes GSPD-1 and T25B9.9. (B) Quantification of MML-1 nuclear localization of day 1 adult worms supplemented with 500 μM and 1 mM of 6-AN egg-on (N=3). (C) Quantification of NADP+ and NADPH levels in day 1 adult glp-1(e2141) worms grown under hexokinase knockdown. T25B9.9i was used as a control. Metabolite levels were normalized to total protein concentration (N=3). (D) Transketolase enzymatic activity assay on day 1 adult glp-1(e2141) worms grown under hexokinase knockdown. tkt-1i was used as a control. Activity levels were normalized to total protein concentration (N=3). (E, F) Representative images (E) and quantification (F) of MML-1 nuclear localization of day 1 adult worms upon double knockdown of hxk-2 with the PPP enzymes T25B9.9 and tkt-1 (N=3). Scale bars, 20 μm. (G) Relative mRNA levels of MML-1 downstream target mdl-1 in young adult worms upon double knockdown of hxk-2 in combination with enzymes of the PPP measured by qPCR (N=3). (H) Quantification of G6P levels relative to total protein measured on day 1 adult glp-1(e2141) upon double knockdown of hxk-2 in combination with enzymes of the PPP (N=4). (I) Lifespan analysis of glp-1(e2141) with hxk-2i and tkt-1i single and double knockdowns. Lifespan was performed in the same experiment as in Figure 3—figure supplement 1J; therefore, control lifespans are shared between plots (N=3). Statistical significance was calculated with a one-way ANOVA test in (B–D, F–H), and Log-rank (Mantel-Cox) test in (I). (B, F) bars represent mean ± SD, (C, D, G, H) bars represent mean ± SEM.
-
Figure 3—source data 1
Raw data from Figure 3.
- https://cdn.elifesciences.org/articles/89225/elife-89225-fig3-data1-v1.xlsx
Figure 3—figure supplement 1
HXK-1 and HXK-2 regulate MML-1 through parallel or independent pathways.
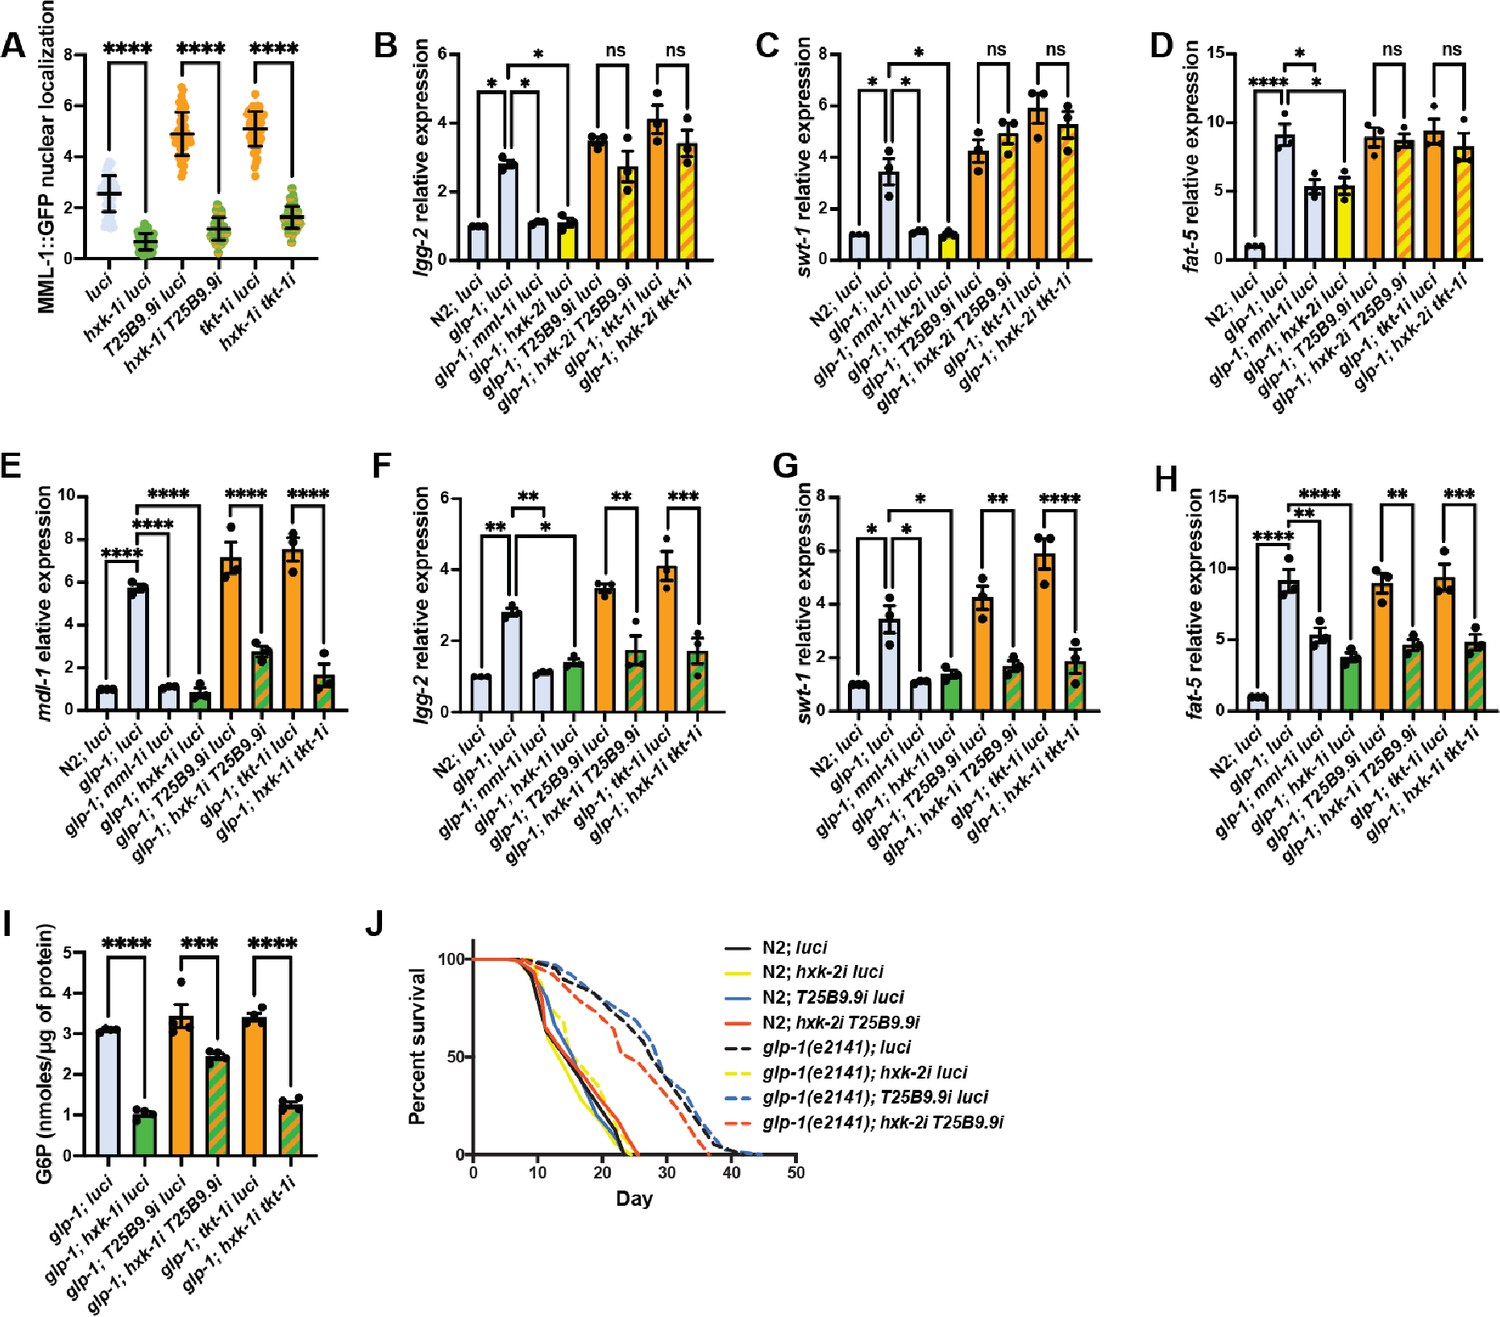
(A) MML-1 nuclear localization of day 1 adult worms upon double knockdown of hxk-1 with enzymes of the pentose phosphate pathway (PPP) (N=3). (B–D) Relative mRNA levels of MML-1 downstream targets lgg-2 (B), swt-1 (C), and fat-5 (D) in young adult worms with double knockdown of hxk-2 with enzymes of the PPP measured by qPCR (N=3). (E–H) Relative mRNA levels of MML-1 downstream targets mdl-1 (E), lgg-2 (F), swt-1 (G), and fat-5 (H) in young adult worms with double knockdown of hxk-1 with enzymes of the PPP measured by qPCR (N=3). (I) Quantification of glucose 6-phosphate (G6P) levels relative to total protein measured on day 1 adult glp-1(e2141) worms grown under hxk-1i in combination with enzymes from the PPP (N=4). (J) Lifespan analysis of glp-1(e2141) with hxk-2i and T25B9.9i single and double knockdowns. Lifespan was performed in the same experiment as in Figure 3I; therefore, control lifespans are shared between plots (N=3). Statistical significance was calculated with a one-way ANOVA test in A–I, and Log-rank (Mantel-Cox) test in (J). (A) Bars represent mean ± SD, (B–I) bars represent mean ± SEM.
-
Figure 3—figure supplement 1—source data 1
Raw data from Figure 3—figure supplement 1.
- https://cdn.elifesciences.org/articles/89225/elife-89225-fig3-figsupp1-data1-v1.xlsx
Figure 4 with 1 supplement
hxk-2 knockdown increases MML-1 co-localization with lipid droplet (LD).
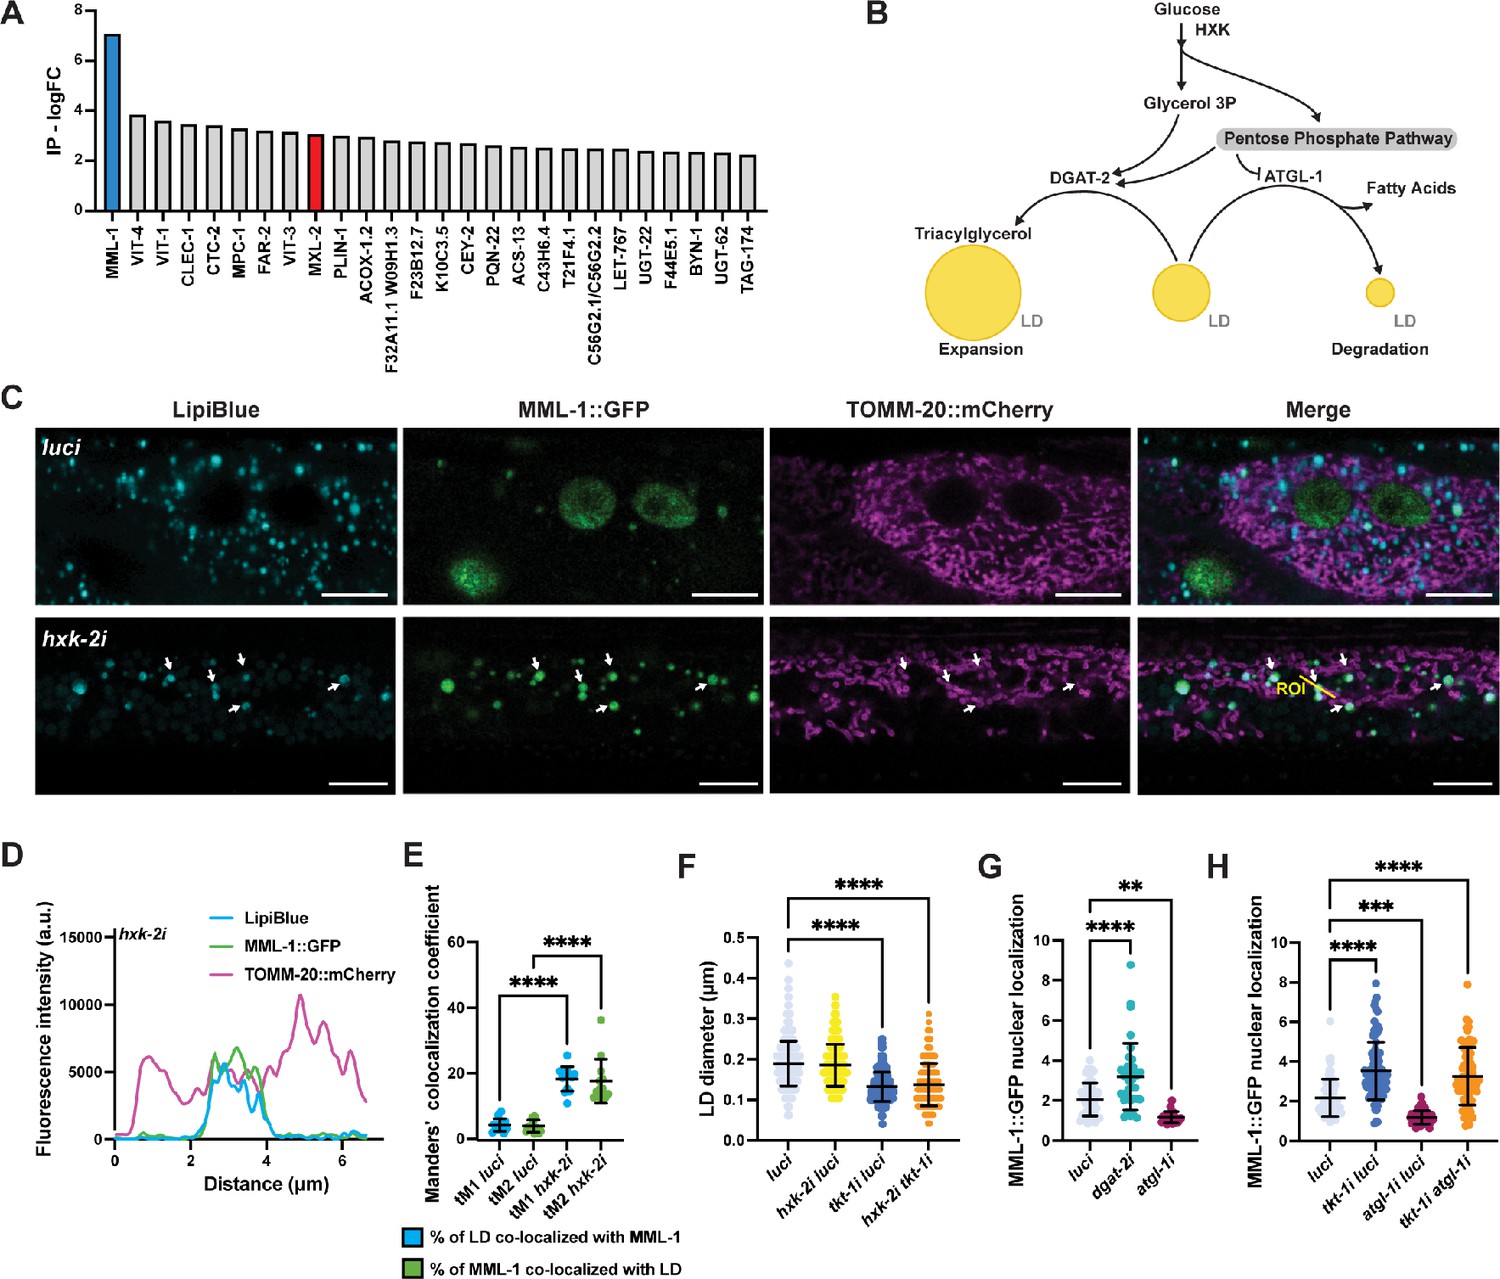
(A) Anti-FLAG immunoprecipitation (IP) from whole-worm lysates of animals expressing MML-1 endogenously tagged with 3xFLAG in wild-type background. IP was analyzed by mass spectrometry (LCMS/MS). The 25 top candidates co-enriched with MML-1 compared to non-transgenic wild-type control are shown as log FC, including MML-1 (blue) and its established binding partner MXL-2 (red). (B) Crosstalk between glycolysis, pentose phosphate pathway (PPP), and LD metabolism. On the one hand, LD expansion is favored by increased fatty acid synthesis and subsequent formation of triacylglycerol (TAG) by the diacylglycerol acetyltransferase DGAT-2. On the other hand, LD consumption releases free fatty acids from TAG by the rate-limiting lipase ATGL-1. (C) Confocal microscopy of day 1 adult worms expressing MML-1::GFP and the mitochondrial reporter TOMM-20::mCherry stained with the LD dye LipiBlue under luci and hxk-2i (N=3). Scale bars, 10 μm. (D) Intensity plot of the region of interest (ROI) from hxk-2i (C). (E) Co-localization of MML-1::GFP and LD in luci and hxk-2i. The co-localization analysis was calculated with the thresholded Manders’ co-localization coefficients tM1 (GFP channel) and tM2 (LipiBlue channel) (N=3). (F) Quantification of LD diameter in day 1 adult worms expressing the LD reporter PLIN-1::mCherry upon knockdown of hxk-2 and tkt-1 (N=3). (G) Quantification of MML-1 nuclear localization under knockdown of the LD metabolic enzymes dgat-2 and atg-1 (N=3). (H) Quantification of MML-1 nuclear localization upon double knockdown of tkt-1 and atgl-1 (N=3). Statistical significance was calculated with a one-way ANOVA test in E–H. (E–H) bars represent mean ± SD.
-
Figure 4—source data 1
Raw data from Figure 4.
- https://cdn.elifesciences.org/articles/89225/elife-89225-fig4-data1-v1.xlsx
Figure 4—figure supplement 1
MML-1 interactome is enriched with proteins from different organelles.
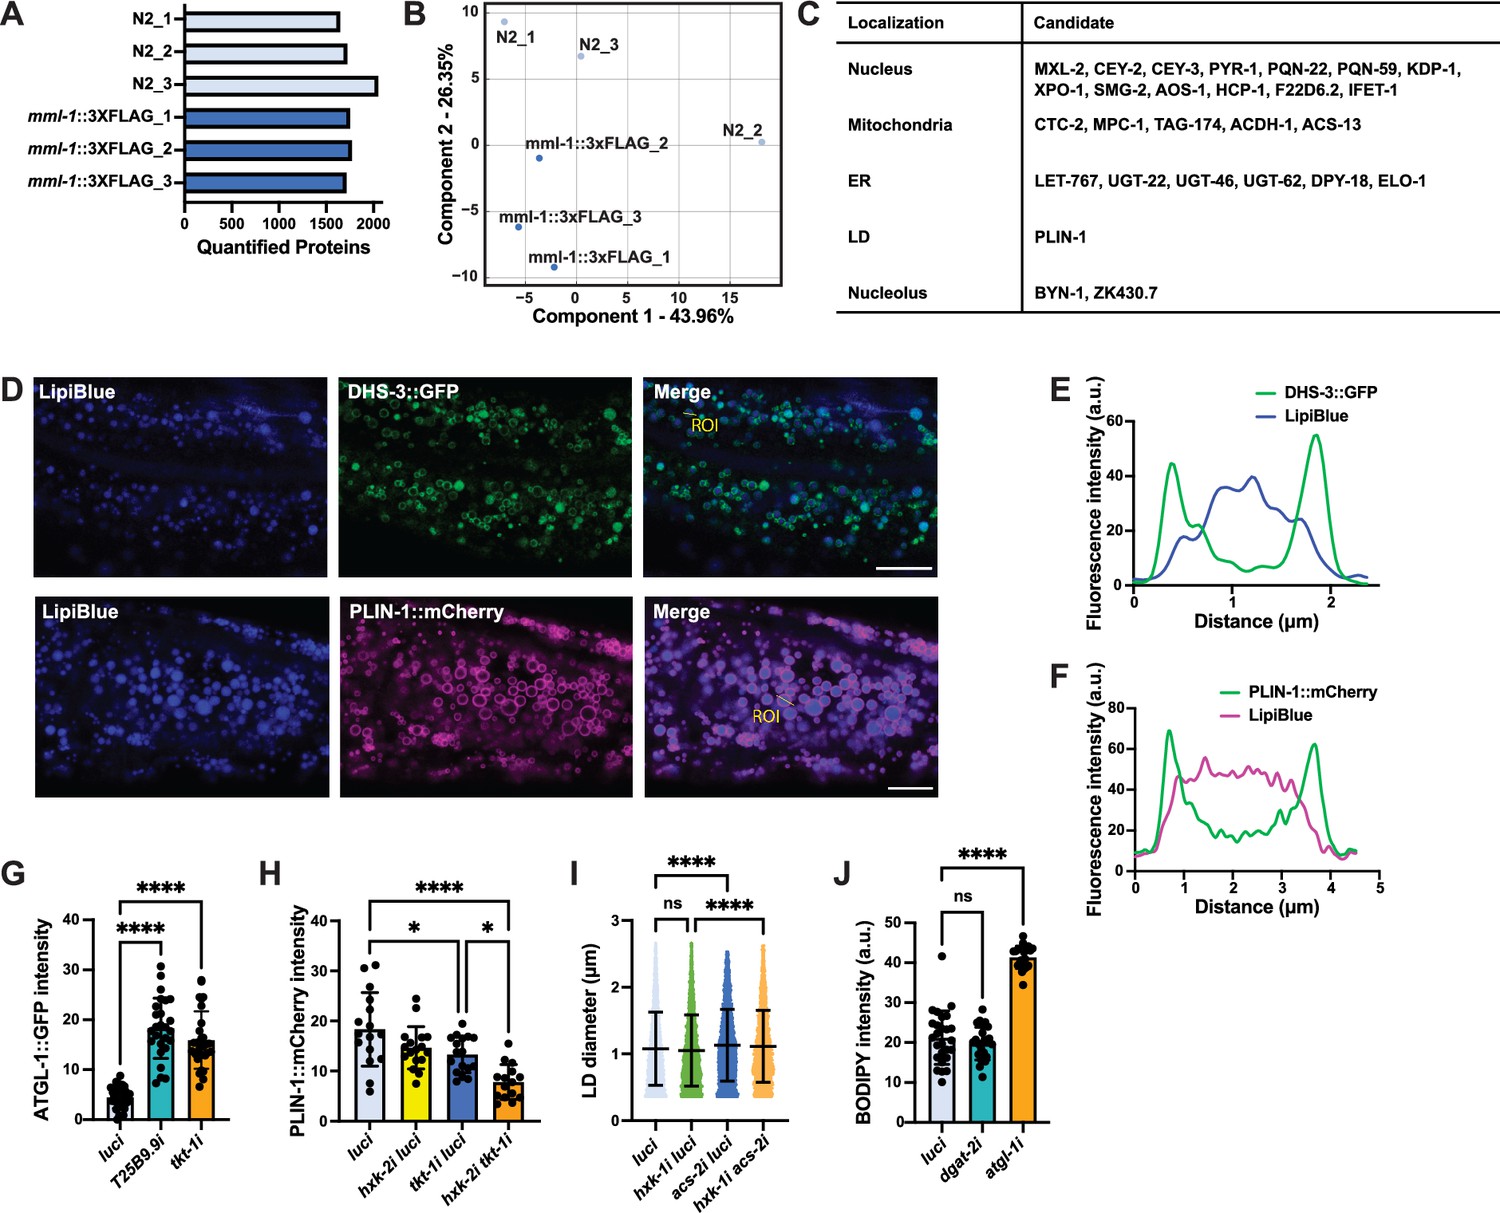
(A) Quantified proteins in each biological replicate of wild-type and mml-1::3xFLAG anti-FLAG immunoprecipitation (IP). (B) Principal component analysis (PCA) with each biological replicate of the genotypes from proteomics. (C) Top candidates co-enriched in MML-1::FLAG IP grouped by predicted subcellular localization (uniprot.org). (D) Representative images of day 1 adult worms expressing the LD proteins DHS-3::GFP and PLIN-1::mCherry reporters grown with the LD dye LipiBlue egg-on. Scale bars, 10 μm. (E, F) Intensity plots of the marked region of interest (ROI) from (D) showing DHS-3::GFP (E) and PLIN-1::mCherry (F) co-localization with LipiBlue. (G) Expression of the ATGL-1::GFP translational reporter measured on day 1 adult worms grown under T25B9.9 and tkt-1 RNA interference (RNAi) egg-on (N=3). (H) Quantification of LD reporter PLIN-1::mCherry intensity in day 1 adult worms upon knockdown of hxk-2 and tkt-1 (N=3). (I) Quantification of LD diameter in day 1 adult worms expressing the LD reporter PLIN-1::mCherry upon knockdown of hxk-1 and acs-2 (N=3). (J) Quantification of neutral lipid content in day 1 adult worms supplemented with C1-BODIPY-C12 egg-on under dgat-2 and atgl-1 knockdown (N=3). Statistical significance was calculated with a one-way ANOVA test in (G–J). (G–J) bars represent mean ± SD.
-
Figure 4—figure supplement 1—source data 1
Raw data from Figure 4—figure supplement 1.
- https://cdn.elifesciences.org/articles/89225/elife-89225-fig4-figsupp1-data1-v1.xlsx
Figure 5 with 1 supplement
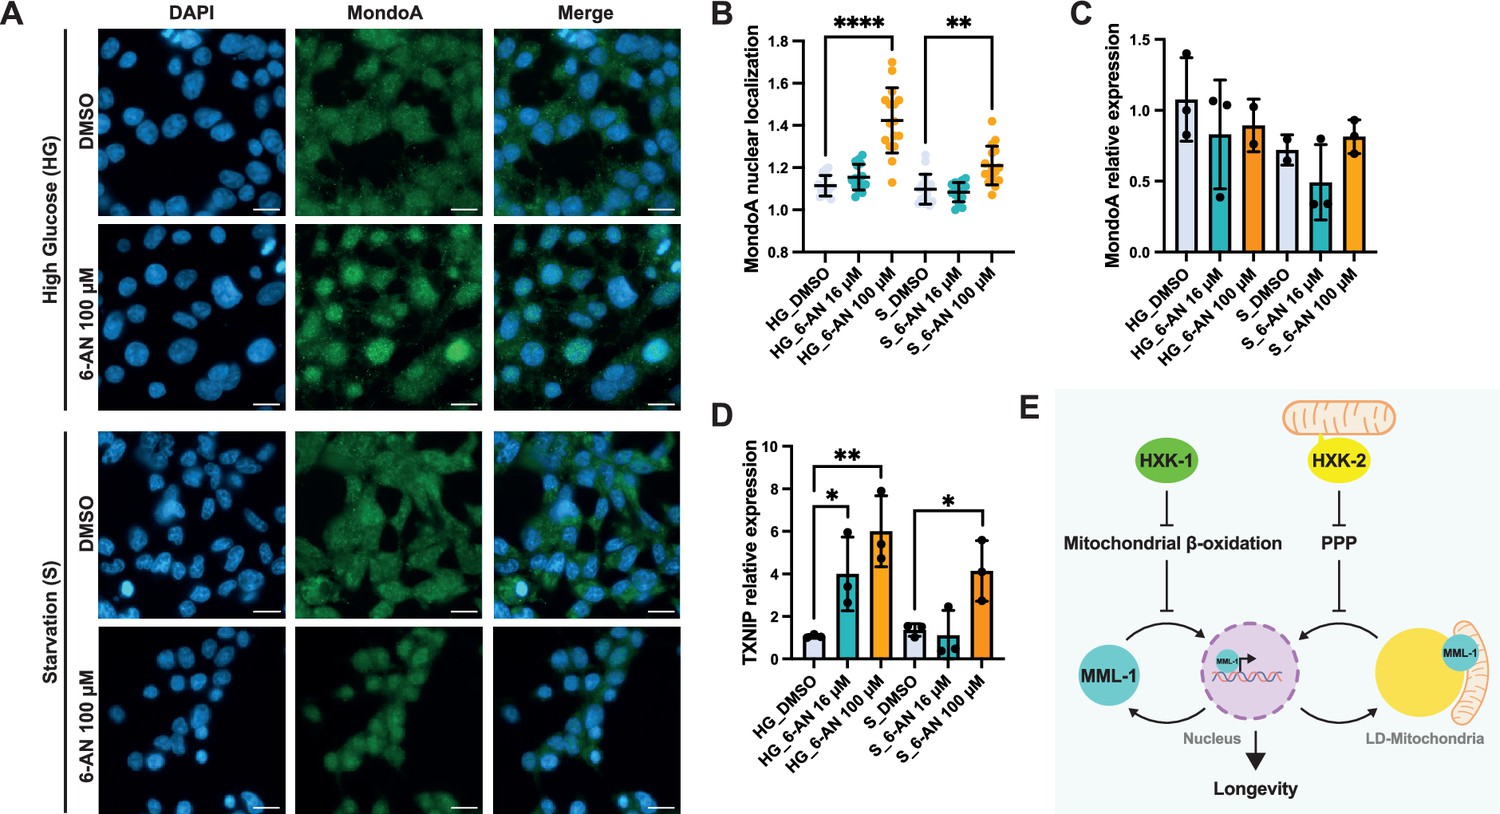
PPP regulates MondoA localization and transcriptional function in HEK293T cells.
(A) Immunofluorescence of MondoA in HEK293T cells under high glucose media (HG) and starvation (S) conditions supplemented with the PPP inhibitor 6-aminonicotinamide (6-AN) 100 μM. Scale bars, 20 μm. (B) Quantification of MondoA nuclear localization in HEK293T cells treated with 6-AN 16 and 100 μM under HG and S conditions (N=3). (C) Relative mRNA levels of MondoA in HEK293T cells treated with 6-AN 16 and 100 μM under HG and S conditions measured by qPCR (N=3). (D) Relative mRNA levels of MondoA downstream target TXNIP in HEK293T cells treated with 6-AN 16 and 100 μM under HG and S conditions measured by qPCR (N=3). Statistical significance was calculated with one-way ANOVA in B–D. (B) Bars represent mean ± SD, (C, D) bars represent mean ± SEM. (E) Working model of MML-1 regulation by hexokinases. HXK-1 and HXK-2 positively regulate MML-1 through different downstream mechanisms. On the one hand, mitochondrial β-oxidation inhibition rescues MML-1 nuclear localization upon hxk-1i. On the other hand, the PPP regulates MML-1 subcellular localization between LD mitochondria and the nucleus under hxk-2i, which is required for the lifespan extension mediated by germline loss. PPP, pentose phosphate pathway; LD, lipid droplet.
-
Figure 5—source data 1
Raw data from Figure 5.
- https://cdn.elifesciences.org/articles/89225/elife-89225-fig5-data1-v1.xlsx
Figure 5—figure supplement 1
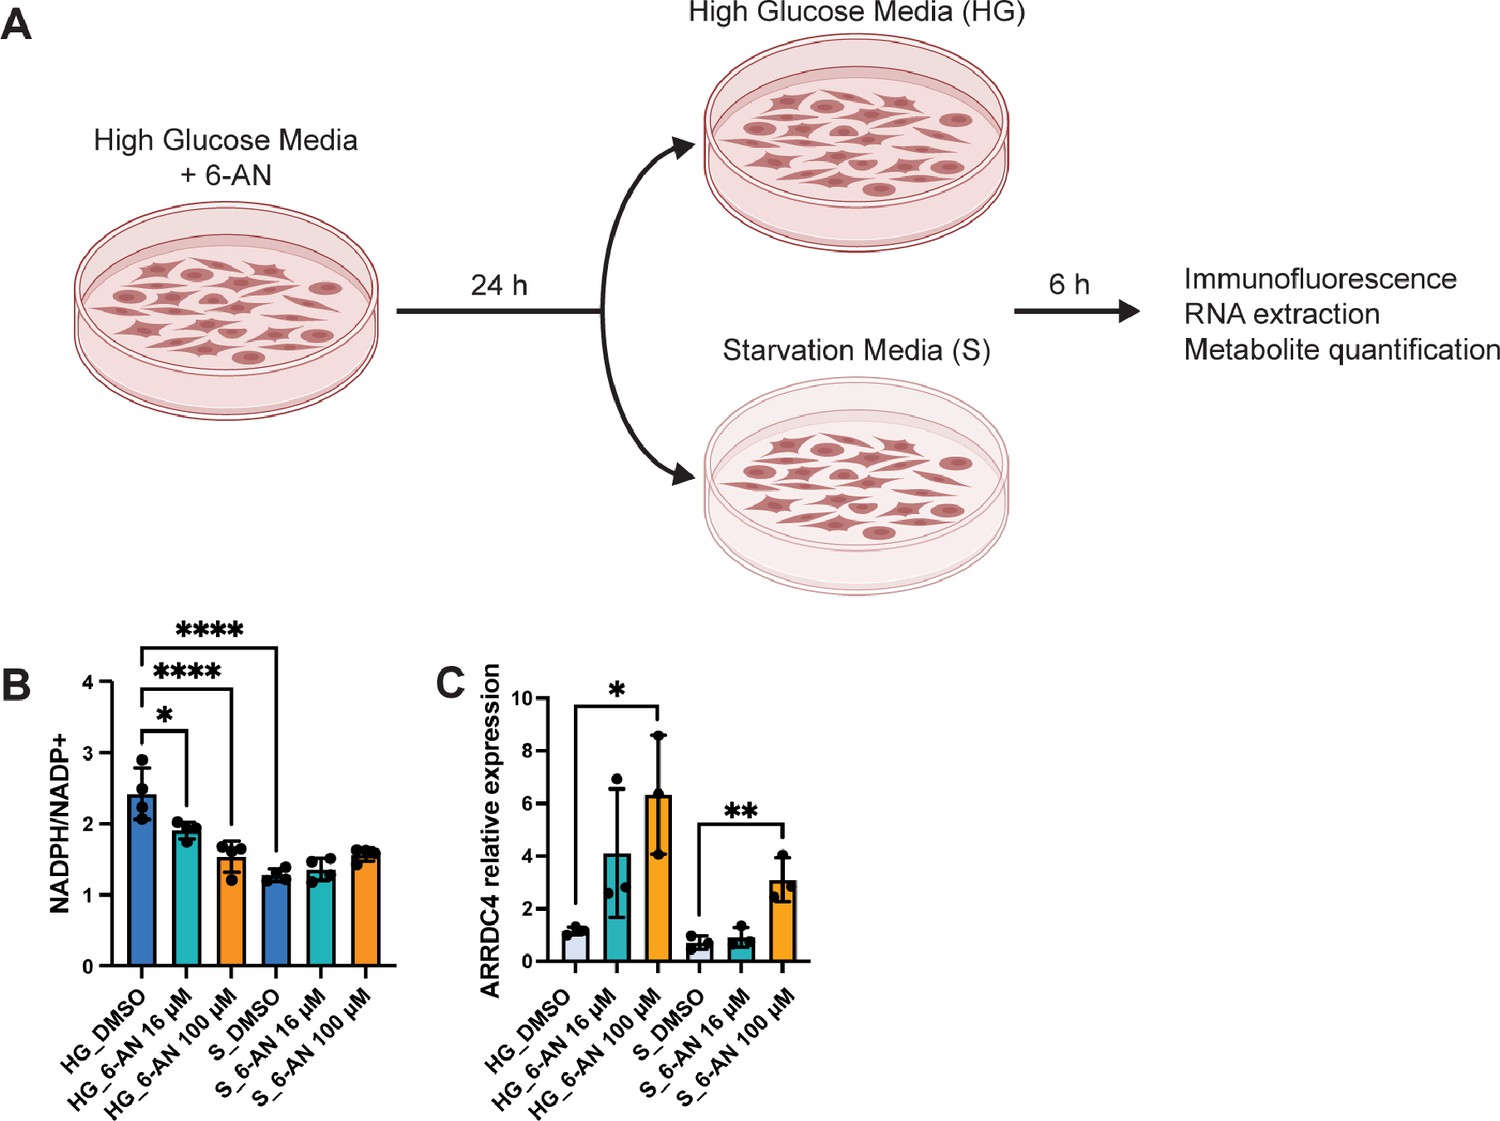
Inhibition of pentose phosphate pathway (PPP) NADPH-producing enzymes by 6‑aminonicotinamide (6-AN) induces MondoA downstream targets.
(A) Experimental design for inhibition of the PPP in HEK293T cells. Cells were grown in high glucose media (HG) supplemented with 6-AN for 24 hr, and then the media was replaced with either HG or starvation (S) media for 6 hr. Cells were collected for immunostaining, RNA extraction, and metabolite quantification. (B) Quantification of NADP+ and NADPH levels in HEK293T cells treated with 6-AN 16 and 100 μM under HG and S conditions (N=3). (C) Relative mRNA levels of MondoA downstream target ARRDC4 in HEK293T cells treated with 6-AN 16 and 100 μM under HG and S conditions measured by qPCR (N=3). Statistical significance was calculated with one-way ANOVA in (B, C). (B, C) bars represent mean ± SEM. Created with BioRender.com.
-
Figure 5—figure supplement 1—source data 1
Raw data from Figure 5—figure supplement 1.
- https://cdn.elifesciences.org/articles/89225/elife-89225-fig5-figsupp1-data1-v1.xlsx
Additional files
-
MDAR checklist
- https://cdn.elifesciences.org/articles/89225/elife-89225-mdarchecklist1-v1.pdf
-
Supplementary file 1
Supplementary tables.
- https://cdn.elifesciences.org/articles/89225/elife-89225-supp1-v1.xlsx
Download links
A two-part list of links to download the article, or parts of the article, in various formats.
Downloads (link to download the article as PDF)
Open citations (links to open the citations from this article in various online reference manager services)
Cite this article (links to download the citations from this article in formats compatible with various reference manager tools)
Hexokinase regulates Mondo-mediated longevity via the PPP and organellar dynamics
eLife 12:RP89225.
https://doi.org/10.7554/eLife.89225.4


