The genomic landscape of transposable elements in yeast hybrids is shaped by structural variation and genotype-specific modulation of transposition rate
- Institut de Biologie Intégrative et des Systèmes (IBIS), Université Laval, Canada
- Département de biochimie, microbiologie et bioinformatique, Université Laval, Canada
- Quebec Network for Research on Protein Function, Engineering, and Applications (PROTEO), Université Laval, Canada
- Université Laval Big Data Research Center (BDRC_UL), Canada
- Département de biologie, Université Laval, Canada
Figures
Figure 1
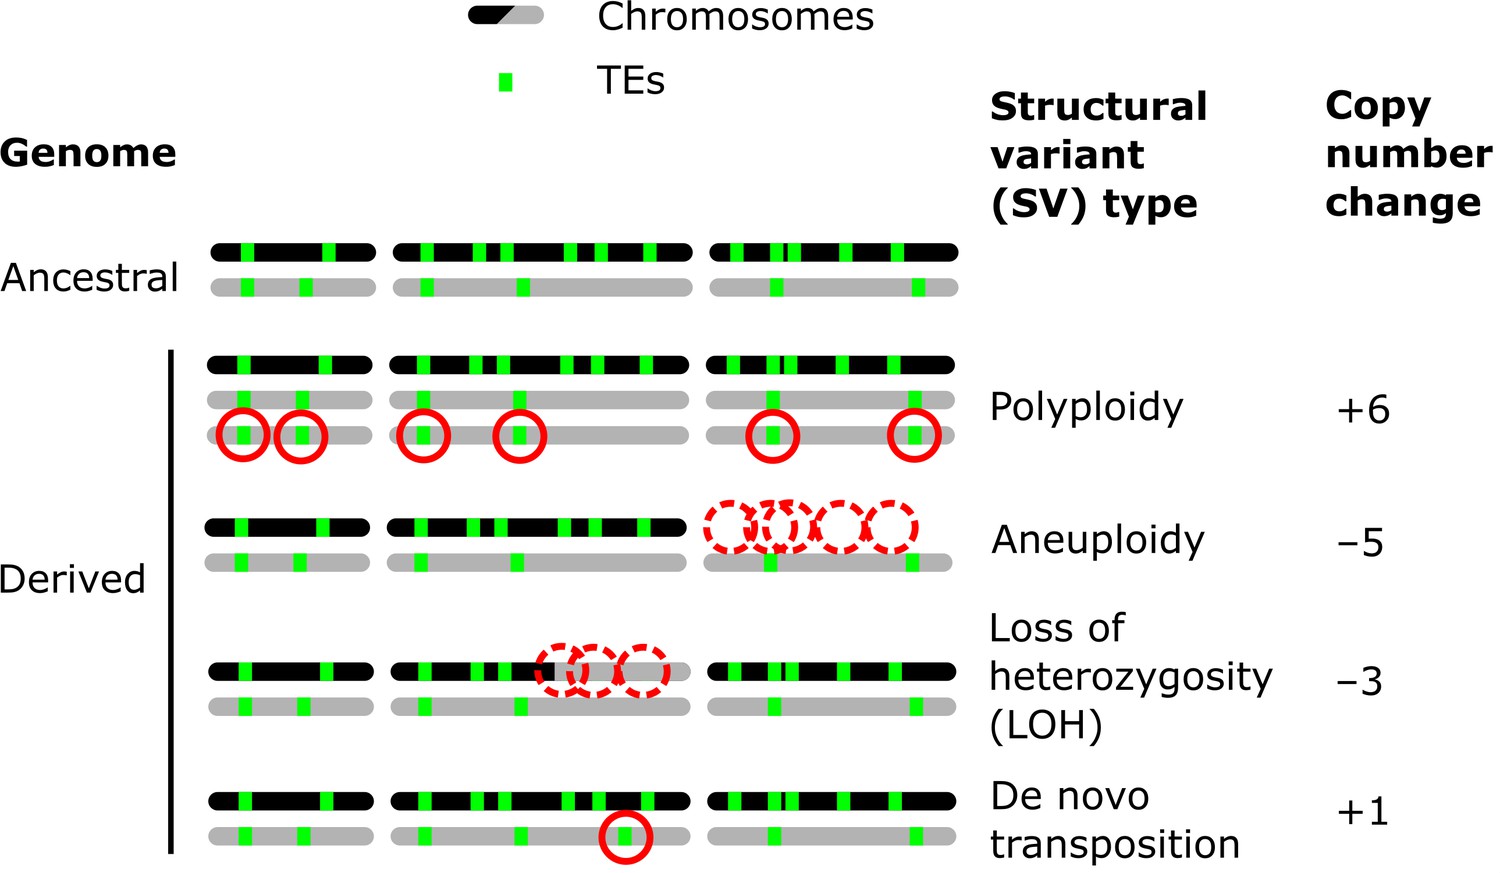
Examples of how structural variants (SVs) can impact the genomic landscapes of transposable elements (TEs) in hybrids.
An ancestral heterozygous genome is shown as an example, with two subgenomes (black and gray) harboring TEs (green boxes) in distinct copy numbers and at different insertion loci. Examples of various types of SVs are shown in derived genomes: polyploidy (gain of haploid sets of chromosomes), aneuploidy (gain or loss of whole chromosomes), loss of heterozygosity (LOH, inter-homolog conversion of chromosome segments), and de novo transposition. The corresponding changes in TE copy numbers are shown on the right.
Figure 2 with 3 supplements
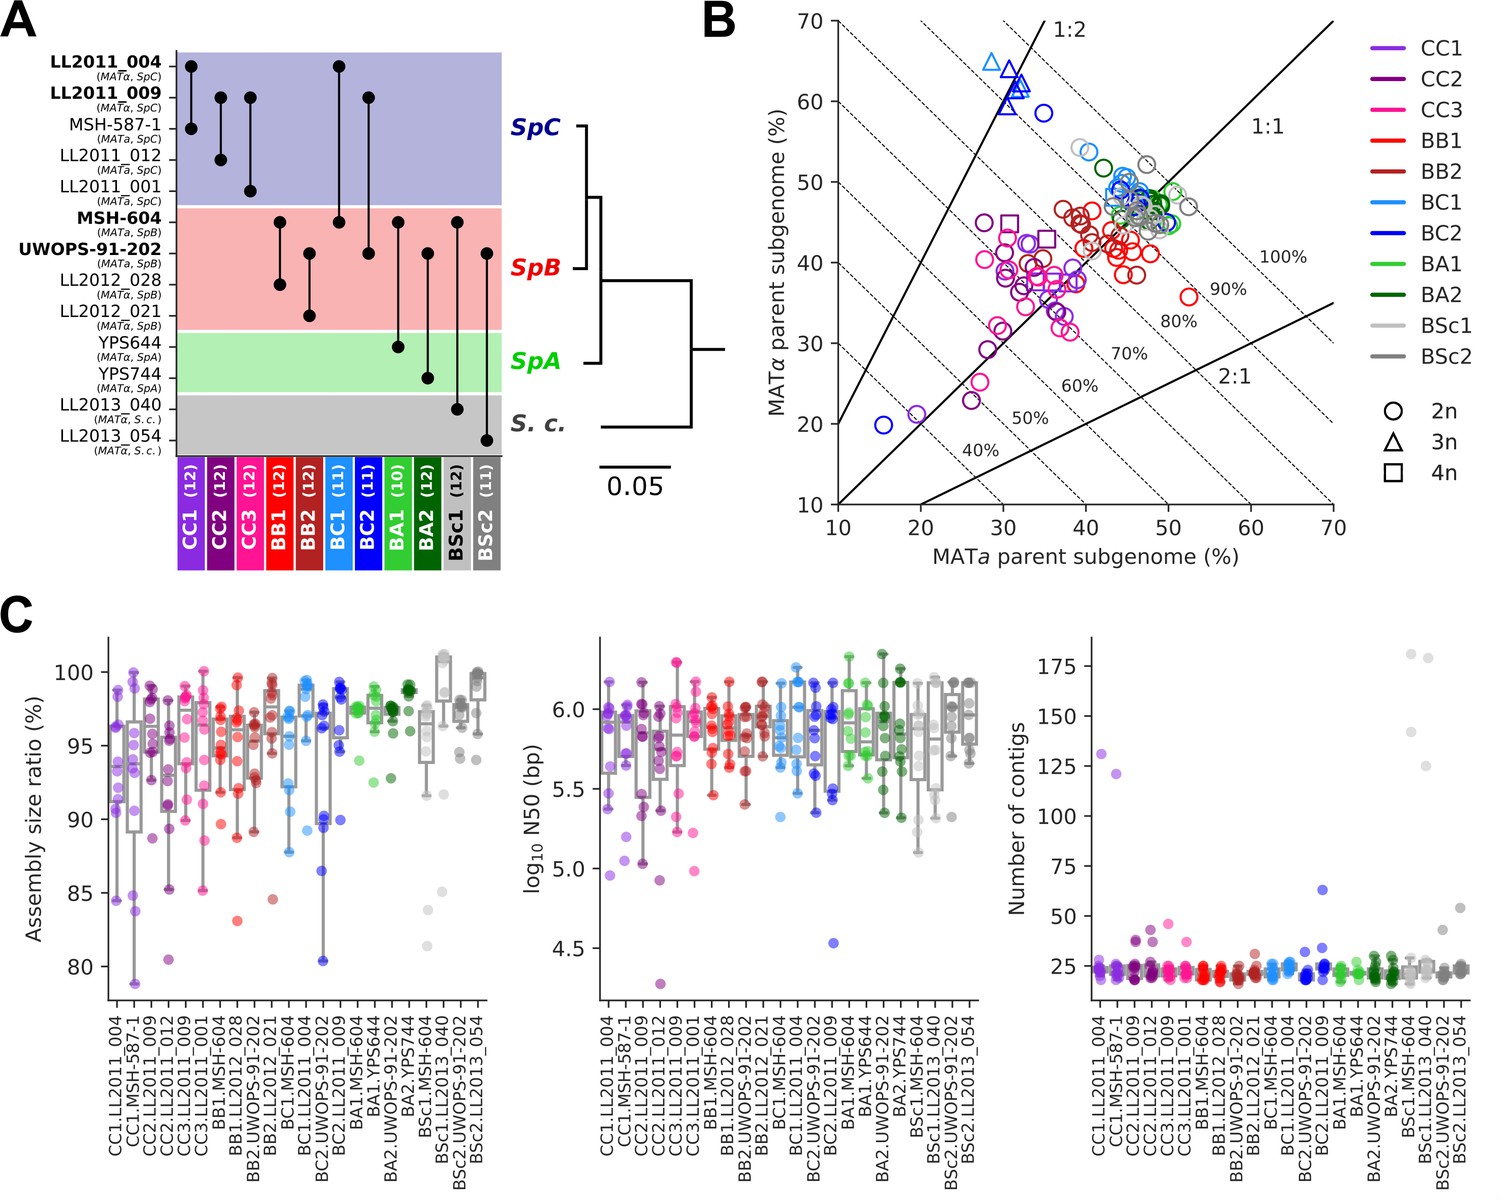
Long-read phasing and assembly yield subgenome-level representations of the genomes of hybrid yeast mutation accumulation (MA) lines.
(A) Design of the MA crosses. Haploid derivatives of wild isolates used as parental strains for the MA crosses are shown on the Y-axis. Strains in bold are shared by multiple crosses. MA crosses are shown on the X-axis (left to right, from the least to the most divergent), with the number of lines randomly sampled for long-read sequencing shown in parentheses. The phylogenetic tree displays the evolutionary relatedness between wild populations of S. paradoxus and the sister species S. cerevisiae, based on genome-wide nucleotide variants (scale bar: substitutions per site) (Hénault et al., 2022). (B) Summary of the classification of long reads in two parental subgenomes. For each MA line library, the percentages of sequenced bases classified as the MATa and MATα parental subgenomes are shown on the X and Y axes, respectively. Dotted lines indicate global classification rates. Full lines indicate expected subgenome classification ratios of 1:1 for diploid (circles) or tetraploid (squares) lines, and 2:1 or 1:2 for triploid (triangles) lines. The ploidy level of each line was previously measured by DNA staining and flow cytometry (Charron et al., 2019; Marsit et al., 2021). (C) Summary statistics of the de novo subgenome-level assemblies of the MA lines. Assembly size ratio refers to the ratio of subgenome assembly size to the corresponding parental assembly size.
Figure 2—figure supplement 1
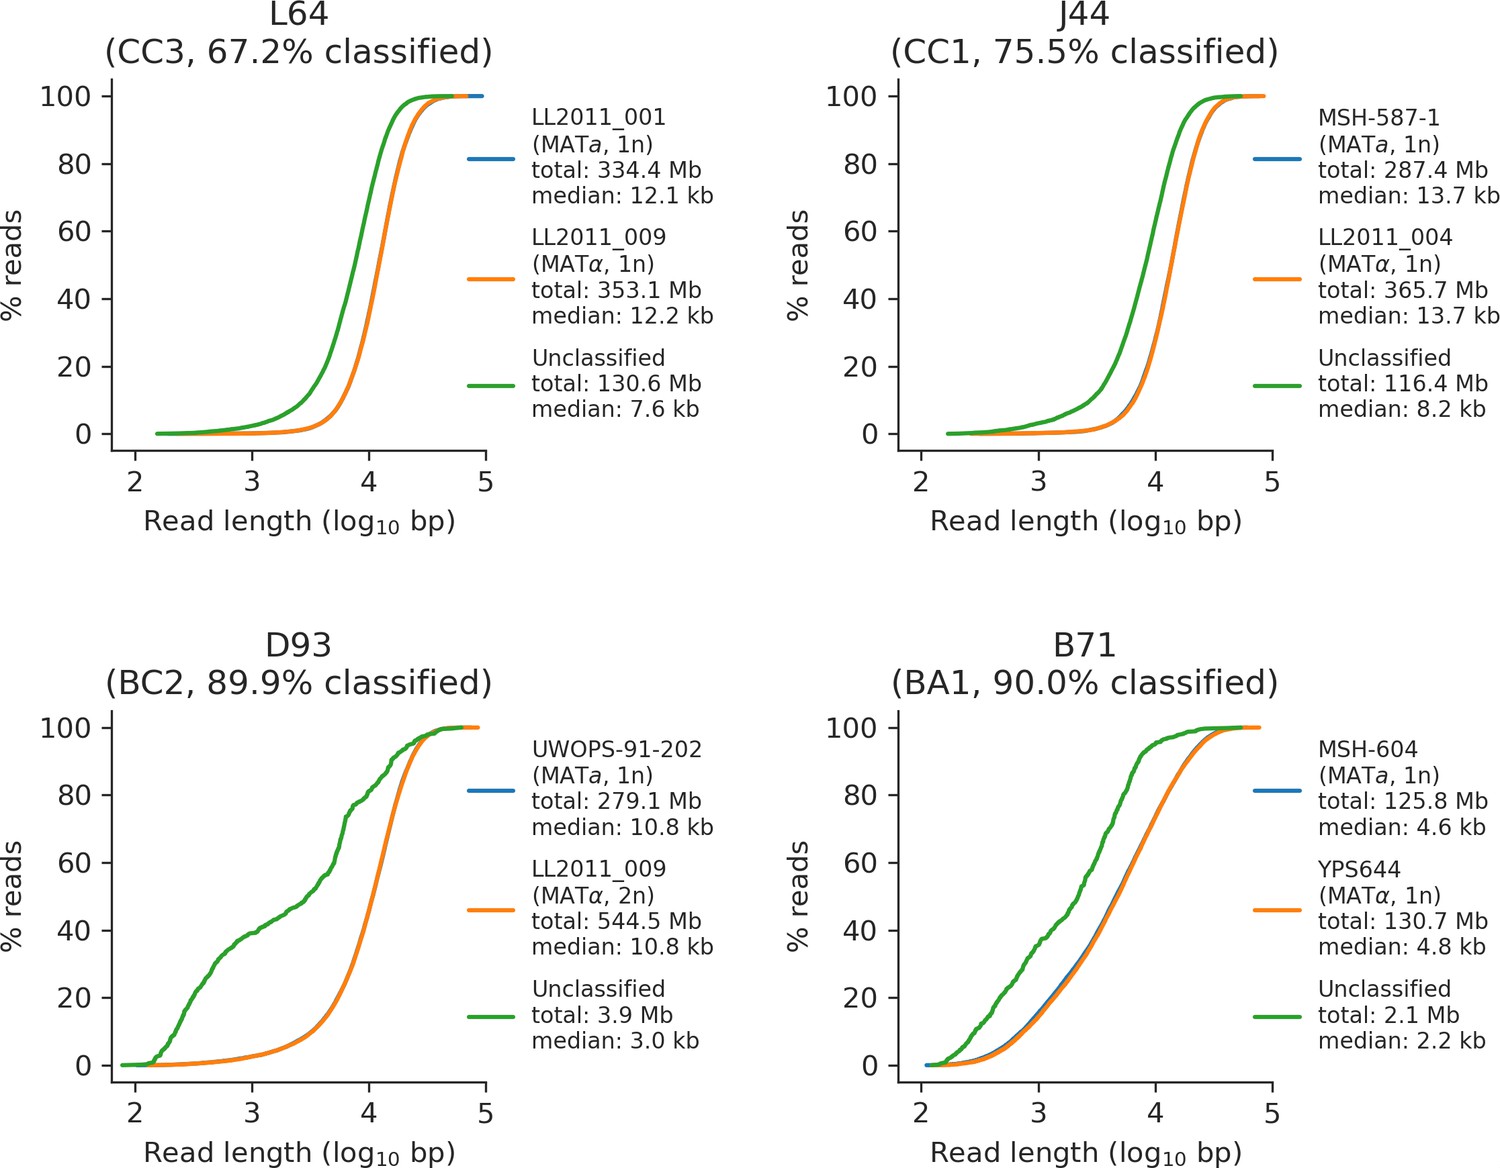
Read length distributions of classified and unclassified reads for a representative sample of four mutation accumulation (MA) lines long-read libraries.
Cumulative length distributions for reads classified as the MATa parental subgenome, reads classified as the MATα parental subgenome, and unclassified reads are shown in blue, orange, and green, respectively. Subgenome ploidy (if applicable), total bases, and median read length are shown for each category.
Figure 2—figure supplement 2
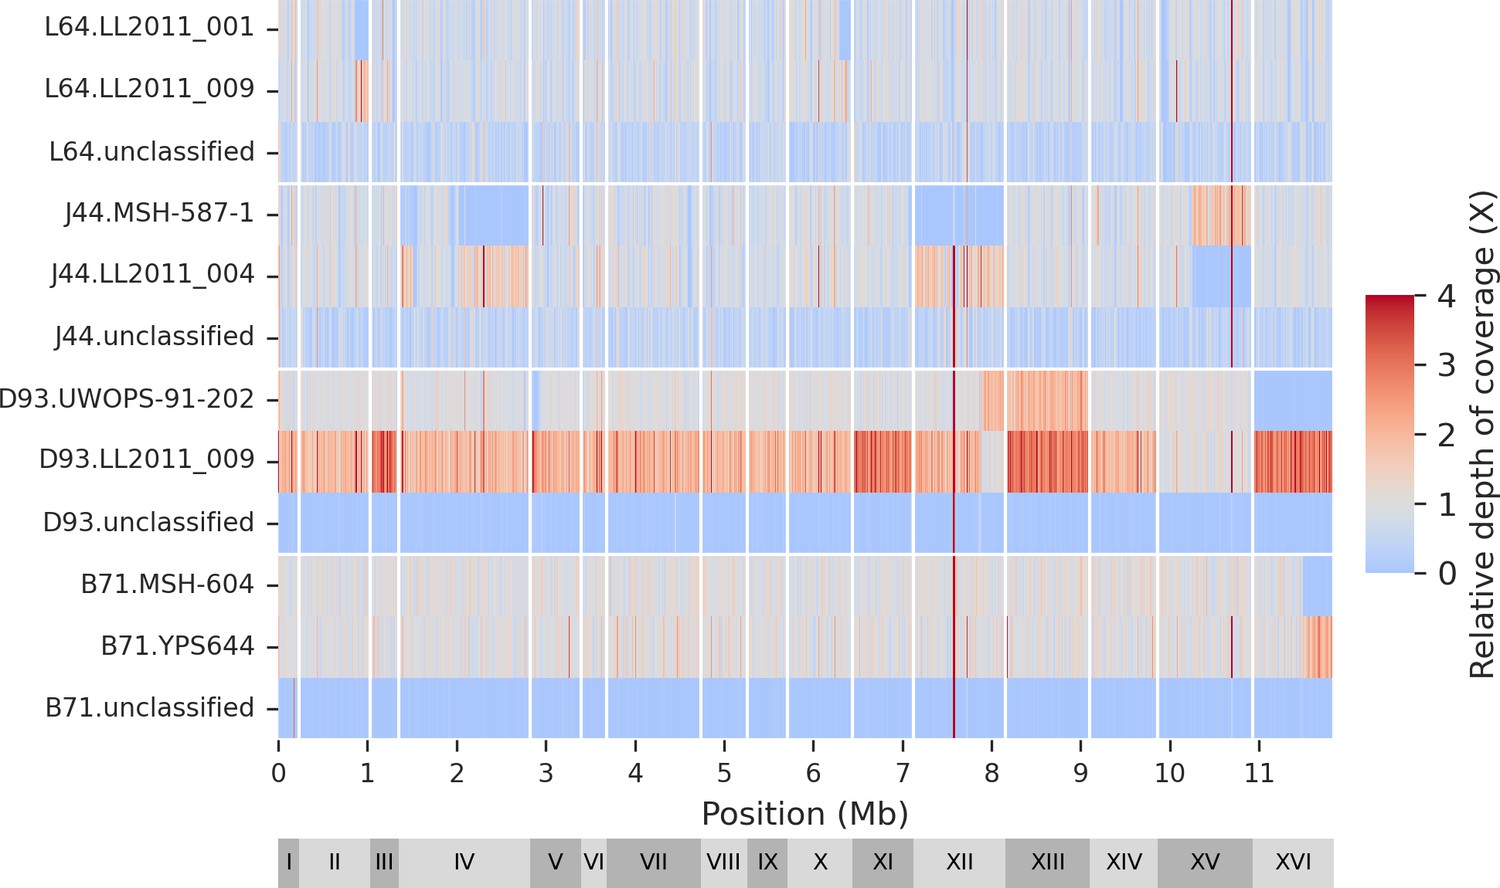
Genomic distribution of classified and unclassified reads.
The mutation accumulation (MA) lines long-read libraries are the same as shown in Figure 2—figure supplement 1.
Figure 2—figure supplement 3
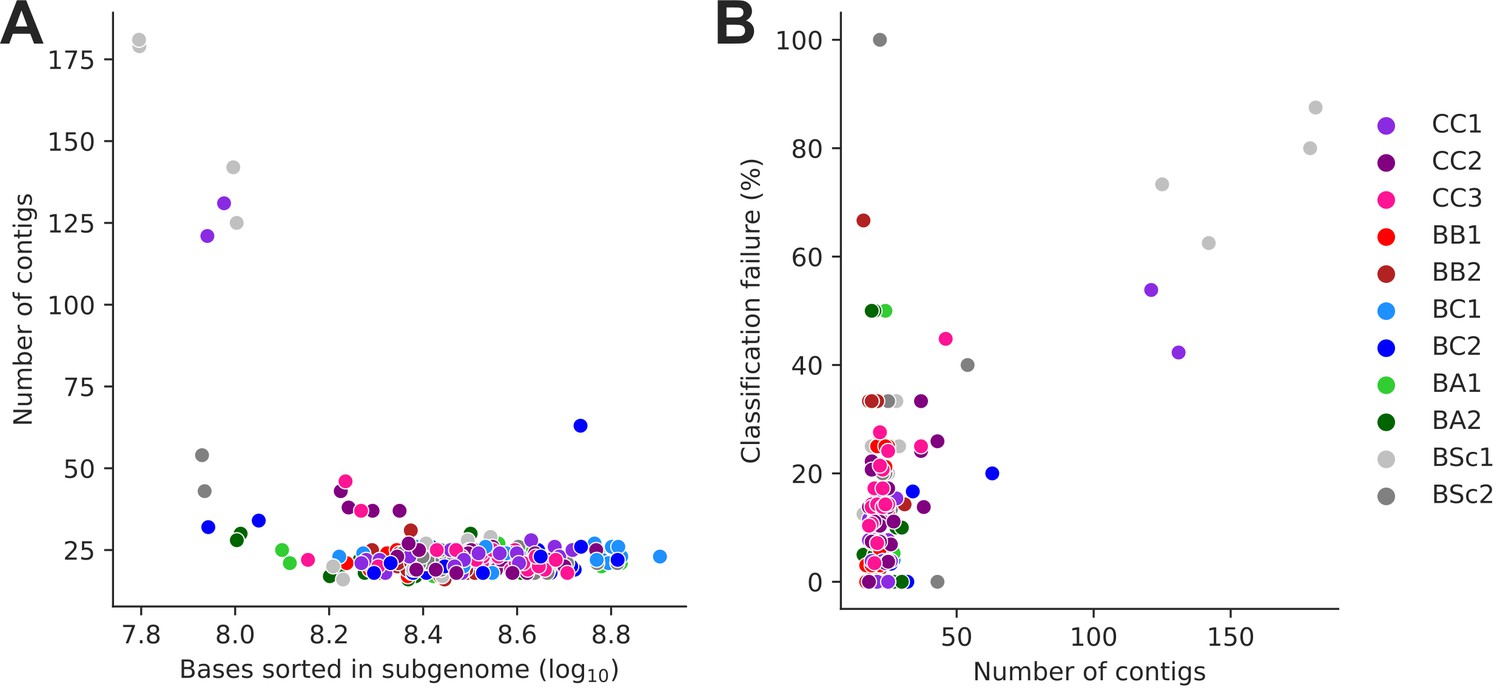
Subgenome-level assemblies of low contiguity.
(A) Assembly contiguity (number of contigs) is largely determined by the size of the corresponding sorted long-read library. (B) Assembly contiguity largely determines Ty loci classification failure rate.
Figure 3 with 4 supplements
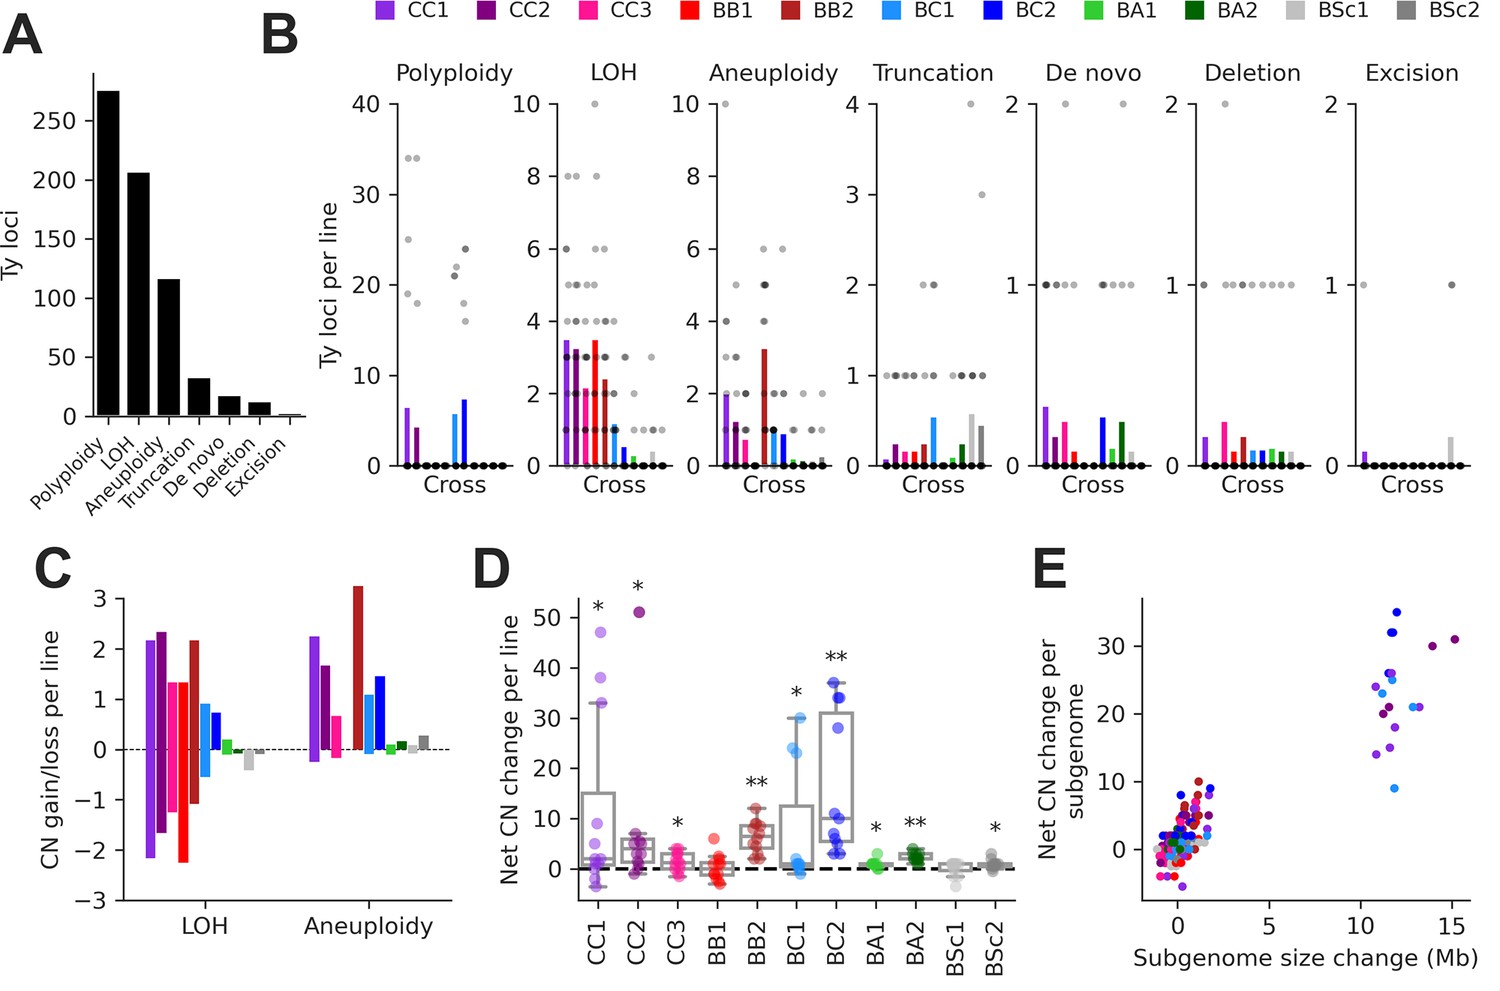
Structural variant (SV) types have unequal contributions to changes in the genomic distribution of Ty elements after evolution by mutation accumulation (MA).
(A) Number of Ty loci affected by each SV type. (B) Number of Ty loci affected by SVs per line for each cross. Dots represent individual MA lines, and bars show the average per line. Polyploidy refers to increased ploidy level to triploidy or tetraploidy from the expected diploid initial state. Loss of heterozygosity (LOH) refers to the conversion of large chromosome segments (interstitial or terminal) from one parental genotype to the other. Aneuploidy refers to gains or losses of whole chromosomes. Truncation refers to partial deletion of a full-length Ty copy. De novo refers to the presence of a new full-length Ty copy not found in the corresponding parental background or any other MA line. Deletion refers to the local deletion of a full-length Ty copy. Excision refers to the replacement of a full-length Ty copy with a matching solo long terminal repeat (LTR), consistent with intra-element LTR-LTR recombination. (C) Average gain and loss of Ty copy number (CN) per line for each cross, for SV classes that can have bidirectional effects on Ty CN. (D) Distributions of net Ty CN change for individual MA lines. Symbols indicate false discovery rate (FDR)-corrected p-values for Wilcoxon signed-rank tests for deviations from zero (*p≤0.05, **p≤0.01). (E) Net Ty copy number change for individual MA line subgenomes as a function of subgenome size change.
Figure 3—figure supplement 1
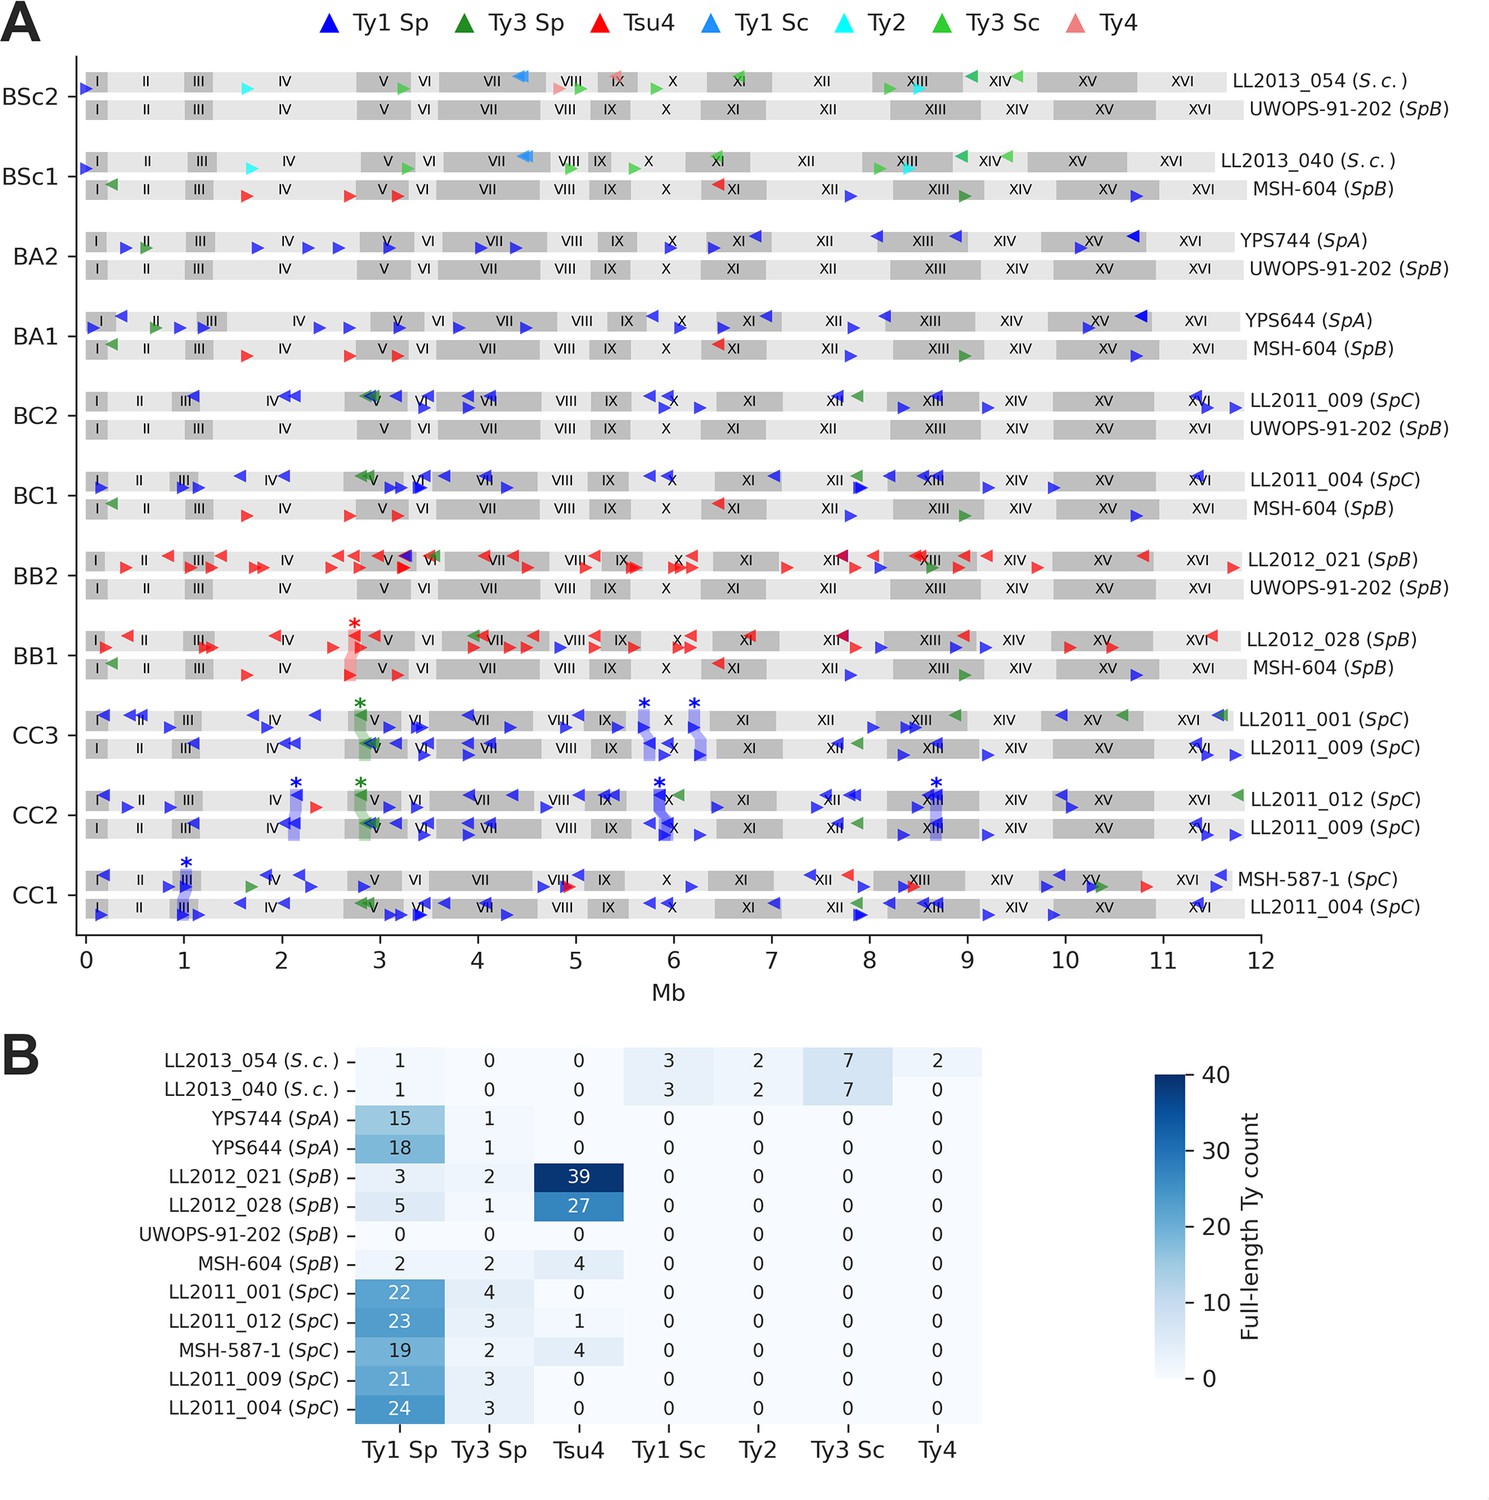
Ty element annotations in the parental genomes.
(A) Genome maps show the annotations of full-length Ty elements for the two parental genomes of each cross. Triangle orientation indicates whether the annotation is on the plus (right pointing) or minus (left pointing) chromosome strand. Shaded areas labeled with stars highlight pairs of parental annotations that were inferred to be orthologous based on whole-genome alignments. Some orthologous pairs are also linked to inversions or duplications. (B) Count of full-length annotations for each genome.
Figure 3—figure supplement 2
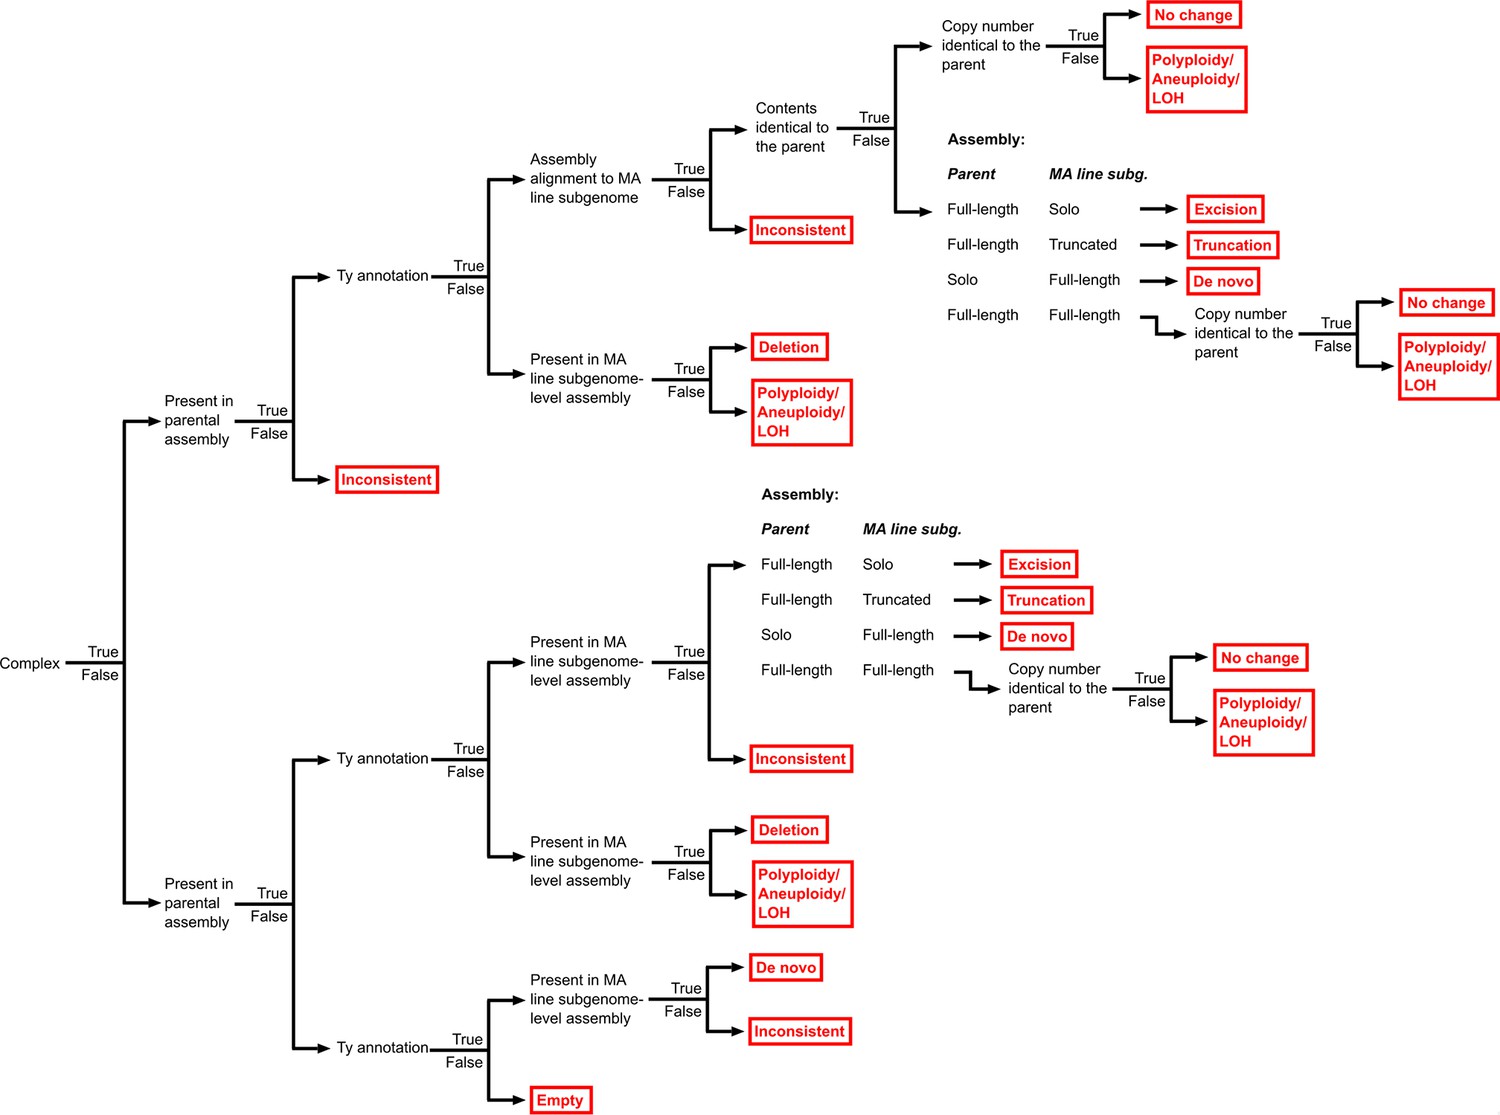
Hierarchy of binary rules used for the classification of Ty loci into structural variant (SV) types.
The classification outcomes, including the different SV types, are shown in red.
Figure 3—figure supplement 3
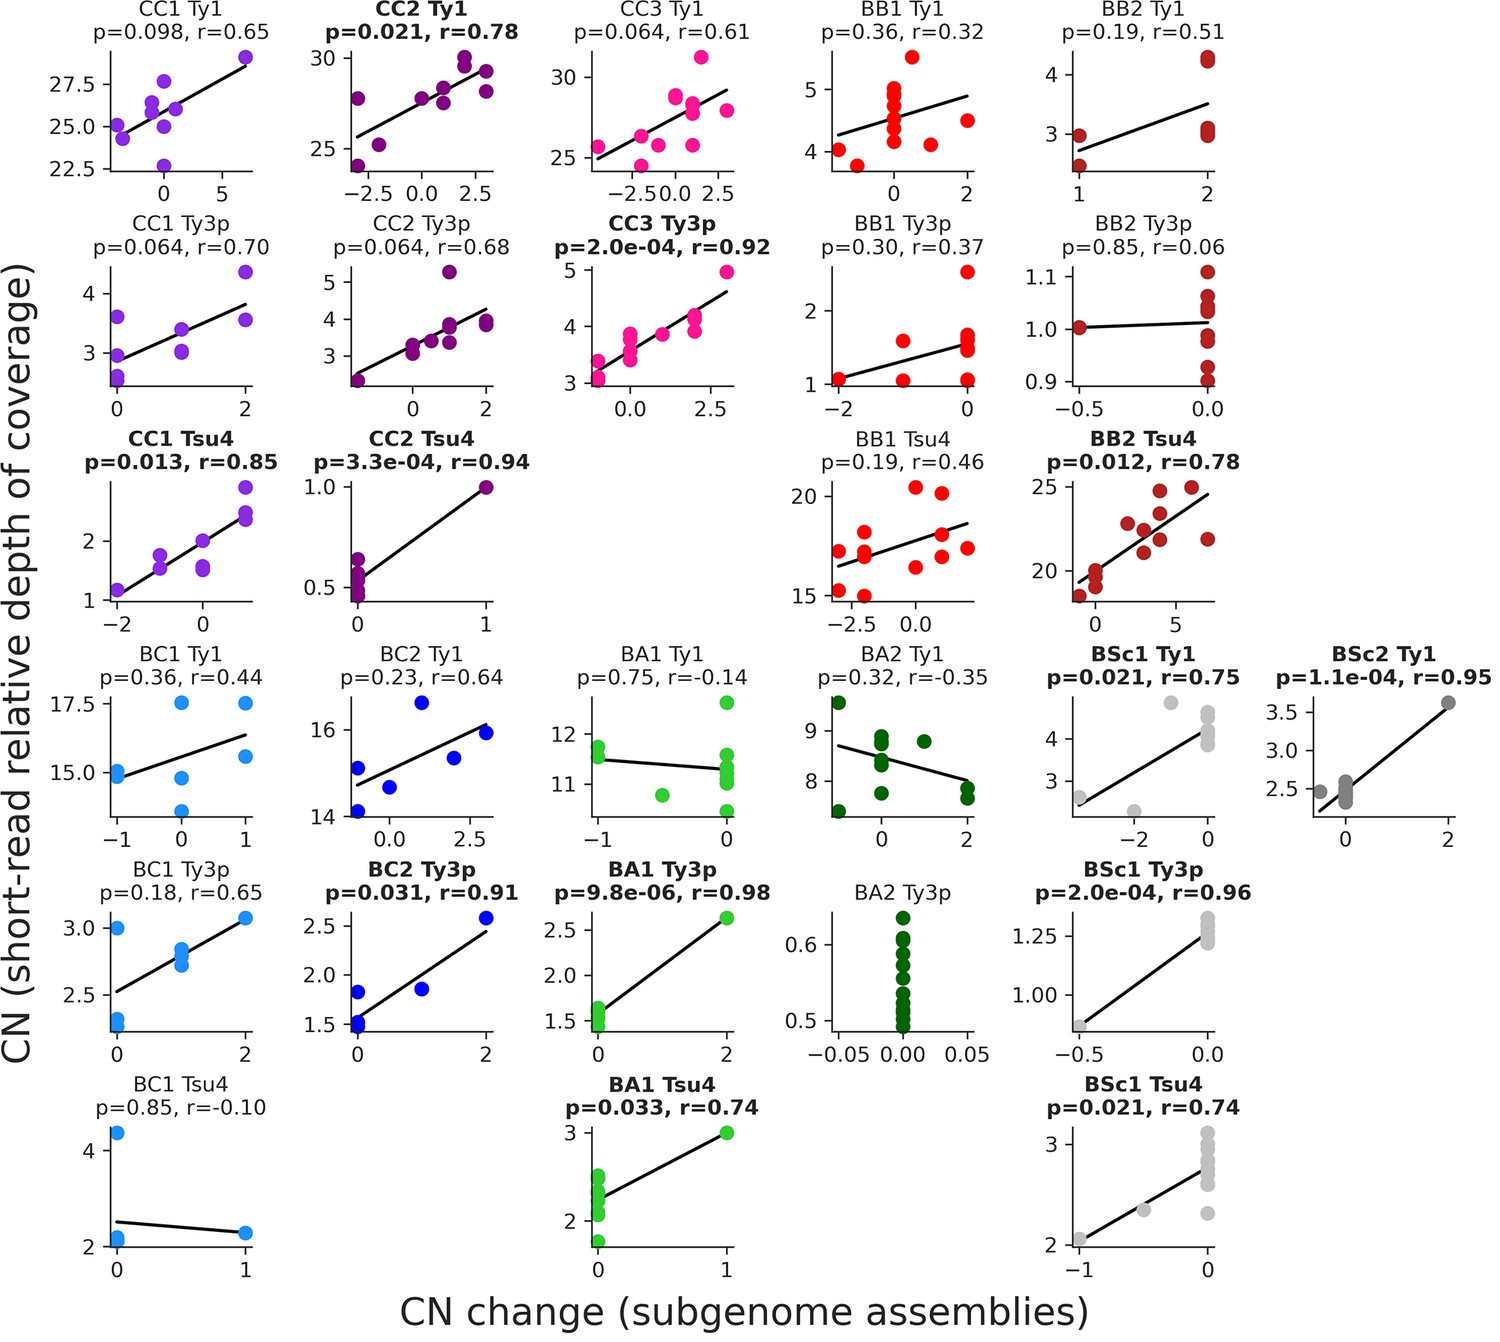
Correlations between the estimations of full-length Ty copy numbers in the mutation accumulation (MA) lines genomes.
Copy number changes from the annotation of subgenome assemblies (this study) are shown on the X-axis, while copy numbers estimated from relative depth of coverage of short-read libraries after evolution by MA (Hénault et al., 2020) are shown on the Y-axis. Where applicable, false discovery rate (FDR)-corrected p-values and Pearson correlation coefficients are shown, with significant correlation in bold.
Figure 3—figure supplement 4
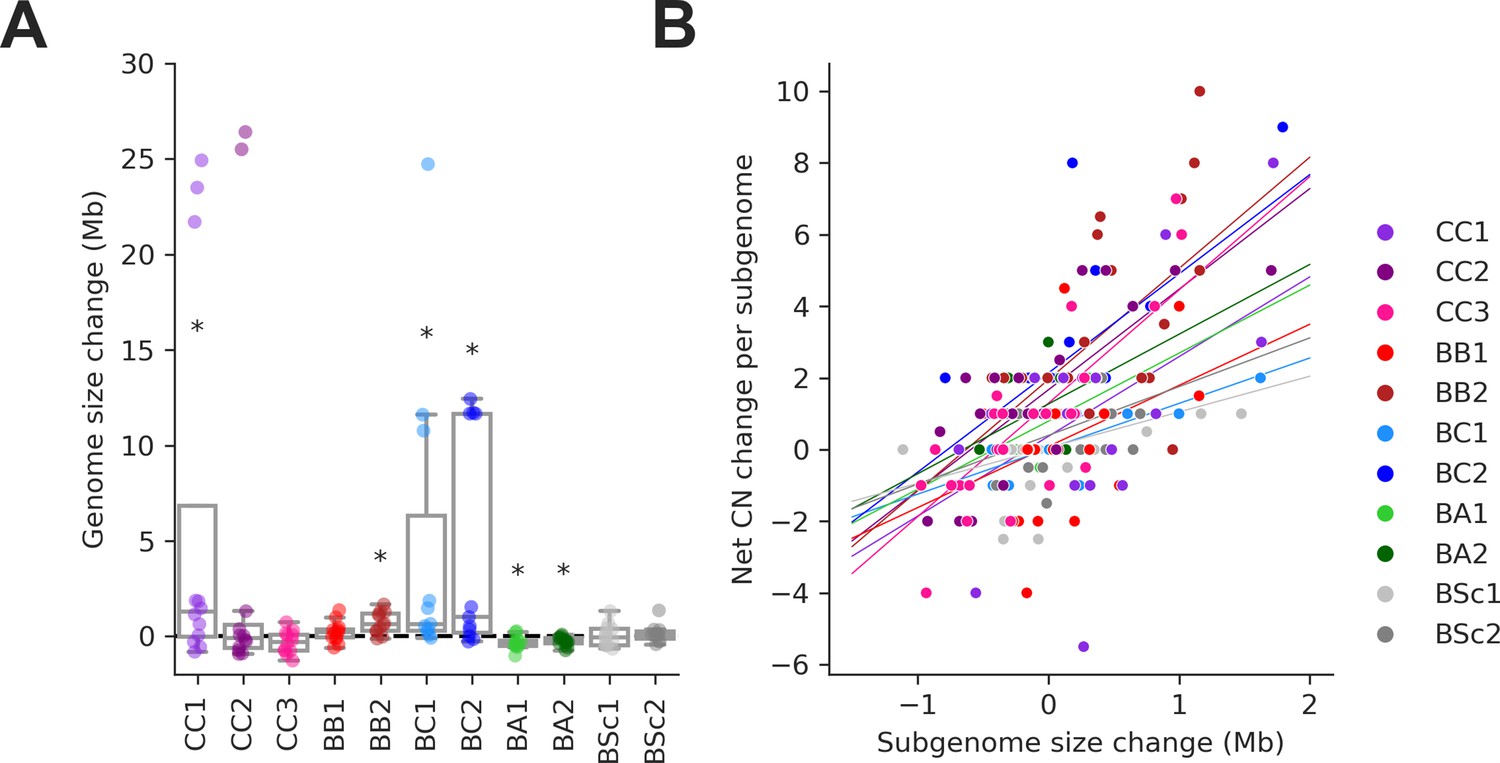
Changes in Ty copy number (CN) are correlated with genome expansion.
(A) Distributions of genome size change for individual mutation accumulation (MA) lines. Symbols indicate false discovery rate (FDR)-corrected p-values for Wilcoxon signed-rank tests for deviations from zero (*p≤0.05, **p≤0.01). (B) Correlations between net Ty CN change per MA line subgenome and subgenome size change. Background lines represent the fit of a linear mixed effect model including random intercepts and slopes for each MA cross.
Figure 4 with 4 supplements
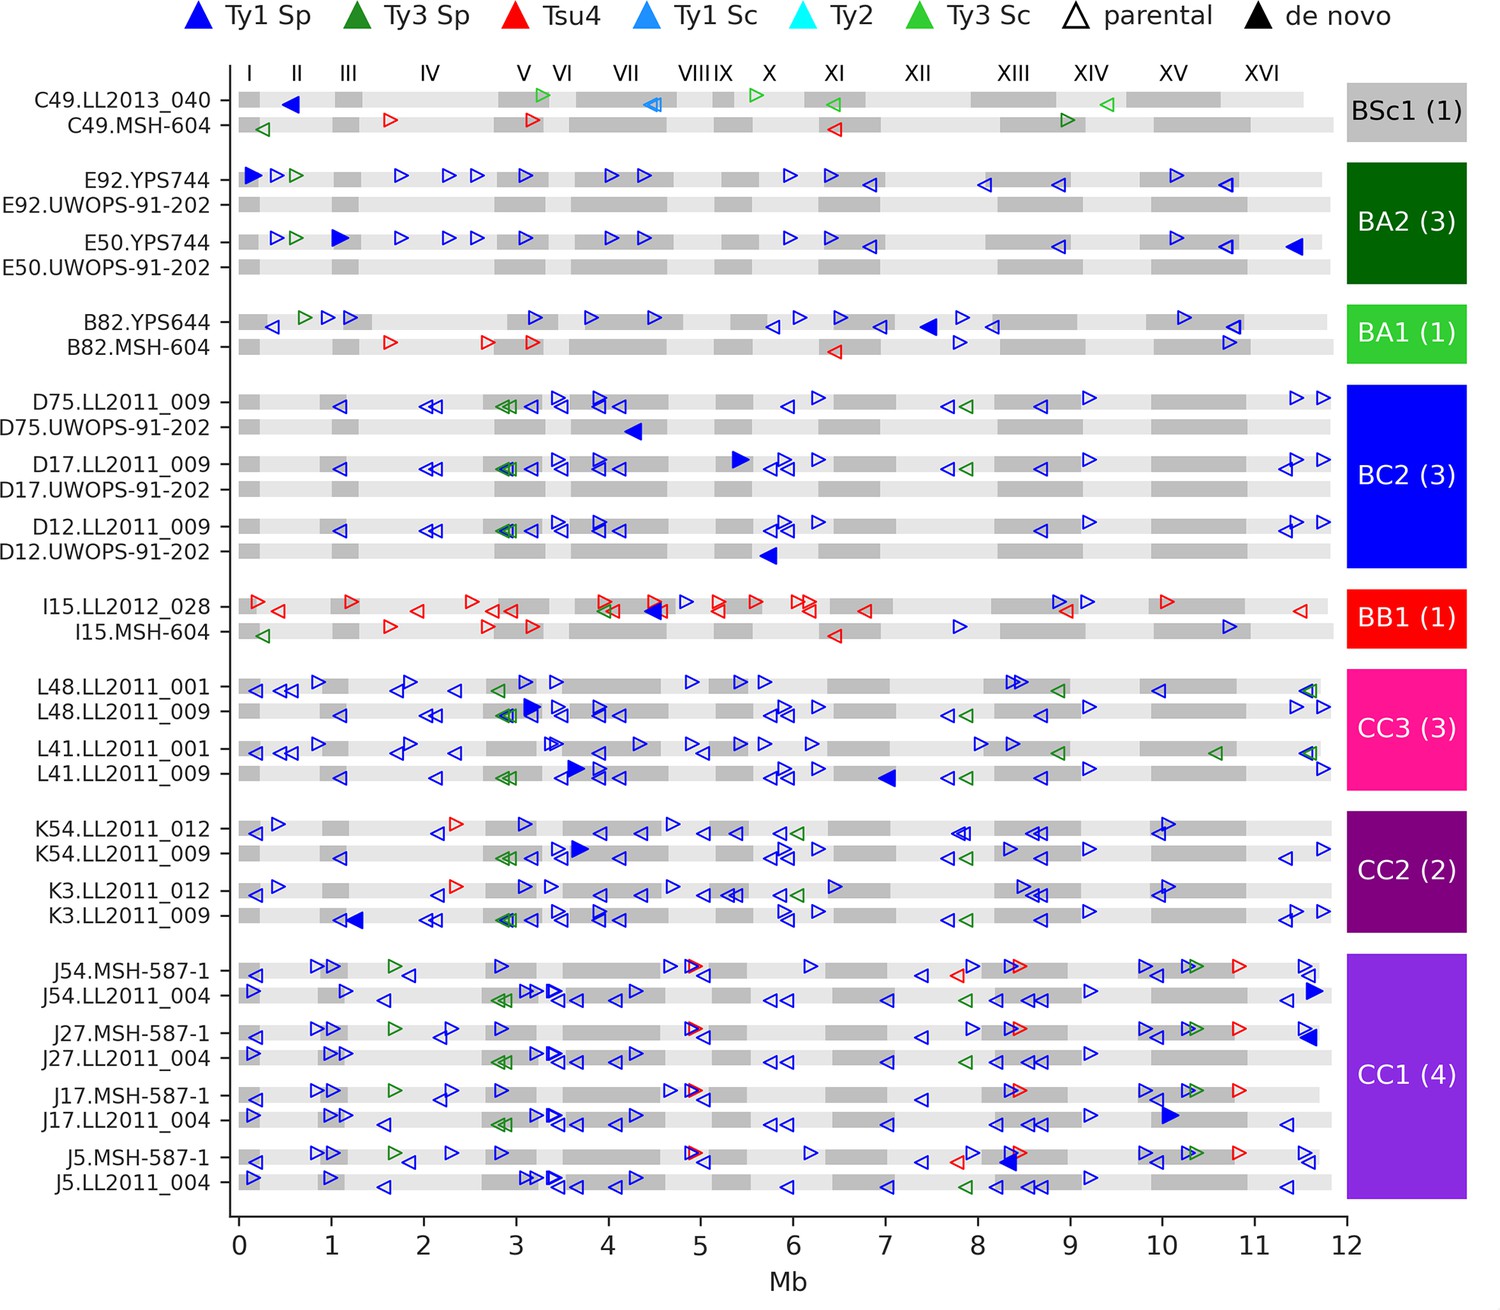
De novo retrotransposition events are rare in the mutation accumulation (MA) lines.
Genome maps show the full-length Ty annotations from the subgenome assemblies of the MA lines with de novo insertions. Gray boxes represent chromosomes, which are numbered at the figure top. Empty triangles represent the parental annotations present at a copy number (CN) ≥1. Full triangles correspond to the confident de novo retrotransposition events. Triangle orientation indicates whether the annotation is on the plus (right pointing) or minus (left pointing) chromosome strand. The cross corresponding to each MA line is labeled at the right, with the total count of de novo retrotransposition events shown between parentheses. The average retrotransposition rates estimated from the de novo insertions (per line per generation per element) are the following: CC1, 1.0 × 10⁻⁵; CC2, 4.9 × 10⁻⁶; CC3, 7.6 × 10⁻⁶; BB1, 1.5 × 10⁻⁵; BC2, 1.7 × 10⁻⁵; BA1, 6.5 × 10⁻⁶; BA2, 2.2 × 10⁻⁵; BSc1, 3.6 × 10⁻⁵.
Figure 4—figure supplement 1
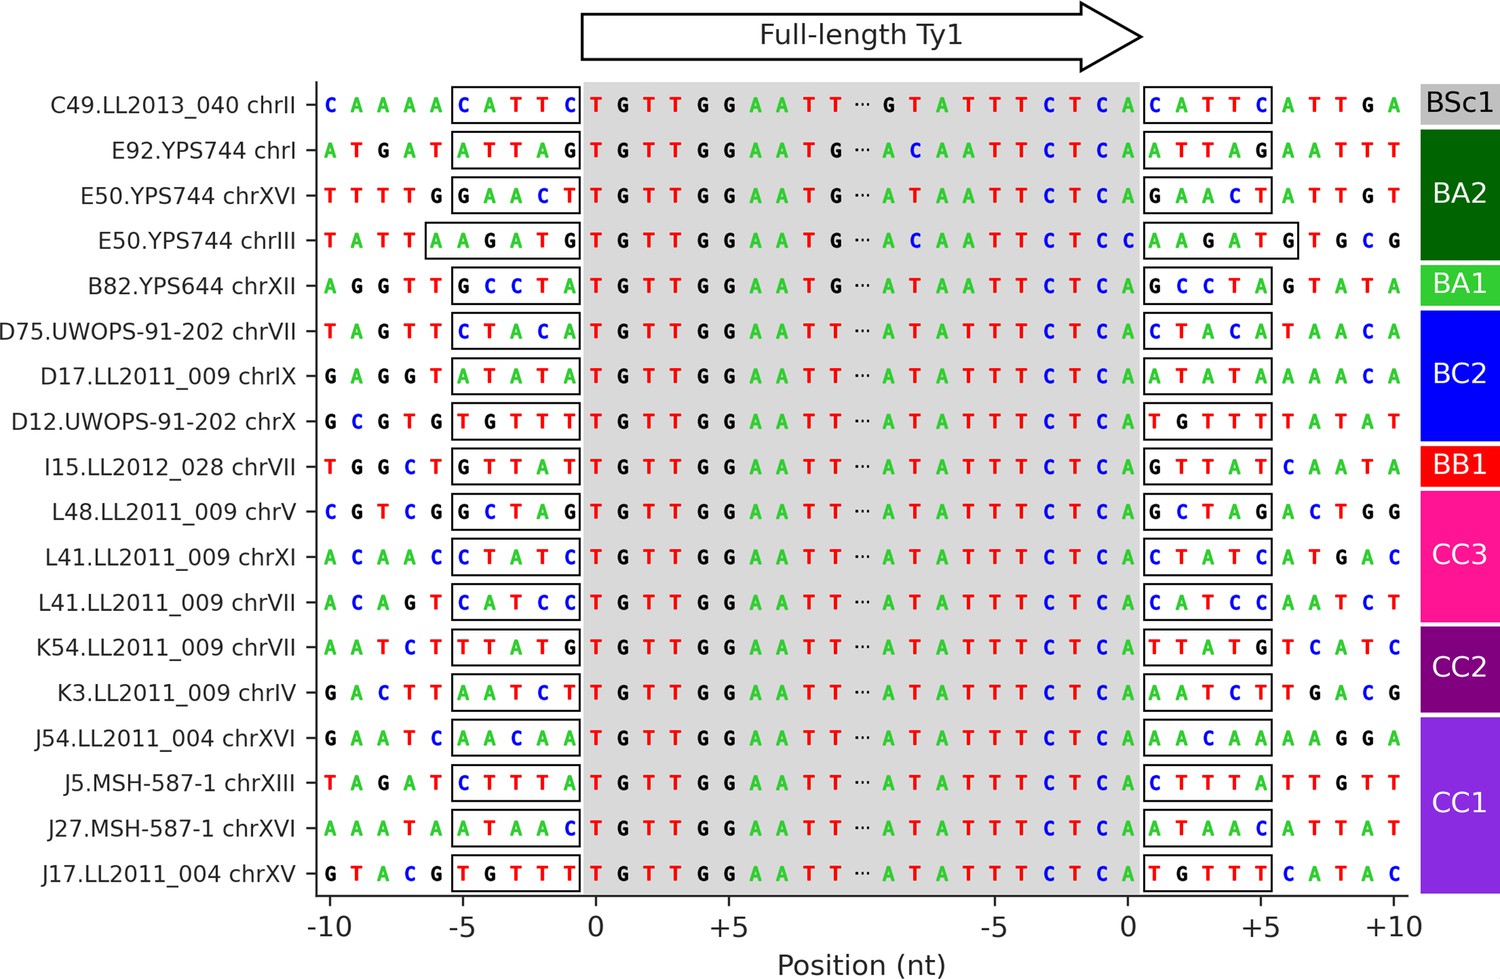
Target site duplication (TSD) sequences of the 18 confident Ty1 de novo retrotransposition events.
The gray shaded area corresponds to the 5′ to 3′ sequence of full-length Ty1 elements. Flanking sequences correspond to the 10 nucleotides immediately upstream and downstream of the insertion site. Identical 5′ and 3′ TSDs are highlighted by frames.
Figure 4—figure supplement 2
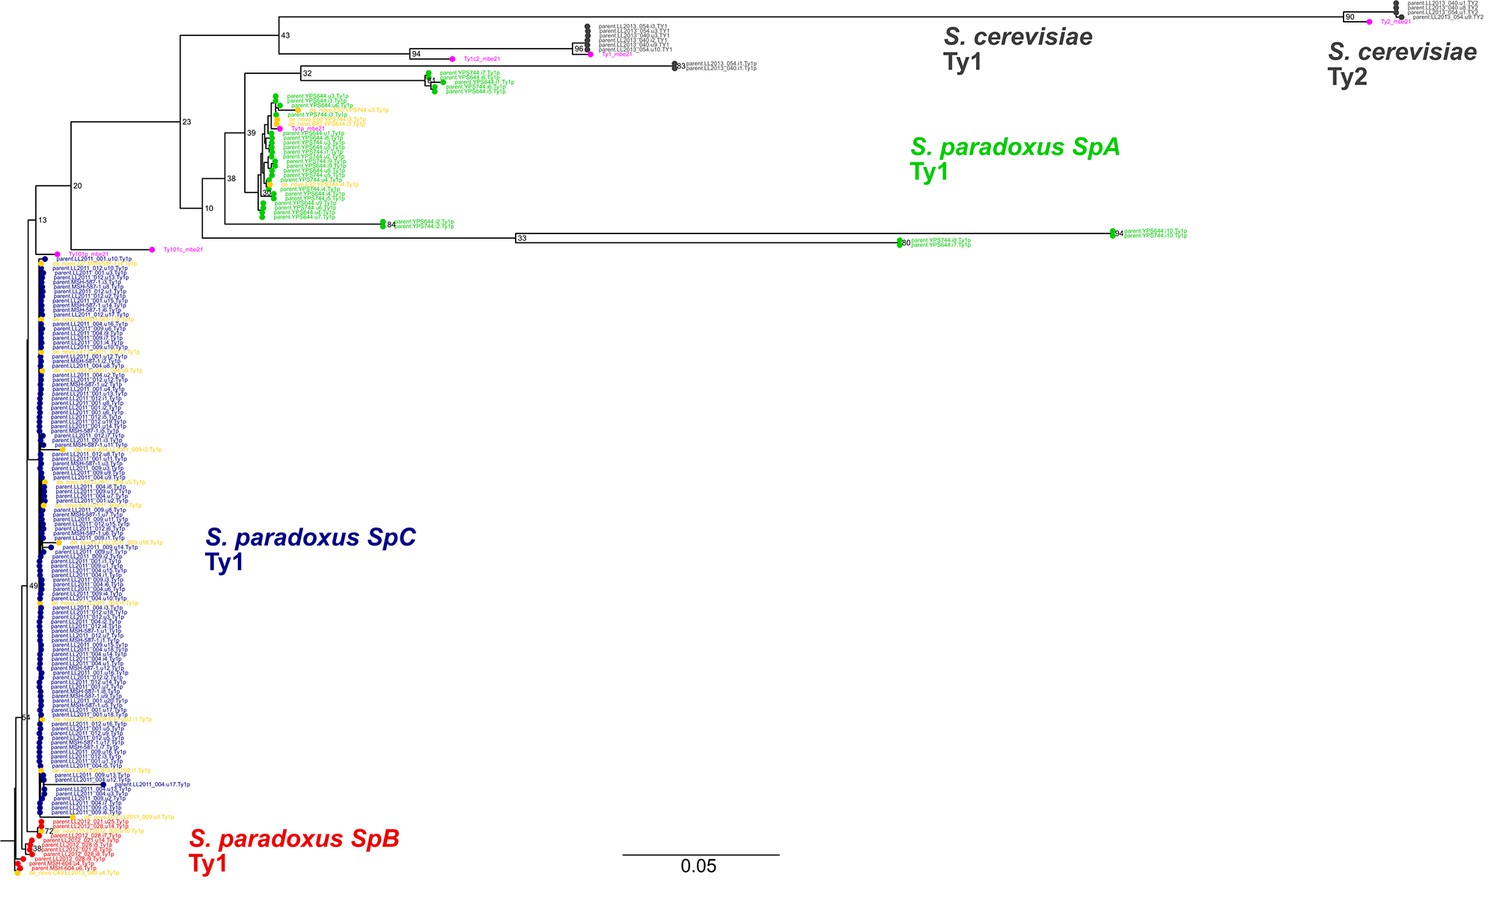
Maximum likelihood phylogenetic tree comprising the full-length parental and de novo Ty1 and Ty2 elements.
De novo retrotransposition events are shown in yellow. Representative copies of the Ty1 and Ty2 subfamilies defined by Bleykasten-Grosshans et al., 2021 are shown in fuchsia. Bootstrap support values are shown as percentages for the selected major branches. The scale is in substitutions per site.
Figure 4—figure supplement 3
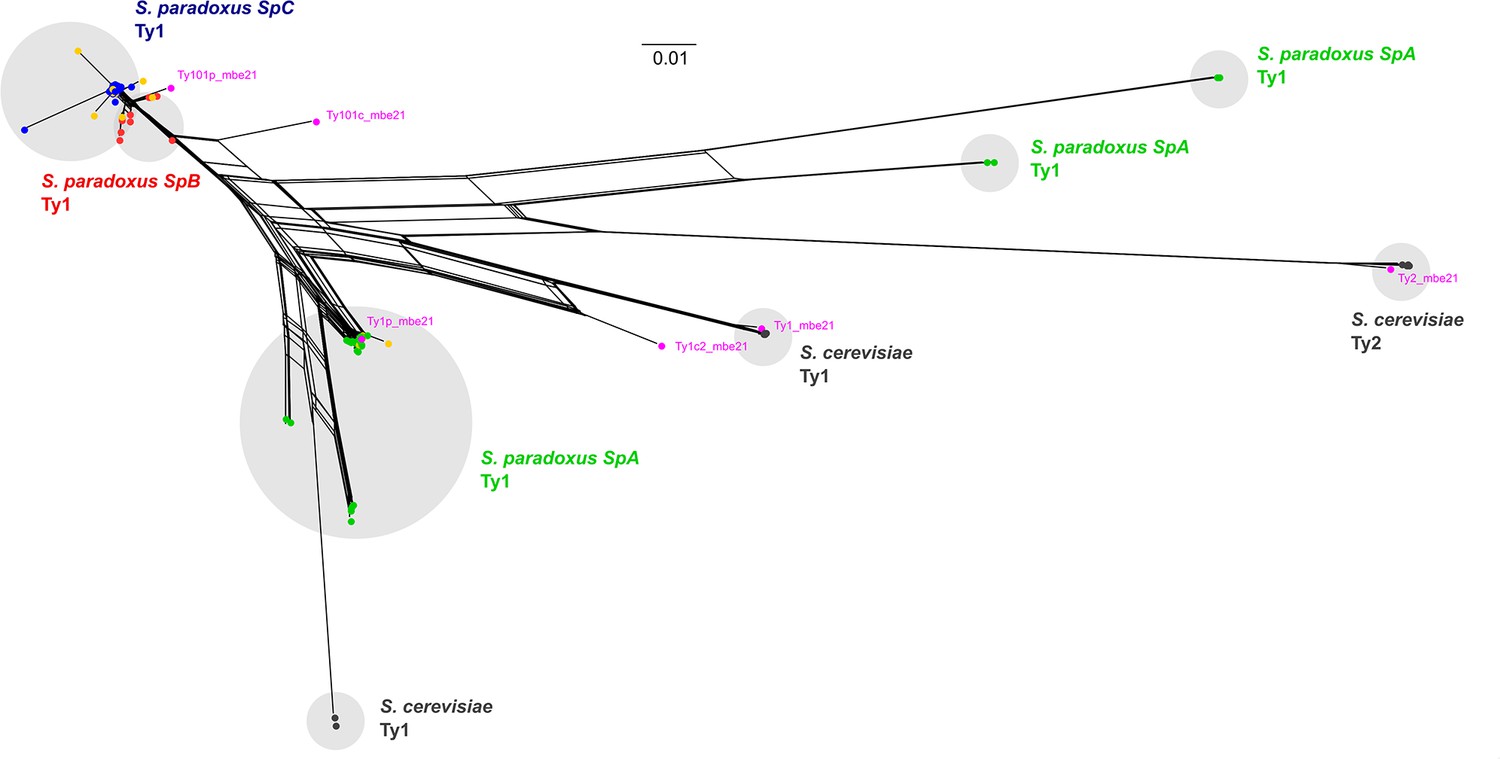
Phylogenetic network comprising the full-length parental and de novo Ty1 and Ty2 elements.
De novo retrotransposition events are shown in yellow. Representative copies of the Ty1 and Ty2 subfamilies defined by Bleykasten-Grosshans et al., 2021 are shown in fuchsia. The scale is in substitutions per site.
Figure 4—figure supplement 4
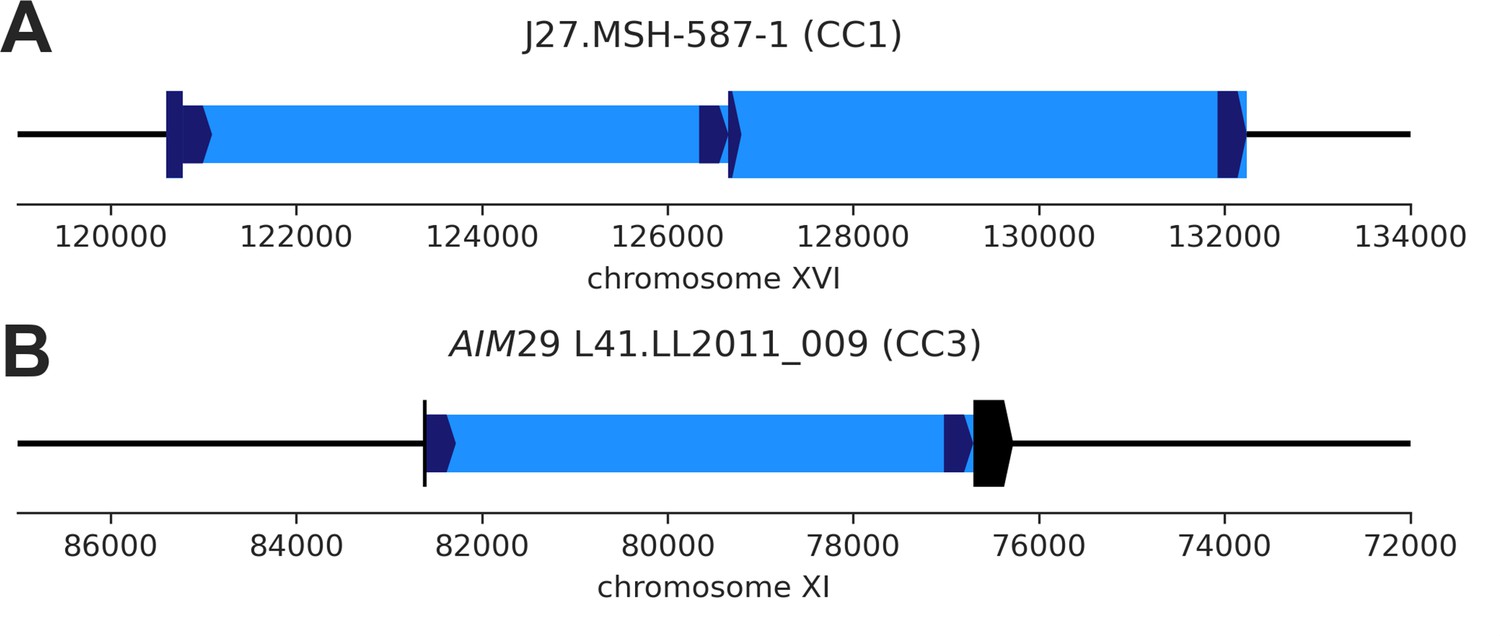
De novo Ty1 transposition events disrupting parental genomic features.
(A) De novo Ty1 insertion (narrow box) into an existing full-length Ty1 element (wide box) in the MSH-587-1 (SpC) subgenome of mutation accumulation (MA) line J27 (CC1). (B) De novo Ty1 insertion (narrow box) into the host gene AIM29 (YKR074W, wide box) in the LL2011_009 (SpC) subgenome of MA line L41 (CC3).
Figure 5 with 1 supplement
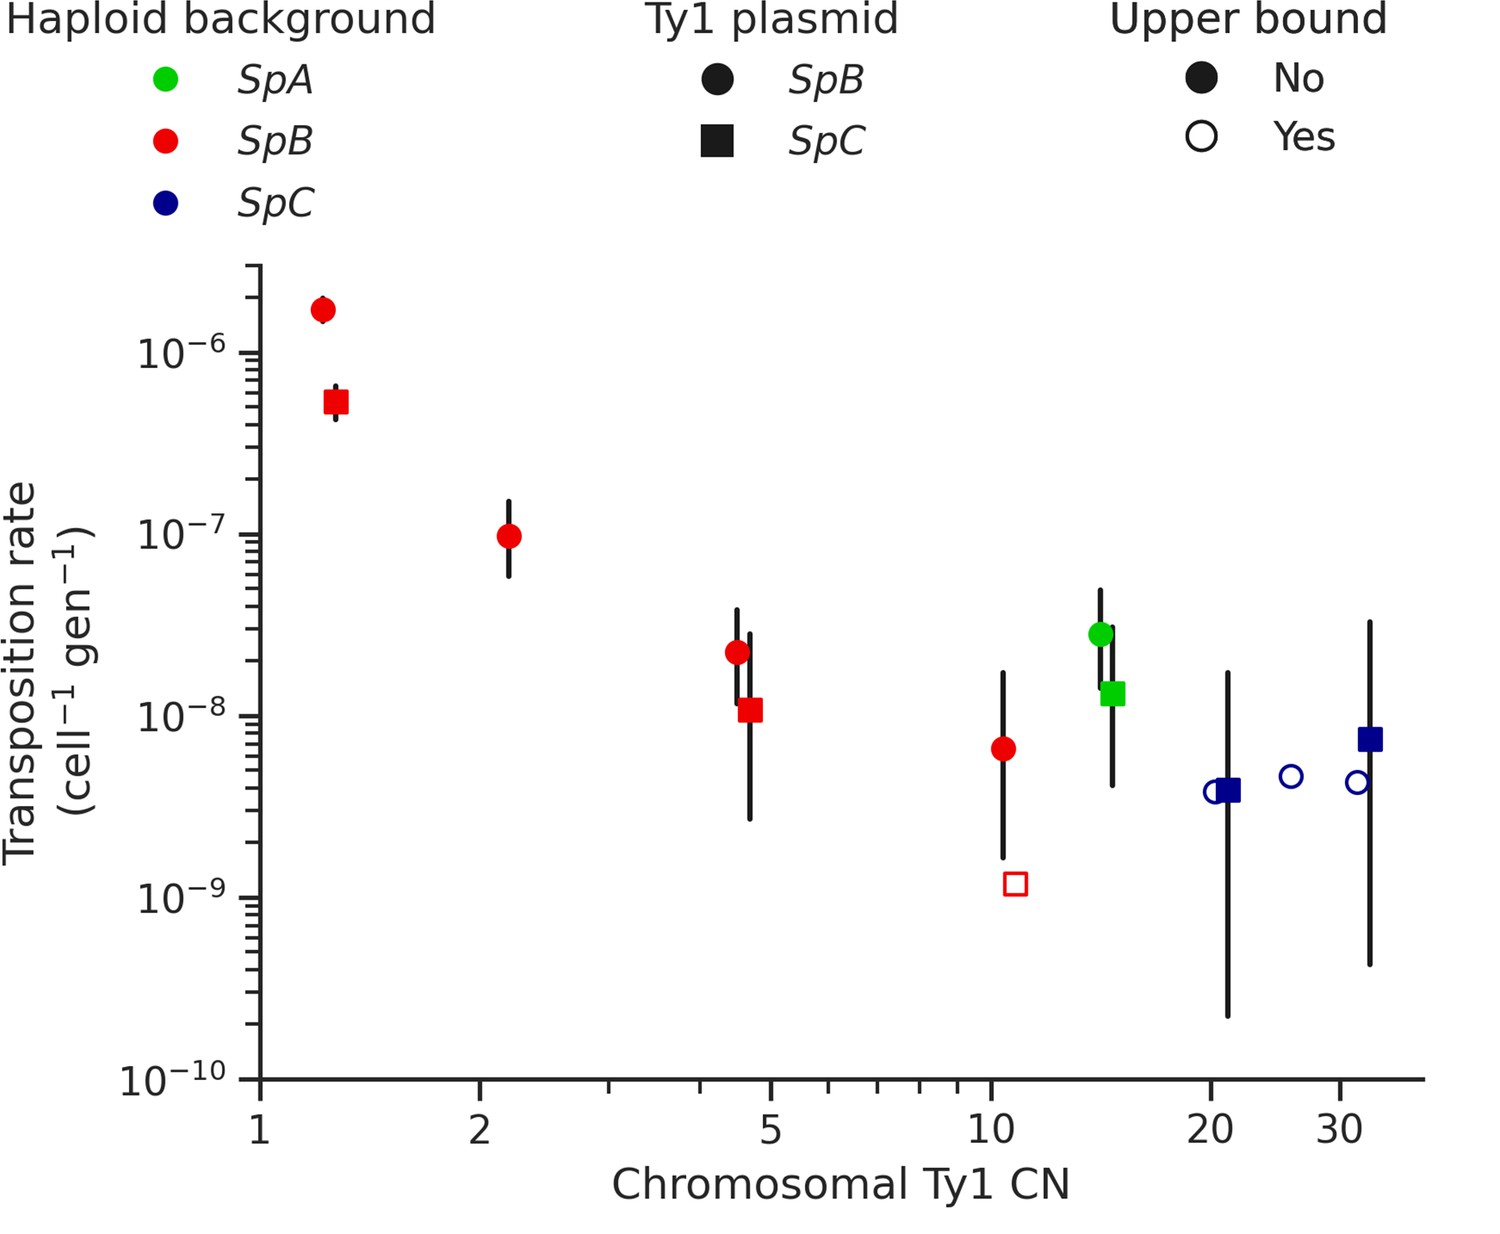
Ty1 transposition rate decreases as a function of chromosomal Ty1 copy number (CN) in S. paradoxus.
Transposition rates were measured in eight haploid S. paradoxus backgrounds. Black bars indicate 95% confidence intervals. Empty symbols represent upper bound transposition rate estimates obtained by artificially inflating the mutant count by one when zero was observed. Marker shapes indicate the sequence variant of the tester Ty1 element, either SpB (circles) or SpC (squares). The S. paradoxus backgrounds and estimated Ty1 CNs are, from left to right, UWOPS-79-140 (SpB, 1.2); MSH-604 (SpB, 2.2); LL2012_021 (SpB, 4.6); LL2012_014 (SpB, 10.6); YPS744 (SpA, 14.4); LL2012_011 (SpC, 20.7); LL2011_012 (SpC, 26.3); and LL2011_009 (SpC, 32.4).
Figure 5—figure supplement 1
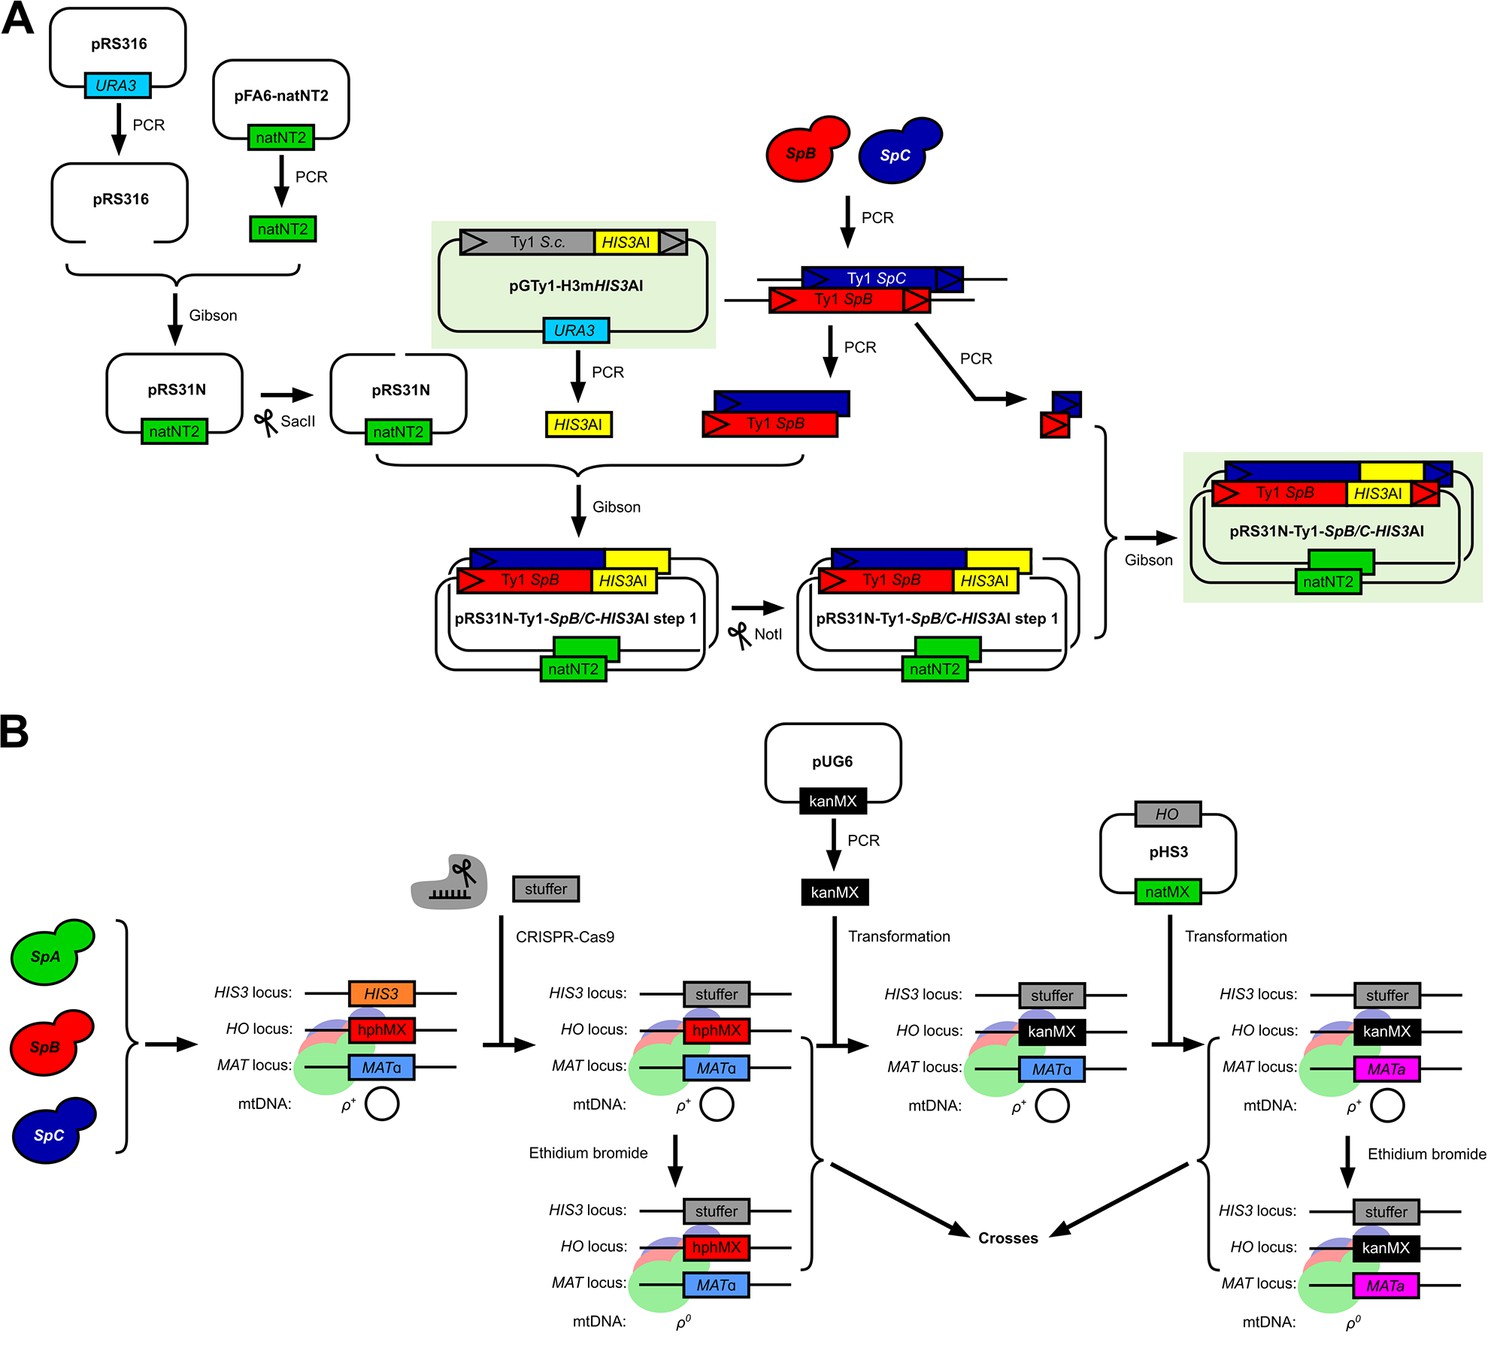
Methodology for the adaptation of the in vivo S. cerevisiae Ty1 retrotransposition assay to S. paradoxus Ty1 variants and genetic backgrounds.
(A) Construction of the pRS316-Ty1-SpB-HIS3AI and pRS316-Ty1-SpC-HIS3AI plasmids with SpB and SpC Ty1 sequence variants, respectively. (B) Construction of a panel of histidine-auxotroph S. paradoxus haploid strains for the generation of combinatorial crosses with reciprocal mtDNA inheritance.
Figure 6 with 1 supplement
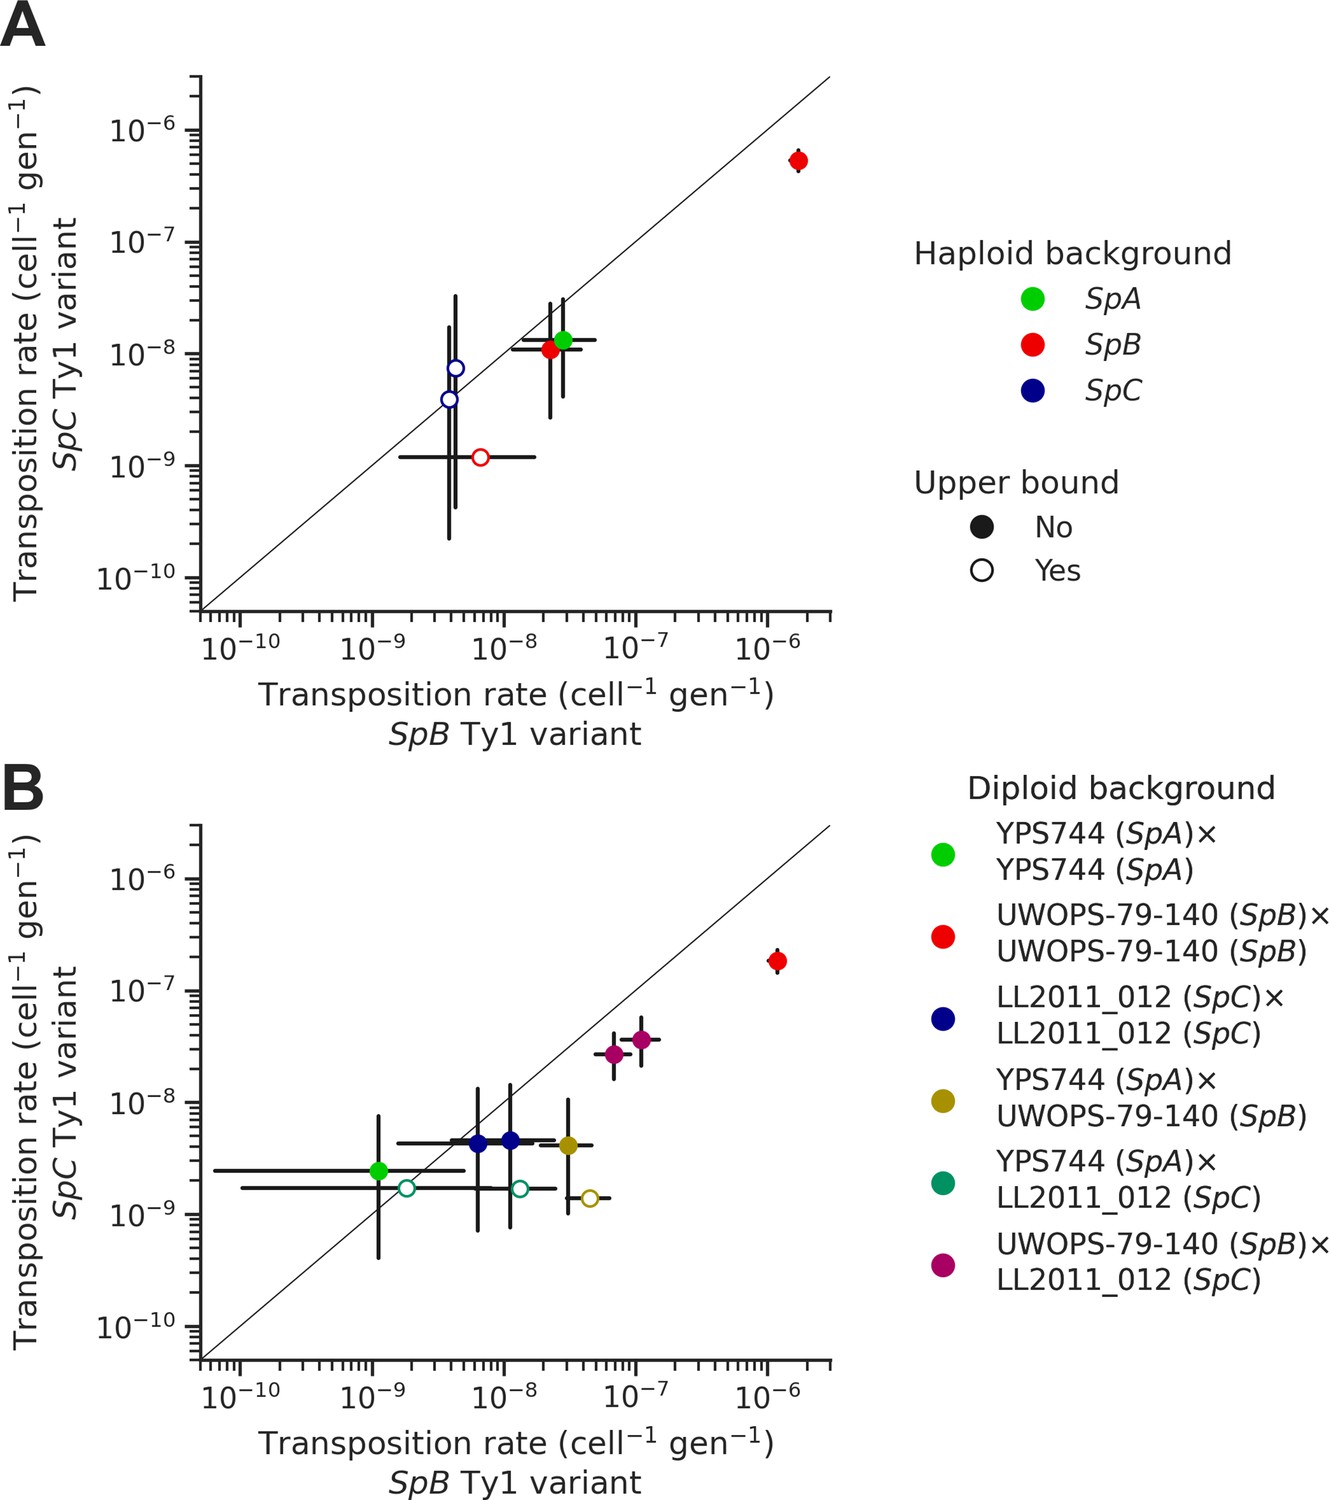
Natural sequence variants of the tester Ty1 element show distinct transposition rates.
Transposition rates of the SpB (X-axis) and SpC (Y-axis) Ty1 variants are shown for haploid backgrounds (A) and diploid backgrounds (B). Black bars indicate 95% confidence intervals. Empty symbols represent upper bound transposition rate estimates obtained by artificially inflating the mutant count by one when zero was observed. The diagonal line indicates a 1:1 relation between transposition rates for the SpB and SpC Ty1 variants. The replicates of haploid backgrounds correspond to distinct strains from each population (see Figure 5), while the replicates for diploid backgrounds correspond to distinct mtDNA inheritance (see Figure 7).
Figure 6—figure supplement 1
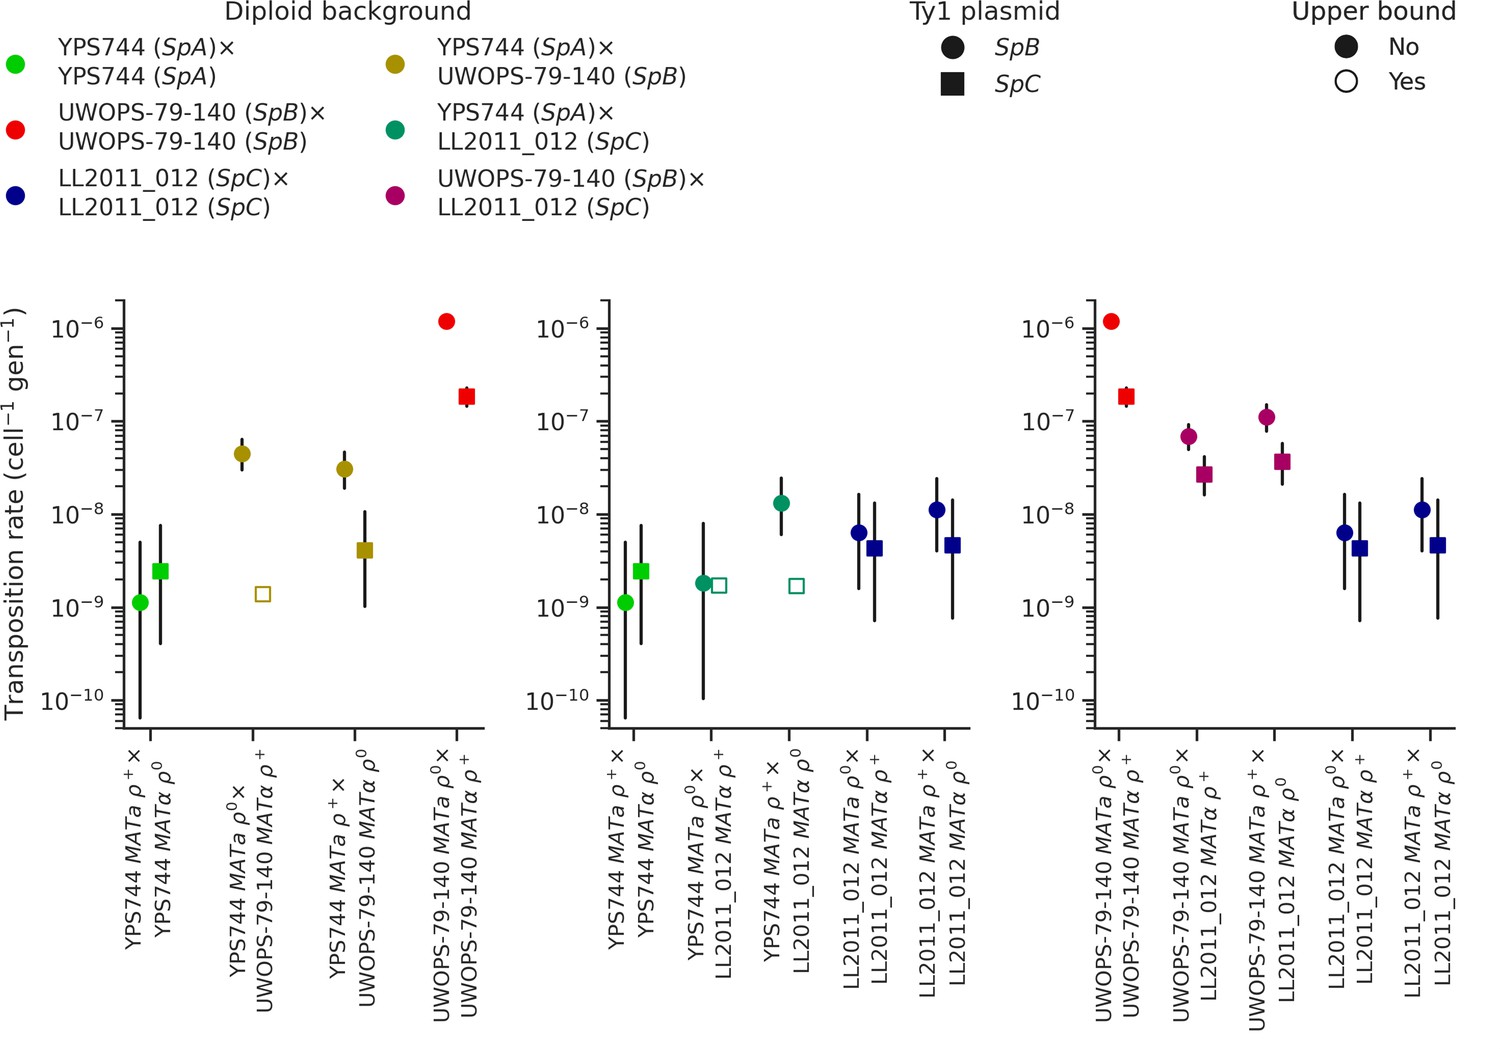
Ty1 transposition rates in diploid homozygous backgrounds of natural populations of S. paradoxus and their hybrids.
Transposition rates were measured in three diploid S. paradoxus backgrounds and their hybrids. Black bars indicate 95% confidence intervals. Empty symbols represent upper bound transposition rate estimates obtained by artificially inflating the mutant count by one when zero was observed. Marker shapes indicate the sequence variant of the tester Ty1 element, either SpB (circles) or SpC (squares).
Figure 7
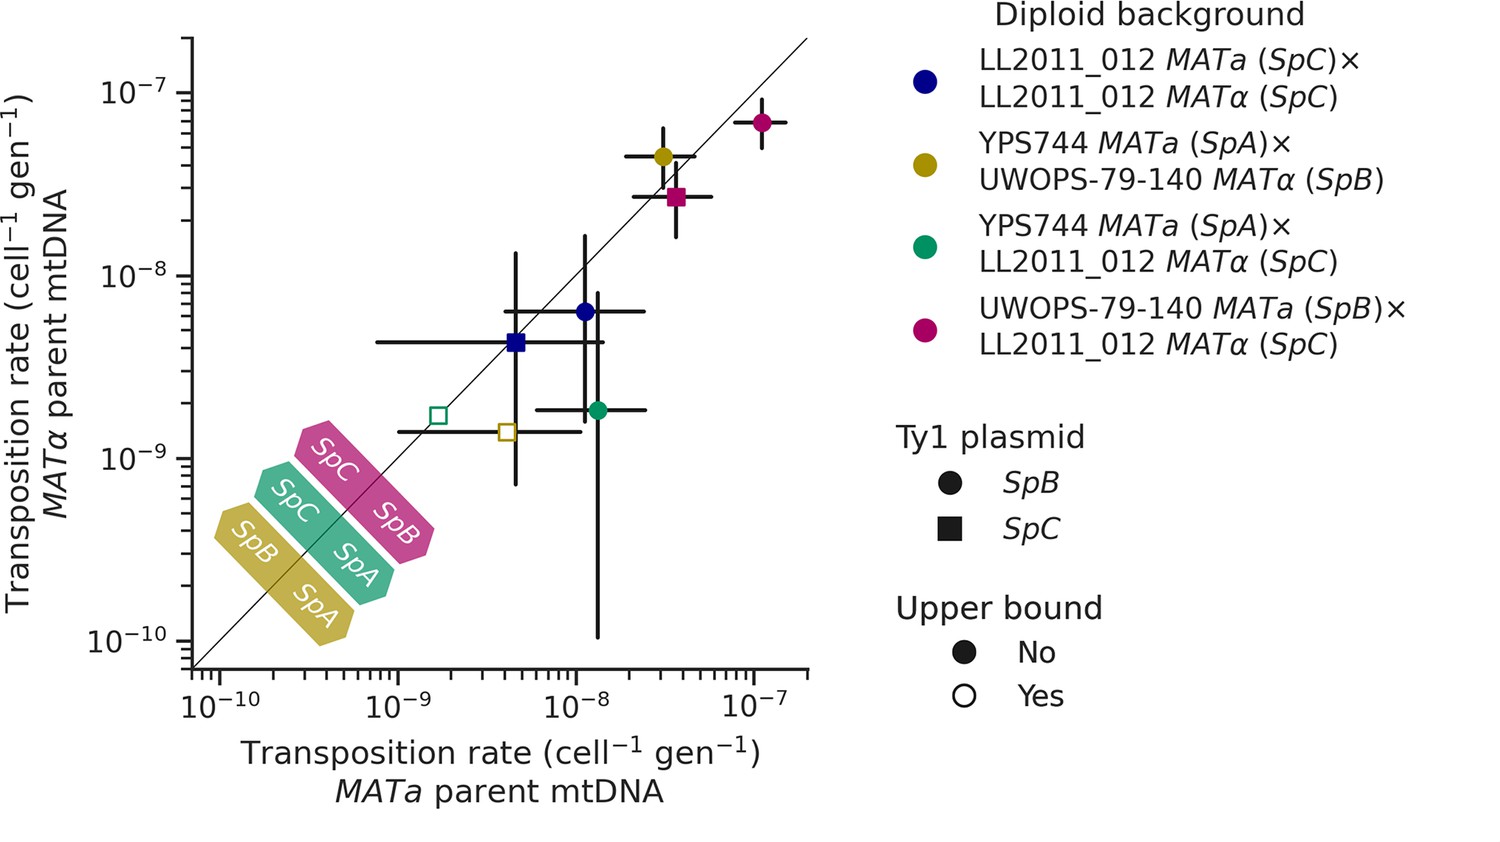
Uniparental mtDNA inheritance affects the transposition rate of Ty1 in heterozygous backgrounds.
Transposition rates in diploid backgrounds as a function of whether the mtDNA is inherited from the MATa parent (X-axis) or the MATα (Y-axis) are shown. Black bars indicate 95% confidence intervals. Empty symbols represent upper bound transposition rate estimates obtained by artificially inflating the mutant count by one when zero was observed. Marker shapes indicate the sequence variant of the tester Ty1 element, either SpB (circles) or SpC (squares). The diagonal line indicates a 1:1 relation between transposition rates for reciprocal mtDNA inheritance. Colored arrows at the bottom left indicate the mtDNA haplotype that would correspond to a higher transposition rate on that side of the diagonal for each hybrid background.
Additional files
-
Supplementary file 1
Supplementary tables.
(a) Subgenome-level assemblies of MA lines. (b) Plasmids used an constructed in this study. (c) Oligonucleotides sequences used in this study. (d) PCR reactions and cycles used in this study. (e) Strains used and constructed for the retrotransposition rate measurement assays. (f) Crosses generated for the retrotransposition rate measurement assays. (g) Raw data of the fluctuation assays on haploid backgrounds. (h) Raw data of the fluctuation assays on diploid backgrounds. (i) Media recipes used in this study.
- https://cdn.elifesciences.org/articles/89277/elife-89277-supp1-v2.xlsx
-
MDAR checklist
- https://cdn.elifesciences.org/articles/89277/elife-89277-mdarchecklist1-v2.docx
Download links
A two-part list of links to download the article, or parts of the article, in various formats.
Downloads (link to download the article as PDF)
Open citations (links to open the citations from this article in various online reference manager services)
Cite this article (links to download the citations from this article in formats compatible with various reference manager tools)
The genomic landscape of transposable elements in yeast hybrids is shaped by structural variation and genotype-specific modulation of transposition rate
eLife 12:RP89277.
https://doi.org/10.7554/eLife.89277.3


