The structural repertoire of Fusarium oxysporum f. sp. lycopersici effectors revealed by experimental and computational studies
- Research School of Biology, The Australian National University, Australia
- Key Laboratory of Hebei Province for Plant Physiology and Molecular Pathology, College of Life Sciences, Hebei Agriculture University, China
- State Key Laboratory of North China Crop Improvement and Regulation, College of Horticulture, Hebei Agricultural University, China
- The Australian Nuclear Science and Technology Organisation, Australian Synchrotron, Australia
Figures
Figure 1 with 3 supplements
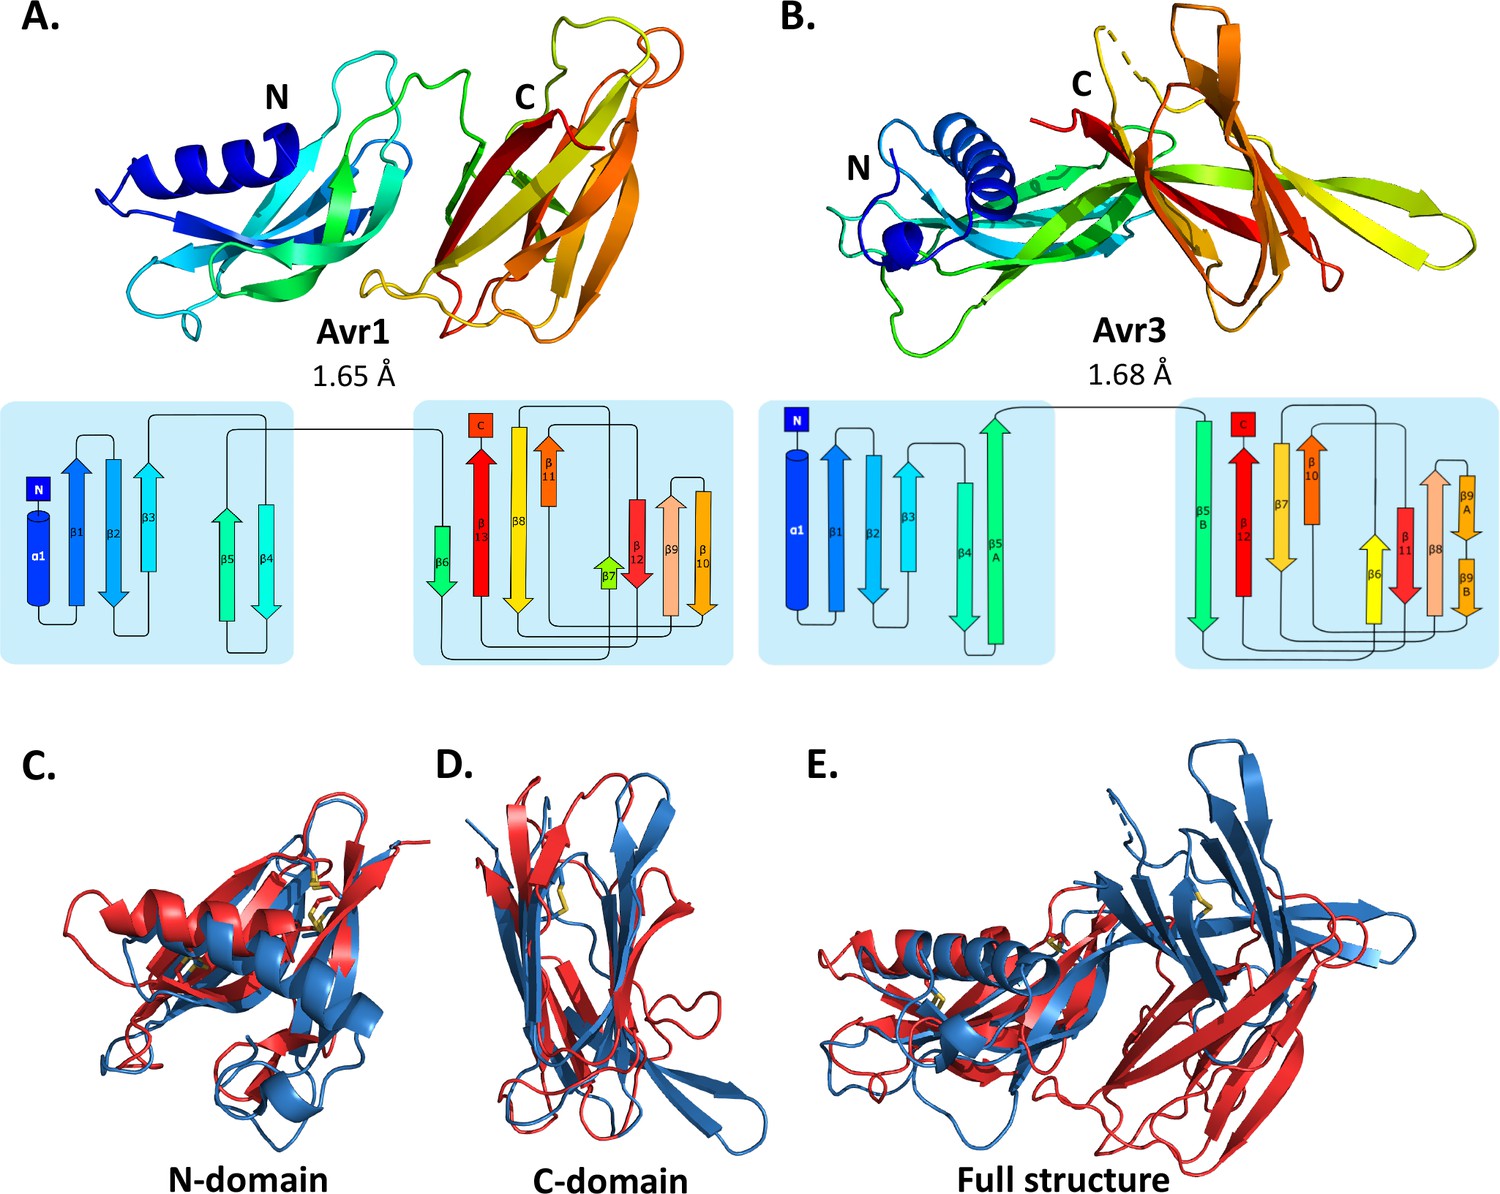
Crystal structures of Avr1 and Avr3 from Fol adopt a similar structural fold.
Ribbon diagrams of (A) Avr1 and (B) Avr3 coloured from N- (blue) to C-terminus (red) showing the dual-domain structural fold (top panels) and secondary structure topology map (bottom panels) of Avr1 and Avr3, respectively. For both, the N-domain is shown on the left and the C-domain is shown on the right. The colours of the secondary structural elements match the colours depicted on the crystal structure. Structural alignments of Avr1 (shown in red) and Avr3 (shown in blue) showing (C) N-domains alone, (D) C-domains alone, and (E) full structures. Disulfide bonds are shown in yellow. Structural alignment was performed using the pairwise alignment function of the DALI server (Holm, 2022).
Figure 1—figure supplement 1
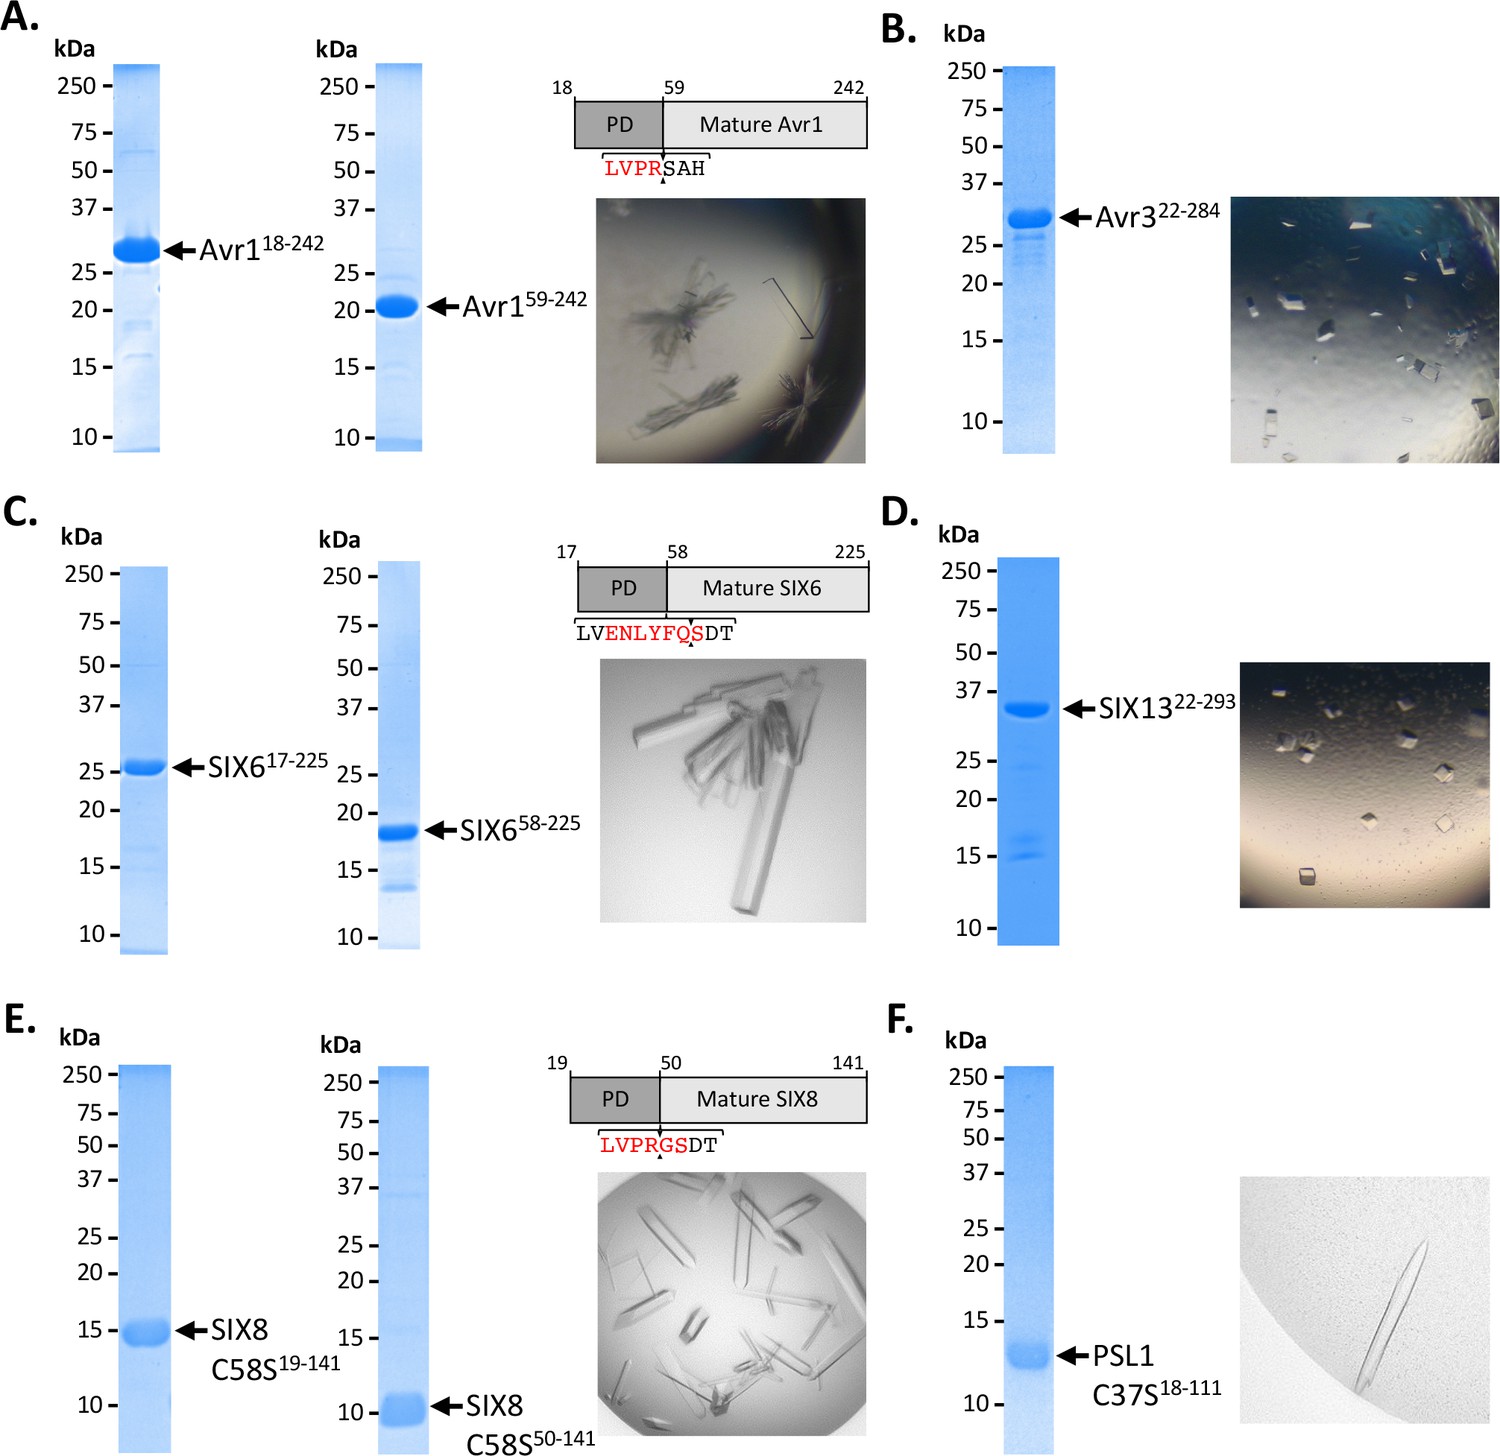
Crystallisation of Avr1, Avr3, SIX6, SIX8, SIX13, and PSL1.
(A) Coomassie-stained gel showing Avr118-242 (left panel) and mature Avr159-242 cleaved in vitro with thrombin (middle panel). Schematic of Avr1 engineered with an internal thrombin cleavage site replacing the Kex2 cleavage motif after the pro-domain (PD) (top-right panel). Optimised crystals of Avr159-242 (bottom-right panel). (B) Coomassie-stained gel showing purified Avr322-284 used for crystallisation studies (left panel). Optimised crystals of Avr3 (right panel). (C) Coomassie-stained gel showing SIX617-225 (left panel) and mature SIX658-225 cleaved in vitro with TEV protease (middle panel). Schematic of SIX6 engineered with an internal TEV protease cleavage site replacing the Kex2 cleavage motif after the PD (top-right panel). Optimised crystals of SIX658-225 (bottom-right panel). (D) Coomassie-stained gel showing SIX1322-293 protein (left panel). Optimised crystals of SIX13 (right panel). Kex2 protease was added to the protein at a 1:200 protease to protein ratio prior to crystal tray setup. (E) Coomassie-stained gel showing SIX8_C58S19-141 (left panel) and mature SIX8_C58S50-141 cleaved in vitro with thrombin (middle panel). Schematic of SIX8 engineered with an internal thrombin cleavage site replacing the Kex2 cleavage motif (top-right panel). Optimised crystals of SIX8_C58S50-141 (bottom-right panel). (F) Coomassie-stained gel showing PSL1_C37S18-111 protein (left panel). Optimised crystals of PSL1_C37S18-111 (right panel).
-
Figure 1—figure supplement 1—source data 1
Unedited and uncropped SDS-PAGE gel for Figure 1—figure supplement 1A, Avr118-242.
- https://cdn.elifesciences.org/articles/89280/elife-89280-fig1-figsupp1-data1-v1.pdf
-
Figure 1—figure supplement 1—source data 2
Unedited and uncropped SDS-PAGE gel for Figure 1—figure supplement 1A, Avr118-242, with relevant bands labelled.
- https://cdn.elifesciences.org/articles/89280/elife-89280-fig1-figsupp1-data2-v1.pdf
-
Figure 1—figure supplement 1—source data 3
Unedited and uncropped SDS-PAGE gel for Figure 1—figure supplement 1A, Avr159-242.
- https://cdn.elifesciences.org/articles/89280/elife-89280-fig1-figsupp1-data3-v1.pdf
-
Figure 1—figure supplement 1—source data 4
Unedited and uncropped SDS-PAGE gel for Figure 1—figure supplement 1A, Avr159-242, with relevant bands labelled.
- https://cdn.elifesciences.org/articles/89280/elife-89280-fig1-figsupp1-data4-v1.pdf
-
Figure 1—figure supplement 1—source data 5
Unedited and uncropped SDS-PAGE gel for Figure 1—figure supplement 1B, Avr322-284.
- https://cdn.elifesciences.org/articles/89280/elife-89280-fig1-figsupp1-data5-v1.pdf
-
Figure 1—figure supplement 1—source data 6
Unedited and uncropped SDS-PAGE gel for Figure 1—figure supplement 1B, Avr322-284, with relevant bands labelled.
- https://cdn.elifesciences.org/articles/89280/elife-89280-fig1-figsupp1-data6-v1.pdf
-
Figure 1—figure supplement 1—source data 7
Unedited and uncropped SDS-PAGE gel for Figure 1—figure supplement 1C, SIX617-225.
- https://cdn.elifesciences.org/articles/89280/elife-89280-fig1-figsupp1-data7-v1.pdf
-
Figure 1—figure supplement 1—source data 8
Unedited and uncropped SDS-PAGE gel for Figure 1—figure supplement 1C, SIX617-225, with relevant bands labelled.
- https://cdn.elifesciences.org/articles/89280/elife-89280-fig1-figsupp1-data8-v1.pdf
-
Figure 1—figure supplement 1—source data 9
Unedited and uncropped SDS-PAGE gel for Figure 1—figure supplement 1C, SIX658-225.
- https://cdn.elifesciences.org/articles/89280/elife-89280-fig1-figsupp1-data9-v1.pdf
-
Figure 1—figure supplement 1—source data 10
Unedited and uncropped SDS-PAGE gel for Figure 1—figure supplement 1C, SIX658-225, with relevant bands labelled.
- https://cdn.elifesciences.org/articles/89280/elife-89280-fig1-figsupp1-data10-v1.pdf
-
Figure 1—figure supplement 1—source data 11
Unedited and uncropped SDS-PAGE gel for Figure 1—figure supplement 1D, SIX1322-293.
- https://cdn.elifesciences.org/articles/89280/elife-89280-fig1-figsupp1-data11-v1.pdf
-
Figure 1—figure supplement 1—source data 12
Unedited and uncropped SDS-PAGE gel for Figure 1—figure supplement 1D, SIX1322-293, with relevant bands labelled.
- https://cdn.elifesciences.org/articles/89280/elife-89280-fig1-figsupp1-data12-v1.pdf
-
Figure 1—figure supplement 1—source data 13
Unedited and uncropped SDS-PAGE gel for Figure 1—figure supplement 1E, SIX819-141.
- https://cdn.elifesciences.org/articles/89280/elife-89280-fig1-figsupp1-data13-v1.pdf
-
Figure 1—figure supplement 1—source data 14
Unedited and uncropped SDS-PAGE gel for Figure 1—figure supplement 1E, SIX819-141, with relevant bands labelled.
- https://cdn.elifesciences.org/articles/89280/elife-89280-fig1-figsupp1-data14-v1.pdf
-
Figure 1—figure supplement 1—source data 15
Unedited and uncropped SDS-PAGE gel for Figure 1—figure supplement 1E, SIX850-141.
- https://cdn.elifesciences.org/articles/89280/elife-89280-fig1-figsupp1-data15-v1.pdf
-
Figure 1—figure supplement 1—source data 16
Unedited and uncropped SDS-PAGE gel for Figure 1—figure supplement 1E, SIX850-141, with relevant bands labelled.
- https://cdn.elifesciences.org/articles/89280/elife-89280-fig1-figsupp1-data16-v1.pdf
-
Figure 1—figure supplement 1—source data 17
Unedited and uncropped SDS-PAGE gel for Figure 1—figure supplement 1F, PSL118-111.
- https://cdn.elifesciences.org/articles/89280/elife-89280-fig1-figsupp1-data17-v1.pdf
-
Figure 1—figure supplement 1—source data 18
Unedited and uncropped SDS-PAGE gel for Figure 1—figure supplement 1F, PSL118-111, with relevant bands labelled.
- https://cdn.elifesciences.org/articles/89280/elife-89280-fig1-figsupp1-data18-v1.pdf
Figure 1—figure supplement 2
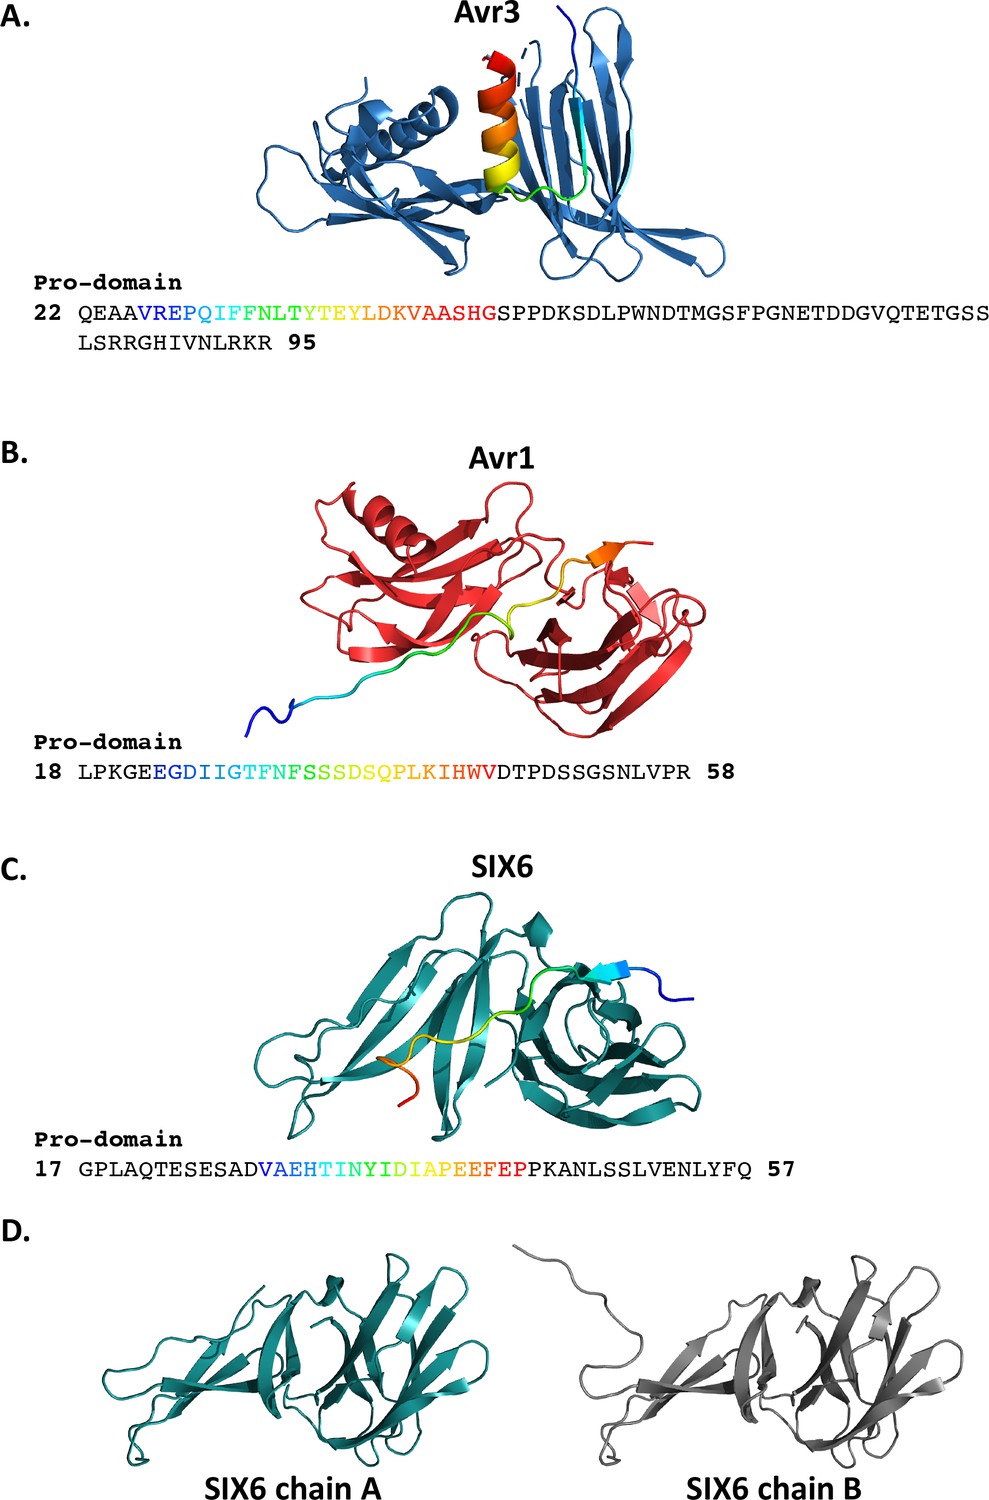
Continuous electron density of the pro-domain is present in the crystal structures of Avr1, Avr3, and SIX6.
The crystal structure of (A) Avr3, (B) Avr1, and (C) SIX6 with the pro-domain shown in rainbow (top panels). The amino acid sequence of the pro-domain of Avr3, Avr1, and SIX6 with residues observed in the electron density shown in rainbow text (bottom panels). Residues with no density observed are shown in black. For SIX6, electron density corresponding to the pro-domain was only associated to chain A. (D) Different orientations of the N-terminal region of SIX6 between chains A and B. Chain A was used in subsequent structural analysis.
Figure 1—figure supplement 3
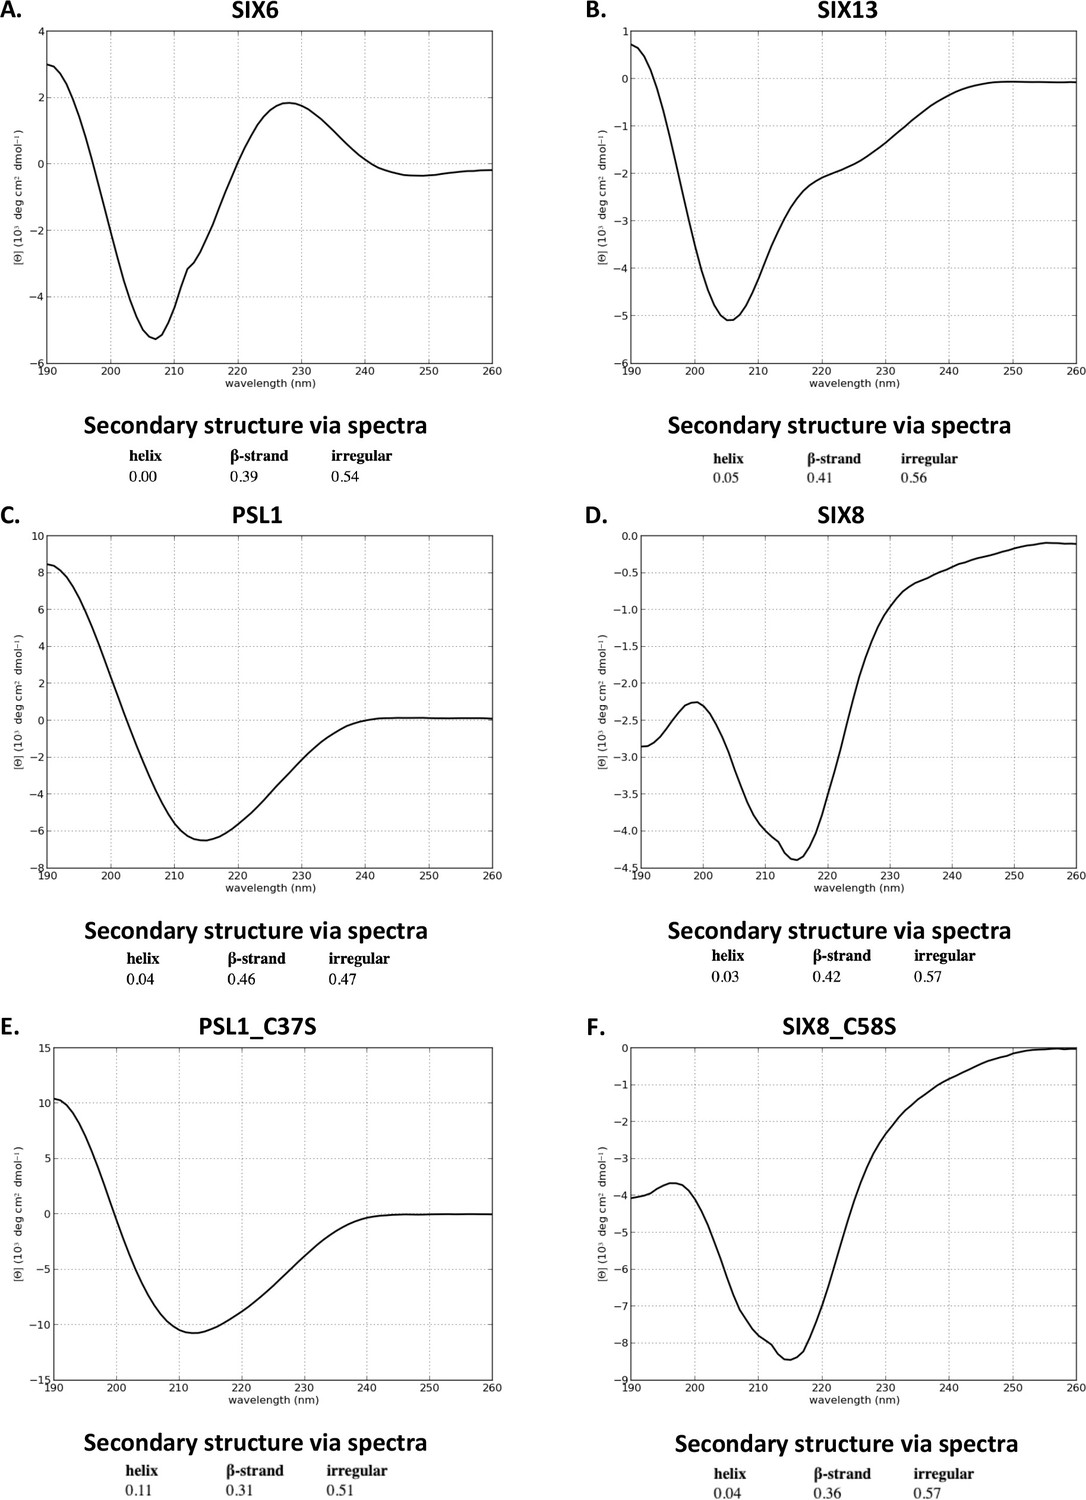
Circular dichroism (CD) analysis of purified recombinant proteins.
CD spectra of (A) SIX6, (B) SIX13, (C) PSL1, (D) SIX8, (E) PSL1_C37S, and (F) SIX8_C58S proteins are plotted, and secondary structure elements analysed using the CAPITO webserver (Wiedemann et al., 2013).
Figure 2 with 3 supplements
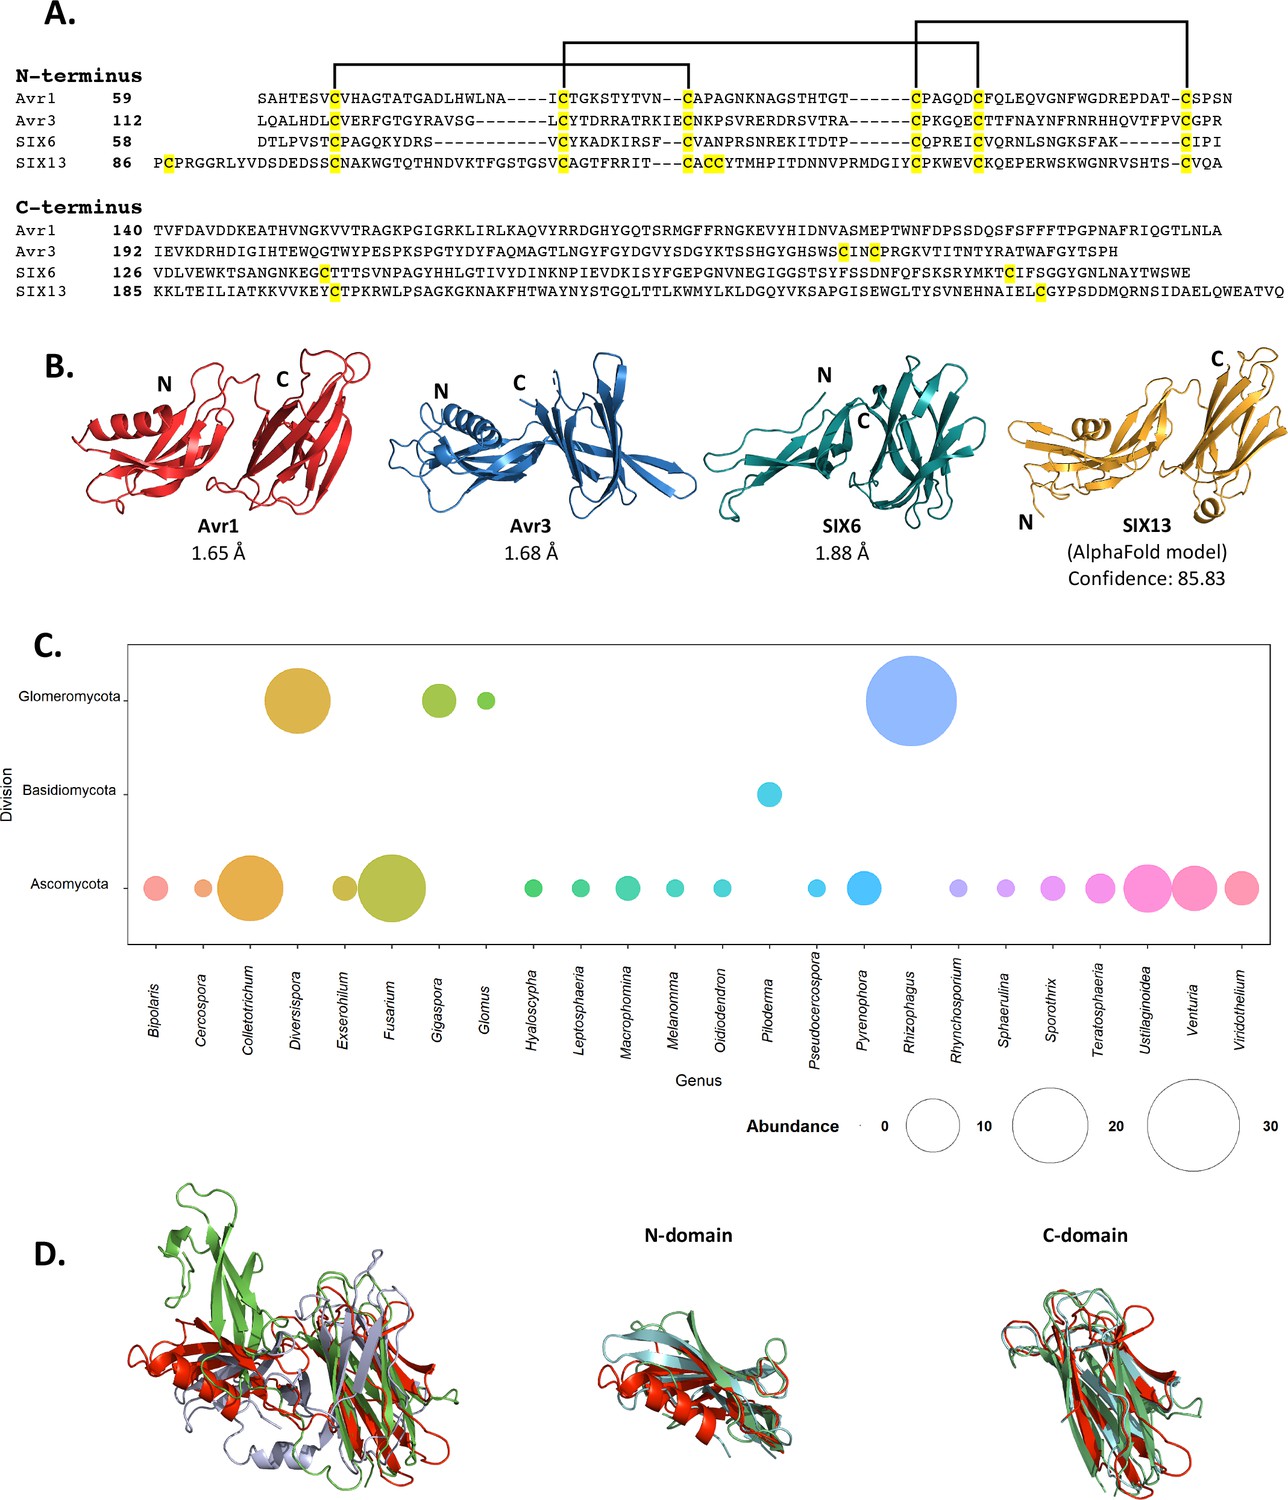
Fol dual-domain (FOLD) effector family is distributed within Fusarium oxysporum and other fungi.
(A) Amino acid sequence alignment of the mature Avr1, Avr3, SIX6, and SIX13 sequences shows a common cysteine spacing at the N-terminus. The alignment is split into the N-terminus (N-domain; top panel) and C-terminus (C-domain; bottom panel). Cysteine residues are highlighted in yellow, with common disulfide bonding connectivity, as determined by the crystal structures of Avr1 and Avr3, shown with black lines. (B) Ribbon diagrams of the Avr1, Avr3, SIX6 crystal structures and SIX13 AlphaFold2 model show a conserved dual-domain structure. The N- and C-termini are labelled. (C) Structure-guided search for putative FOLD effectors across fungi using Foldseek webserver. The size of the circles represents abundance with genus. (D) Superposition (structural alignment) of representative putative FOLD effectors from the divisions Glomeromycota and Basidiomycota with Avr1 in ribbon representation. Putative FOLD protein from Rhizophagus clarus (UniProt: A0A2Z6QDJ0) in light blue, and Piloderma croceum (UniProt: A0A0C3C2B2) in green. FOLD structural alignment (right), N-domain only (middle), and C-domain only (right).
Figure 2—figure supplement 1
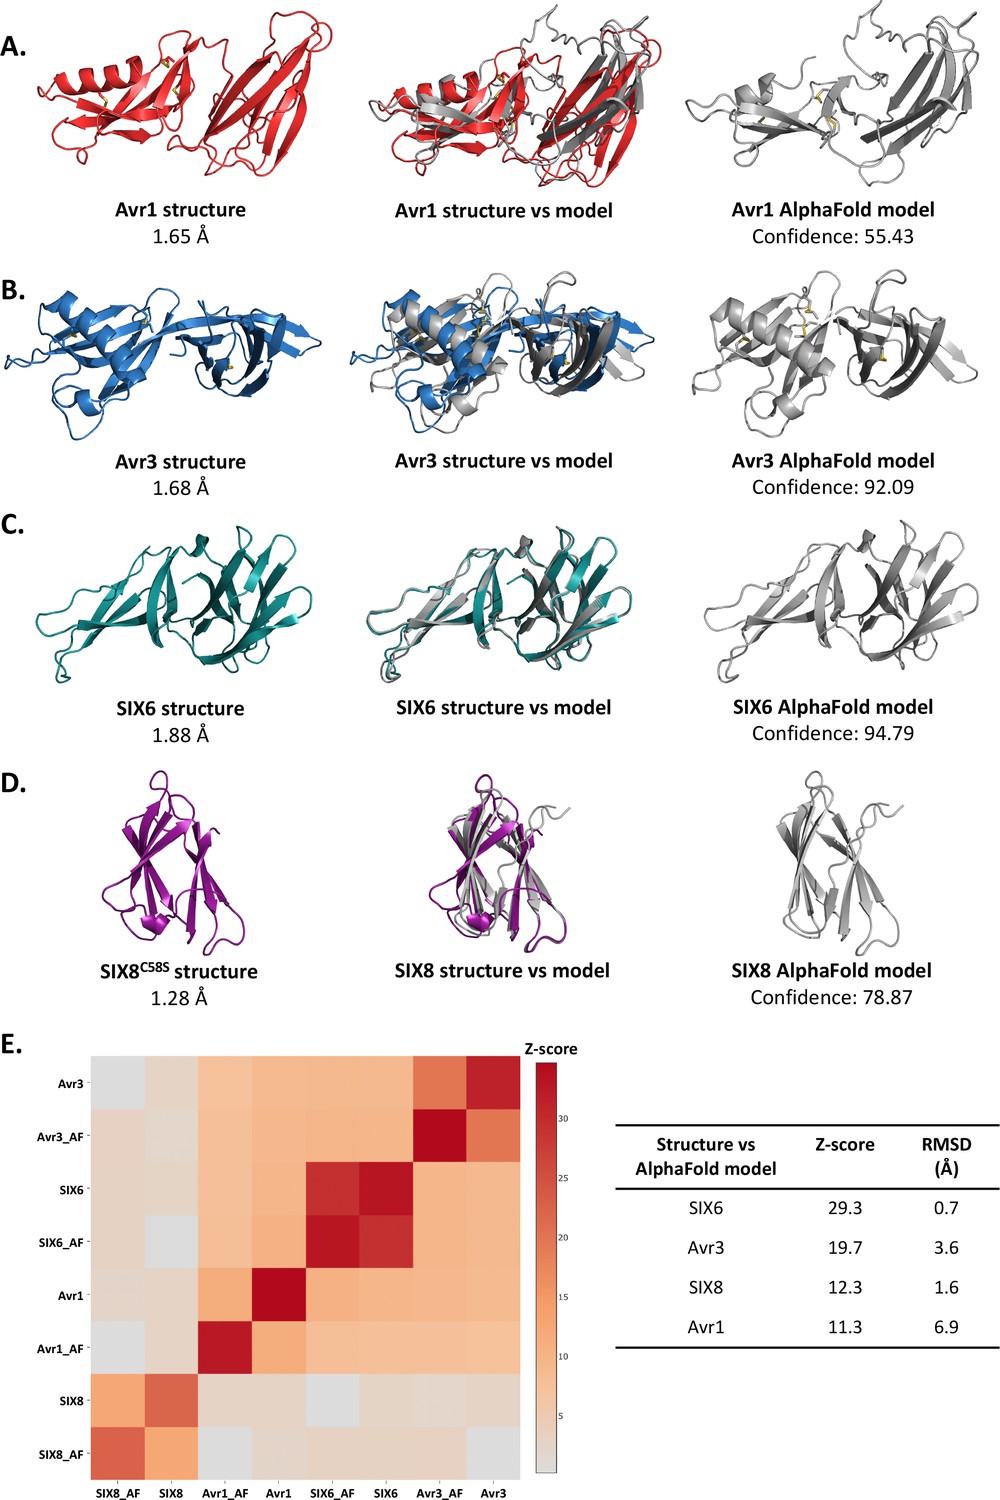
Comparison of AlphaFold2 models against the experimentally solved structures of Avr1, Avr3, SIX6, and SIX8.
The crystal structures of (A) Avr1, (B) Avr3, (C) SIX6, and (D) SIX8 (left panels) and AlphaFold2 models (Jumper et al., 2021) (right panels). Crystal structures and AlphaFold2 models of the full structures (middle panels) were superimposed using the pairwise and all against all functions on the DALI server (Holm, 2022). (E) Heat map of the structural similarity between crystal structures and AlphaFold2 models (left panel). Z-score and root-mean-square deviation (RMSD) values are shown in the right panel.
Figure 2—figure supplement 2
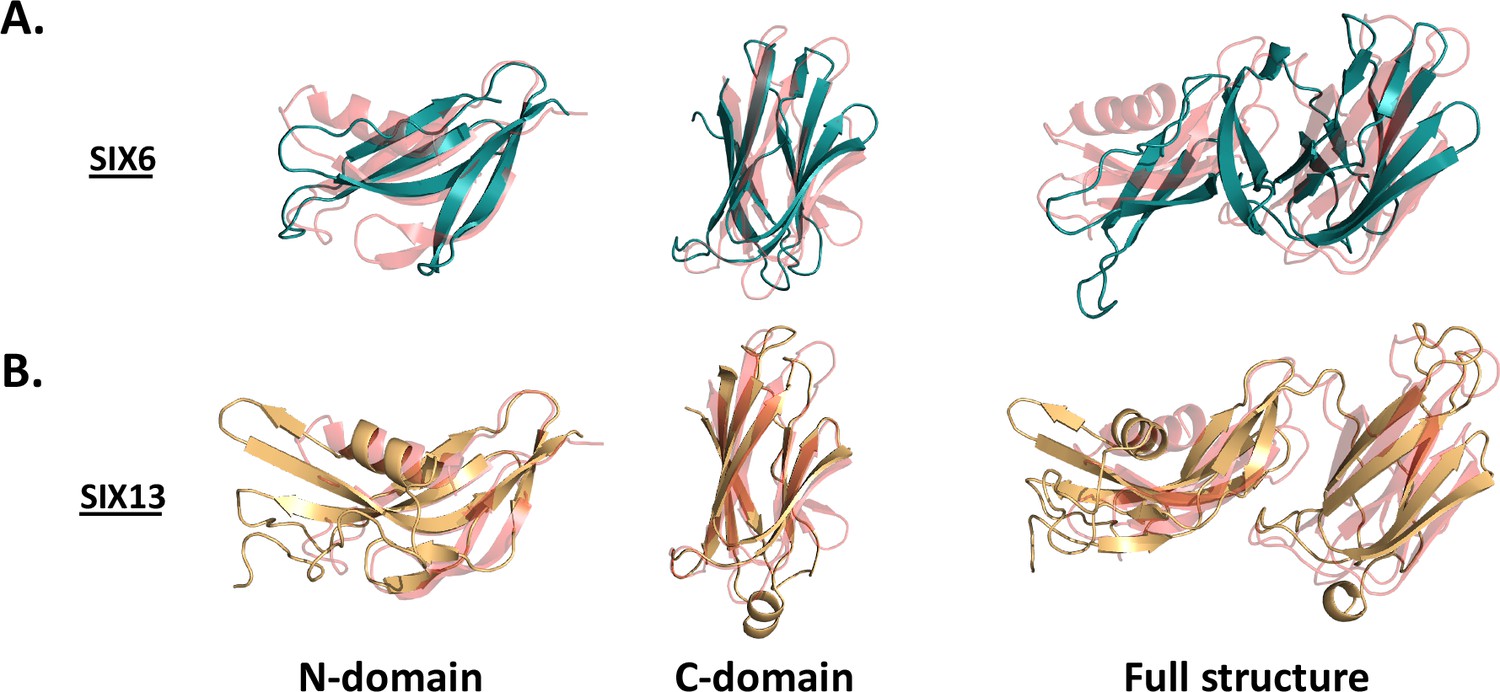
Structural alignments of SIX6 and SIX13 with Avr1.
(A) SIX6 crystal structure and (B) SIX13 AlphaFold2 model aligned with Avr1 using the N-domains alone (left panel), C-domains alone (middle panel), and full structure (right panel). Structural alignment was performed using the pairwise alignment function on the DALI server (Holm, 2022).
Figure 2—figure supplement 3
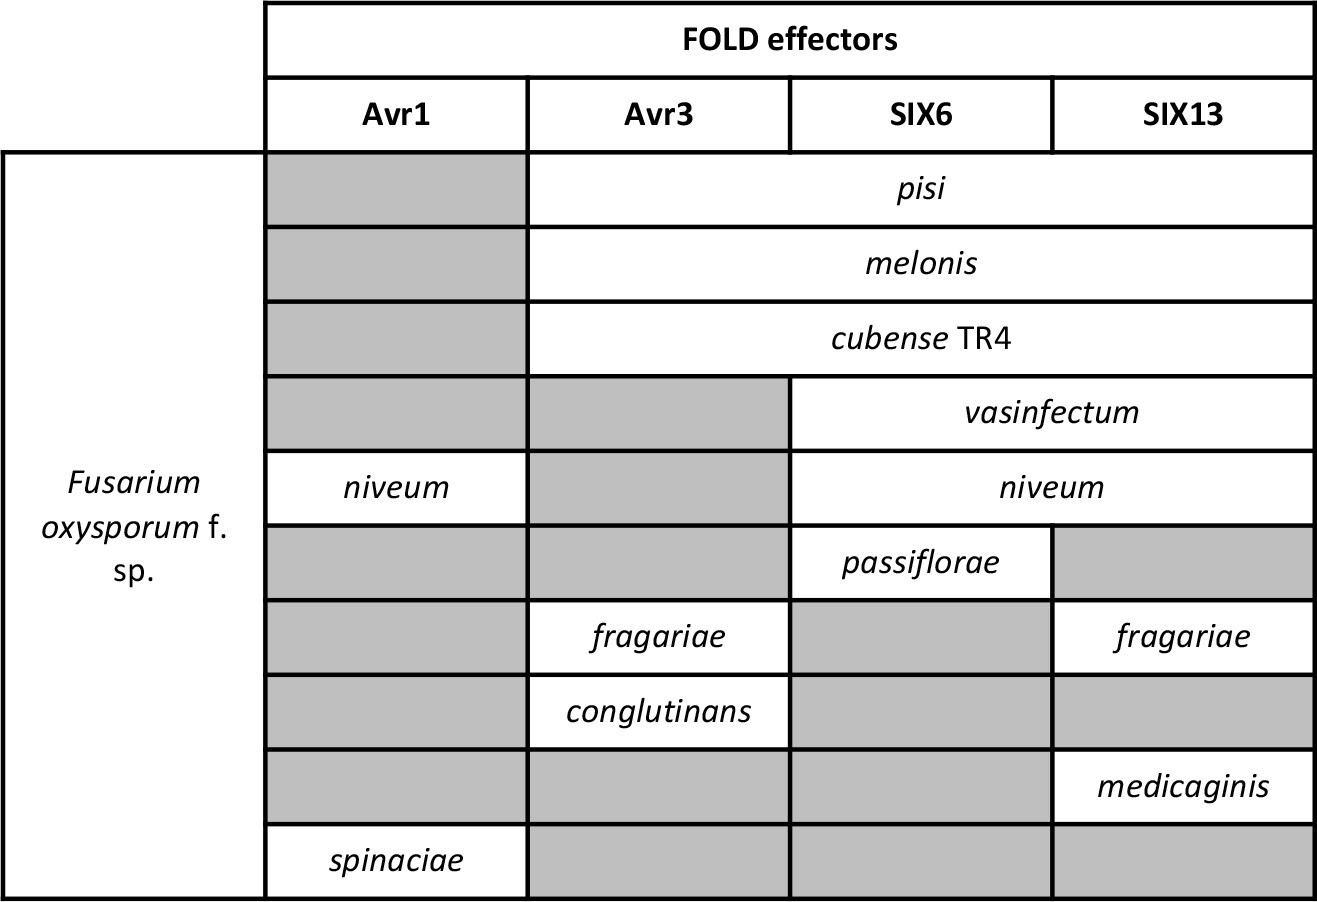
Homologues of Fol dual-domain (FOLD) effectors are dispersed across multiple formae speciales of F. oxysporum.
Functional homologues of Avr1 (SIX4), Avr3 (SIX1), SIX6, and SIX13 reported in the literature were assessed (Schmidt et al., 2013; Gawehns et al., 2014; Batson et al., 2021; Czislowski et al., 2018; Lievens et al., 2009; van Dam et al., 2016).
-
Figure 2—figure supplement 3—source data 1
PDF version of Figure 2—figure supplement 3.
- https://cdn.elifesciences.org/articles/89280/elife-89280-fig2-figsupp3-data1-v1.pdf
Figure 3 with 3 supplements
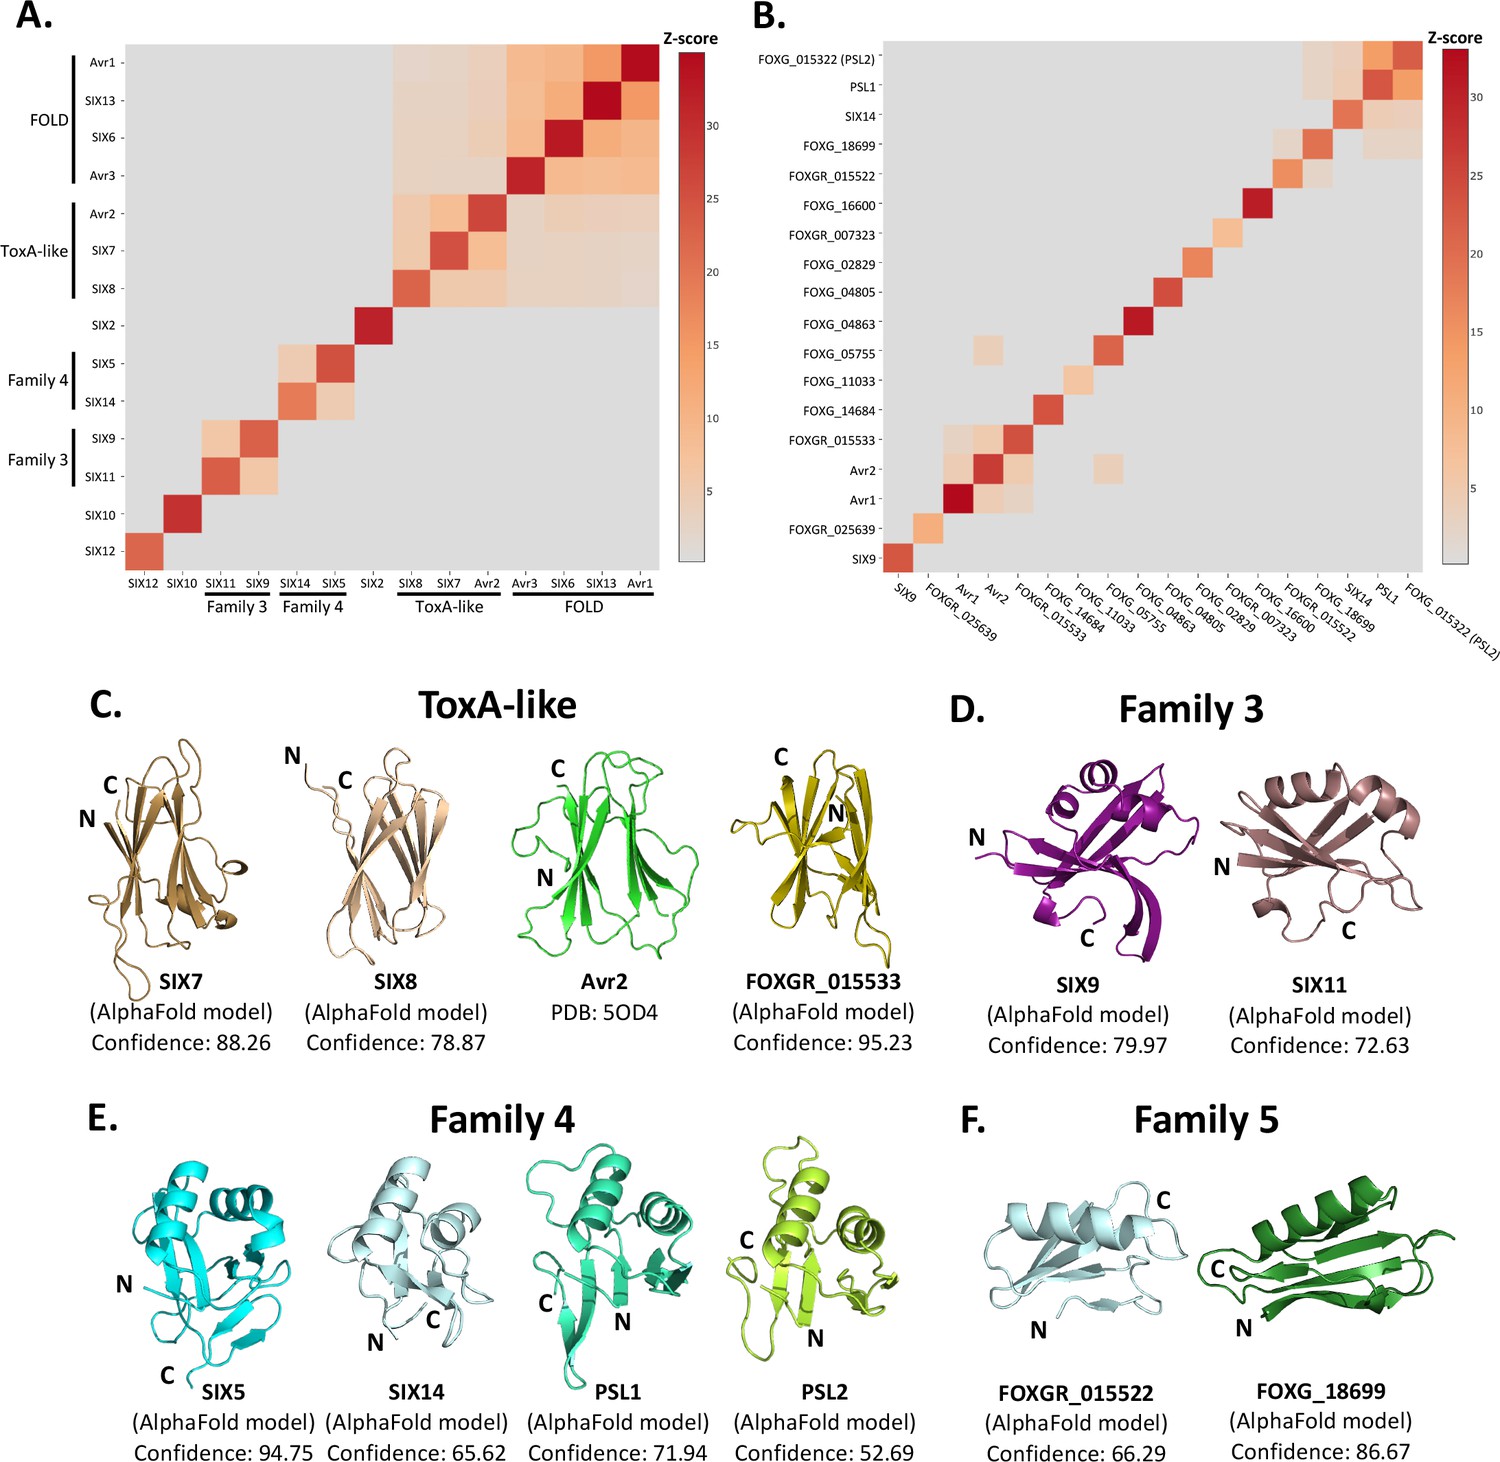
Identification of new putative structural families within the SIX effectors.
Heat maps showing the structural similarity of structures and AlphaFold2 models of the (A) SIX effectors and (B) effector candidates from Fol in a structural pairwise alignment. Amino acid boundaries that were modelled for each protein are provided in Supplementary file 3. Structural similarity was measured with Z-scores. A cutoff Z-score of 2 was applied for defining structural families. Z-score scale is shown in grey to red spectrum. (C) Cartoon representation of the ToxA-like effectors from Fol. AlphaFold2 models of SIX7, SIX8, and FOXGR_015533 effector candidate are putative members of the ToxA-like effector family. The crystal structure of Avr2 (Di et al., 2017), another member of the ToxA-like effector family, is shown in green for comparison. Cartoon representations of (D) family 3, (E) family 4, and (F) family 5 consisting of members that are predicted to be structurally similar. The N- and C-termini are labelled. Structural similarity searches were performed using the DALI server (Holm, 2022).
Figure 3—figure supplement 1
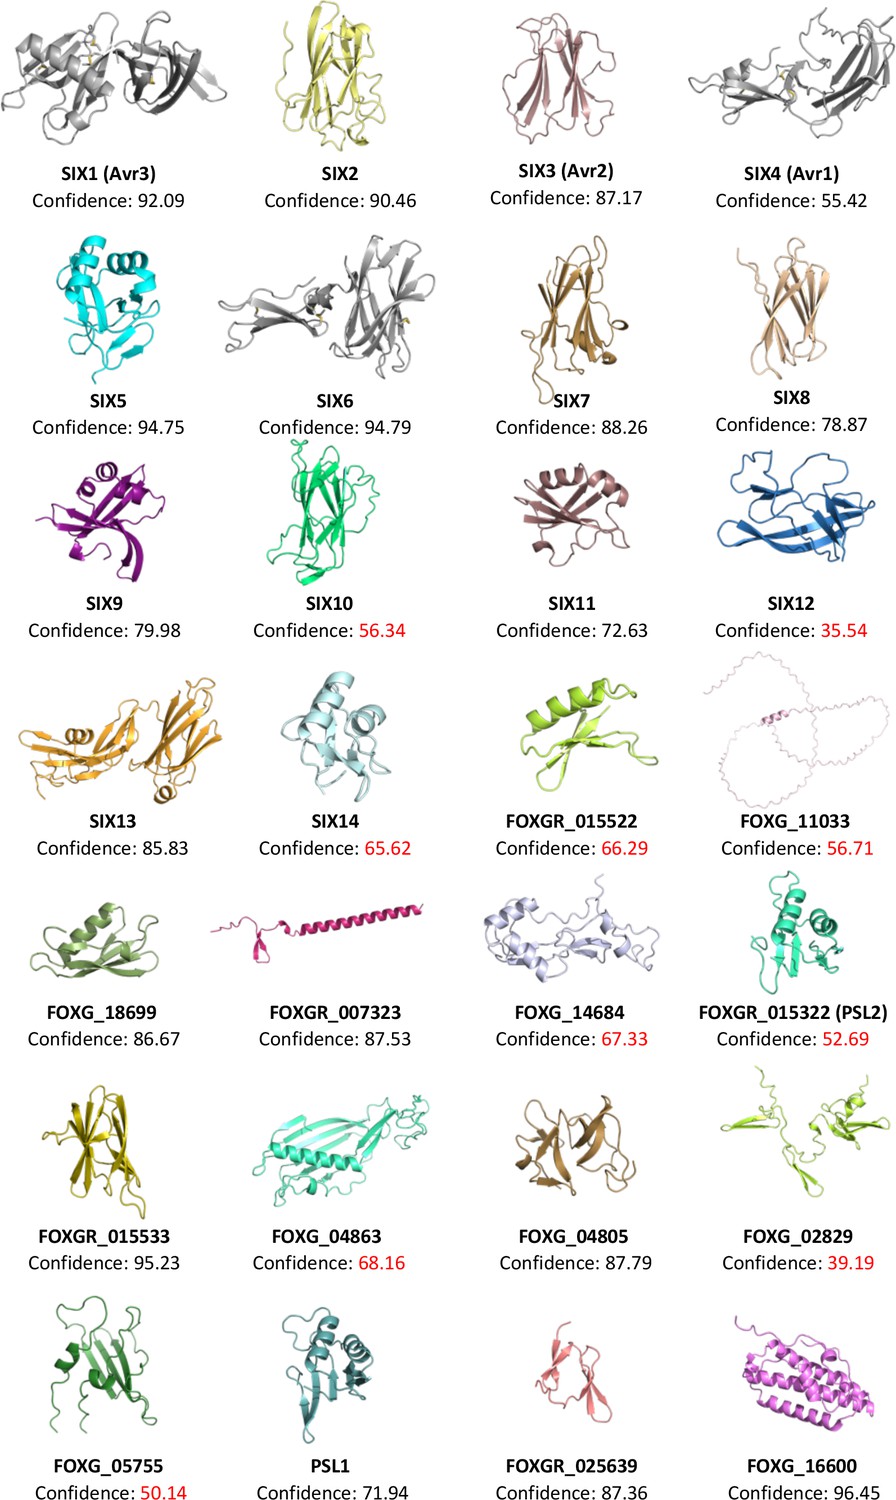
AlphaFold2 models of all SIX effectors and effector candidates.
Signal peptides were identified using SignalP-5.0 (Almagro Armenteros et al., 2019) and removed prior to amino acid sequences being input into AlphaFold2 (Jumper et al., 2021). Any putative pro-domains were identified by searching for a Kex2-like protease site (Outram et al., 2021a) and removed. The sequence inputs used can be found in Supplementary file 3.
Figure 3—figure supplement 2
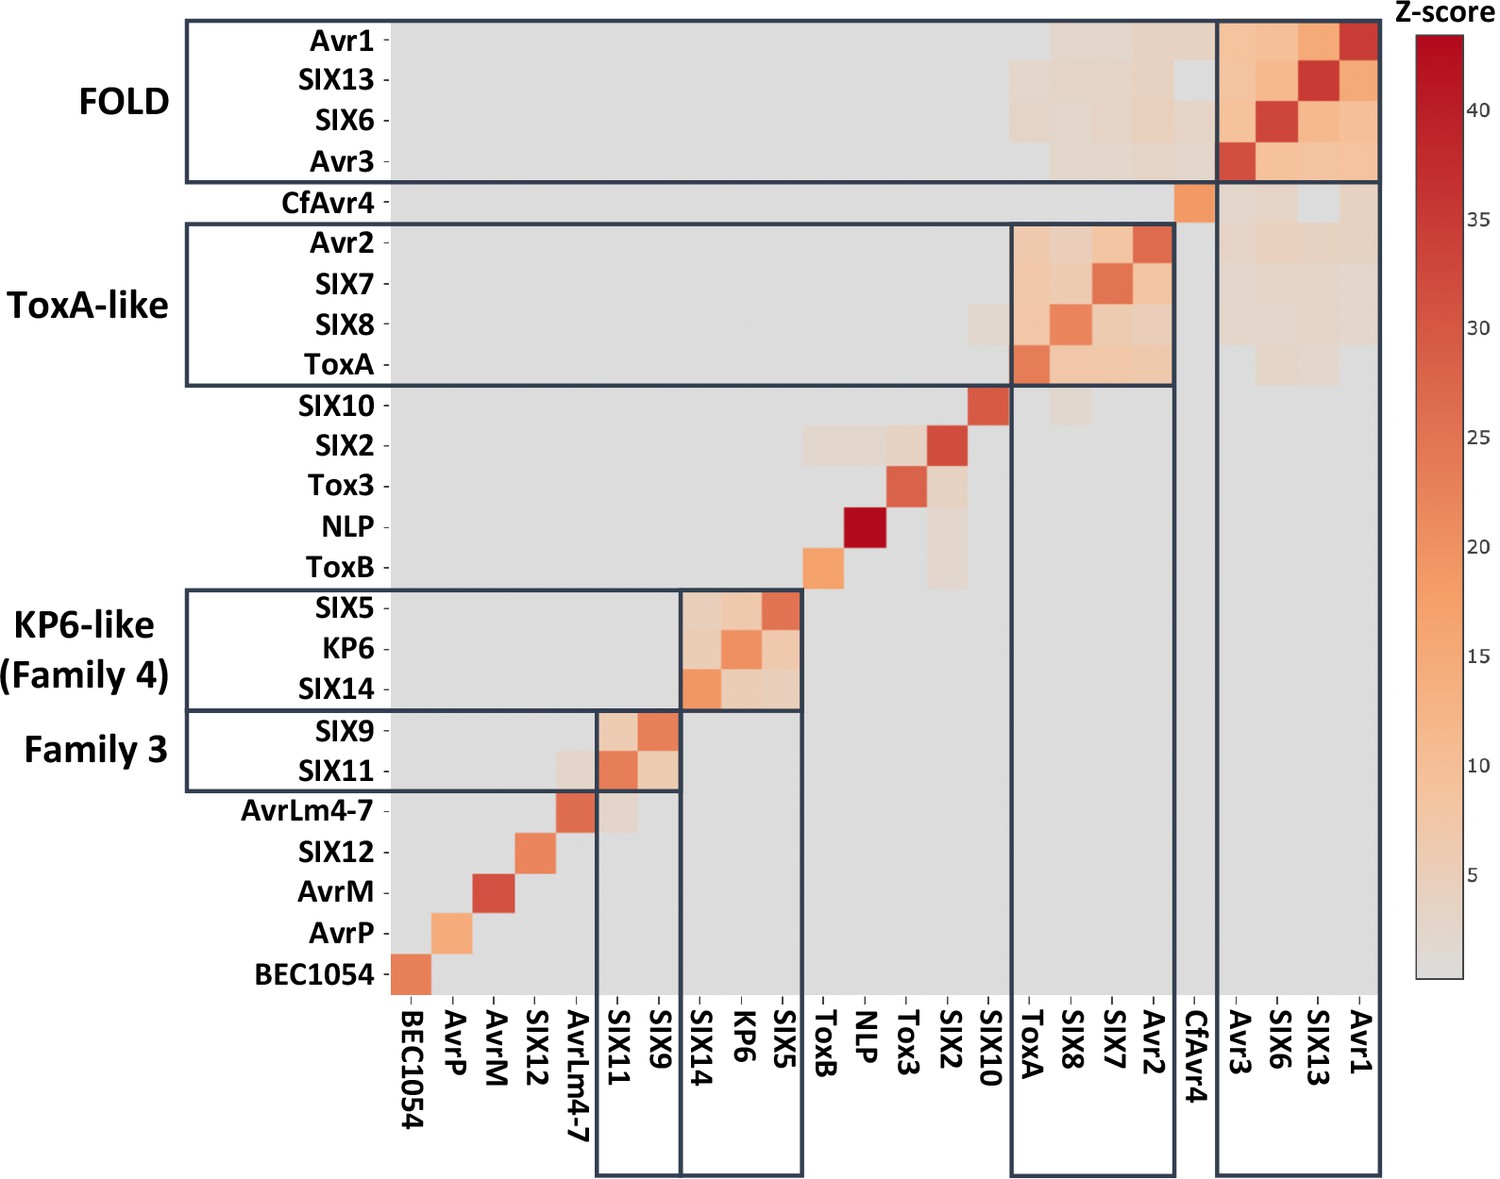
Structural similarity of SIX effectors against representative solved effector structures from known structural families.
The solved structures of Avr1, Avr2, Avr3, and SIX6, and AlphaFold2 models of the remaining SIX effectors were compared with the structures of ToxA (ToxA-like), ToxB (MAX), Tox3 (Tox3-like), BEC1054 (RALPH), AvrLm4-7 (LARS), AvrP (Zinc finger), CfAvr4 (CBM14-like), AvrM (WY-like), NLP (Actinoporin-like), and KP6 (KP6-like). Structural alignment was performed using the all against all function on the DALI server (Holm, 2022). Structural similarity was measured using Z-score. Groupings with Z-scores >2 are outlined.
Figure 3—figure supplement 3
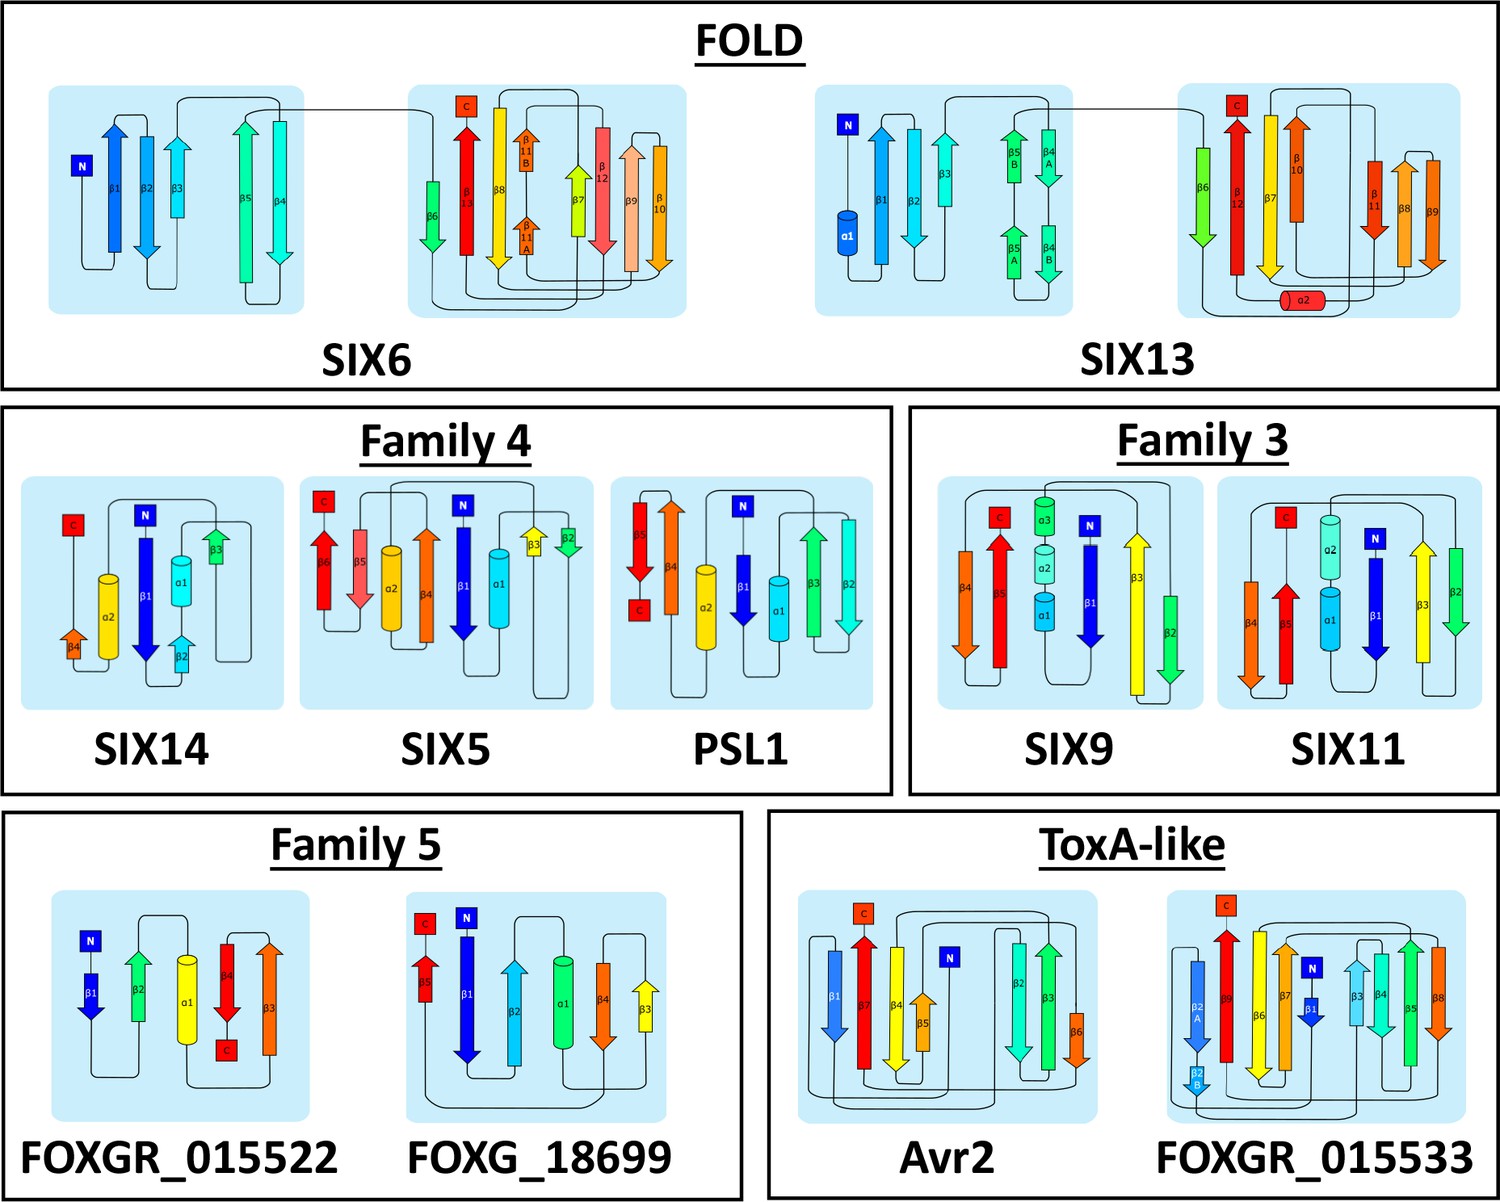
Secondary structure topology maps of the representative SIX structural family members.
Secondary topology maps of AlphaFold2 models were generated using Pro-origami (Stivala et al., 2011) and manually edited in Inkscape. The β-strands and α-helices are represented by arrows and cylinders, respectively. The secondary structural elements are coloured in rainbow, from blue at the N-terminus to red at the C-terminus.
Figure 4 with 5 supplements
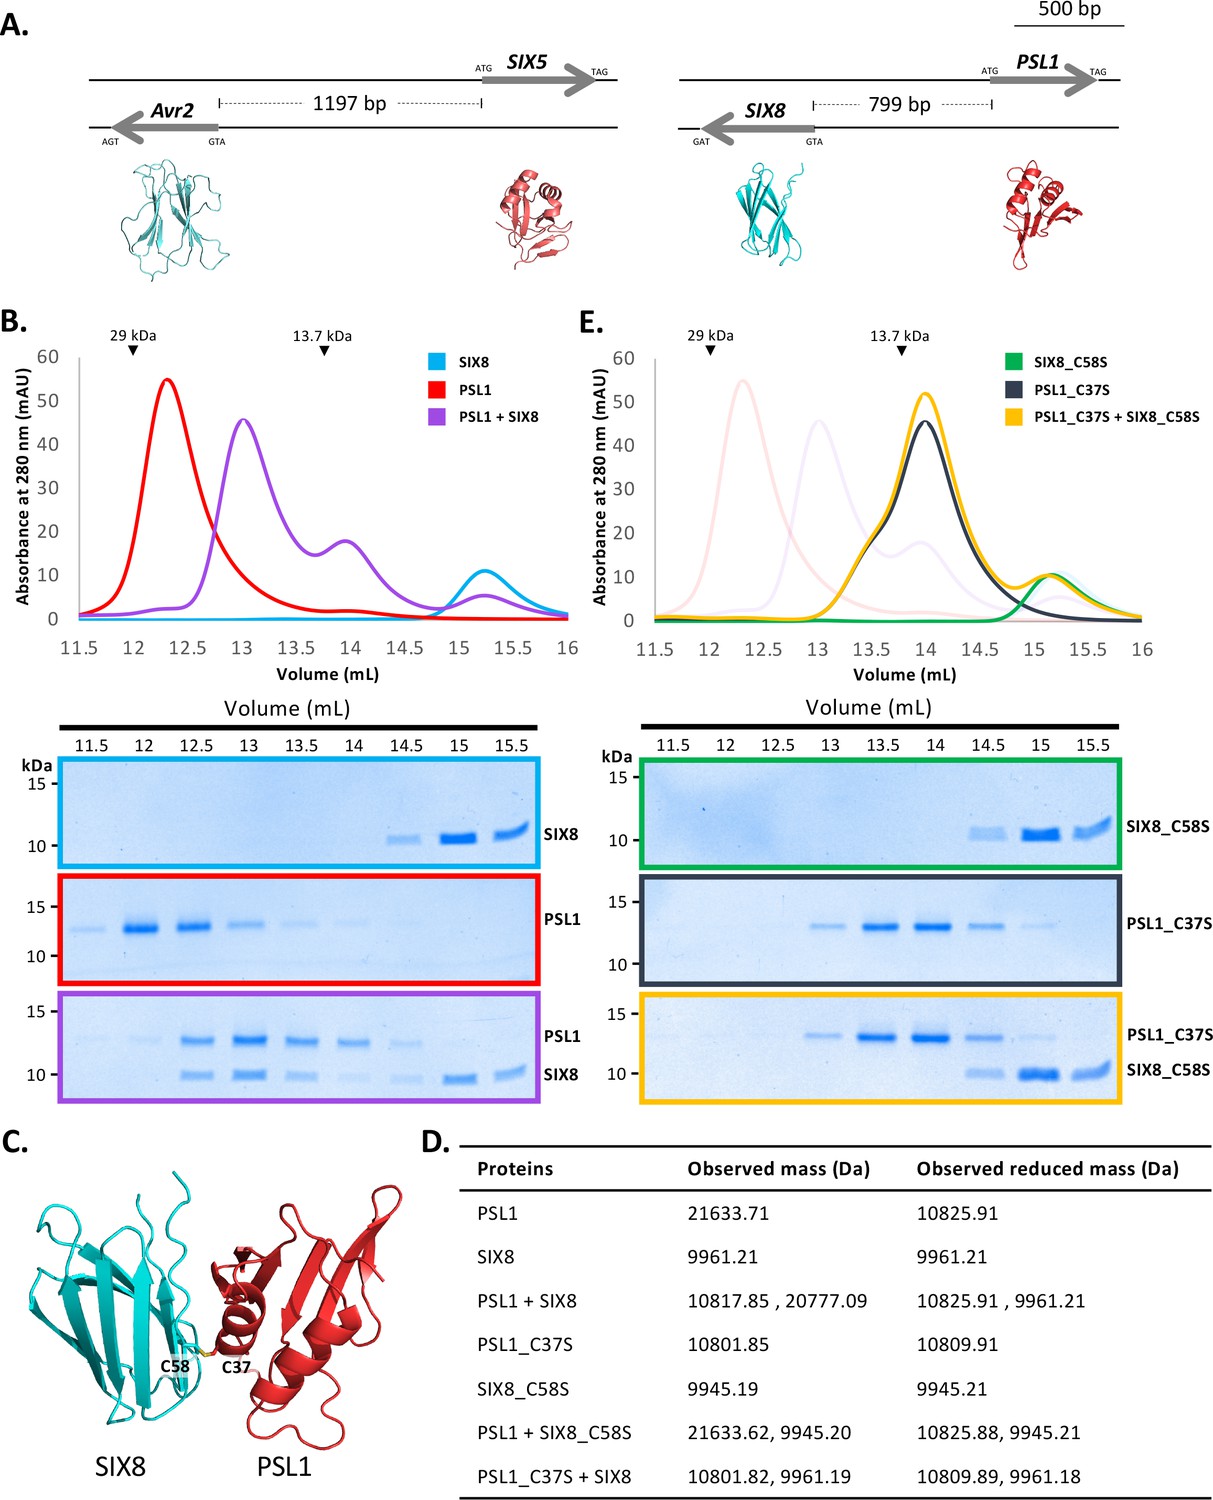
PSL1 and SIX8 interact in vitro mediated by an intermolecular disulfide bond.
(A) Schematic representation of the Avr2 (SIX3) – SIX5 and SIX8 – PSL1 loci within Fol. AlphaFold2 models or experimentally solved protein structures are shown underneath. (B) Size-exclusion chromatograms of PSL1 alone (red), SIX8 alone (blue), PSL1 and SIX8 (purple) (following a 30 min incubation) separated over a Superdex S75 Increase SEC column (top panel). Equal concentrations of the protein were used (note the absorbance of SIX8 at 280 nm is ~0.3, resulting in a smaller absorbance and peak height). Indicated sizes above the chromatogram are based on protein standards run under similar conditions as presented in the manufacturer’s column guidelines. Coomassie-stained SDS-PAGE gels depicting samples taken from 500 µL fractions corresponding to the volumes indicated above the gels, with molecular weights (left) and proteins (right) annotated (bottom panels). (C) Model of the SIX8-PSL1 complex generated by AlphaFold2-Multimer (top model shown). Co-localisation of Cys 58 from SIX8 and Cys 37 from PSL1 shown in stick form. (D) Observed masses of PSL1 and SIX8 protein mixtures by intact mass spectrometry (MS). Samples were treated with or without the reducing agent DTT prior to MS. The deconvoluted mass spectra of all proteins can be found in Figure 4—figure supplements 2–4. (E) As for (B) but with PSL1_C37S (black), SIX8_C58S (green), and PSL1_C37S and SIX8_C58S (yellow).
-
Figure 4—source data 1
Unedited and uncropped SDS-PAGE gel for Figure 4B, SIX8 alone.
- https://cdn.elifesciences.org/articles/89280/elife-89280-fig4-data1-v1.pdf
-
Figure 4—source data 2
Unedited and uncropped SDS-PAGE gel for Figure 4B, SIX8 alone, with relevant bands labelled.
- https://cdn.elifesciences.org/articles/89280/elife-89280-fig4-data2-v1.pdf
-
Figure 4—source data 3
Unedited and uncropped SDS-PAGE gel for Figure 4B, PSL1 alone.
- https://cdn.elifesciences.org/articles/89280/elife-89280-fig4-data3-v1.pdf
-
Figure 4—source data 4
Unedited and uncropped SDS-PAGE gel for Figure 4B, PSL1 alone, with relevant bands labelled.
- https://cdn.elifesciences.org/articles/89280/elife-89280-fig4-data4-v1.pdf
-
Figure 4—source data 5
Unedited and uncropped SDS-PAGE gel for Figure 4B, PSL1+SIX8.
- https://cdn.elifesciences.org/articles/89280/elife-89280-fig4-data5-v1.pdf
-
Figure 4—source data 6
Unedited and uncropped SDS-PAGE gel for Figure 4B, PSL1+SIX8, with relevant bands labelled.
- https://cdn.elifesciences.org/articles/89280/elife-89280-fig4-data6-v1.pdf
-
Figure 4—source data 7
Unedited and uncropped SDS-PAGE gel for Figure 4E, SIX8_C58S alone.
- https://cdn.elifesciences.org/articles/89280/elife-89280-fig4-data7-v1.pdf
-
Figure 4—source data 8
Unedited and uncropped SDS-PAGE gel for Figure 4E, SIX8_C58S alone, with relevant bands labelled.
- https://cdn.elifesciences.org/articles/89280/elife-89280-fig4-data8-v1.pdf
-
Figure 4—source data 9
Unedited and uncropped SDS-PAGE gel for Figure 4E, PSL1_C37S alone.
- https://cdn.elifesciences.org/articles/89280/elife-89280-fig4-data9-v1.pdf
-
Figure 4—source data 10
Unedited and uncropped SDS-PAGE gel for Figure 4E, PSL1_C37S alone, with relevant bands labelled.
- https://cdn.elifesciences.org/articles/89280/elife-89280-fig4-data10-v1.pdf
-
Figure 4—source data 11
Unedited and uncropped SDS-PAGE gel for Figure 4E, PSL1_C37S+SIX8_C58S.
- https://cdn.elifesciences.org/articles/89280/elife-89280-fig4-data11-v1.pdf
-
Figure 4—source data 12
Unedited and uncropped SDS-PAGE gel for Figure 4E, PSL1_C37S+SIX8_C58S, with relevant bands labelled.
- https://cdn.elifesciences.org/articles/89280/elife-89280-fig4-data12-v1.pdf
Figure 4—figure supplement 1
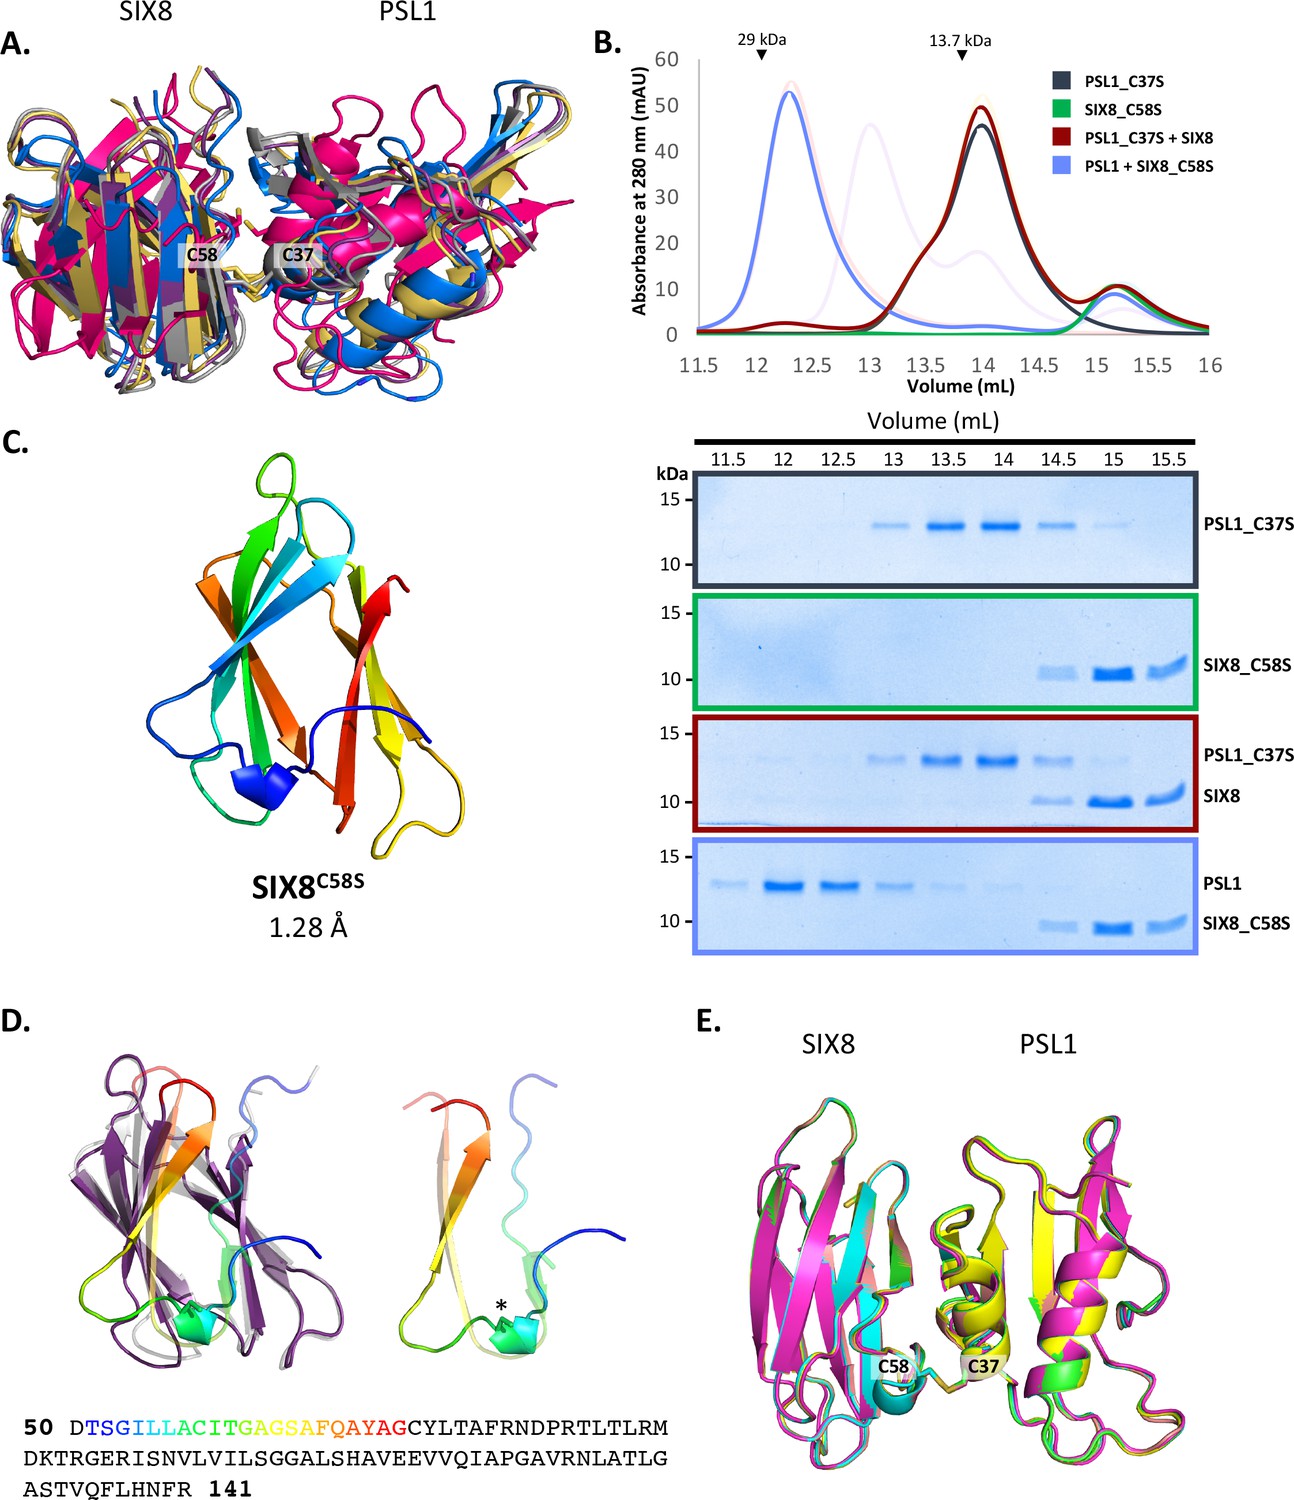
Interaction between PSL1 and SIX8 mutants.
(A) Model of the SIX8-PSL1 complex generated by AlphaFold2-Multimer (five models shown). Co-localisation of Cys 58 from SIX8 and Cys 37 from PSL1 shown in stick. (B) Size-exclusion chromatograms of PSL1_C37S alone (black), SIX8_C58S alone (green), PSL1_C37S and SIX8 (maroon), and PSL1 and SIX8_C58S (light purple) following a 30 min incubation separated on a Superdex S75 Increase 10/300 SEC column (top panel). Equal concentrations of the protein were used (note the absorbance of SIX8 at 280 nm is ~0.3, resulting in a smaller absorbance and peak height). Indicated sizes above the chromatogram are based on protein standards run under similar conditions as presented in the manufacturer’s column guidelines. Transparent peaks correspond to the size-exclusion chromatograms of PSL1 alone (red), SIX8 alone (blue), PSL1 and SIX8 (purple) found in Figure 4B. Coomassie-stained SDS-PAGE gels depicting samples taken from 500 µL fractions corresponding to the volumes indicated above the gels, with molecular weights (left) and proteins (weight) annotated (bottom panel). (C) Cartoon representation of the crystal structure of SIX8C58S at 1.28 Å resolution, coloured from N (blue) to C (red) terminus. (D) Comparison of the SIX8 structure and the AlphaFold2 model. The SIX8 structure (purple) and AlphaFold2 model (grey) were superimposed using the DALI server (top panel) (Holm, 2022). The N-terminus is coloured in rainbow. The location of C58S is shown by an asterisk. Amino acid sequence of SIX8 with residues of the N-terminus in rainbow corresponding to the structure (bottom panel). (E) Model of the SIX8-PSL1 complex generated by AlphaFold2-Multimer (five models shown), when the SIX8C58S structure was used as a template. Co-localisation of Cys 58 from SIX8 and Cys 37 from PSL1 shown in stick.
-
Figure 4—figure supplement 1—source data 1
Unedited and uncropped SDS-PAGE gel for Figure 4—figure supplement 1B, PSL1_C37S+SIX8.
- https://cdn.elifesciences.org/articles/89280/elife-89280-fig4-figsupp1-data1-v1.pdf
-
Figure 4—figure supplement 1—source data 2
Unedited and uncropped SDS-PAGE gel for Figure 4—figure supplement 1B, PSL1_C37S+SIX8, with relevant bands labelled.
- https://cdn.elifesciences.org/articles/89280/elife-89280-fig4-figsupp1-data2-v1.pdf
-
Figure 4—figure supplement 1—source data 3
Unedited and uncropped SDS-PAGE gel for Figure 4—figure supplement 1B, PSL1+SIX8_C58S.
- https://cdn.elifesciences.org/articles/89280/elife-89280-fig4-figsupp1-data3-v1.pdf
-
Figure 4—figure supplement 1—source data 4
Unedited and uncropped SDS-PAGE gel for Figure 4—figure supplement 1B, PSL1+SIX8_C58S, with relevant bands labelled.
- https://cdn.elifesciences.org/articles/89280/elife-89280-fig4-figsupp1-data4-v1.pdf
Figure 4—figure supplement 2
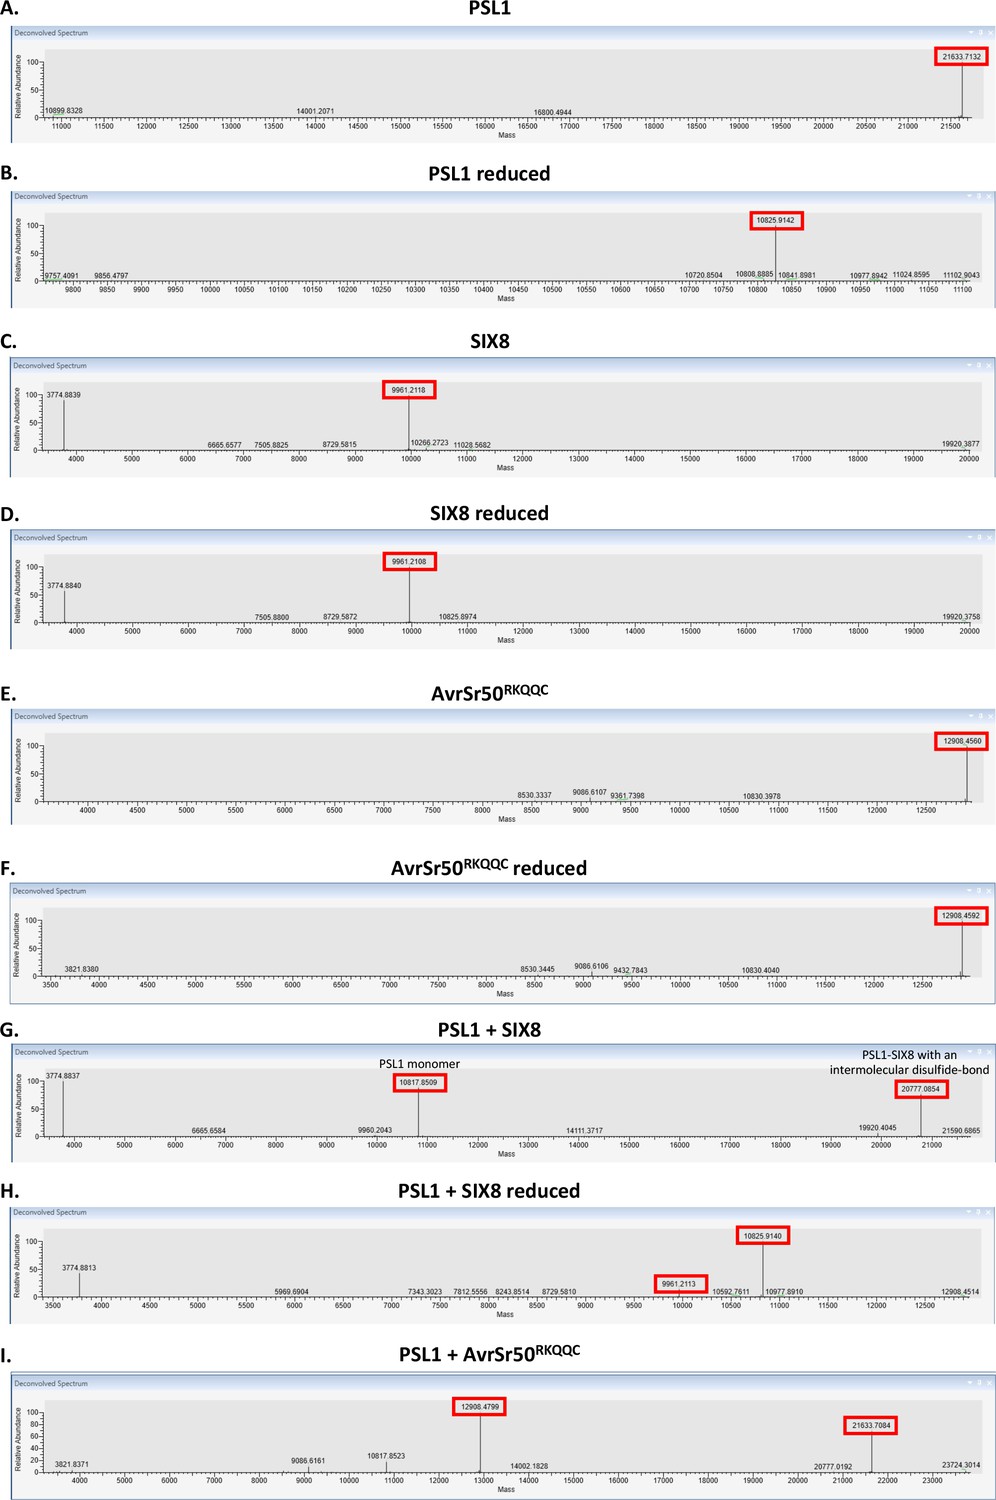
Intact mass spectrometry analysis of the PSL1-SIX8 interaction.
Deconvoluted mass spectra of (A) PSL1, (B) reduced PSL1, (C) SIX8, (D) reduced SIX8, (E) AvrSr50RKQQC, (F) reduced AvrSr50RKQQC, (G) PSL1+SIX8, (H) reduced PSL1+SIX8, and (I) PSL1+AvrSr50RKQQC.
Figure 4—figure supplement 3
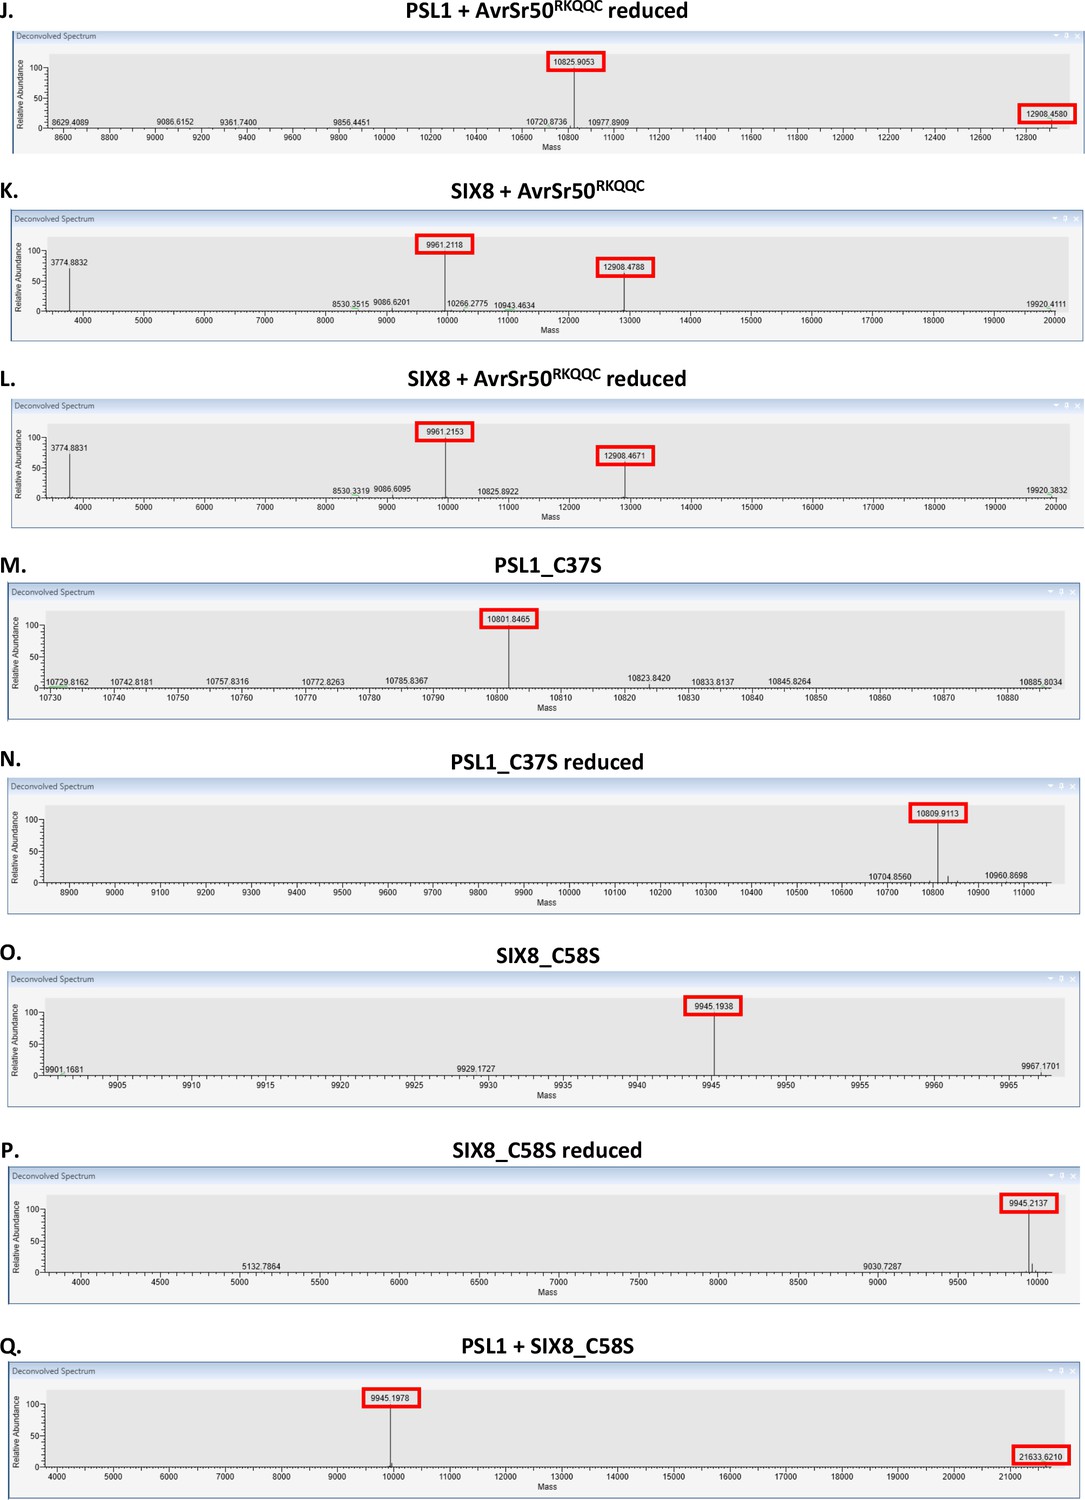
Intact mass spectrometry analysis of the PSL1-SIX8 interaction.
Deconvoluted mass spectra of (J) reduced PSL1+AvrSr50RKQQC, (K) SIX8+AvrSr50RKQQC, (L) reduced SIX8+AvrSr50RKQQC, (M) PSL1_C37S, (N) reduced PSL1_C37S, (O) SIX8_C58S, (P) reduced SIX8_C58S, and (Q) PSL1+SIX8_C58S.
Figure 4—figure supplement 4
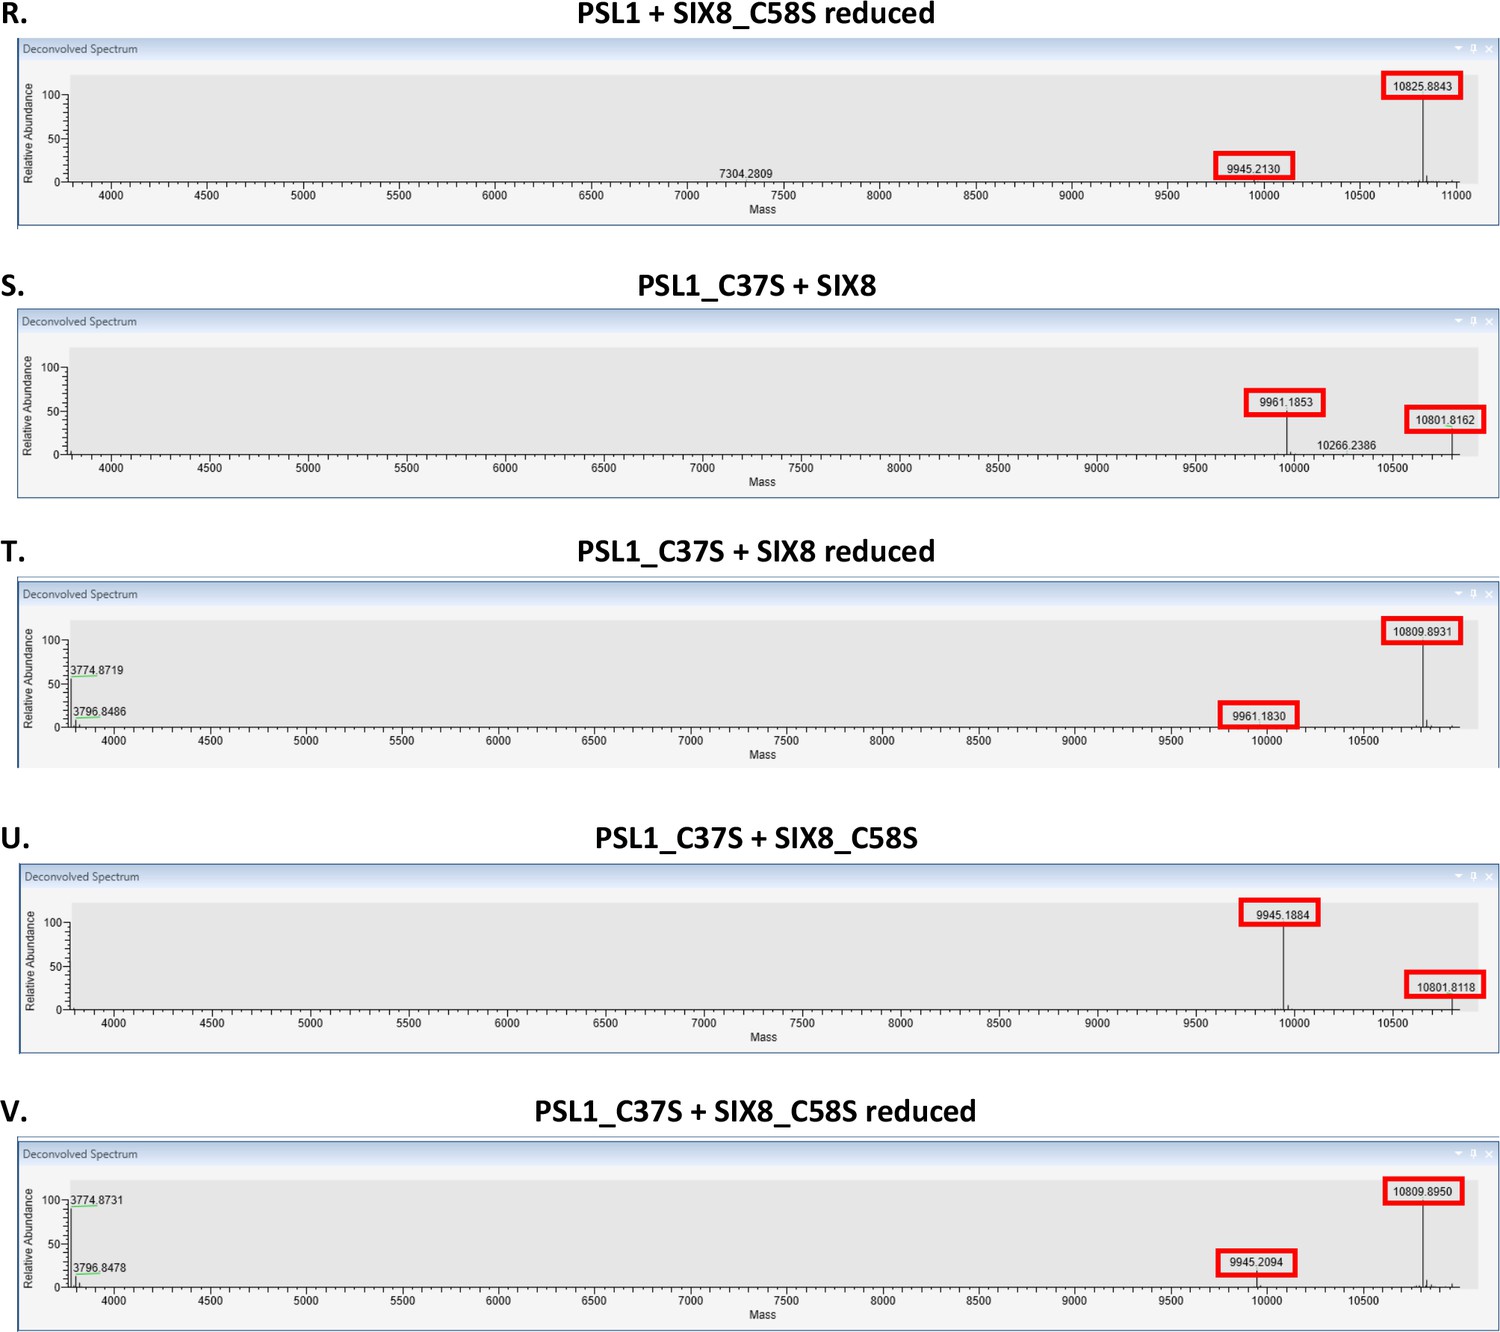
Intact mass spectrometry analysis of the PSL1-SIX8 interaction.
Deconvoluted mass spectra of (R) reduced PSL1+SIX8_C58S, (S) PSL1_C37S+SIX8, (T) reduced PSL1_C37S+SIX8, (U) PSL1_C37S+SIX8_C58S, and (V) reduced PSL1_C37S+SIX8_C58S.
Figure 4—figure supplement 5
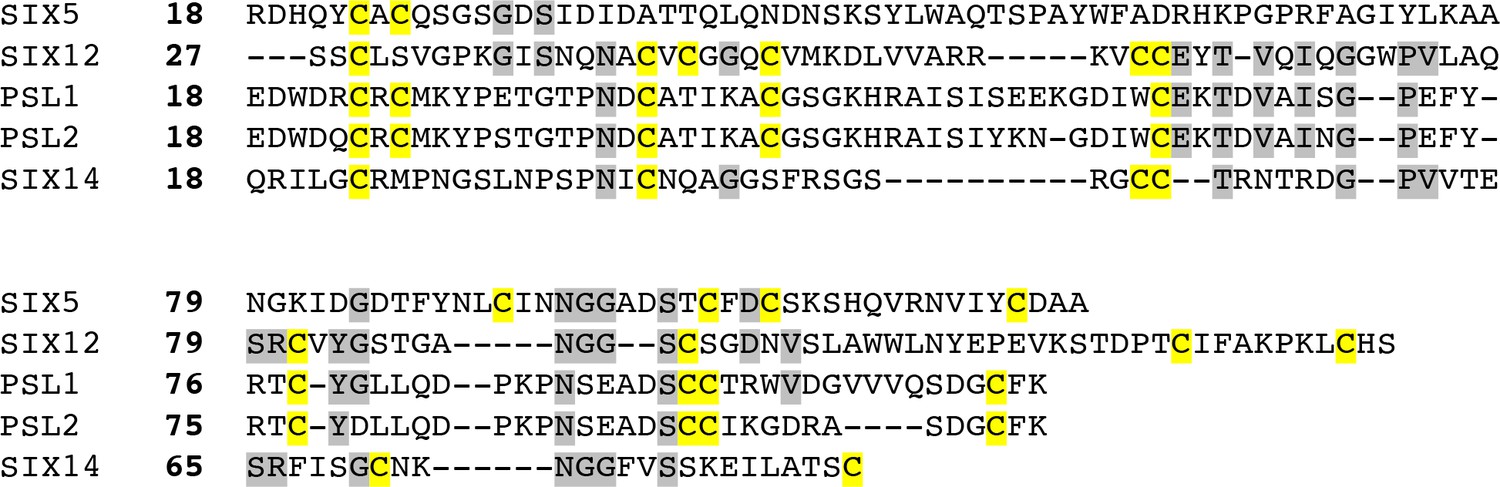
Amino acid sequence alignment of SIX12 against family 4 members reveals a similar cysteine spacing.
All protein sequences have their signal peptides removed. The cysteine residues are highlighted in yellow, and groups of two or more amino acid residues shared with SIX12 are highlighted in grey.
Figure 5 with 2 supplements
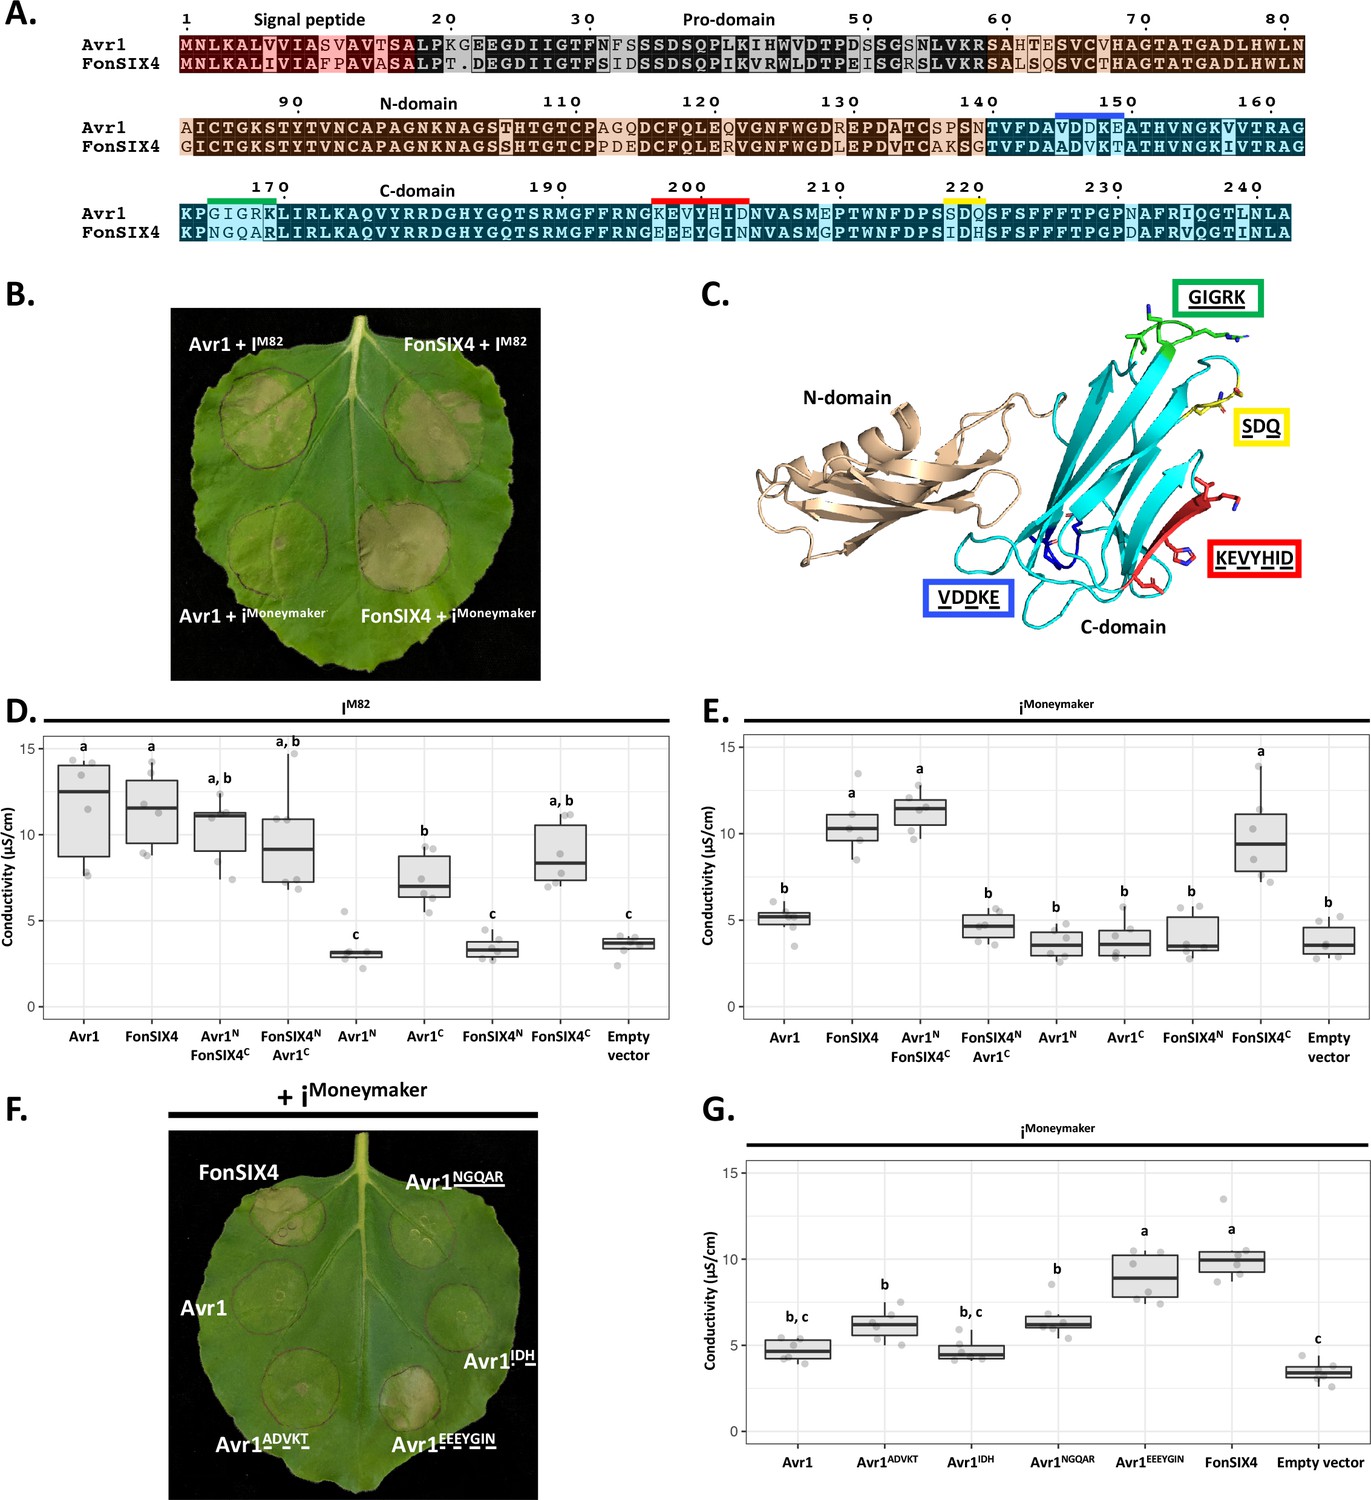
The C-domain of Avr1 mediates recognition by the I receptor.
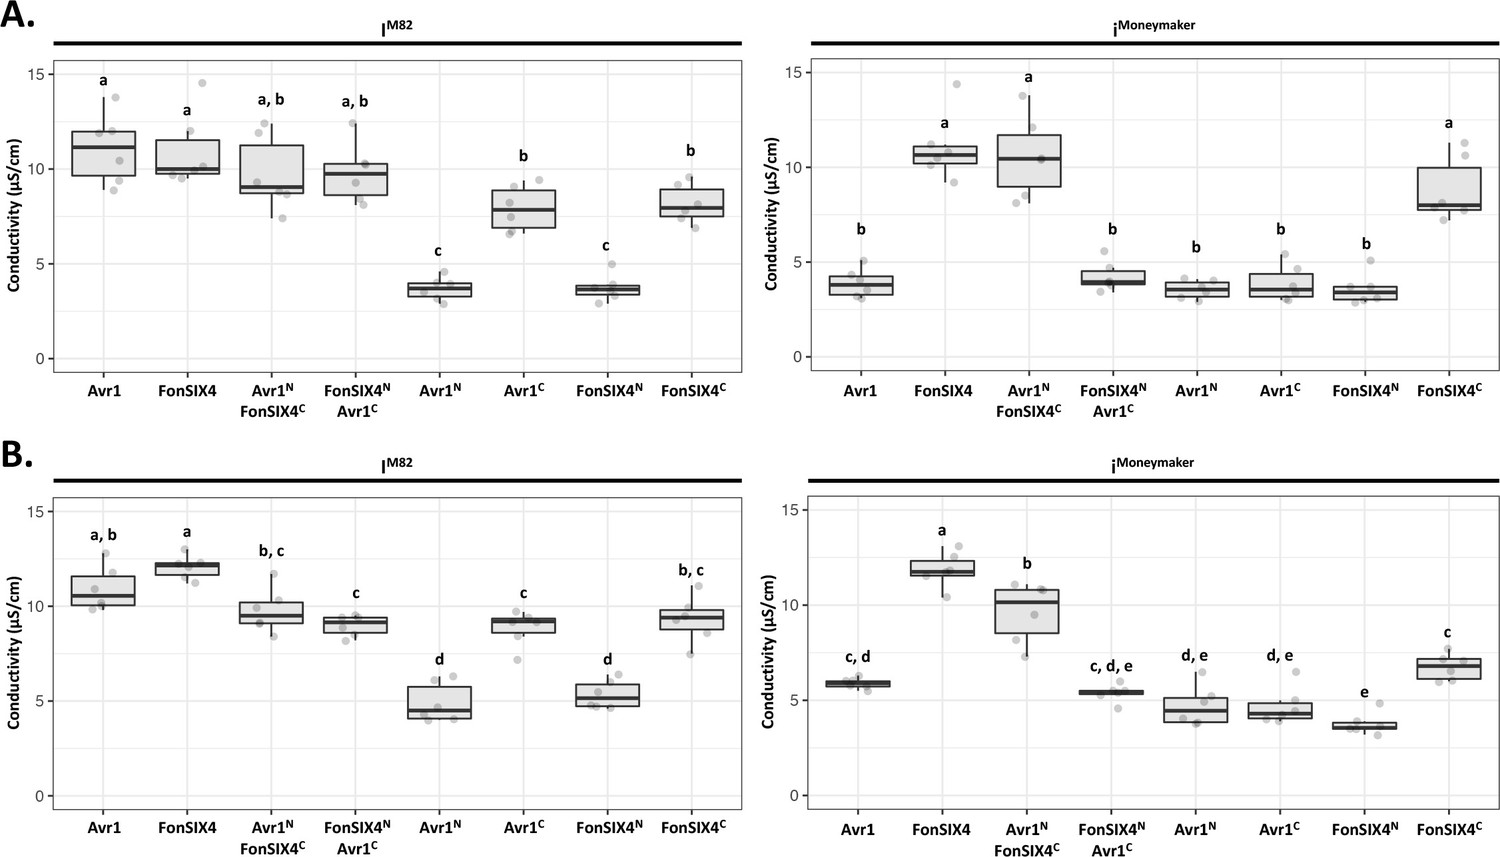
(A) Amino acid sequence alignment of Avr1 and FonSIX4, a homologue from F. oxysporum f. sp. niveum. The signal peptide, pro-domain, N-domain, and C-domain are highlighted in red, grey, beige, and blue, respectively. Within the C-domain, surface-exposed regions that differ between Avr1 and FonSIX4 are overlined. (B) Avr1 and FonSIX4 were transiently expressed in Nicotiana benthamiana with either IM82 or iMoneymaker via Agrobacterium-mediated transformation (n = 6). (C) The crystal structure of Avr1, showing the N- and C-domains in beige and light blue, respectively as represented in (A). Regions containing variant residues within the C-domain between Avr1 and FonSIX4 are coloured corresponding to the overlined colours in (A). Variant residues are underlined and represented in stick form. (D) Ion leakage conductivity of the Avr1 and FonSIX4 chimeric constructs, and N- and C-domains individually, when transiently co-expressed with IM82 or (E) iMoneymaker. Two additional independent experiments were repeated with similar results (Figure 5—figure supplement 2). (F) Leaf image and (G) ion leakage quantification of the Avr1 mutants (Avr1ADVKT, Avr1NGQAR, Avr1IDH, Avr1EEEYGIN) when transiently co-expressed with iMoneymaker (n = 6). Variant residues between Avr1 and FonSIX4 are underlined. Six biological replicates for each construct were measured using an ion leakage assay. One-way ANOVA and post hoc Tukey’s honestly significant difference tests were performed. Treatments that do not share a letter are significantly different from each other at p<0.05. Leaves were imaged 5 days post infiltration (dpi).
-
Figure 5—source data 1
Conductivity measurements for Figure 5D.
- https://cdn.elifesciences.org/articles/89280/elife-89280-fig5-data1-v1.zip
-
Figure 5—source data 2
Conductivity measurements for Figure 5E.
- https://cdn.elifesciences.org/articles/89280/elife-89280-fig5-data2-v1.zip
-
Figure 5—source data 3
Conductivity measurements for Figure 5G.
- https://cdn.elifesciences.org/articles/89280/elife-89280-fig5-data3-v1.zip
Figure 5—figure supplement 1
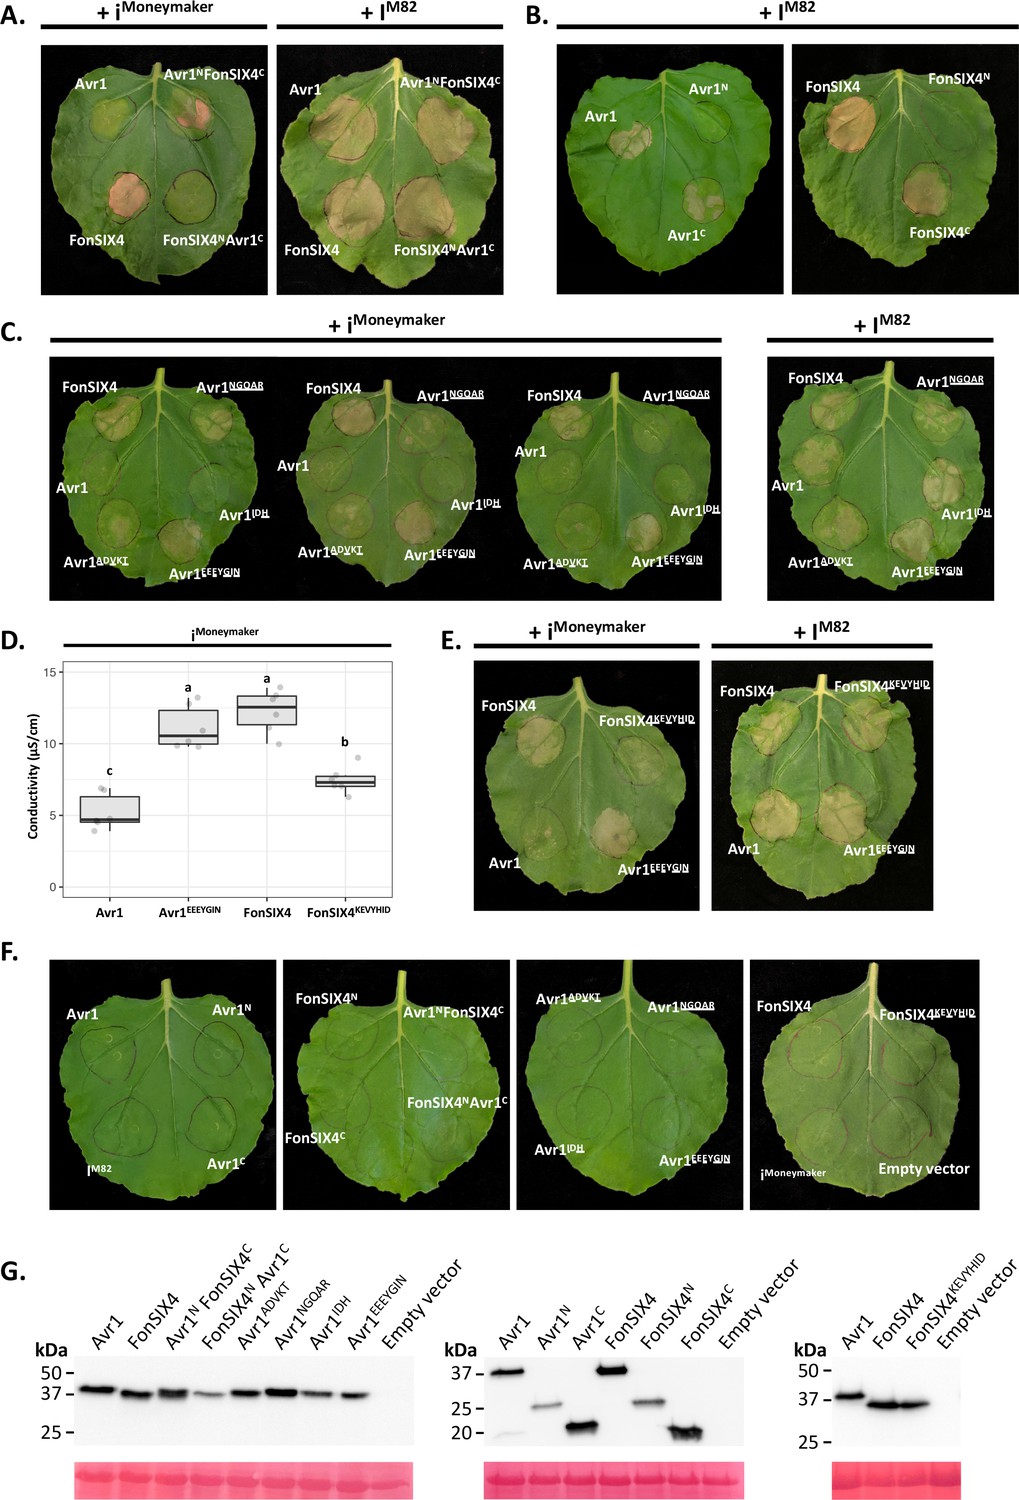
I receptor recognition of Avr1 and FonSIX4 mutants in N. benthamiana.
(A) iMoneymaker recognises FonSIX4 at the C-domain. N and C-domain-swapped chimeras of Avr1 and FonSIX4 are expressed with iMoneymaker (left panel) and IM82 (right panel). (B) The C-domains of Avr1 and FonSIX4 are sufficient for IM82 recognition. N and C-domains of Avr1 (left panel) and FonSIX4 (right panel) are expressed with IM82. (C) Variation in the recognition response of Avr1 mutants by iMoneymaker. Avr1 mutants (Avr1ADVKT, Avr1NGQAR, Avr1IDH, Avr1EEEYGIN) are co-expressed with iMoneymaker (left panel) or IM82 (right panel). (D) Ion leakage quantification of the reciprocal Avr1EEEYGIN and FonSIX4KEVYHID mutants when transiently co-expressed with iMoneymaker. (E) Leaf images of Avr1EEEYGIN and FonSIX4KEVYHID mutants transiently co-expressed with iMoneymaker (left panel) or IM82 (right panel). Polymorphic residues between Avr1 and FonSIX4 are underlined. (F) Effectors and receptors expressed alone do not cause cell death in N. benthamiana. All Avr1, FonSIX4 effectors and I receptors were transiently expressed in N. benthamiana via Agrobacterium-mediated transformation. Six biological replicates were assessed for all qualitative assessment of I receptor-mediated cell death in N. benthamiana. All leaves were imaged 4–7 days post infiltration (dpi). (G) Western blots of Avr1 and FonSIX4 constructs with a C-terminal HA tag. Total proteins were extracted from N. benthamiana leaves 3 dpi and separated by SDS-PAGE. The samples were transferred onto a membrane, probed anti-HA antibodies, and analysed under a chemiluminescence imager. The membrane was stained with Ponceau S to show equal sample loading.
-
Figure 5—figure supplement 1—source data 1
Unedited and uncropped blot for Figure 5—figure supplement 1G, western blots of Avr1 and FonSIX4 constructs with a C-terminal HA tag (Avr1, FonSIX4, Avr1N FonSIX4C, FonSIX4N Avr1C, Avr1ADVKT, Avr1NGQAR, Avr1IDH, Avr1EEEYGIN, and Empty vector).
- https://cdn.elifesciences.org/articles/89280/elife-89280-fig5-figsupp1-data1-v1.pdf
-
Figure 5—figure supplement 1—source data 2
Unedited and uncropped blot for Figure 5—figure supplement 1G, western blots of Avr1 and FonSIX4 constructs with a C-terminal HA tag (Avr1, FonSIX4, Avr1N FonSIX4C, FonSIX4N Avr1C, Avr1ADVKT, Avr1NGQAR, Avr1IDH, Avr1EEEYGIN, and Empty vector), with relevant bands labelled.
- https://cdn.elifesciences.org/articles/89280/elife-89280-fig5-figsupp1-data2-v1.pdf
-
Figure 5—figure supplement 1—source data 3
Unedited and uncropped blot for Figure 5—figure supplement 1G, Ponceau-stained membrane of Avr1 and FonSIX4 constructs with a C-terminal HA tag (Avr1, FonSIX4, Avr1N FonSIX4C, FonSIX4N Avr1C, Avr1ADVKT, Avr1NGQAR, Avr1IDH, Avr1EEEYGIN, and Empty vector).
- https://cdn.elifesciences.org/articles/89280/elife-89280-fig5-figsupp1-data3-v1.pdf
-
Figure 5—figure supplement 1—source data 4
Unedited and uncropped blot for Figure 5—figure supplement 1G, Ponceau-stained membrane of Avr1 and FonSIX4 constructs with a C-terminal HA tag (Avr1, FonSIX4, Avr1N FonSIX4C, FonSIX4N Avr1C, Avr1ADVKT, Avr1NGQAR, Avr1IDH, Avr1EEEYGIN, and Empty vector), with relevant bands labelled.
- https://cdn.elifesciences.org/articles/89280/elife-89280-fig5-figsupp1-data4-v1.pdf
-
Figure 5—figure supplement 1—source data 5
Unedited and uncropped blot for Figure 5—figure supplement 1G, western blots of Avr1 and FonSIX4 constructs with a C-terminal HA tag (Avr1, Avr1N, Avr1C, FonSIX4, FonSIX4N, FonSIX4C, and Empty vector).
- https://cdn.elifesciences.org/articles/89280/elife-89280-fig5-figsupp1-data5-v1.pdf
-
Figure 5—figure supplement 1—source data 6
Unedited and uncropped blot for Figure 5—figure supplement 1G, western blots of Avr1 and FonSIX4 constructs with a C-terminal HA tag (Avr1, Avr1N, Avr1C, FonSIX4, FonSIX4N, FonSIX4C, and Empty vector), with relevant bands labelled.
- https://cdn.elifesciences.org/articles/89280/elife-89280-fig5-figsupp1-data6-v1.pdf
-
Figure 5—figure supplement 1—source data 7
Unedited and uncropped blot for Figure 5—figure supplement 1G, Ponceau-stained membrane of Avr1 and FonSIX4 constructs with a C-terminal HA tag (Avr1, Avr1N, Avr1C, FonSIX4, FonSIX4N, FonSIX4C, and Empty vector).
- https://cdn.elifesciences.org/articles/89280/elife-89280-fig5-figsupp1-data7-v1.pdf
-
Figure 5—figure supplement 1—source data 8
Unedited and uncropped blot for Figure 5—figure supplement 1G, Ponceau-stained membrane of Avr1 and FonSIX4 constructs with a C-terminal HA tag (Avr1, Avr1N, Avr1C, FonSIX4, FonSIX4N, FonSIX4C, and Empty vector), with relevant bands labelled.
- https://cdn.elifesciences.org/articles/89280/elife-89280-fig5-figsupp1-data8-v1.pdf
-
Figure 5—figure supplement 1—source data 9
Unedited and uncropped blot for Figure 5—figure supplement 1G, western blots of Avr1 and FonSIX4 constructs with a C-terminal HA tag (Avr1, FonSIX4, FonSIX4KEVYHID, and Empty vector).
- https://cdn.elifesciences.org/articles/89280/elife-89280-fig5-figsupp1-data9-v1.pdf
-
Figure 5—figure supplement 1—source data 10
Unedited and uncropped blot for Figure 5—figure supplement 1G, western blots of Avr1 and FonSIX4 constructs with a C-terminal HA tag (Avr1, FonSIX4, FonSIX4KEVYHID, and Empty vector), with relevant bands labelled.
- https://cdn.elifesciences.org/articles/89280/elife-89280-fig5-figsupp1-data10-v1.pdf
-
Figure 5—figure supplement 1—source data 11
Unedited and uncropped blot for Figure 5—figure supplement 1G, Ponceau-stained membrane of Avr1 and FonSIX4 constructs with a C-terminal HA tag (Avr1, FonSIX4, FonSIX4KEVYHID, and Empty vector).
- https://cdn.elifesciences.org/articles/89280/elife-89280-fig5-figsupp1-data11-v1.pdf
-
Figure 5—figure supplement 1—source data 12
Unedited and uncropped blot for Figure 5—figure supplement 1G, Ponceau-stained membrane of Avr1 and FonSIX4 constructs with a C-terminal HA tag (Avr1, FonSIX4, FonSIX4KEVYHID, and Empty vector), with relevant bands labelled.
- https://cdn.elifesciences.org/articles/89280/elife-89280-fig5-figsupp1-data12-v1.pdf
-
Figure 5—figure supplement 1—source data 13
Conductivity measurements for Figure 5—figure supplement 1D.
- https://cdn.elifesciences.org/articles/89280/elife-89280-fig5-figsupp1-data13-v1.zip
Figure 5—figure supplement 2
Ion leakage conductivity of different Avr1 and FonSIX4 chimeras expressed with IM82 or iMoneymaker.
(A, B) Independent ion leakage experiments of different Avr1 and FonSIX4 constructs expressed with IM82 or iMoneymaker. Avr1 and FonSIX4 effector constructs were transiently expressed with IM82 (left panels) or iMoneymaker (right panels) via Agrobacterium-mediated transformation in N. benthamiana. Six biological replicates each consisting of three leaf discs per leaf were harvested 24 hr post infiltration and incubated in water for 30 min. The water was replaced and the conductivity was measured after 24–48 hr. One-way ANOVA and post hoc Tukey’s honestly significant difference tests were performed. Treatments that do not share a letter are significantly different from each other at p<0.05.
-
Figure 5—figure supplement 2—source data 1
Conductivity measurements for Figure 5—figure supplement 2A, left panel.
- https://cdn.elifesciences.org/articles/89280/elife-89280-fig5-figsupp2-data1-v1.zip
-
Figure 5—figure supplement 2—source data 2
Conductivity measurements for Figure 5—figure supplement 2A, right panel.
- https://cdn.elifesciences.org/articles/89280/elife-89280-fig5-figsupp2-data2-v1.zip
-
Figure 5—figure supplement 2—source data 3
Conductivity measurements for Figure 5—figure supplement 2B, left panel.
- https://cdn.elifesciences.org/articles/89280/elife-89280-fig5-figsupp2-data3-v1.zip
-
Figure 5—figure supplement 2—source data 4
Conductivity measurements for Figure 5—figure supplement 2B, right panel.
- https://cdn.elifesciences.org/articles/89280/elife-89280-fig5-figsupp2-data4-v1.zip
Additional files
-
Supplementary file 1
X-ray data collection, structure solution, and refinement statistics for Avr1, Avr3, SIX6, and SIX8.
- https://cdn.elifesciences.org/articles/89280/elife-89280-supp1-v1.docx
-
Supplementary file 2
Putative fungal FOLD effectors identified using the Foldseek webserver.
- https://cdn.elifesciences.org/articles/89280/elife-89280-supp2-v1.xlsx
-
Supplementary file 3
Amino acid sequence inputs for AlphaFold2.
- https://cdn.elifesciences.org/articles/89280/elife-89280-supp3-v1.docx
-
Supplementary file 4
DNA sequences of synthesised gene fragments used in this study.
- https://cdn.elifesciences.org/articles/89280/elife-89280-supp4-v1.docx
-
Supplementary file 5
Primers used in this study.
- https://cdn.elifesciences.org/articles/89280/elife-89280-supp5-v1.docx
-
Source data 1
AlphaFold2 pdb files generated.
- https://cdn.elifesciences.org/articles/89280/elife-89280-data1-v1.zip
-
MDAR checklist
- https://cdn.elifesciences.org/articles/89280/elife-89280-mdarchecklist1-v1.docx
Download links
A two-part list of links to download the article, or parts of the article, in various formats.
Downloads (link to download the article as PDF)
Open citations (links to open the citations from this article in various online reference manager services)
Cite this article (links to download the citations from this article in formats compatible with various reference manager tools)
The structural repertoire of Fusarium oxysporum f. sp. lycopersici effectors revealed by experimental and computational studies
eLife 12:RP89280.
https://doi.org/10.7554/eLife.89280.3


