Nucleotide binding to the ATP-cone in anaerobic ribonucleotide reductases allosterically regulates activity by modulating substrate binding
- Department of Biochemistry and Biophysics, Stockholm University, Sweden
- Section for Biochemistry and Structural Biology, Centre for Molecular Protein Science, Department of Chemistry, Lund University, Sweden
- Department of Chemistry - Ångström Laboratory, Uppsala University, Sweden
- Structural Proteomics, SciLifeLab, Lund University, Sweden
- Cryo-EM for Life Science, SciLifeLab, Lund University, Sweden
Figures
Figure 1 with 2 supplements
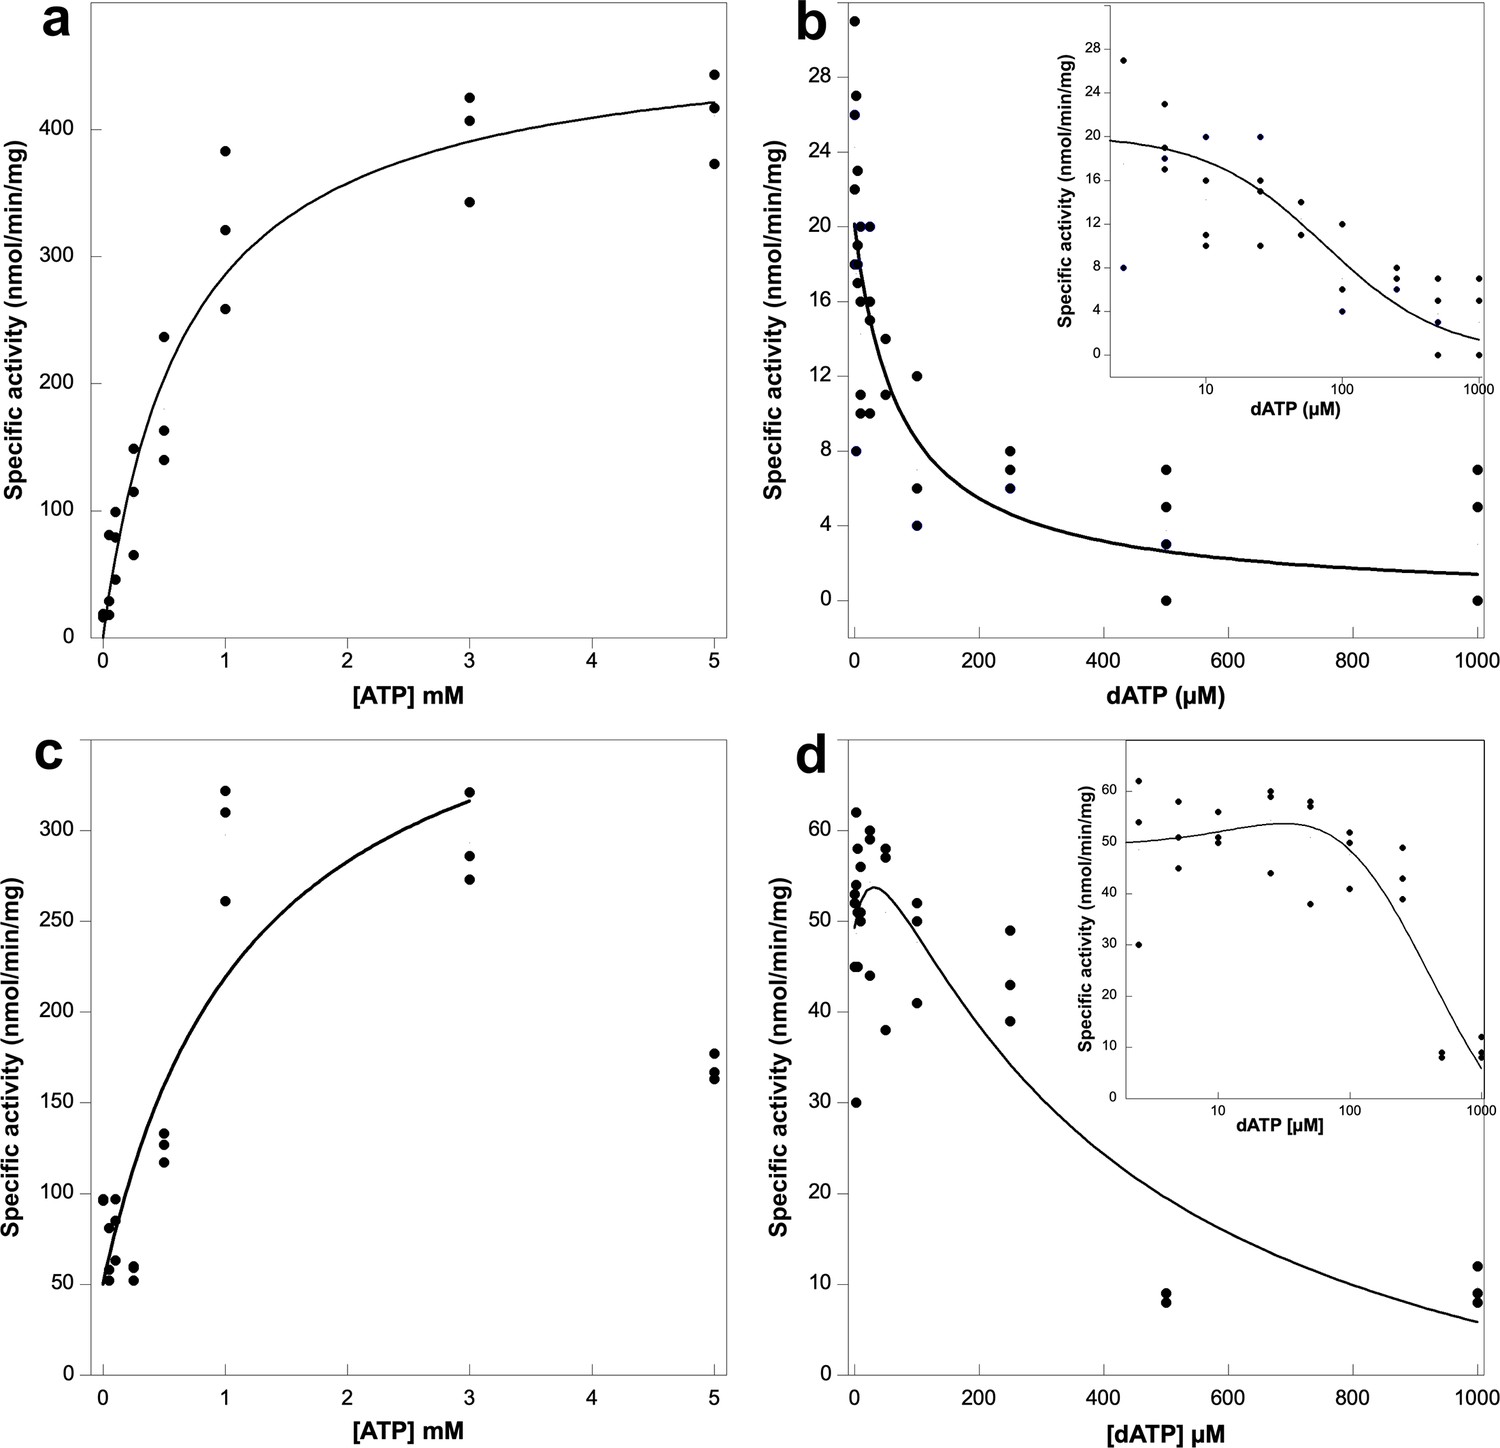
Activity assays of Prevotella copri NrdD in the presence of ATP or dATP.
A 2.5-fold excess of holoNrdG over apoNrdD was used to study the allosteric regulation effect of ATP and dATP on the a-site. GTP reduction was monitored with 1 mM dTTP as effector in the s-site and titrated with ATP (a) or dATP (b) in the a-site. Cytidine triphosphate (CTP) reduction assays were titrated with ATP (c) or dATP (d), in this case acting both as s-site effectors and a-site regulators. Experiments were performed in triplicate for (a), (c), and (d) and with four replicates for (b). Insets in panels (b) and (d) show the results plotted in log scale. Curve fits for calculation of KL and Ki used Equations 1 and 2, respectively, given in Materials and methods, and in (d) Equation 3. Curve fits for (c) and (d) used a start activity of 50 nmol/min/mg, and in (c) only results for 0–3 mM ATP were used. The R values for curve fits in panels (a–d) were 0.99, 0.95, 0.83, and 0.96, respectively.
Figure 1—figure supplement 1

Formate requirement in PcNrdD.
KaleidaGraph curve fit using the Michaelis–Menten equation.
Figure 1—figure supplement 2
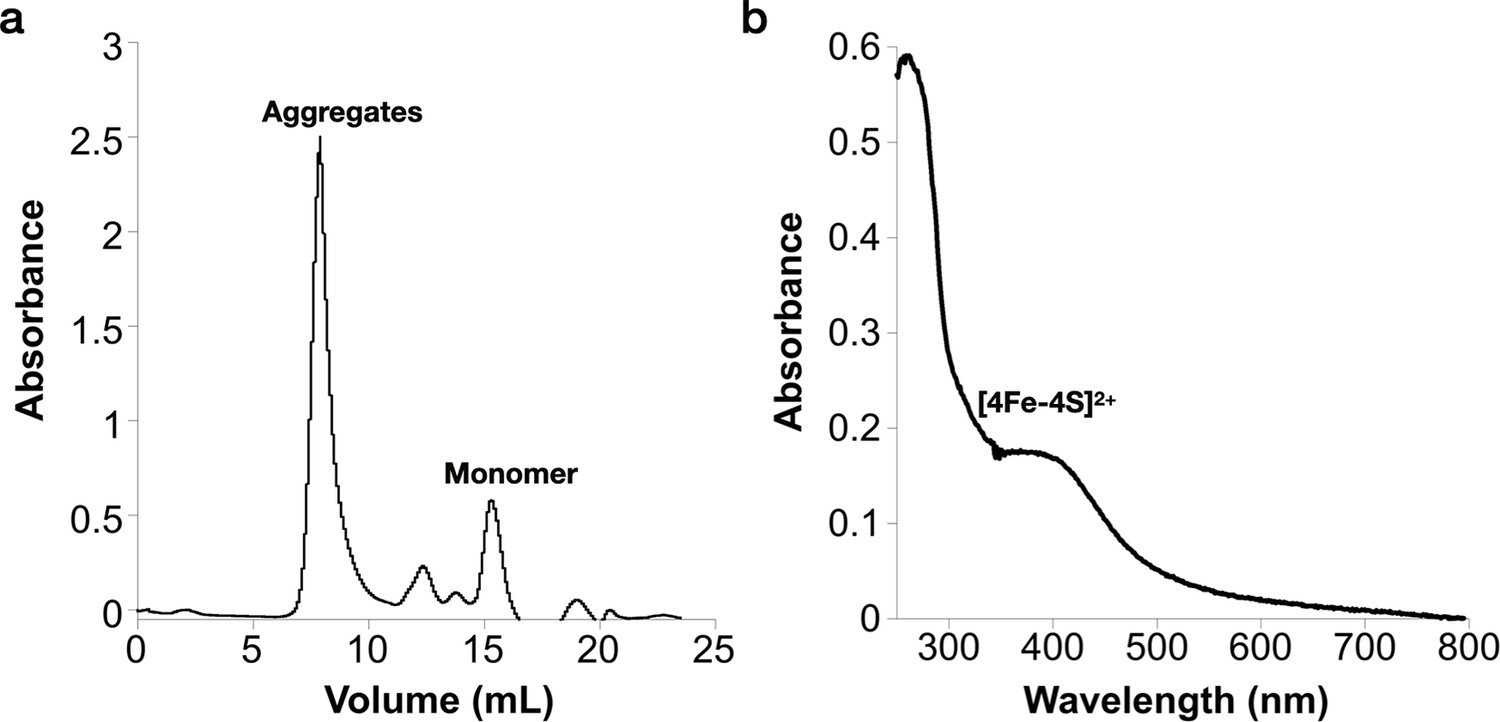
Reconstitution of the [Fe–S] cluster of the Prevotella copri NrdG.
(a) Reconstituted holo-PcNrdG loaded in a Superdex S200 10/300 and isolation of PcNrdG monomer. (b) UV–visible spectrum of the monomer peak of holo-PcNrdG.
Figure 2
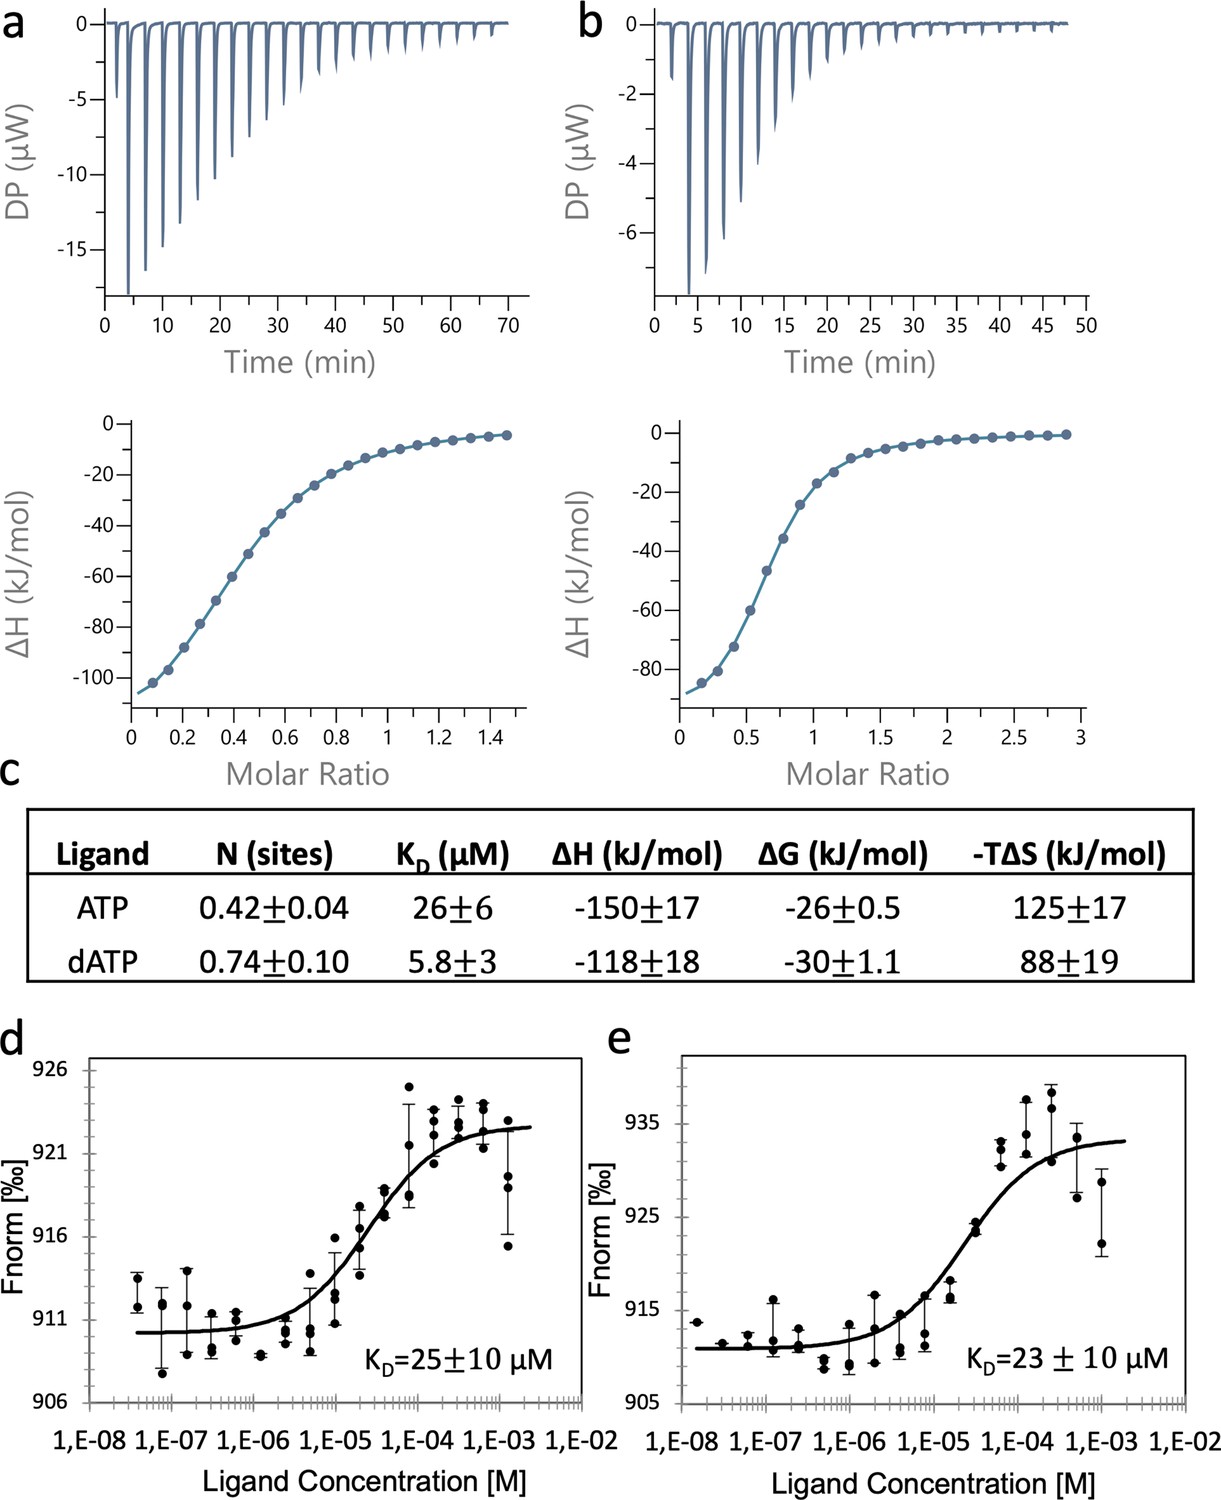
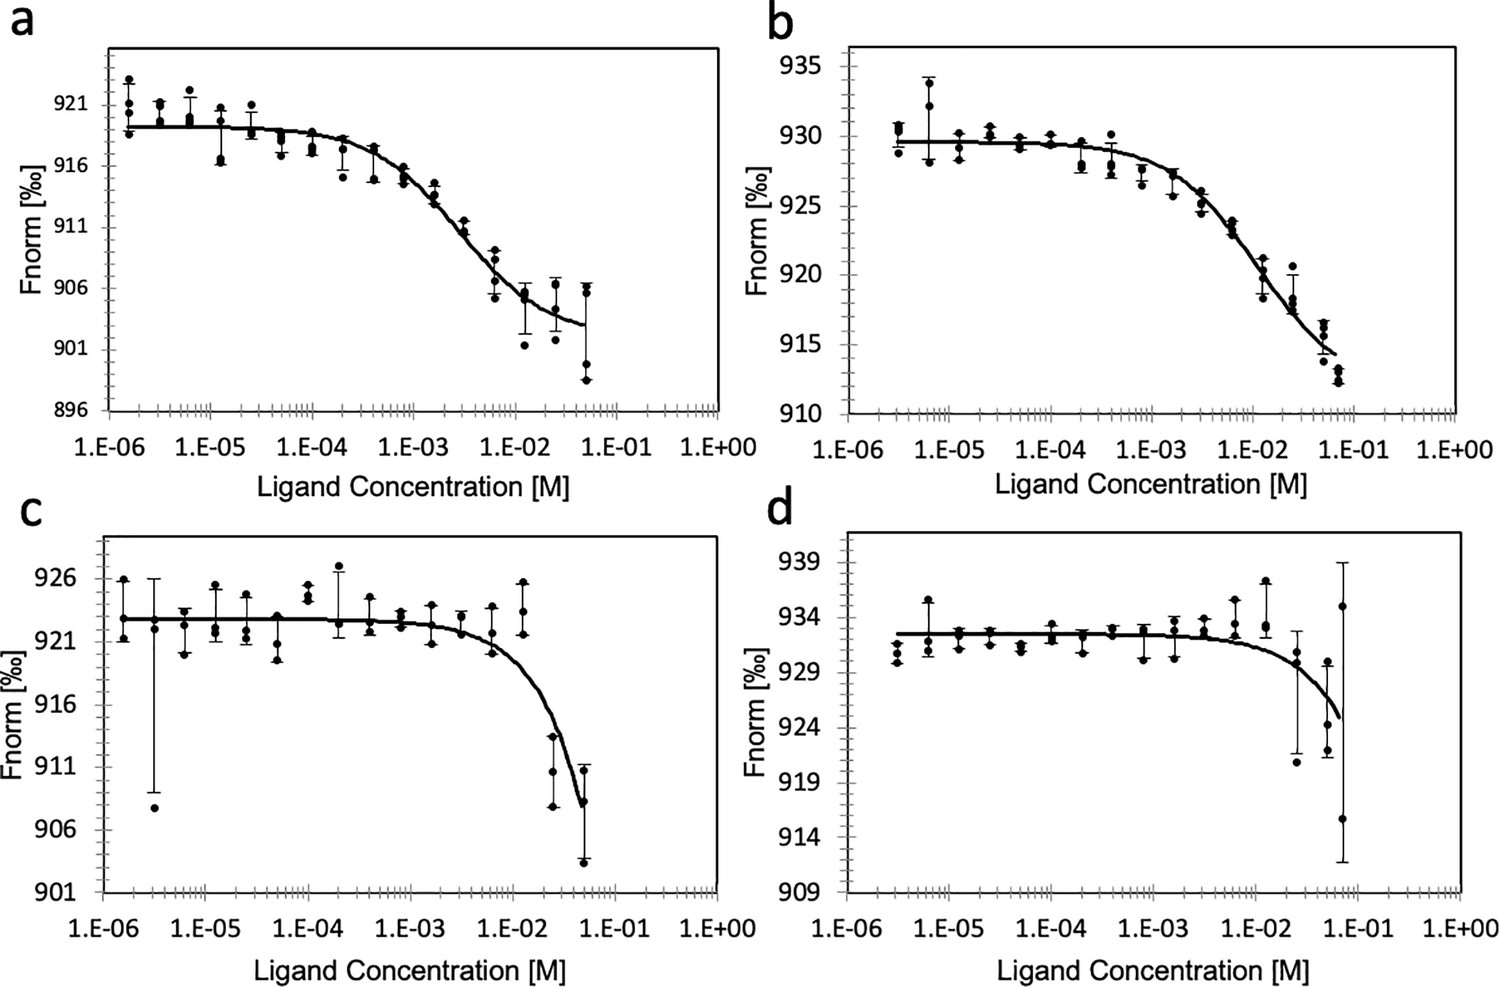
Binding of nucleotides to the ATP-cone.
Binding assay using isothermal titration calorimetry (ITC): Representative thermograms of binding of ATP to 50 µM PcNrdD (a); and binding of dATP to 200 µM PcNrdD (b); (c) thermodynamic parameters of ligand binding. All titrations were performed in the presence of 1 mM GTP substrate and 1 mM s-site effector dTTP at 20°C. Binding of nucleotides to the ATP-cone using microscale thermophoresis (MST): (d) Binding of ATP and (e) binding of dATP. All MST-binding experiments were performed in the presence of 1 mM s-site effector dTTP and 5 mM GTP substrate at room temperature. Control experiments were done for ITC, by titrating the nucleotide into the buffer (not shown).
Figure 3 with 1 supplement
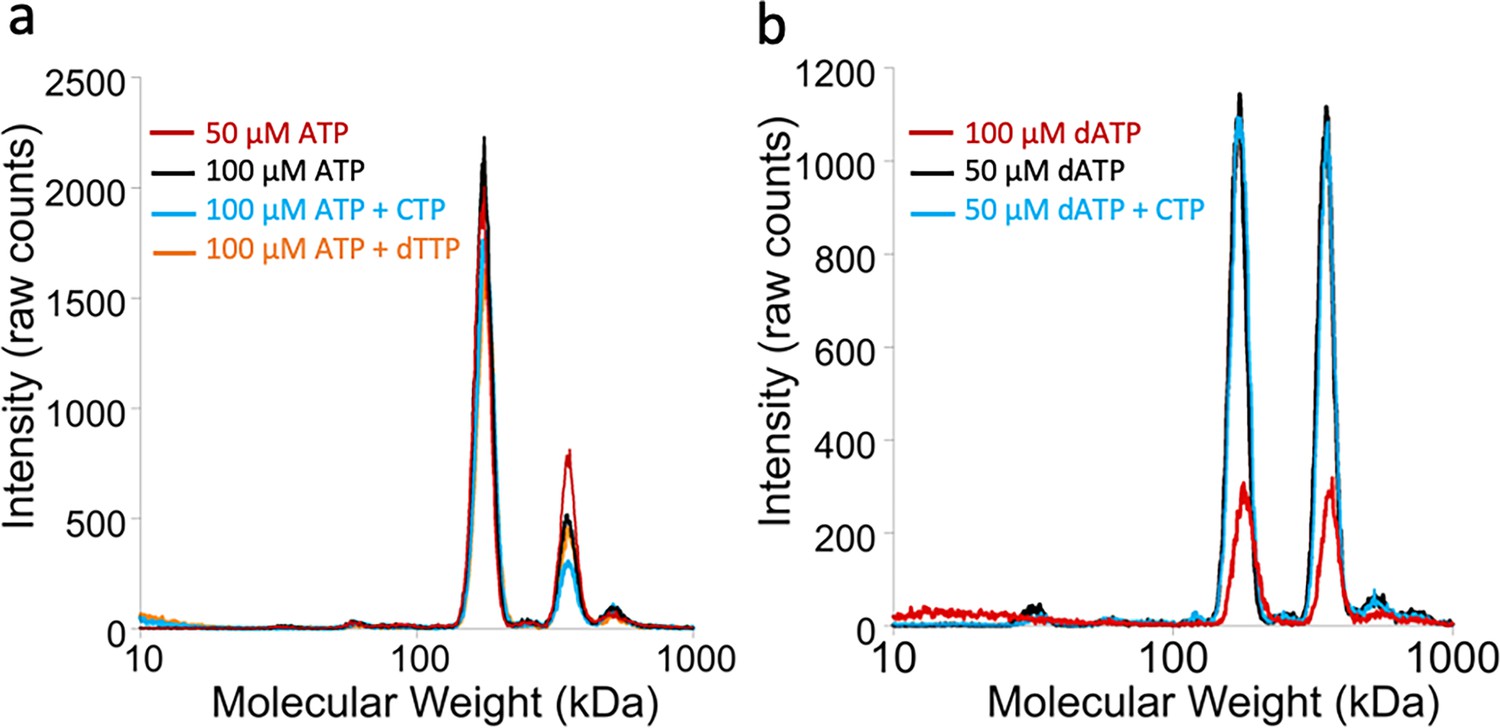
Oligomeric states of Prevotella copri NrdD in the presence of nucleotides determined by gas-phase electrophoretic mobility molecular analysis (GEMMA).
(a) Apo-PcNrdD (2 µM) loaded with the activator ATP (50–100 µM) (black and red) in the presence of CTP (100 µM) as a substrate (cyan) or dTTP (100 µM; orange) as the allosteric effector. (b) apo-PcNrdD (2 µM) loaded with the inhibitor dATP (50–100 µM) (black and red) in the presence of CTP (50 µM) (cyan) as the substrate. Each sample was scanned five times to increase signal-to-noise level. (c) Calculated numbers of monomers based on measured molecular weight and fractions of dimers versus tetramers after conversion of experiments (a) and (b) to mass concentrations.
Figure 3—figure supplement 1
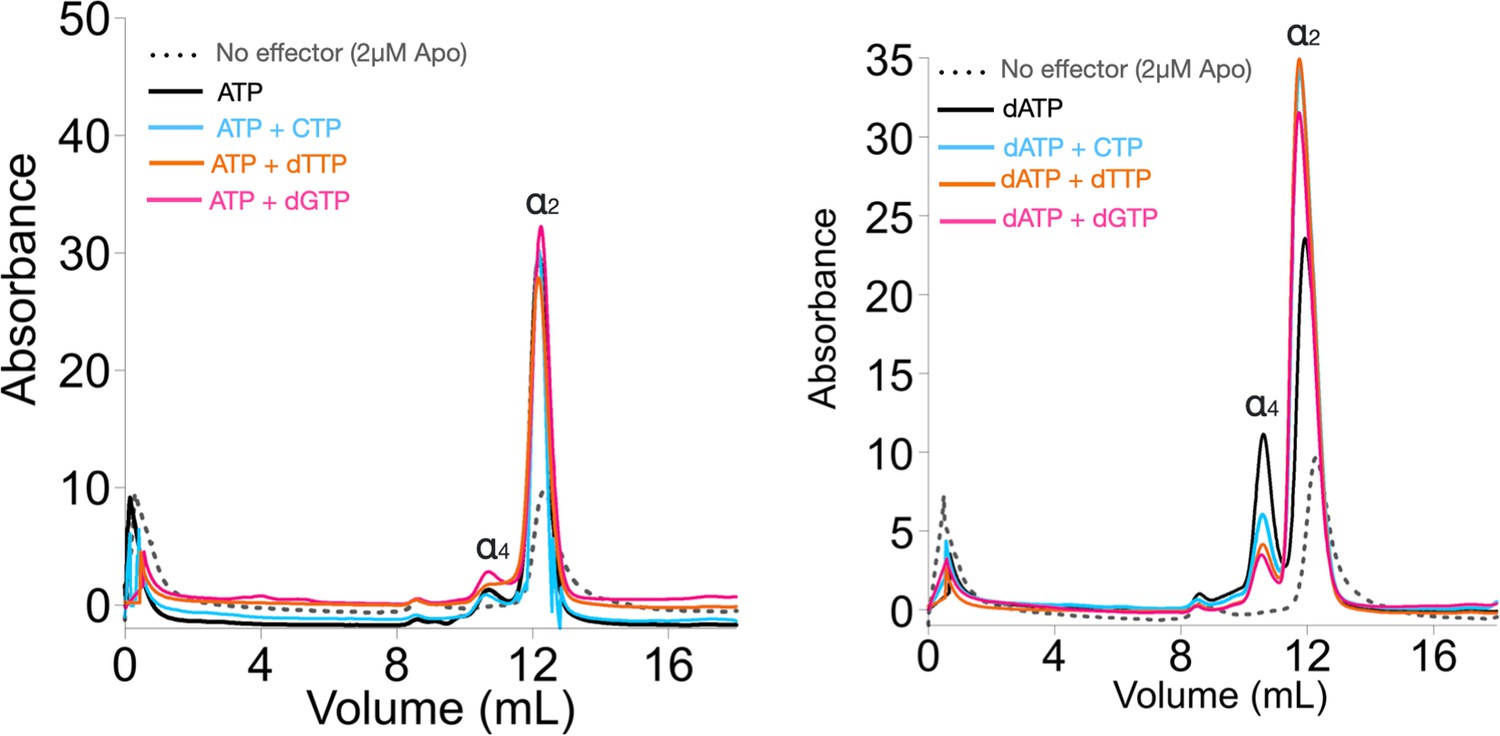
Size exclusion chromatography (SEC) analyses of Prevotella copri NrdD in the presence of nucleotides.
2 µM apo-PcNrdD (grey dots) loaded with (left) the activator 1 mM ATP (black) in the presence of 1 mM CTP as a substrate (cyan) or 1 mM dTTP (orange) as the allosteric effector, and (right) loaded with the inhibitor 1 mM dATP (black) in the presence of 1 mM CTP as a substrate (cyan), 1 mM GTP as substrate (pink), or 1 mM dTTP (orange) as the allosteric effector. Each sample is run with a buffer supplemented with the corresponding nucleotide at 0.5 mM NTPs and 0.2 mM deoxyribonucleoside triphosphates (dNTPs).
Figure 4 with 1 supplement

Glycyl radical formation after 20 min in presence of formate and ATP ± CTP or dATP ± CTP.
Nucleotide concentrations were: 1.5 mM ATP, 1 mM dATP, and 1 mM CTP. Traces are arbitrarily moved to increase visibility and scaled to identical units (Y-axes).
Figure 4—figure supplement 1

Glycyl radical formation in absence of formate after 20-min incubation.
Nucleotide concentrations were: ATP 1.5 mM and dATP 1 mM. Traces are arbitrarily moved to increase visibility and scaled to identical units (Y-axes).
Figure 5
Binding of substrate to ATP- or dATP-loaded PcNrdD.
Binding of GTP (a) and binding of CTP (b) to ATP-loaded PcNrdD. (c) Binding of GTP and (d) binding of CTP to dATP-loaded PcNrdD. No additional nucleotides were present in CTP-binding experiments, whereas binding of GTP was performed in the presence of 1 mM s-site effector dTTP. Fitted KDs are 2.8 ± 0.5 and 11 ± 2.4 mM for GTP and CTP binding, respectively, in the presence of ATP. In the presence of dATP fitted KDs were ≥2833 and ≥803 mM for GTP and CTP binding, respectively. Experiments were performed at room temperature.
Figure 6 with 3 supplements
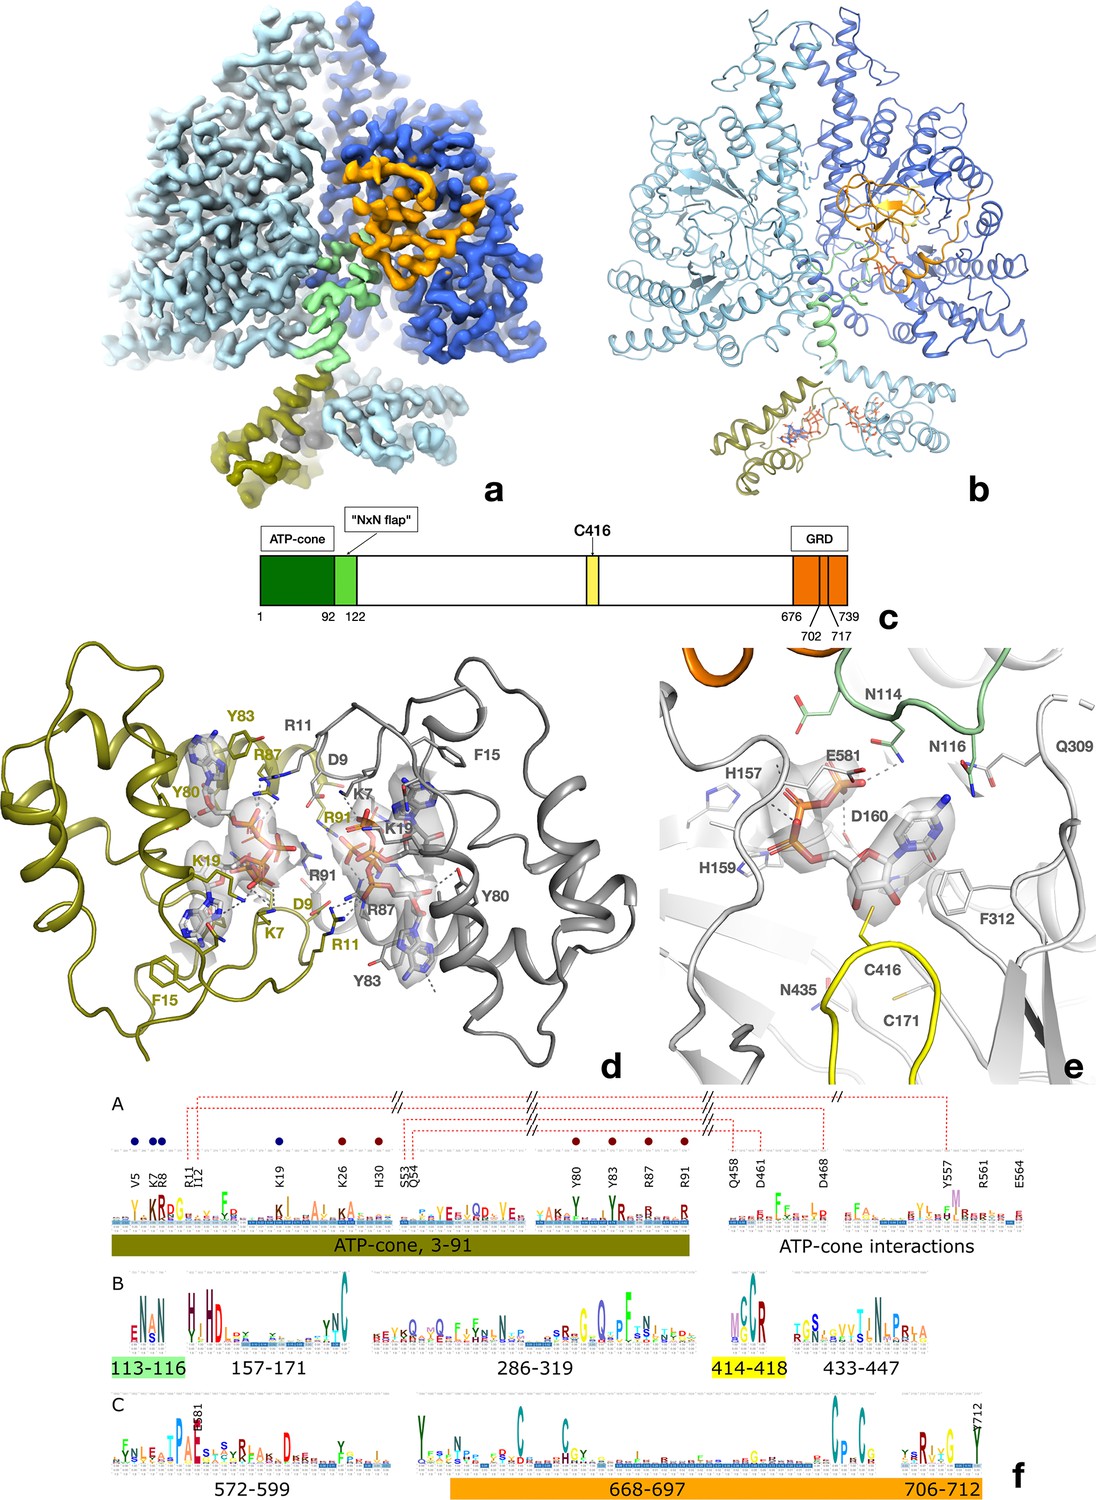
Structure of the PcNrdD dimer in complex with effector ATP and substrate CTP.
(a) Cryo-EM map with C1 symmetry showing the best-ordered ATP-cones after post-processing using DeepEMhancer. For the right-hand (active) monomer, the ATP-cone (residues 1–91) and the linking helix (92–104) are coloured olive, the linker and NxN flap region pale green, the glycyl radical loop red, and the C-terminal extended region orange. The loop in the middle of the α/β barrel containing the radical initiator cysteine Cys416 at its tip is yellow. (b) Overview of the PcNrdD dimer with ATP and CTP. The two monomers of the dimer are coloured in different shades of grey. The ATP and CTP molecules are shown as sticks. (c) Schematic of the domain organisation of PcNrdD with the same colour scheme as (a) and (b); (d) Closeup view of the binding of four ATP molecules to the dimer of ATP-cones in PcNrdD. The view is from the bottom of the molecule as seen in (a) and (b). Disordered loops are shown as dotted lines. (e) Closeup view of the active site including the cryo-EM map for CTP. Residues within 4 Å of CTP are shown as sticks and polar interactions as dotted lines. (f) Sequence logos of NrdD sequence motifs. (A) ATP-cone plus downstream interaction partners, (B) central parts of sequence and (C) C-terminal parts. The numbering is from PcNrdD. Segments were selected to illustrate amino acids discussed in the text.
Figure 6—figure supplement 1
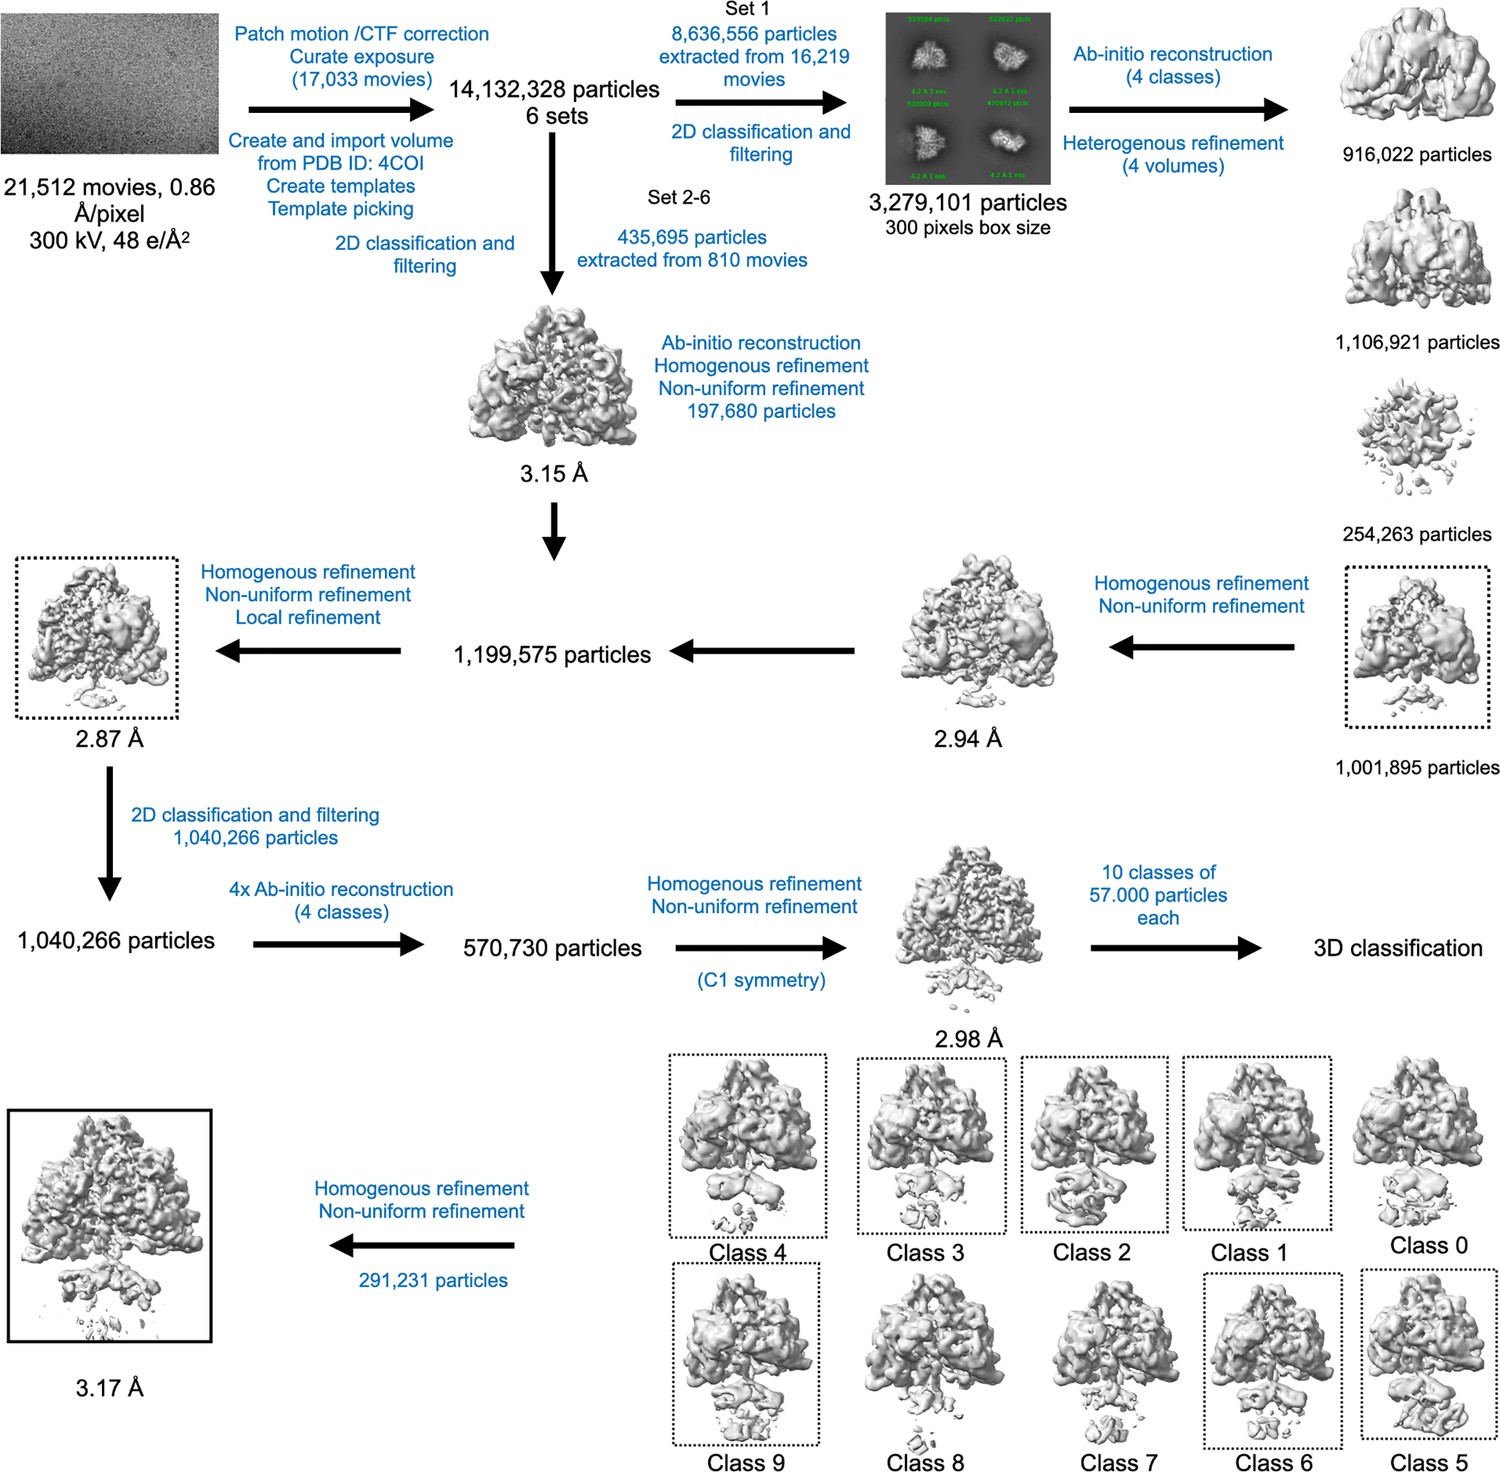
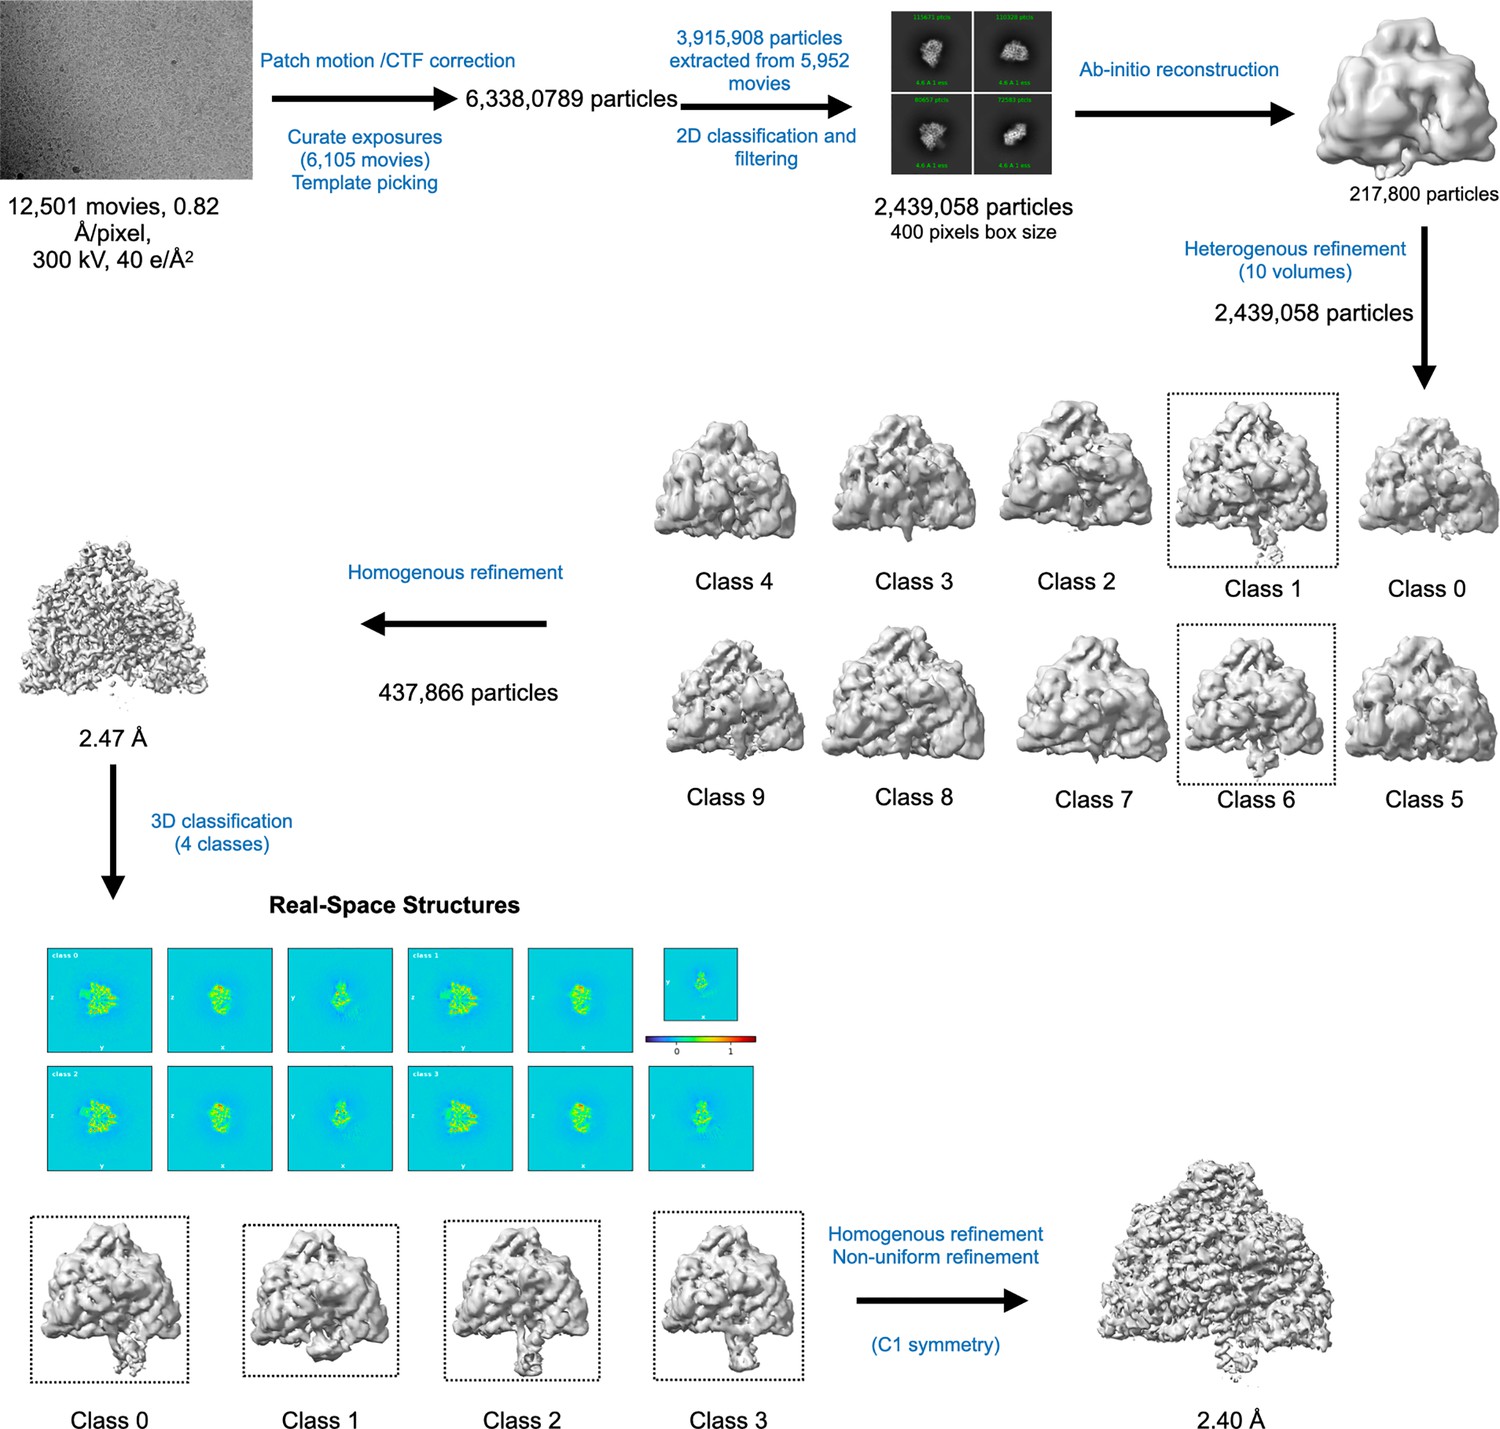
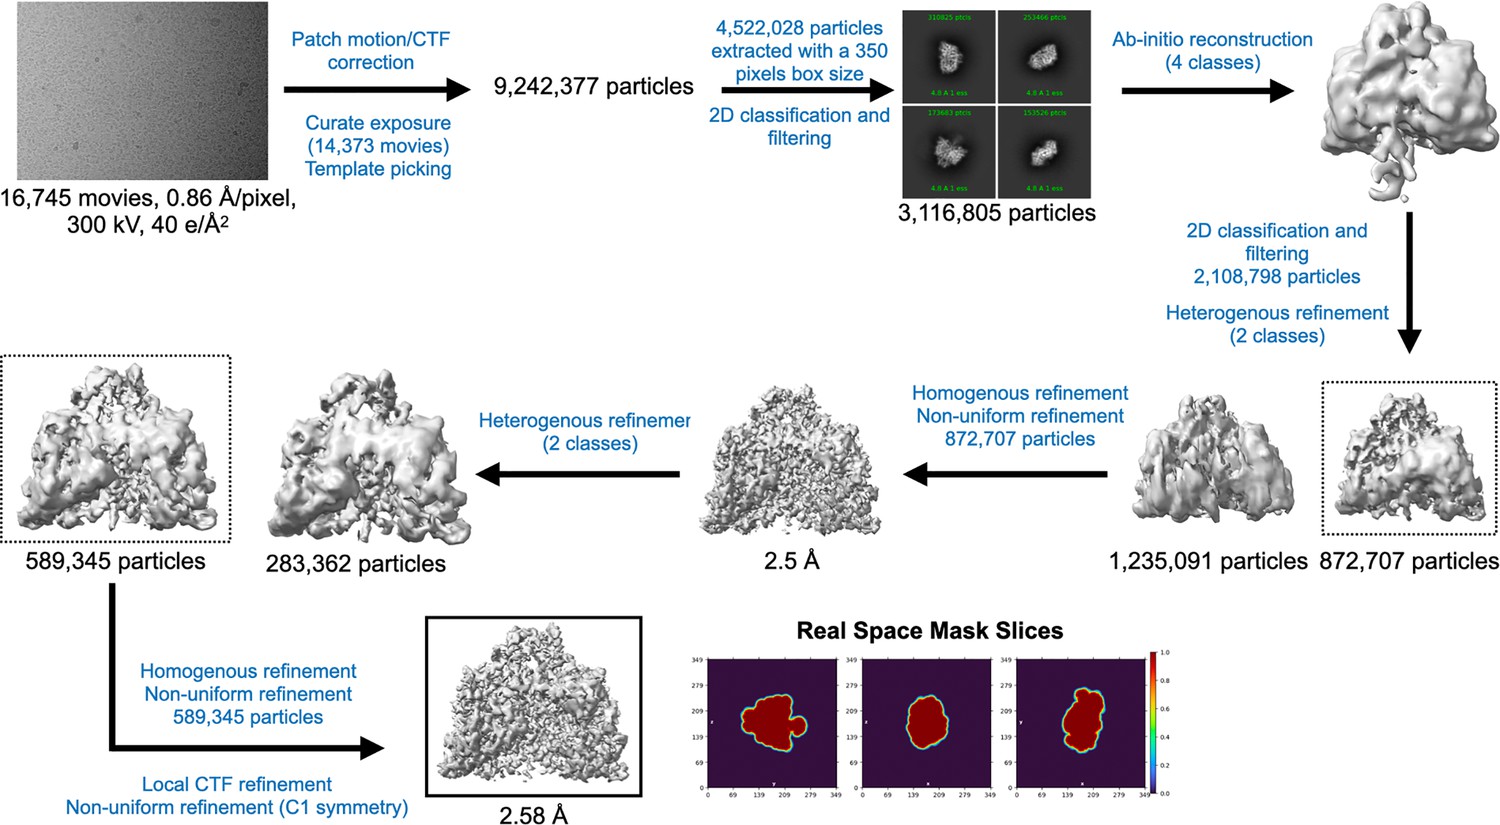
Cryo-EM data processing workflow for PcNrdD in the presence of ATP–CTP.
Figure 6—figure supplement 2
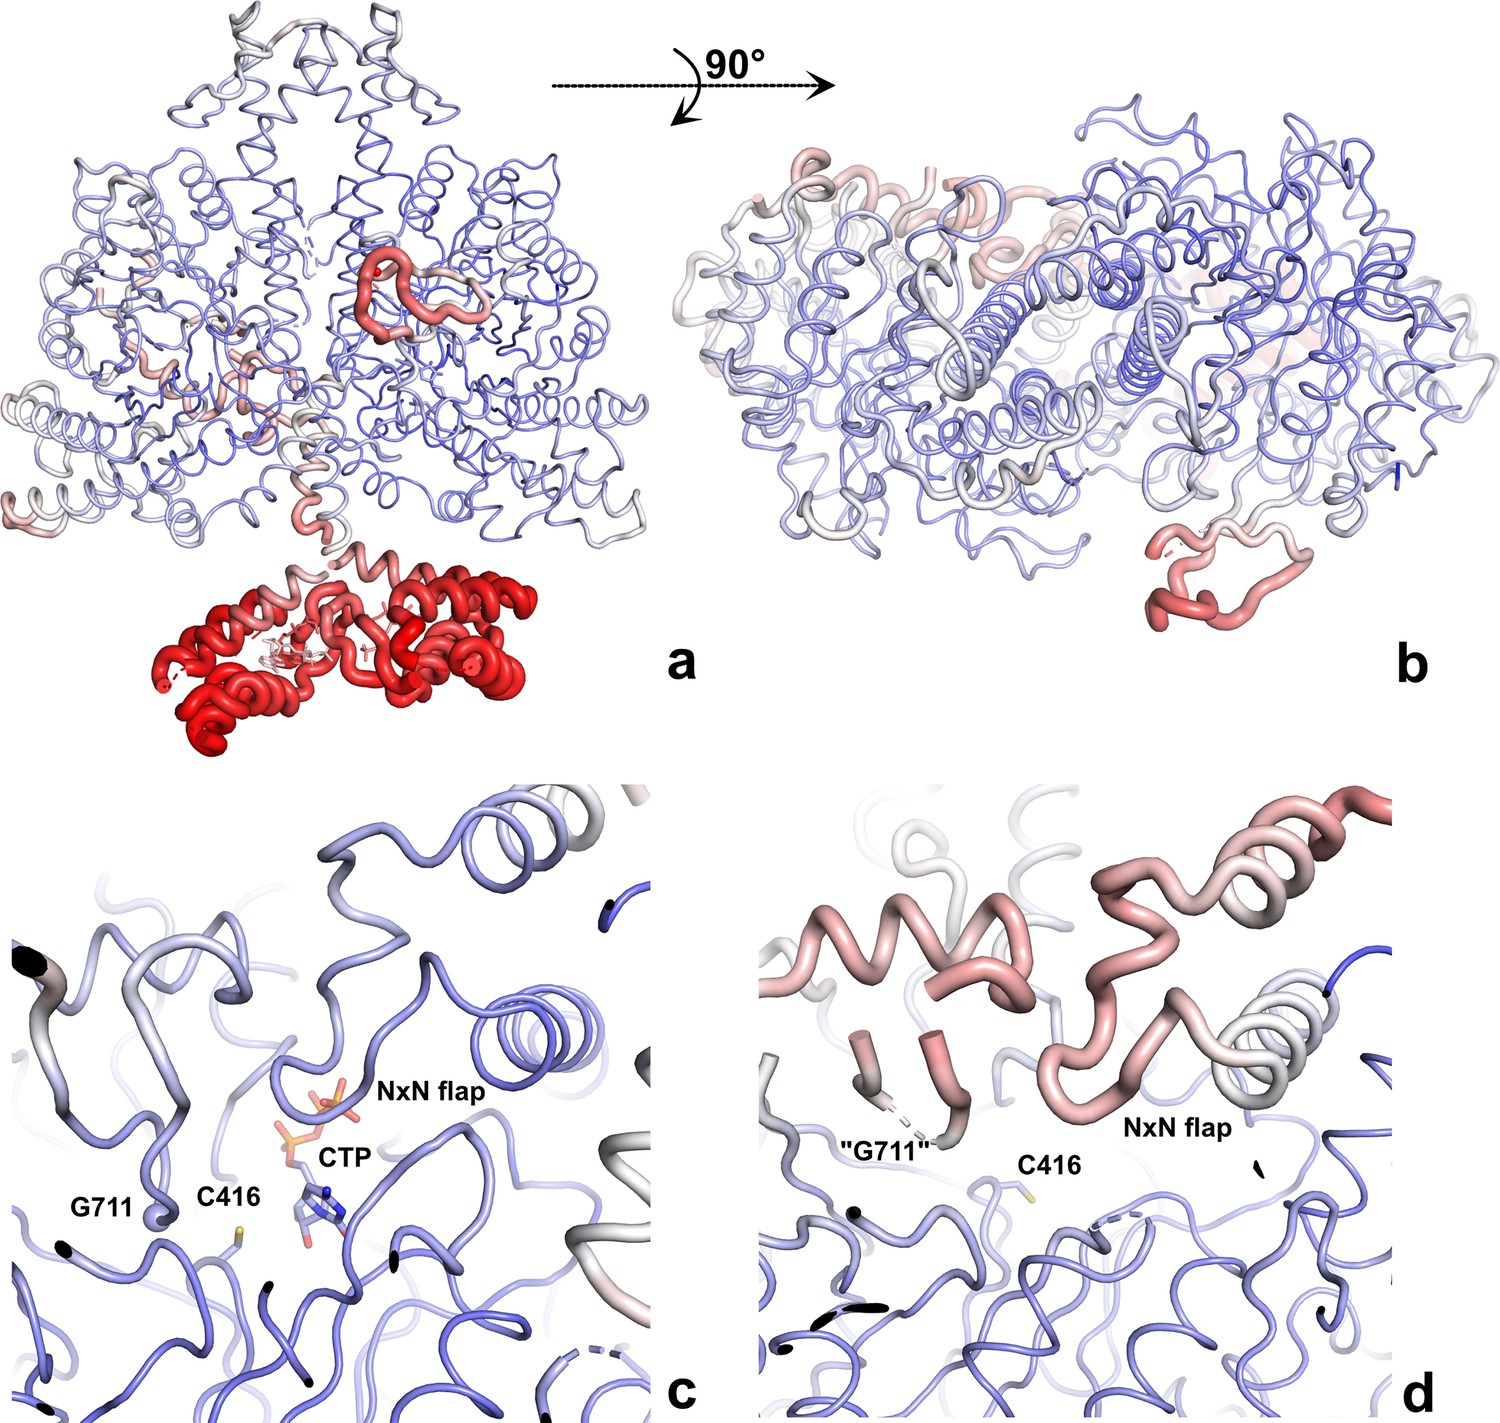
The PcNrdD–ATP–CTP structure coloured by B-factor.
The structures are shown as ‘B-factor putty’ where the thickness of the cartoon is proportional to the B-factor, thus more mobile regions are thicker. The ribbon is also coloured by B-factor, from dark blue at B ≤ 50 Å2 to red at ≥120 Å2. (a) Side view of the dimer; (b) top view of the dimer, showing that only the right-hand glycyl radical domain (GRD) is fully modelled; (c) closeup of the ordered active site, with CTP and Cys416 in stick representation and Gly711 indicated by a sphere; (d) closeup of the disordered active site. Only the two sides of the loop containing Gly711 are ordered enough to model. Residues 709–712 and other parts of the GRD are too disordered. The NxN flap is also more mobile than in the other monomer.
Figure 6—figure supplement 3
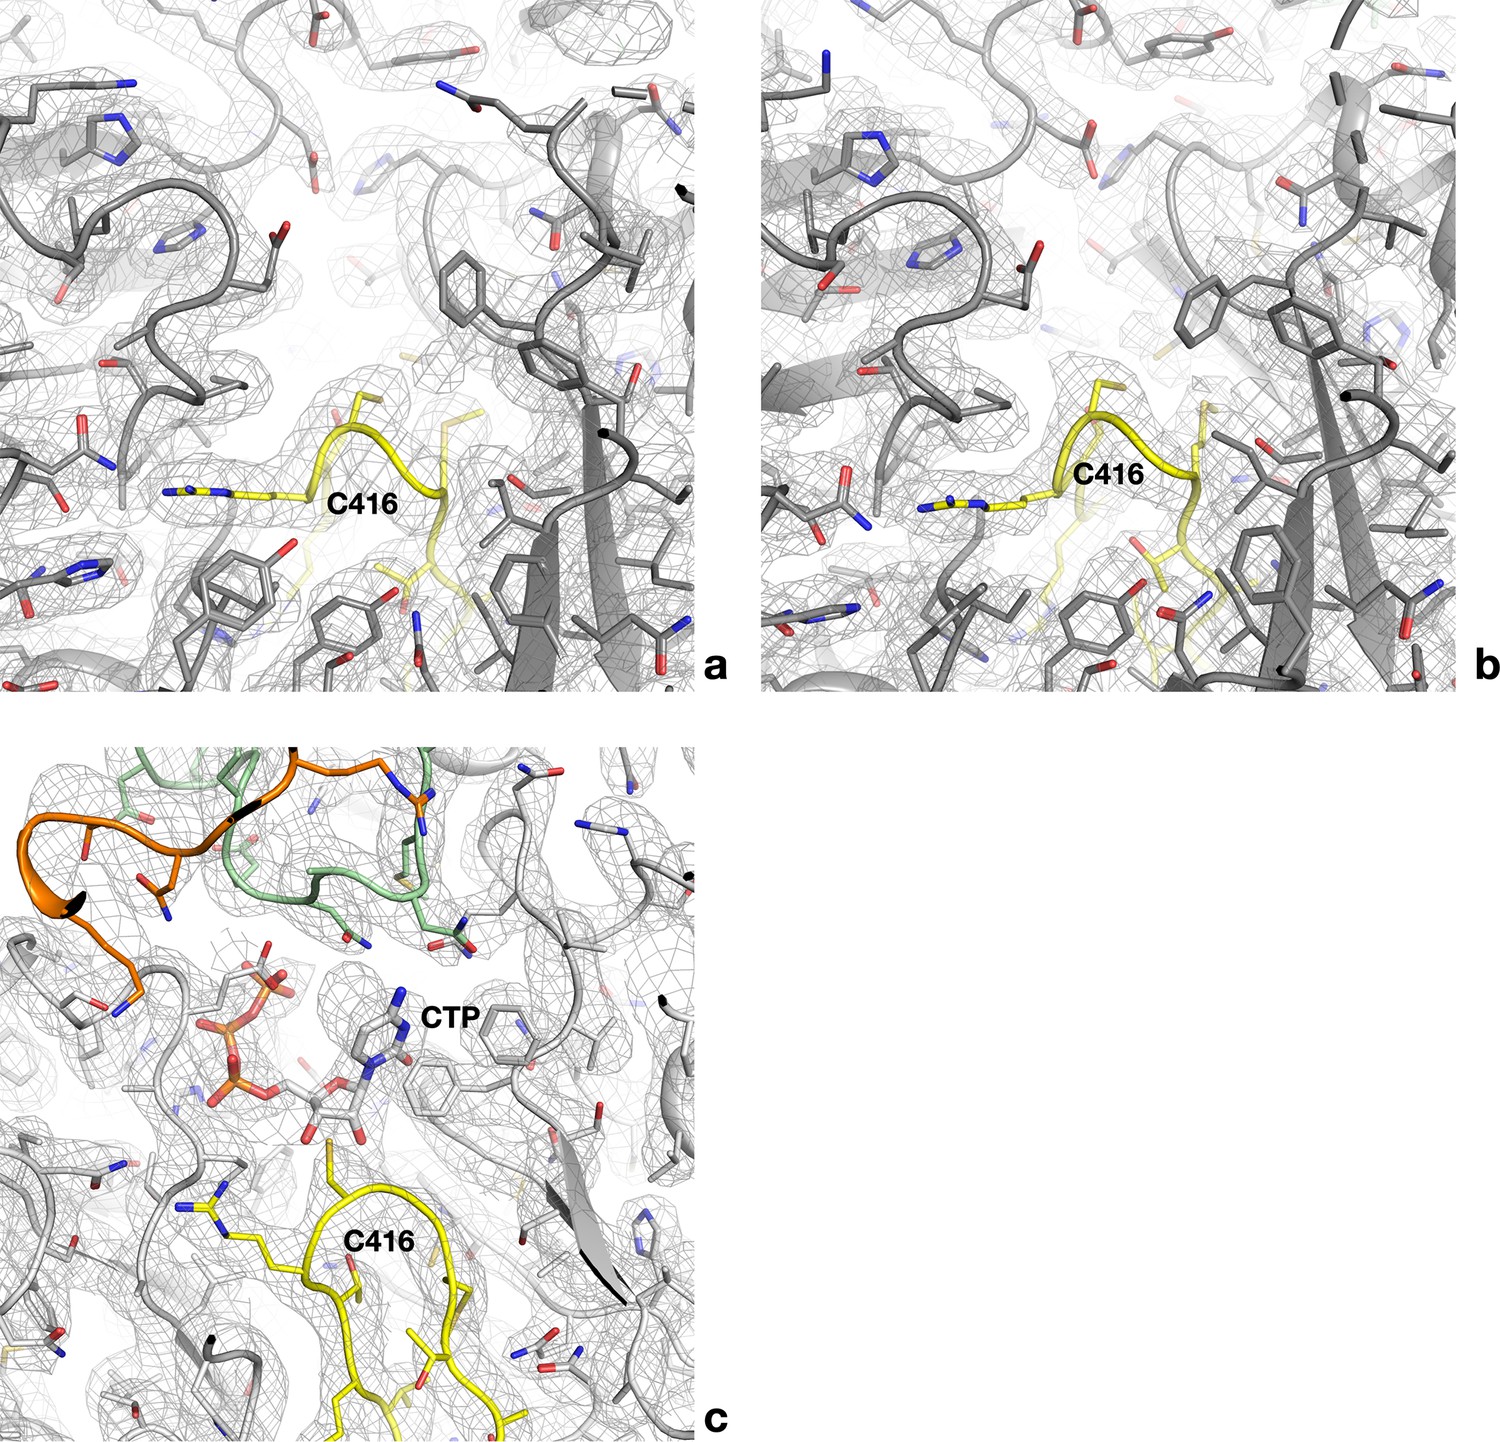
Cryo-EM maps for the empty and occupied active sites of PcNrdD.
(a) Cryo-EM map for one of the four active sites of the dATP–CTP tetramer. The refined model is superposed. All side chains are shown as sticks. The finger loop is coloured yellow. (b) Map for one of the two active sites of the dATP–CTP dimer. (c) Complete density for the occupied active site of the ATP–CTP complex for comparison. The NxN flap is coloured green and the C-terminal region orange.
Figure 7 with 1 supplement

The intricate network of interactions between the NxN flap, C-terminal glycyl radical domain (GRD), loop 2, and substrate in the ATP–CTP complex of PcNrdD.
The NxN flap is coloured light green, the GRD orange, loop 2 dark red, and the Cys radical loop yellow. The Gly radical loop is semi-transparent for clarity. The CA atom of Gly711 is indicated by an orange sphere. Important hydrogen bonds are shown as dotted lines.
Figure 7—figure supplement 1

The tunnel leading from the active site to the surface of PcNrdD in the ATP–CTP complex.
The tunnel is 12 Å in length and 5.6 Å wide at its narrowest point. The secondary structure elements are coloured as in Figure 6.
Figure 8 with 6 supplements
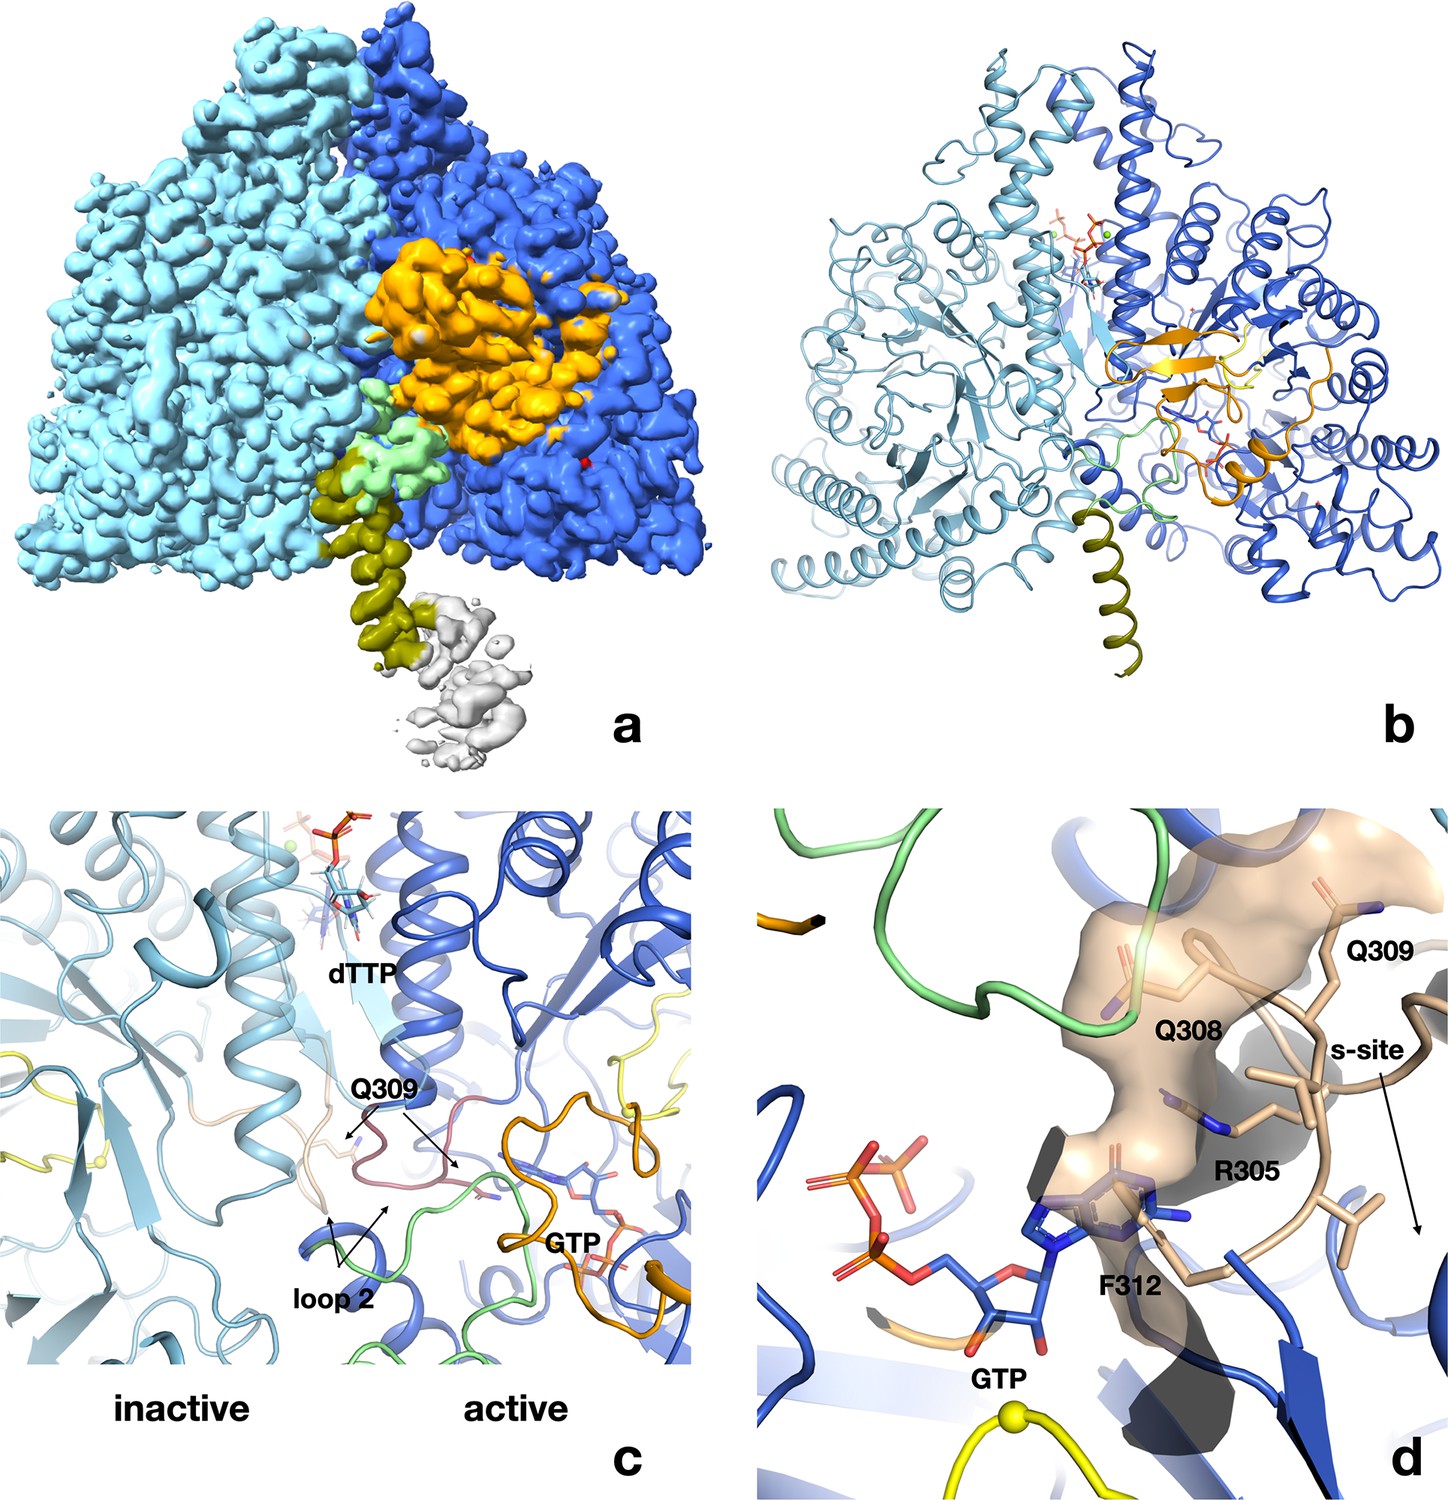
Structure of PcNrdD in complex with a-site effector ATP, s-site effector dTTP, and substrate GTP.
(a) Volume for the PcNrdD dimer in complex with ATP, dTTP, and GTP. The volume is contoured at a low level to emphasise the weak density for the more ordered ATP-cone domain in the active monomer. (b) Ribbon diagram of the ATP–dTTP–GTP complex coloured as in Figure 6b, except that the most N-terminal helix (olive) now extends from residues 85 to 104. (c) Zoom in on panel (b) to illustrate the highly asymmetrical loop 2 conformations in the active and inactive monomers. Loop 2 in the inactive monomer (light blue) is coloured wheat, while in the active monomer (dark blue) it is purple. The conformation of loop 2 that forms a complementary cradle for the guanosine base of the substrate GTP in the active monomer induces a conformation of the other loop 2 that precludes substrate binding. (d) Severe steric clash of loop 2 of the inactive monomer with the substrate and NxN flap. The view is rotated approximately 180° from panels a–c. Loop 2 from the inactive monomer (wheat) is superimposed on the active site of the active monomer (dark blue). The molecular surface of the loop is shown to emphasise that this conformation is incompatible with an ordered NxN flap (light green) and substrate binding. The Cys radical loop is yellow and Cys416 is marked by a sphere. The Gly radical loop is omitted for clarity.
Figure 8—figure supplement 1
Cryo-EM data processing workflow for PcNrdD in the presence of ATP–dTTP–GTP.
Figure 8—figure supplement 2
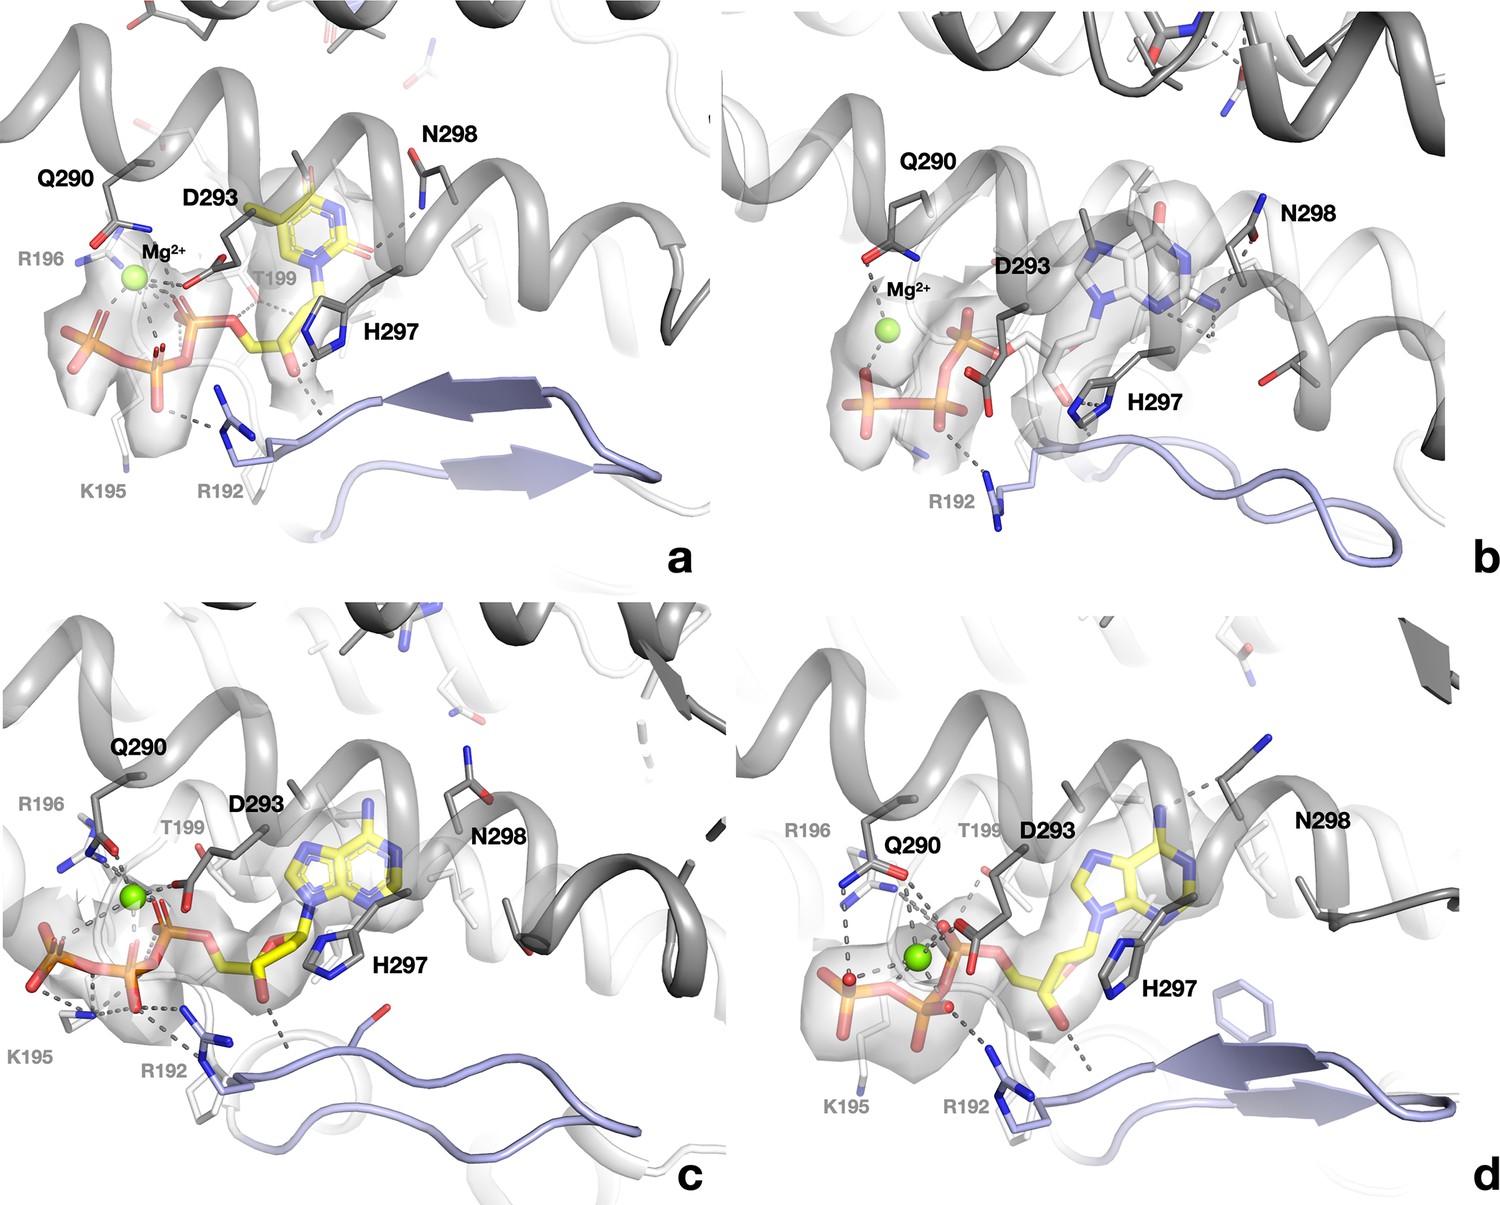
Binding of allosteric substrate specificity nucleotides to the s-site at the dimer interface of PcNrdD.
(a) dTTP in the ATP–dTTP–GTP dimer; (b) dGTP in the dGTP–ATP dimer; (c) dATP in the dATP-only tetramer; (d) dATP in the dATP-only dimer. Electrostatic potential maps are shown as transparent surfaces around the nucleotides. Residues in the monomer that makes most contacts to the nucleotide are indicated by black labels while those in the other monomer have grey labels.
Figure 8—figure supplement 3
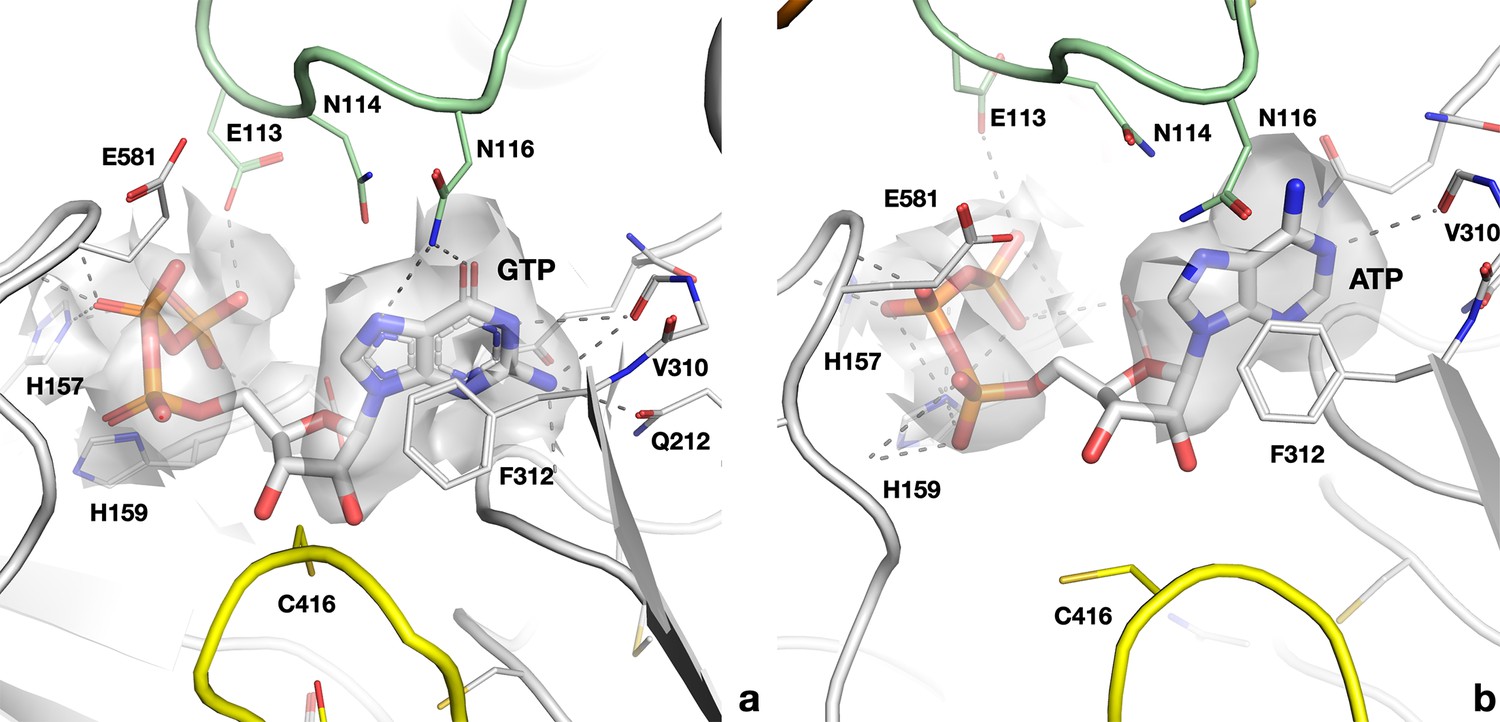
Cryo-EM map and interactions of (a) GTP in the active site of the PcNrdD–ATP–dTTP–GTP complex; (b) ATP in the PcNrdD–ATP–dGTP complex.
Figure 8—figure supplement 4
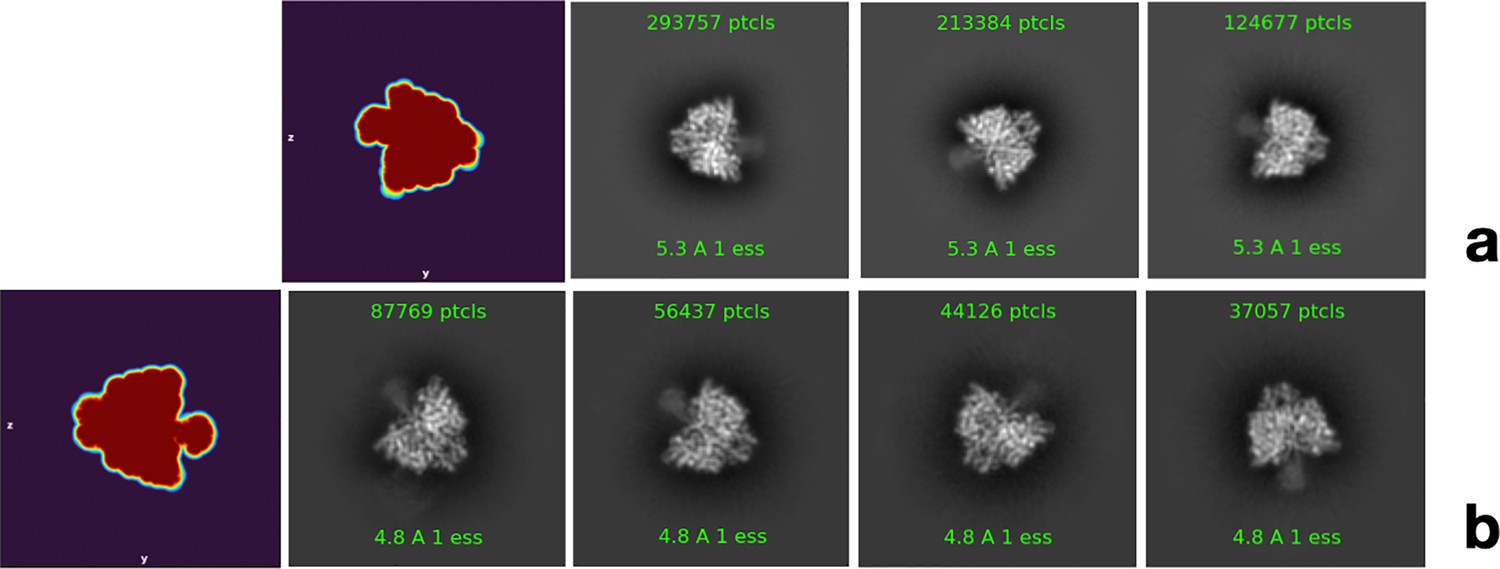
Representative two-dimensional (2D) classes showing side views of PcNrdD with diffuse density in the ATP-cone region.
(a) Three classes for the complex with ATP, dTTP, and GTP; (b) four classes from the complex with ATP and dGTP. In both complexes the diffuse density appears limited to one side of the dimer axis. The left-hand panel in both (a) and (b) shows one projection of the automatically determined masks used in the respective final non-uniform refinement jobs, which has the same form as the representative 2D classes.
Figure 8—figure supplement 5
Cryo-EM data processing workflow for PcNrdD in the presence of ATP and dGTP.
Figure 8—figure supplement 6

The highly asymmetrical loop 2 conformations in the active and inactive monomers of the PcNrdD–dGTP–ATP complex.
Loop 2 in the inactive monomer (light blue) is coloured dark blue, while in the active monomer (grey) it is dark red. As in the PcNrdD–ATP–dTTP–GTP complex, the conformation of loop 2 that forms a complementary cradle for the guanosine base of the substrate ATP in the active monomer induces a conformation of the other loop 2 that precludes substrate binding.
Figure 9 with 5 supplements
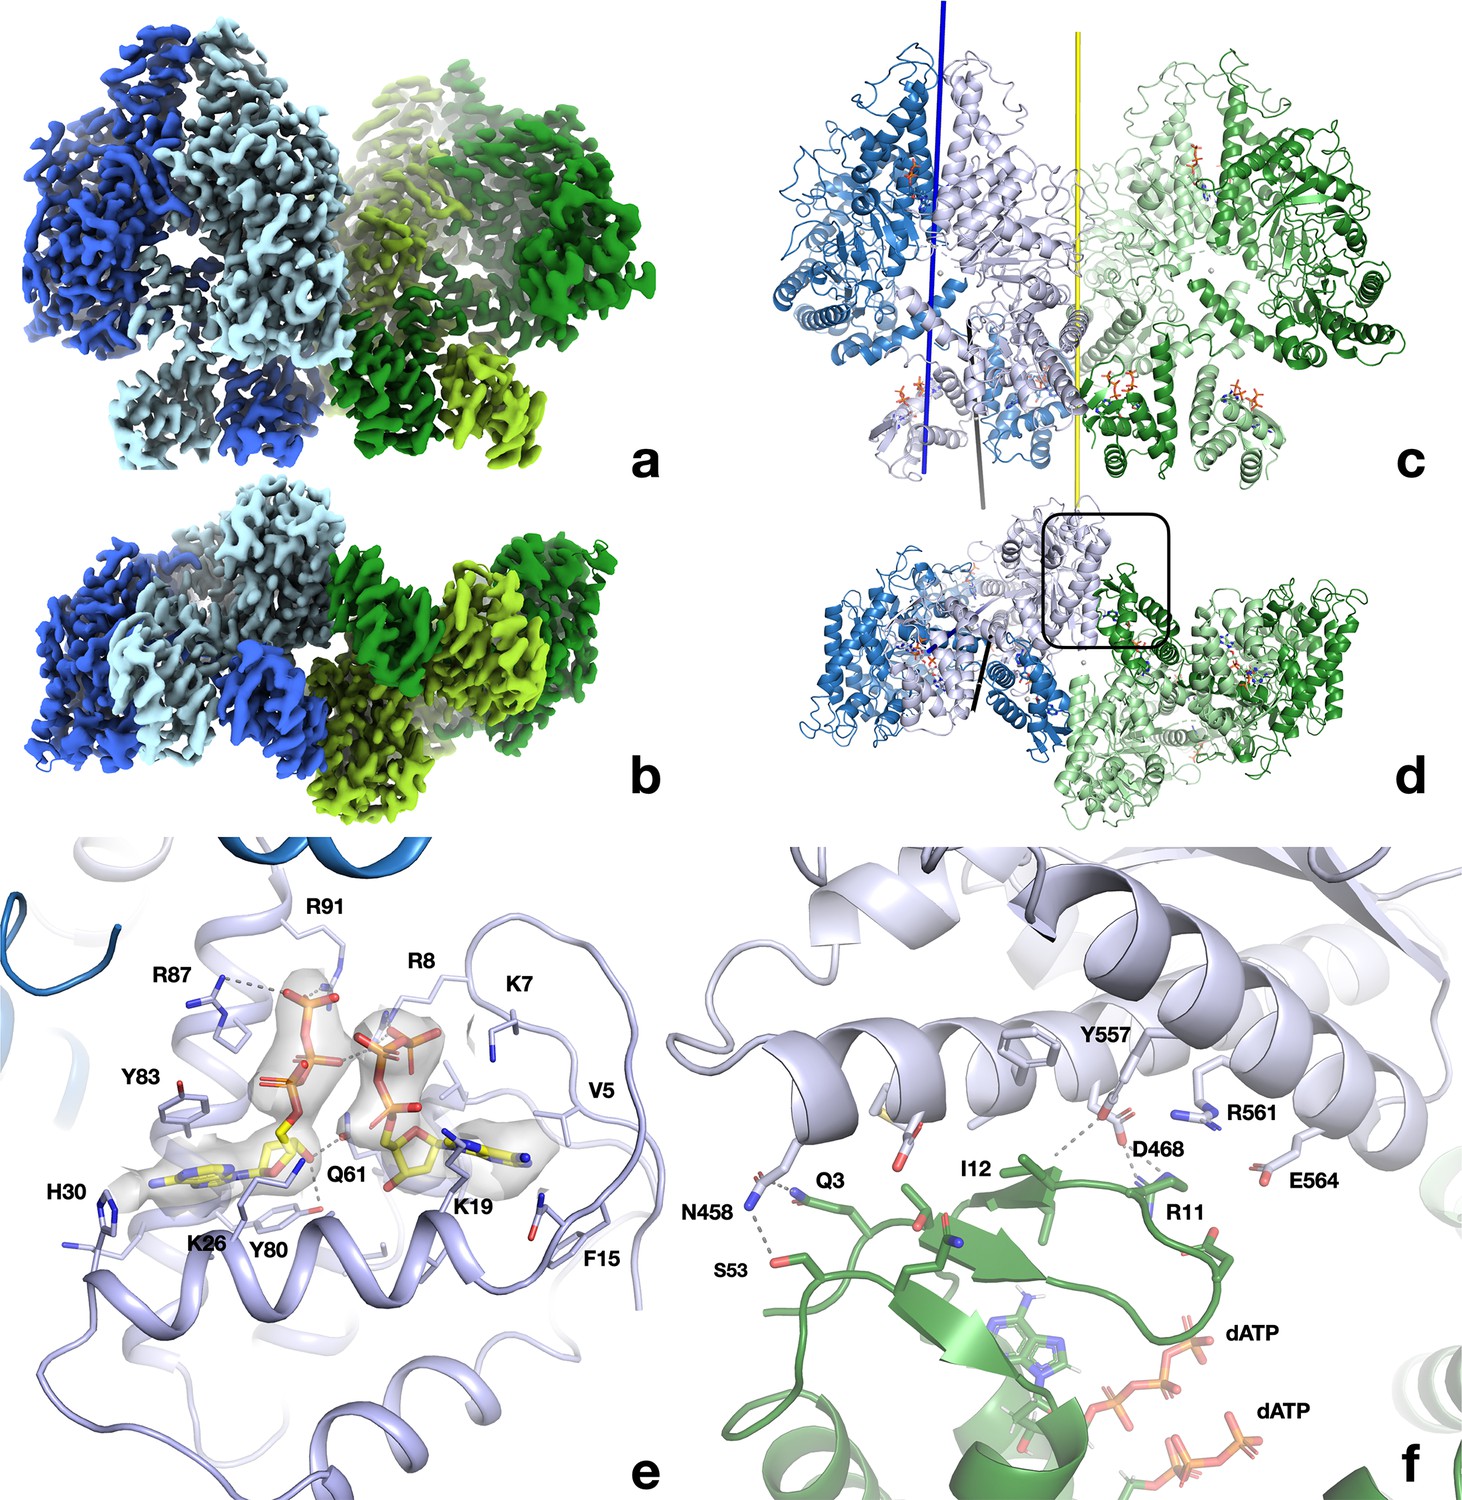
Structure of the dATP-bound PcNrdD tetramer.
(a) Cryo-EM reconstruction coloured by chain: dimer 1 light blue and pale blue; dimer 2 light green and pale green. The four ATP-cones are at the bottom of the figure. (b) View rotated by 90° around a horizontal axis relative to (a) and thus viewed from the bottom, showing the ATP-cones. (c, d) Cartoon representation of the tetramer from the same angles as panels (a) and (b), respectively, and with the same chain colouring. The twofold symmetry axis relating the two dimers of the tetramer is shown as a yellow line. The 12 dATP molecules in the tetramer are shown as sticks. The dimer axis of the left-hand dimer’s core domains is shown as a dark blue line and the dimer axis of the ATP-cone pair as a black line. (e) Details of the interaction of dATP molecules at the allosteric activity site in the ATP-cone. (f) Closeup of the interaction area between the roof of the ATP-cone of one dimer and the core domain of the other dimer (marked with a black box in panel d). The most significant residues are labelled.
Figure 9—figure supplement 1
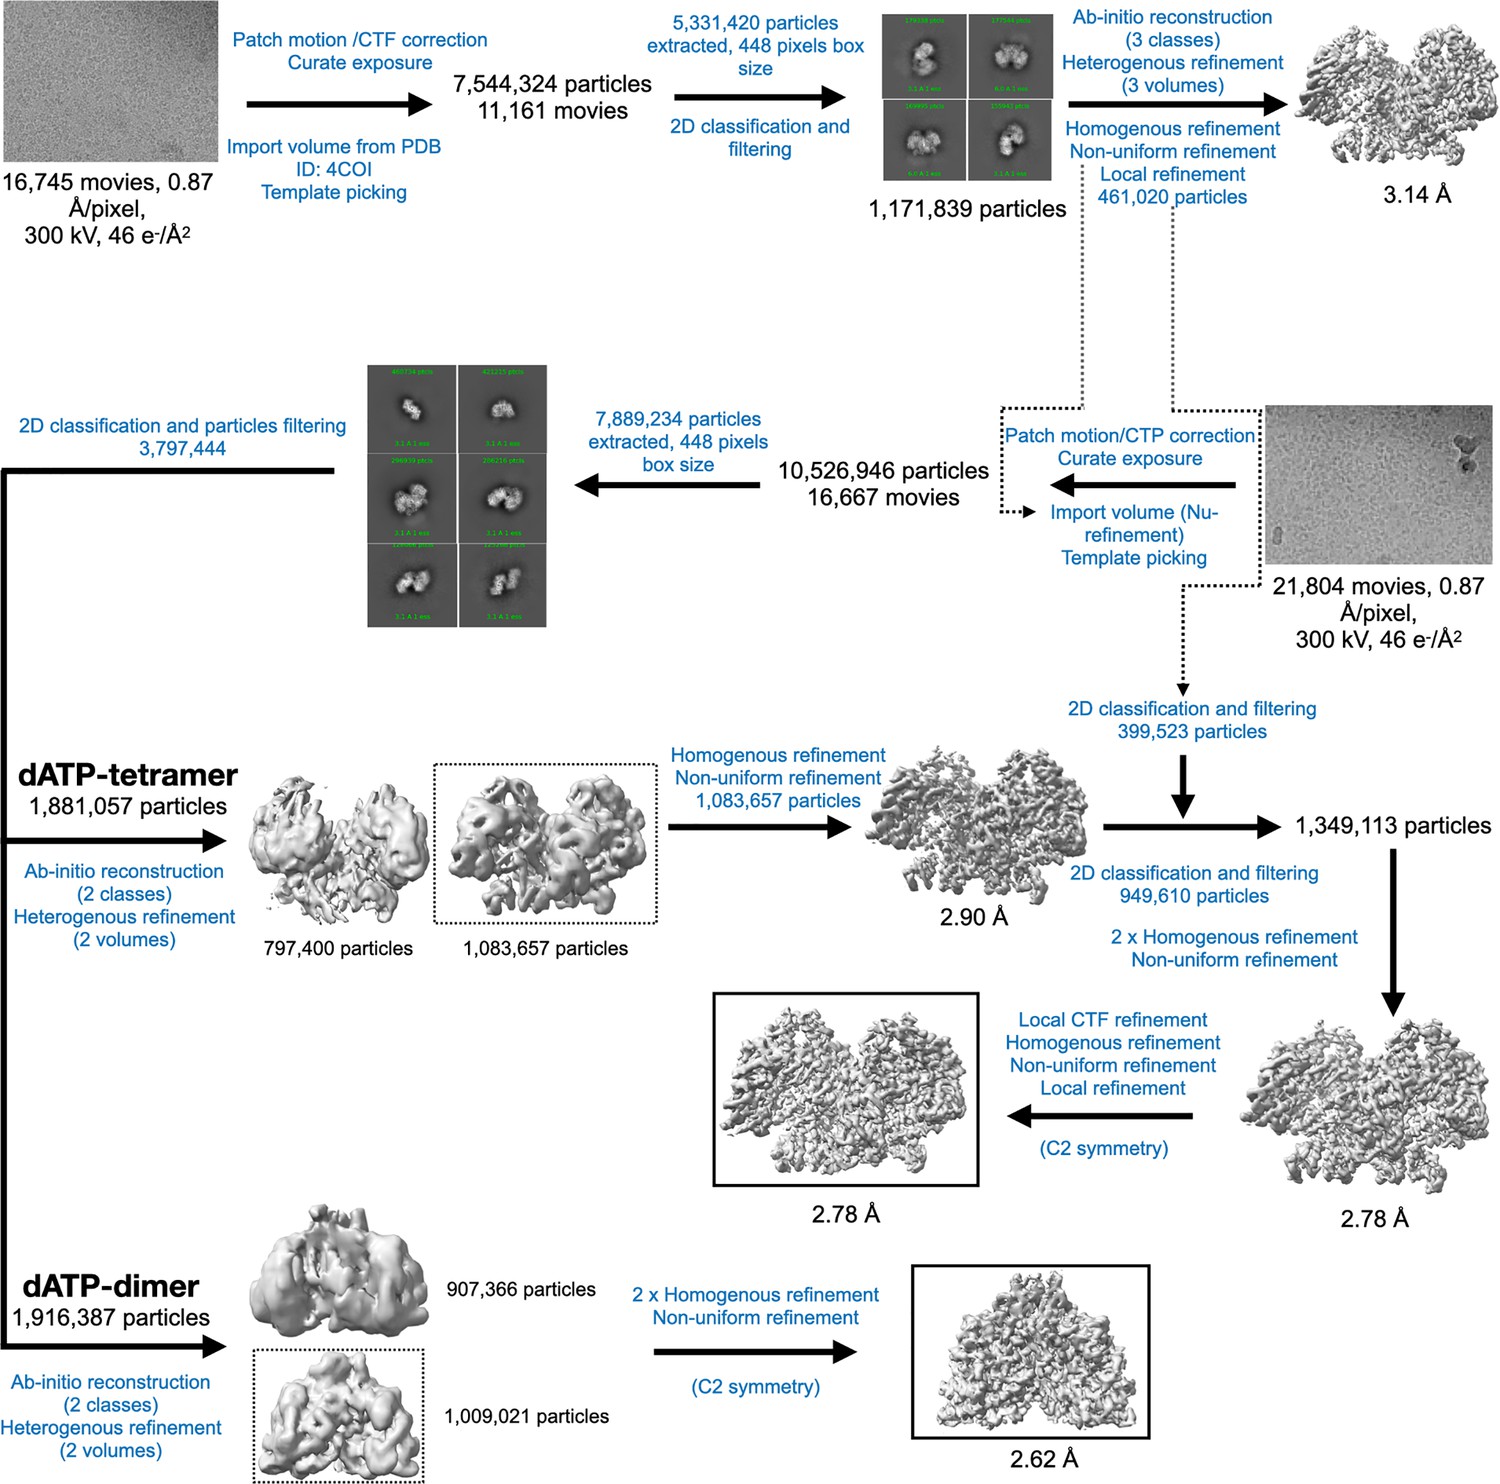
Cryo-EM data processing workflow for PcNrdD in the presence of dATP.
Figure 9—figure supplement 2
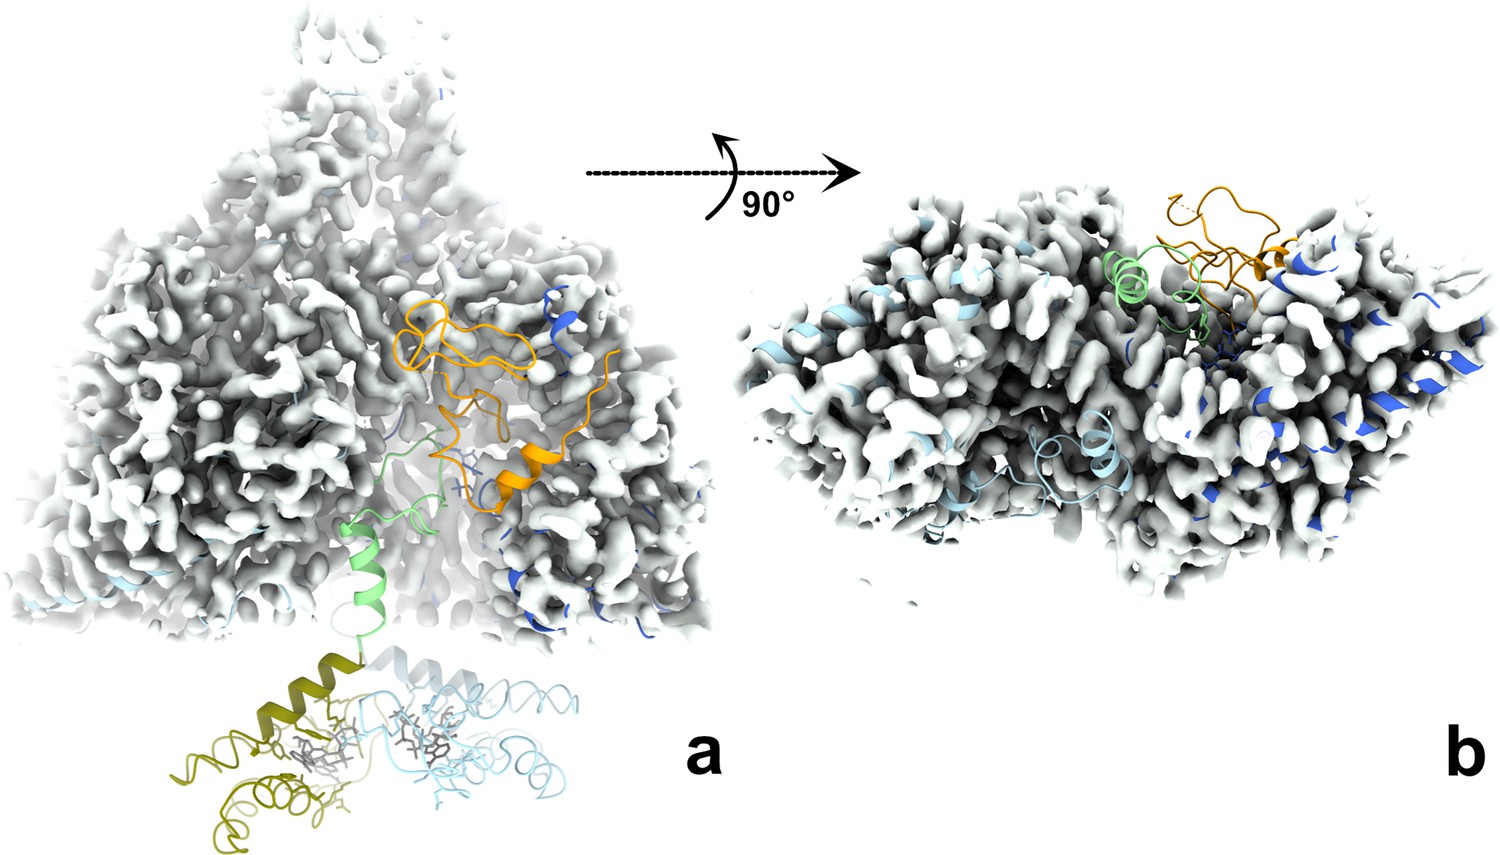
The ATP-cones, linker, entire glycyl radical domain (GRD), and NxN flap are all disordered in both monomers of the dATP-bound PcNrdD dimer.
The cryo-EM map for the dATP-bound dimer is shown as a grey surface. The structure of the ATP–CTP-bound dimer is fitted to the map, coloured as in Figure 6, that is ATP-cone: olive, linker and NxN flap: pale green, GRD orange. (a) Side view with twofold axis vertical; (b) view from the bottom of the dimer with the twofold axis projected towards the viewer. For clarity the ATP-cones are not shown in panel (b). Taken together, the two panels show that density for the linker, flap, and GRD is lacking for both monomers in the dimer.
Figure 9—figure supplement 3
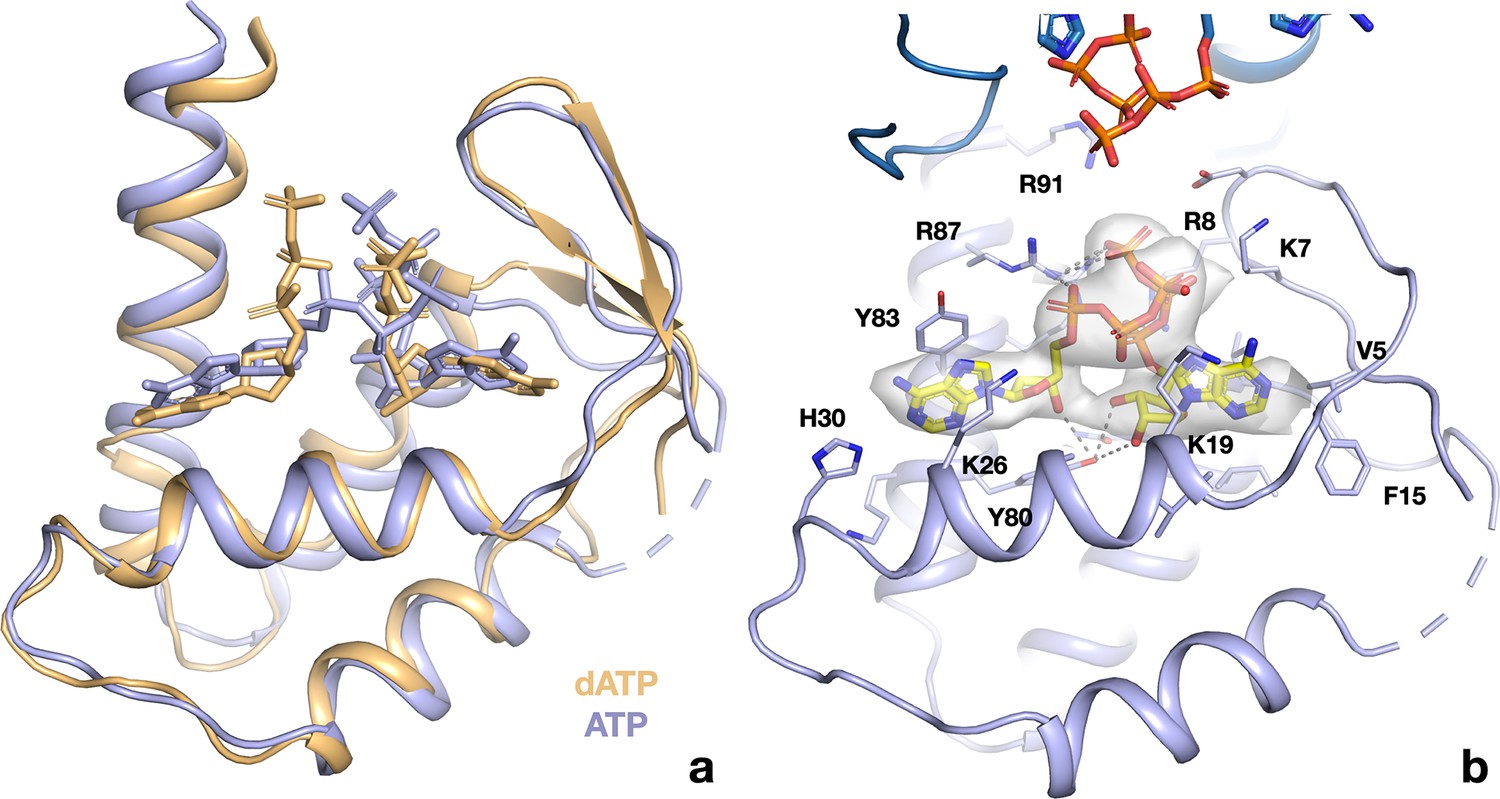
ATP and dATP bind differently to the PcNrdD ATP-cone.
(a) Comparison of the overall binding modes. The dATP complex is in beige, the ATP–CTP complex in light blue. Nucleotides are shown as sticks. Missing loops are shown as dotted lines. (B) Details of the interactions of ATP with the ATP-cone in the ATP–CTP complex (compare to Figure 9e). The second ATP-cone of the pair at the top of the panel is drawn in a darker shade of blue and the phosphate groups of the ATP molecules bound to it are visible.
Figure 9—figure supplement 4
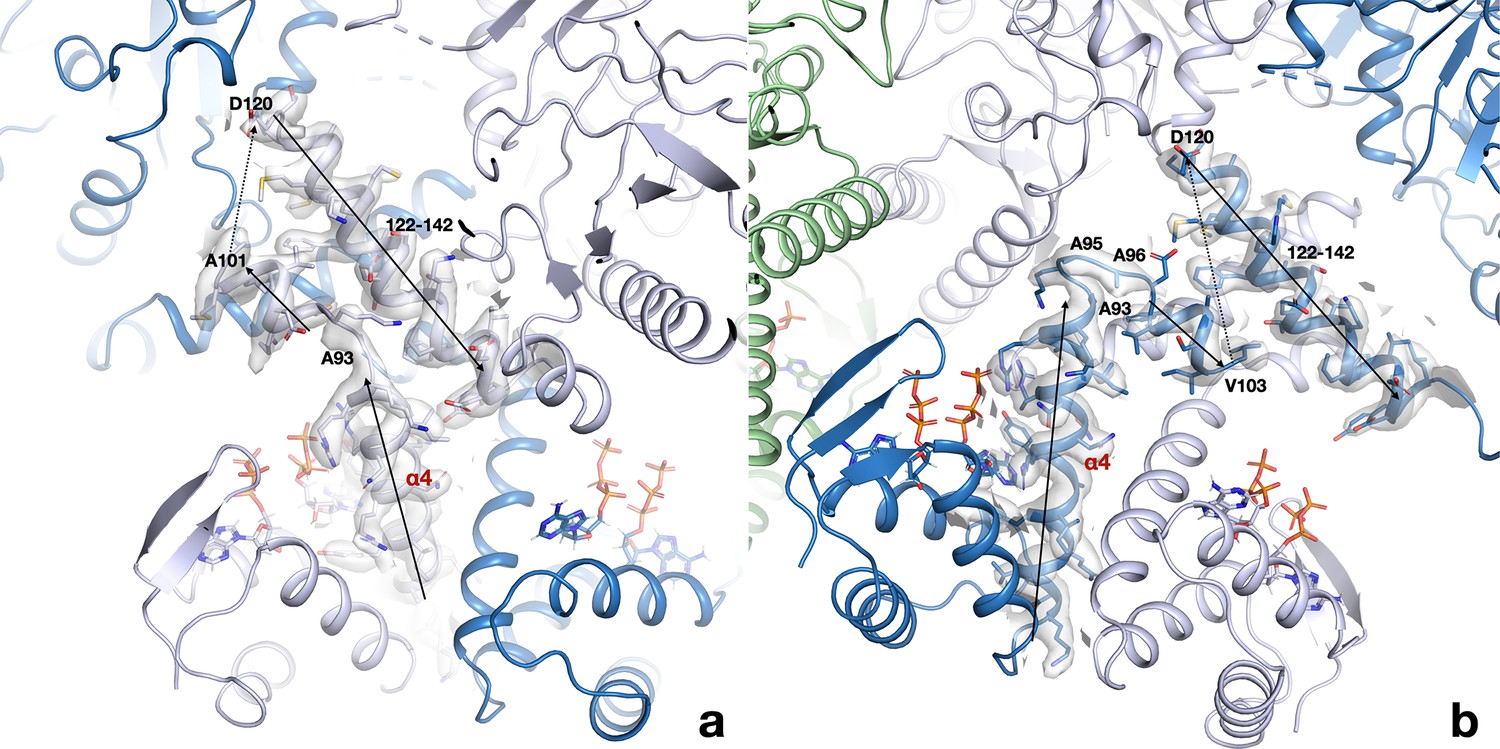
The linker region between the ATP-cone and the first helix of the core domain interacts very differently in the two monomers of each dimer.
(a) Conformation in chains A and C; (b) conformation in chains B and D. The region around residues 93–97 adopts two very different conformations and as a consequence the following short helix is either parallel to the first helix of the core domain in chains A/C or antiparallel in chain B/D. Chains A/C are drawn in light blue, chains B/D in dark blue. The cryo-EM map is shown as a transparent surface.
Figure 9—figure supplement 5
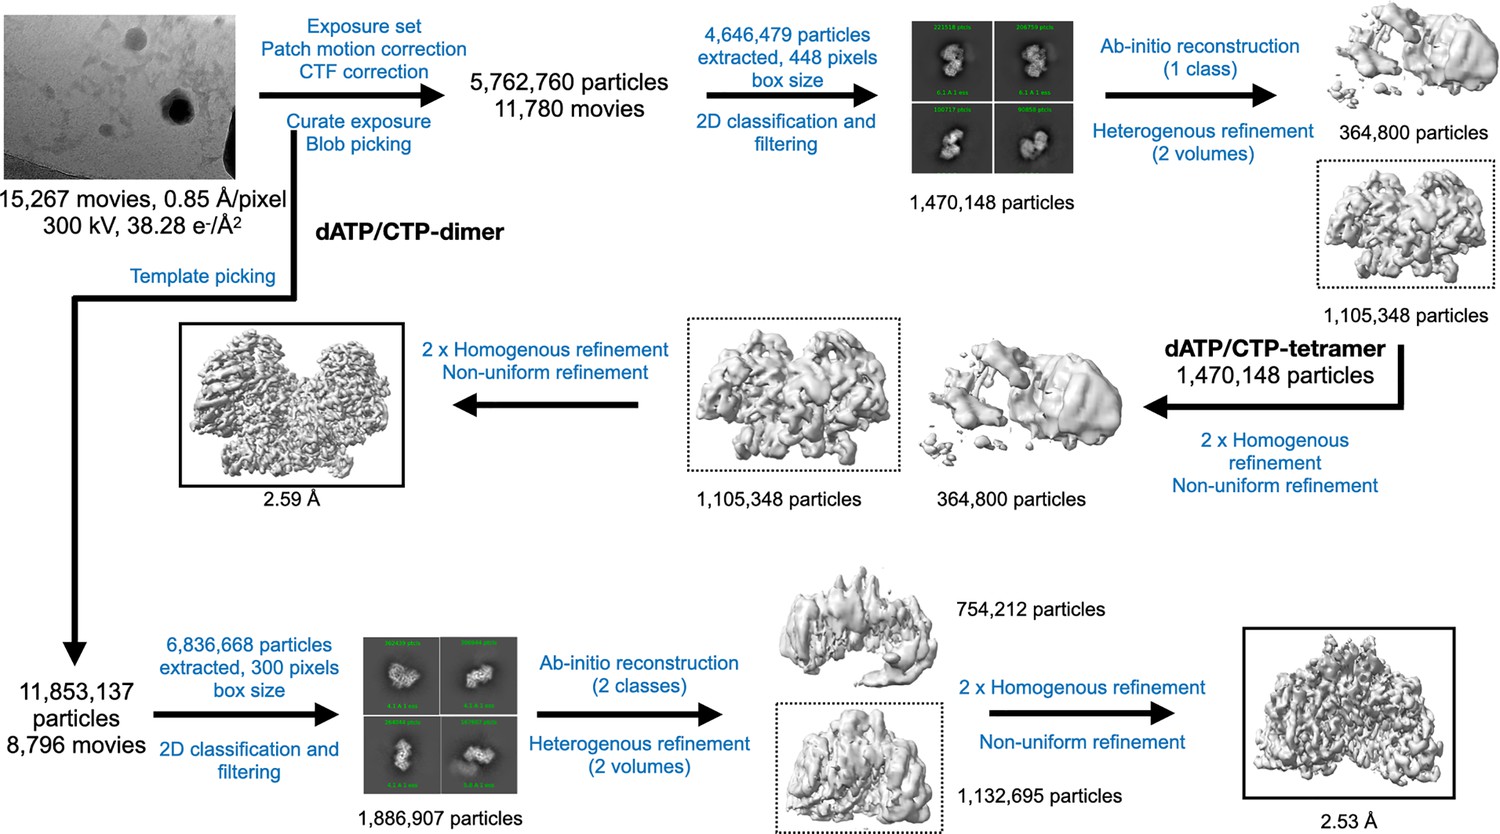
Cryo-EM data processing workflow for PcNrdD in the presence of dATP/CTP.
Figure 10
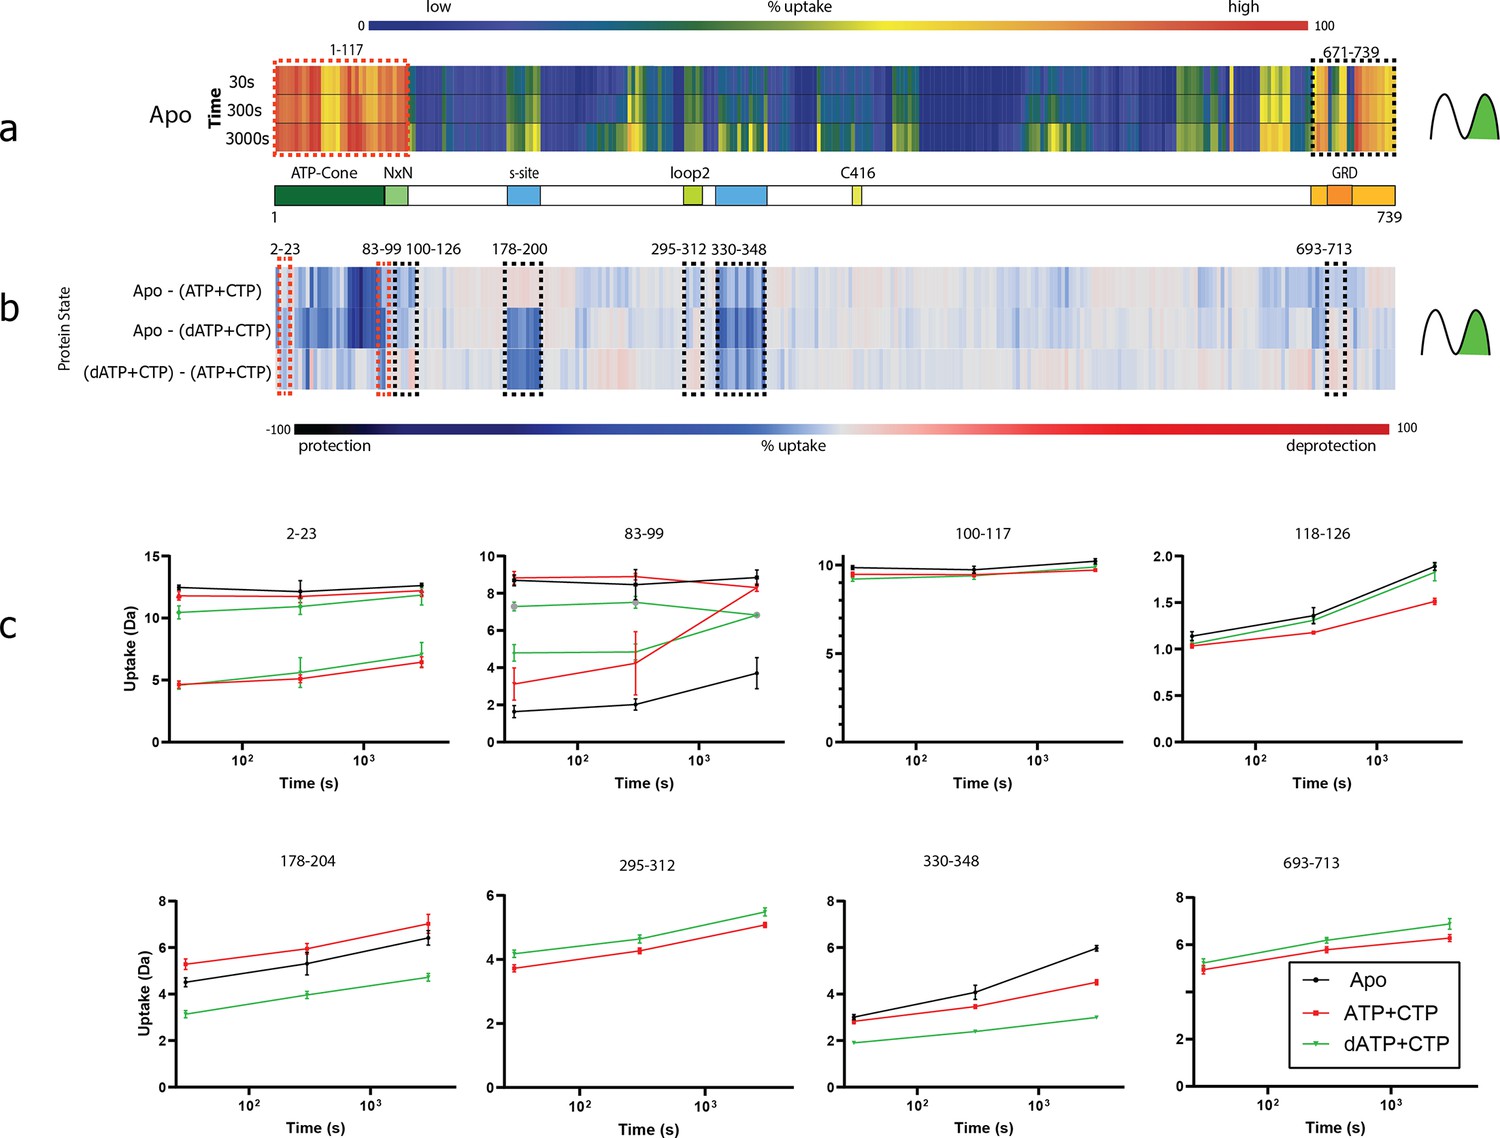
Summary of the hydrogen–deuterium exchange mass spectrometry (HDX-MS) experiments.
(a) Heat map showing the deuterium uptake of the apo state for time points 30, 300, and 3000 s. Warm colours represent fast uptake and cold colours a low uptake. Both the N- and the C-terminal regions have a high uptake already at 30 s. For the N-terminal bimodal uptake, only the fast-exchanging population (rightmost) is depicted. The influence of bimodal uptake and more detail can be seen in Figure 10—source data 1. (b) Differential chiclet plot (Zhang et al., 2021) collapses the timepoints into a single maximum deuterium uptake difference for states apo-(ATP + CTP), apo-(dATP + CTP), and (dATP + CTP)–(ATP + CTP). Colours range from deep blue for a high degree of relative protection to deep red for high deprotection. Areas marked with dashed red boxes are peptides showing bimodal uptake, that is two conformational populations present simultaneously, and black dashed boxes denote areas with peptides having EX2 exchange (only one conformational population in the observed timespan). (c) Deuterium uptake plots from dashed areas in (b). For peptides 2–23 and 83–99, when there are two lines with the same colour, the top traces are for the fast-exchanging population and the bottom for a less dynamic/more protected population. Note that for peptides 83–99, the apo state has two populations at all timepoints, while the ATP and dATP converge at 3000 s to one (dynamic) population. For peptides 295–312 and 693–713, the apo curve has been removed for visual clarity.
-
Figure 10—source data 1
Detailed analyses of the hydrogen–deuterium exchange mass spectrometry (HDX-MS) data, including the bimodal uptake distribution in the N-terminal region.
- https://cdn.elifesciences.org/articles/89292/elife-89292-fig10-data1-v1.xlsx
Figure 11
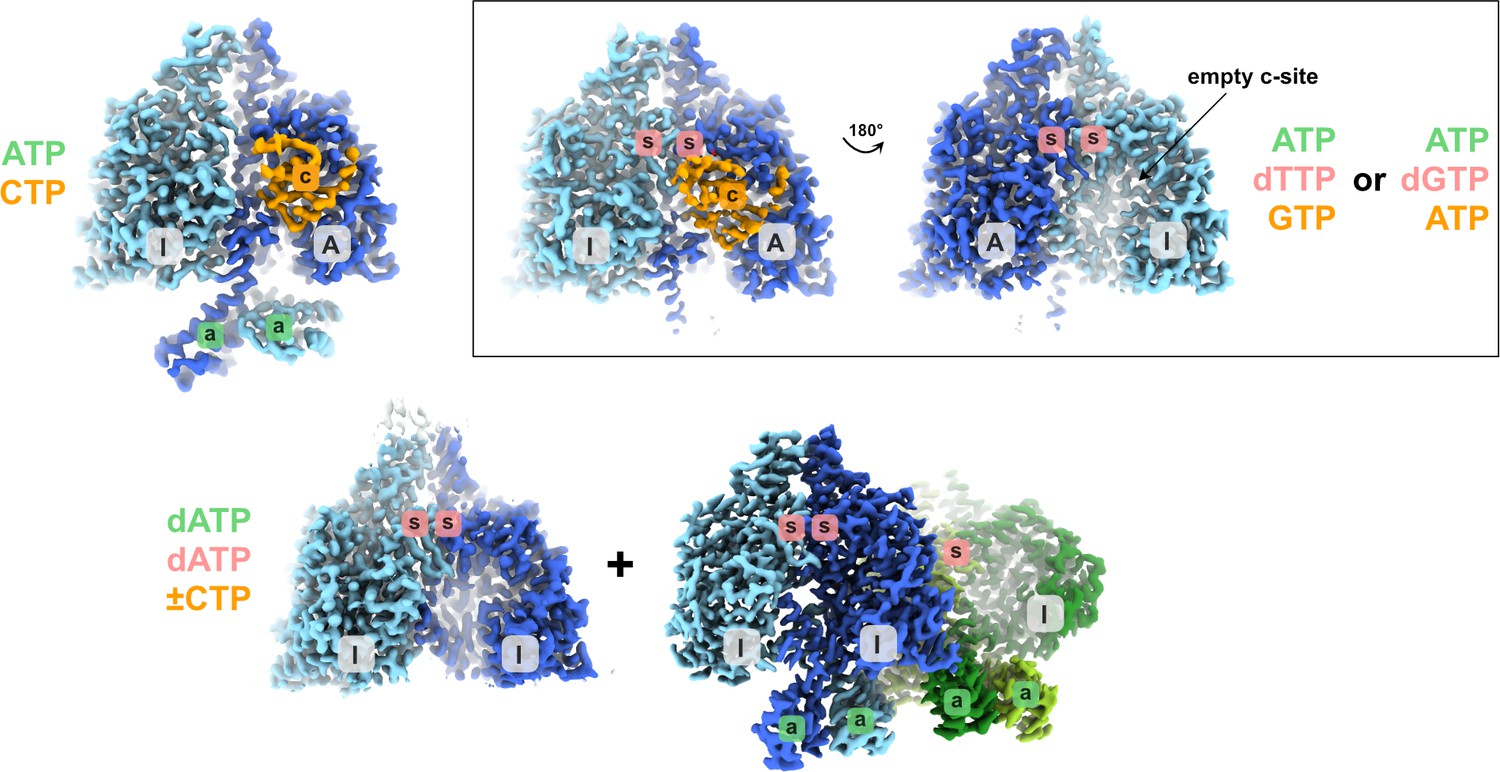
Schematic showing the different structural states of PcNrdD described in this work.
The glycyl radical domain (GRD) is coloured orange where present. Inactive and active monomers are labelled I and A, respectively. The a-site in the ATP-cone is labelled with ‘a’ on a green background, the s-site at the dimer interface with ‘s’ on a red background and the active site with ‘c’ on an orange background. Labels are only present when a nucleotide is observed in the structure. The ligands bound are listed, coloured according to the sites they bind to. In the dATP/dATP–CTP tetramer, one of the inactive monomers and its s-site are hidden behind the dimer in the foreground.
Tables
Table 1
Amount of ATP and/or dATP bound to PcNrdD under different incubation and desalting conditions.
| Incubating conditions | Desalting conditions | ATP (mol/mol NrdD) | dATP (mol/mol NrdD) |
|---|---|---|---|
| NrdD + ATP* | No nucleotides during desalting | 0.09*** | 0 |
| NrdD + dATP† | 0 | 0.97††† | |
| NrdD + ATP + dATP ‡ | 0.01 | 0.89 ‡ ‡ ‡ | |
| NrdD + ATP + dTTP + GTP § | No nucleotides during desalting | 0.03 | 0.01 |
| NrdD + dATP + dTTP + GTP ¶ | 0 | 0.64 | |
| NrdD + ATP + dATP + dTTP + GTP** | 0.01 | 1 | |
| NrdD + ATP + dTTP + GTP†† | dTTP + GTP included during desalting ¶ ¶ | 0.35 | 0 |
| NrdD + dATP + dTTP + GTP ‡ ‡ | 0 | 0.52 | |
| NrdD + ATP + dATP + dTTP + GTP § § | 0.05 | 0.85 |
-
*
1 mM ATP.
-
†
1 mM dATP.
-
‡
1 mM ATP, 1 mM dATP.
-
§
3 mM ATP, 1 mM dTTP, 5 mM GTP.
-
¶
1 mM dATP, 1 mM dTTP, 5 mM GTP.
-
**
3 mM ATP, 1 mM dATP, 1 mM dTTP, 5 mM GTP.
-
††
3 mM ATP, 2 mM dTTP, 5 mM GTP.
-
‡ ‡
1 mM dATP, 2 mM dTTP, 5 mM GTP.
-
§ §
3 mM ATP, 1 mM dATP, 2 mM dTTP, 5 mM GTP.
-
¶ ¶
0.1 mM dTTP, 1 mM GTP.
-
***
Summary of 0.07 mol/mol NrdD ATP and 0.02 mol/mol NrdD ADP.
-
†††
Summary of 0.78 mol/mol NrdD dATP, 0.18 mol/mol NrdD dADP, and 0.01 mol/ molNrdD dAMP.
-
‡ ‡ ‡
Summary of 0.70 mol/mol NrdD dATP, 0.18 mol/mol NrdD dADP, and 0.01 mol/mol NrdD dAMP.
Table 2
Calculated numbers of monomers based on measured molecular weight and fractions of dimers versus tetramers after conversion of experiments (a) and (b) to mass concentrations.
| Effector(s) | Mw (kDa) | No. of monomers | Dimers vs. tetramers (%) |
|---|---|---|---|
| ATP (50 µM) | 176/358 | 2.1/4.2 | 50/50 |
| ATP (100 µM) | 178/360 | 2.1/4.3 | 60/40 |
| ATP (100 µM)+CTP | 179/356 | 2.1/4.3 | 64/36 |
| ATP (100 µM)+dTTP | 171/348 | 2.1/4.2 | 60/40 |
| dATP (50 µM) | 167/363 | 2.0/4.3 | 32/68 |
| dATP (100 µM) | 179/361 | 2.1/4.3 | 32/68 |
| dATP (50 µM)+CTP | 175/358 | 2.1/4.2 | 34/66 |
Table 3
Structural similarity comparisons to PcNrdD.
Structural similarity tables from DALI (PDB90, i.e. targets filtered at 90% sequence identity).
| PDB ID | Protein | Z-score | Residues aligned | RMSD (Å) | Sequence identity (%) |
|---|---|---|---|---|---|
| 1H7A | Bacteriophage T4 NrdD | 34.6 | 535 | 2.5 | 27 |
| 4U3E | T. maritima NrdD | 25.5 | 508 | 3.0 | 16 |
| 4COL | T. maritima NrdD / dATP | 24.8 | 493 | 2.9 | 17 |
Table 4
Structural similarity comparisons to PcNrdD ATP-cone alone.
The PcNrdD ATP-cone in the comparison is the one from the dATP tetramer structure.
| PDB ID | Protein | No. of bound nucleotides | Z-score | Residues aligned | RMSD (Å) | Sequence identity (%) |
|---|---|---|---|---|---|---|
| 5IM3 | P. aeruginosa NrdA | 2 dATP | 12.2 | 92 | 1.9 | 29 |
| 5OLK | L. blandensis NrdB | 2 dATP | 12.1 | 93 | 1.7 | 33 |
| 7P37 | S. coelicolor NrdR | 2 ATP | 10.0 | 82 | 2.4 | 17 |
| 6AUI | Human NrdA/dATP | 1 dATP | 9.5 | 88 | 2.8 | 19 |
| 7AGJ | A. aeolicus NrdA/ATP | 2 ATP | 8.7 | 88 | 2.2 | 17 |
| 5R1R | E. coli NrdA E441A | – | 8.2 | 88 | 3.3 | 16 |
| 7MDI | N. gonorrhoeae NrdA | 1 dATP | 7.4 | 87 | 3.4 | 16 |
Table 5
Data collection, processing, and refinement statistics for the cryo-EM structures of PcNrdD.
| Ligands | dATP tetramer | dATP dimer | ATP–dTTP–GTP dimer | ATP–dGTP dimer | ATP–CTP dimer | dATP–CTP tetramer | dATP–CTP dimer |
|---|---|---|---|---|---|---|---|
| PDB entry | 8P28 | 8P27 | 8P2S | 8P39 | 8P23 | 8P2C | 8P2D |
| EMDB entry | EMD- 17359 | EMD- 17358 | EMD- 17373 | EMD- 17385 | EMD- 17357 | EMD-17360 | EMD-17361 |
| Concentrations (mM) | 0.5 | 5.0/1.0 / 1.0 | 5.0/1.0 | 0.5/0.5 | 0.5/0.5 | ||
| Grids | Quantifoil 1.2/1.3, 300 mesh Cu | Quantifoil 2.1, 300 mesh Au | Quantifoil 2.1, 300 mesh Au | Quantifoil 2.1, 300 mesh Cu | Quantifoil 2.1, 300 mesh Cu | ||
| Pixel size (Å) | 0.8676 | 0.824 | 0.860 | 0.8676 | 0.8464 | ||
| Dose rate (e−/px/s) | 16.1 | 15.0 | 15.0 | 17.1 | 13.7 | ||
| Exposure time (s) | 2.0 | 2.0 | 2.0 | 2.1 | 2.0 | ||
| Total dose (e−/Å2) | 46 | 40 | 40 | 48 | 38 | ||
| Defocus range (μM) | −1.0 to −3.4 | −0.8 to −2.2 | −0.6 to −2.4 | −0.6 to −2.4 | −0.6 to −2.0 | ||
| Micrographs used (collected) | 16,667 (21,804) | 4964 (12,501) | 14,346 (16,745) | 17,033 (21,512) | 11,780 (15,268) | 8796 (15,268) | |
| Particles in final class | 1,349,133 | 1,009,021 | 437,866 | 589,345 | 291,231 | 1,105,348 | 1,132,695 |
| Symmetry | C2 | C1 | C1 | C1 | C1 | C2 | C1 |
| Resolution (FSC = 0.143; Å) | 2.77 | 2.73 | 2.40 | 2.56 | 3.17 | 2.59 | 2.59 |
| Map sharpening B-factor (Å2) | 138.5 | 128.0 | 70.5 | 72.3 | 152.8 | 107.8 | 108.9 |
| CC (mask) from phenix.refine | 0.76 | 0.77 | 0.76 | 0.63 | 0.74 | 0.81 | 0.64 |
| Model composition | |||||||
| Non-hydrogen atoms (residues) | 21,141 (2584) | 8710 (1089) | 9694 (1201) | 9705 (1200) | 11,399 (1401) | 21,137 (2584) | 8793 (1087) |
| Ligands | 8 dATP (a) 4 dATP (s) | 2 dATP (s) | 2 dTTP (s) 1 GTP (c) | 2 dGTP (s) 1 ATP (c) | 4 ATP (a) 1 CTP (c) | 8 dATP (a) 4 dATP (s) | 2 dATP (s) |
| min/mean/max B-factors protein (Å2) | 52.8/63.4/84.7 | 40.2/50.6/66.6 | 25.6/35.4/72.9 | 12.6/41.2/98.7 | 15.7/66.1/124.4 | 15.5/49.4/136.4 | 30.9/43.6/78.1 |
| min/mean/max B-factors ligands (Å2) | 55.8/62.9/74.5 | 47.1/47.2/47.4 | 25.4/33.1/79.3 | 10.8/33.1/88.0 | 26.0/81.2/123.7 | 18.0/46.8/92.7 | 35.9/36.2/47.2 |
| Deviations from ideal geometry | |||||||
| rmsd (bonds) | 0.005 | 0.004 | 0.003 | 0.003 | 0.004 | 0.004 | 0.002 |
| rmsd (angles) | 0.61 | 0.55 | 0.54 | 0.60 | 0.58 | 0.59 | 0.51 |
| Ramachandran plot (%) | |||||||
| Favoured | 90.1 | 91.7 | 95.2 | 93.8 | 93.8 | 94.1 | 92.0 |
| Allowed | 9.9 | 8.3 | 4.7 | 5.8 | 5.9 | 5.9 | 8.0 |
| Outliers | 0.0 | 0.0 | 0.1 | 0.4 | 0.3 | 0.0 | 0.0 |
| Rotamer outliers | 1.9 | 5.4 | 3.0 | 6.0 | 3.8 | 4.2 | 4.8 |
| MolProbity score | 2.1 | 2.4 | 2.2 | 2.5 | 2.2 | 2.3 | 2.5 |
| MolProbity clash score | 6.5 | 6.2 | 8.7 | 10.0 | 5.5 | 7.1 | 10.2 |
Additional files
Download links
A two-part list of links to download the article, or parts of the article, in various formats.
Downloads (link to download the article as PDF)
Open citations (links to open the citations from this article in various online reference manager services)
Cite this article (links to download the citations from this article in formats compatible with various reference manager tools)
Nucleotide binding to the ATP-cone in anaerobic ribonucleotide reductases allosterically regulates activity by modulating substrate binding
eLife 12:RP89292.
https://doi.org/10.7554/eLife.89292.4


