Elevated glycolytic metabolism of monocytes limits the generation of HIF1A-driven migratory dendritic cells in tuberculosis
- Instituto de Medicina Experimental (IMEX)-CONICET, Academia Nacional de Medicina, Argentina
- International Associated Laboratory (LIA) CNRS IM-TB/HIV (1167), Buenos Aires, Argentina / International Research Project Toulouse, France
- Instituto de Investigaciones Biomédicas en Retrovirus y Sida (INBIRS), Consejo Nacional de Investigaciones Científicas y Técnicas (CONICET) - Universidad de Buenos Aires, Argentina
- Institut de Pharmacologie et de Biologie Structurale, Université de Toulouse, CNRS, UPS, France
- Aix Marseille University, CNRS, INSERM, CIML, Centre d'Immunologie de Marseille-Luminy, France
- Instituto Prof. Dr. Raúl Vaccarezza and Hospital de Infecciosas Dr. F.J. Muñiz, Argentina
Figures
Figure 1
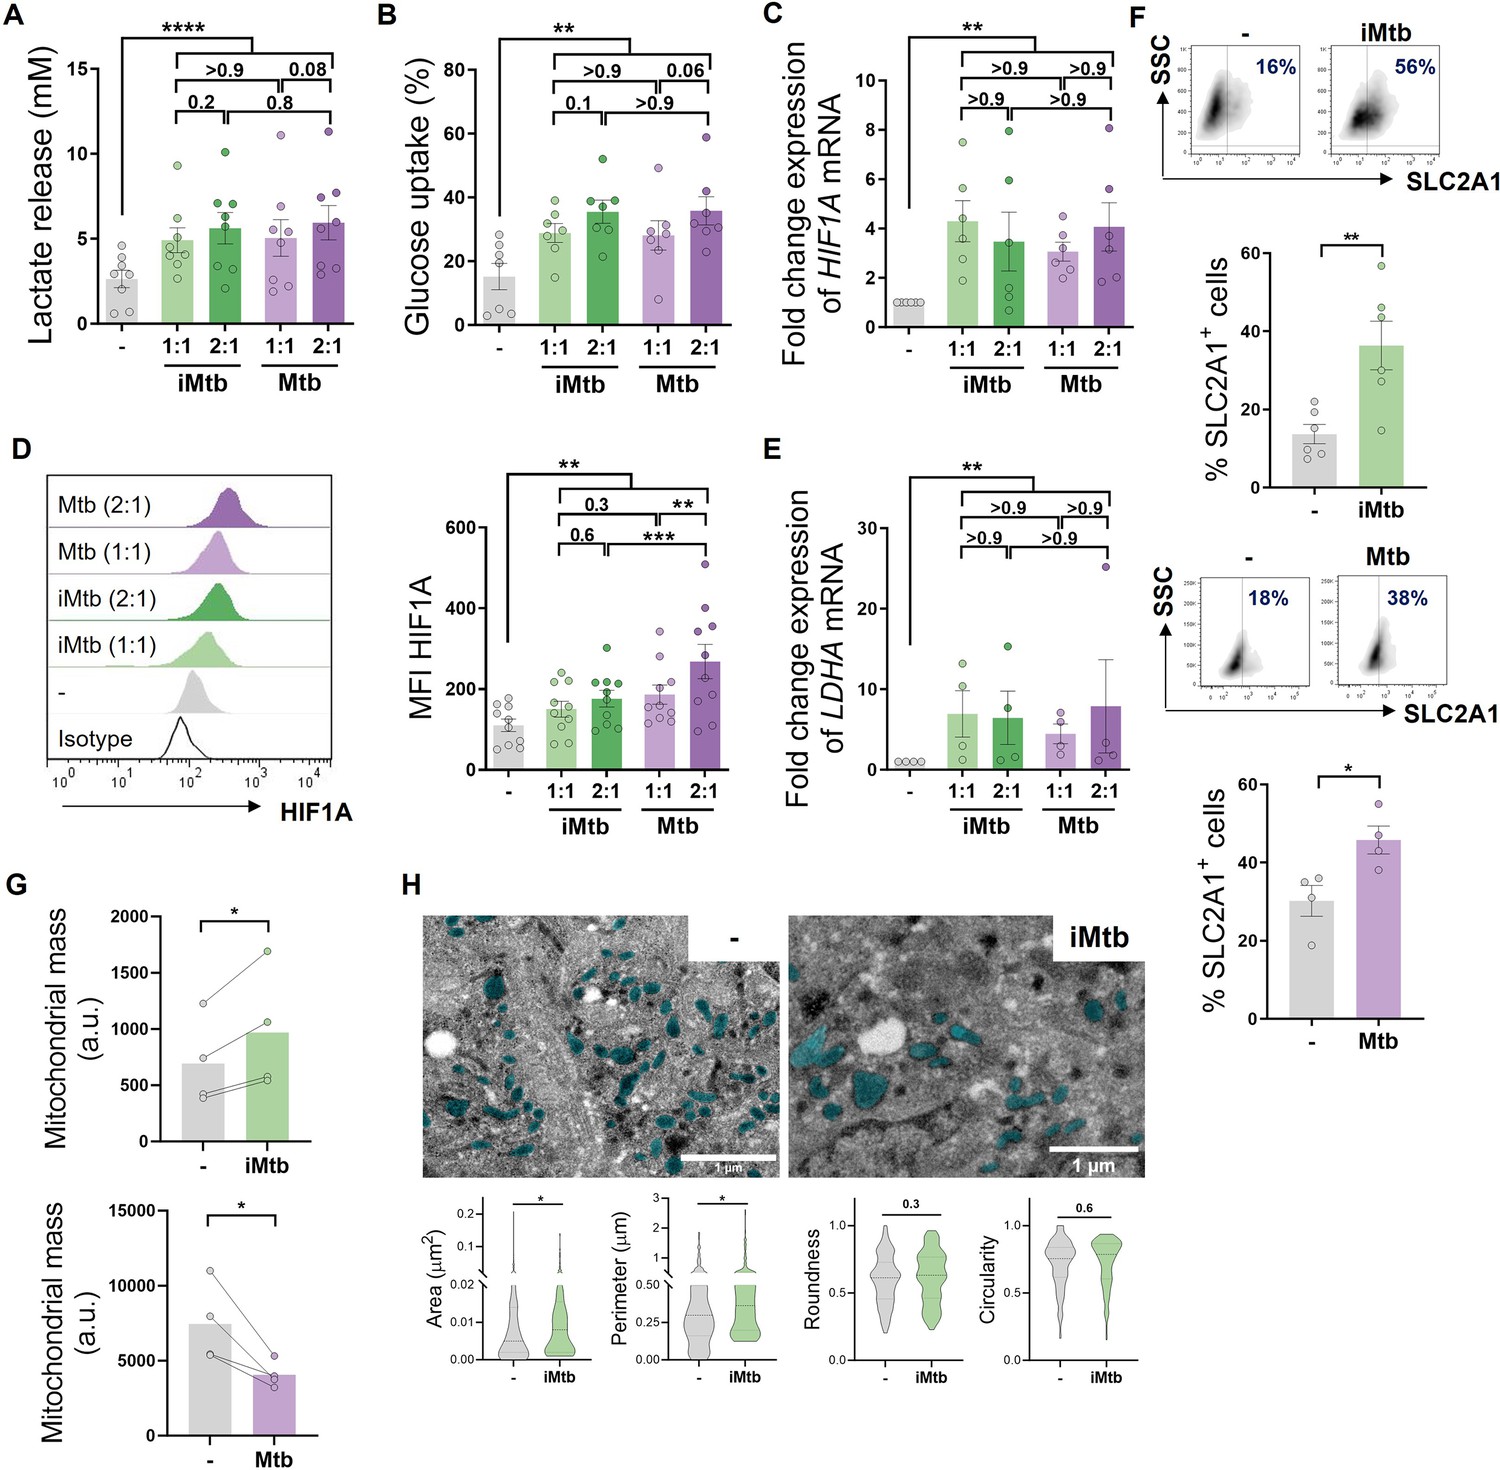
Mycobacterium tuberculosis (Mtb) rewires the metabolic network of monocyte-derived dendritic cells (Mo-DCs).
Mo-DCs were stimulated with viable or irradiated Mtb (iMtb) at two multiplicities of infection (1 or 2 Mtb per DC) for 24 hr. Glycolysis was measured as (A) lactate release in culture supernatants (N = 8); (B) Glucose uptake measured in culture supernatants (N = 7); (C) relative expression of HIF1A mRNA normalized to EEF1A1 control gene (N = 6). (D) Representative histograms of the mean fluorescence intensity (MFI) of HIF1A as measured by flow cytometry. Quantification shown in graph to the right (N = 10). (E) Relative expression of lactate dehydrogenase A (LDHA) mRNA normalized to EEF1A1 control gene (N = 4). (F) FACS plots show the percentage of Glut1+ cells with and without iMtb stimulation or infected with viable Mtb in a representative experiment. Quantification of Glut1+ cells plotted below (N = 4–6). (G) MFI of Mitospy probe as a measurement of mitochondrial mass for Mo-DCs treated (or not) with iMtb (upper panel) or infected with viable Mtb (lower panel). The data are represented as scatter plots, with each circle representing a single individual, means ± SEM are shown (N = 4). (H) Representative electron microscopy micrographs of control and iMtb-stimulated DCs showing mitochondria colored in cyan (left panels) and quantified morphometric analysis (right panels) (N = 4). Statistical significance was assessed in (A–E) using two-way ANOVA followed by Tukey’s multiple-comparisons test (*p<0.05; **p<0.01; ****p<0.0001), and in (F–H) using paired t-test (*p<0.05) for iMtb versus controls. All values are expressed as means ± SEM.
Figure 2 with 1 supplement
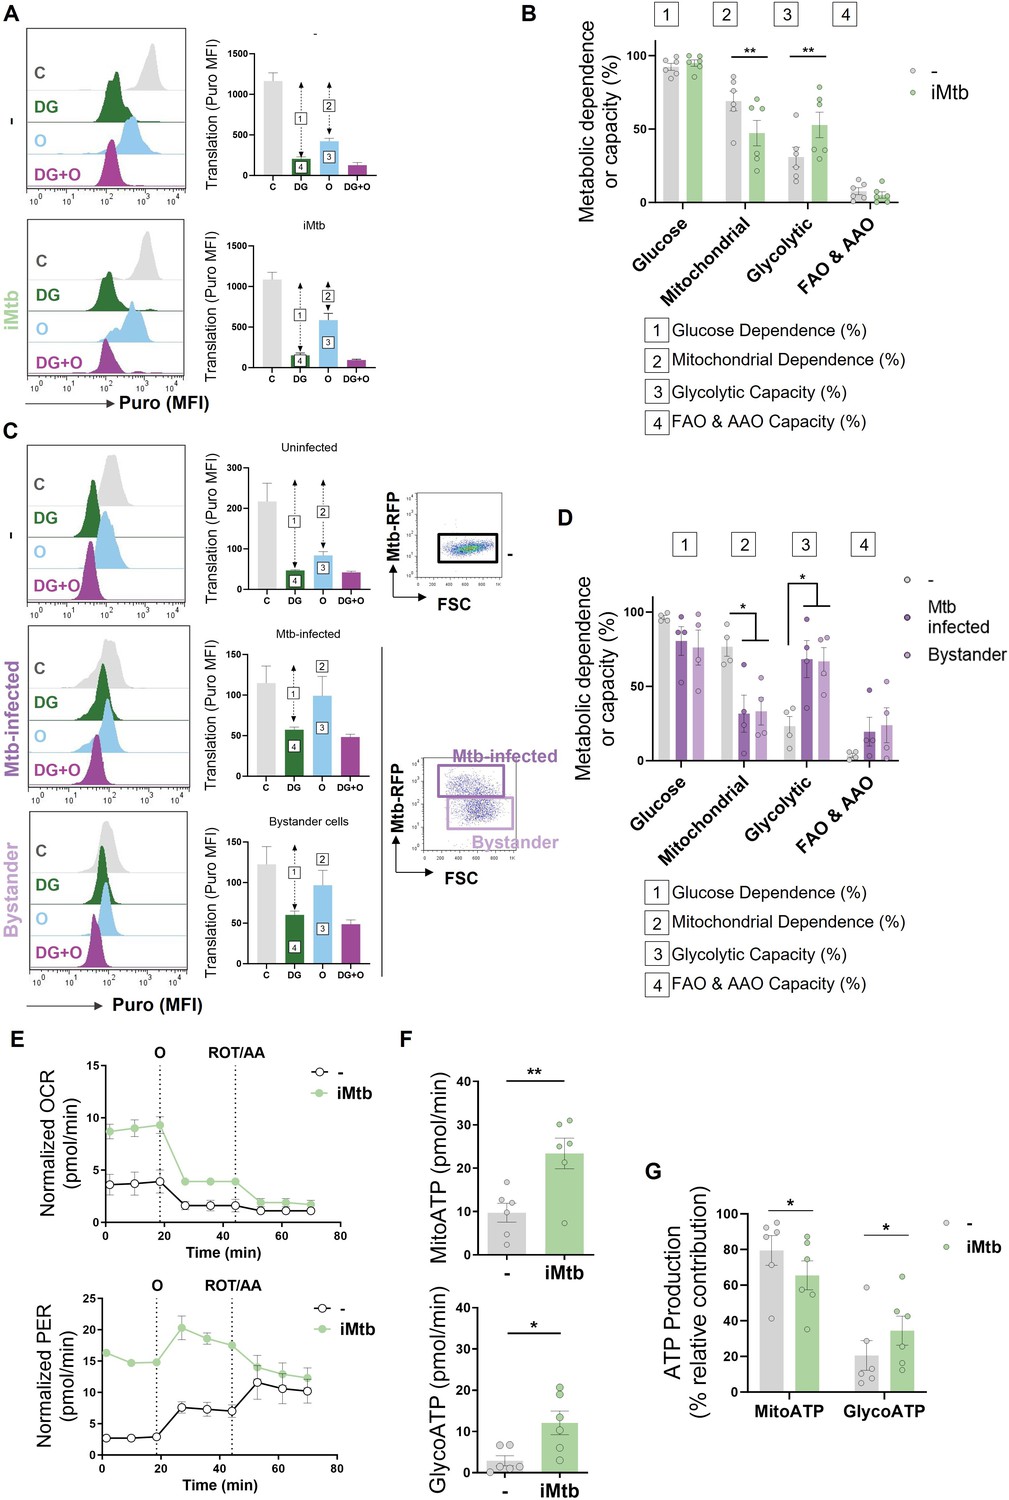
Mycobacterium tuberculosis (Mtb) skews dendritic cell (DC) metabolism toward glycolysis.
Monocyte-derived DCs (Mo-DCs) were stimulated with irradiated Mtb (iMtb) or infected with Mtb expressing red fluorescent protein (Mtb-RFP, panel C). (A) Representative histograms showing the translation level after puromycin (Puro) incorporation and staining with a monoclonal anti-Puro (anti-Puro mean fluorescence intensity [MFI]) in response to inhibitor treatment (C, control; DG, 2-deoxy-d-glucose; oligomycin, O; or combination treatment, DG + O). The bar plots show the values of the anti-Puro MFI from six donors. Arrows and numbers inside boxes denote the differences between the MFI of Puro in the different treatments that are used to calculate the glucose dependence (1) and fatty acids and amino acids oxidation (FAO and AAO) capacity (4); and the mitochondrial dependency (2) and glycolytic capacity (3). (B) Relative contributions of glycolytic and FAO and AAO capacities and glucose and mitochondrial dependences to overall DC metabolism analyzed with SCENITH (N = 6). (C, D) DCs were infected with Mtb-RFP for 24 hr, thereafter the metabolic profile was evaluated using SCENITH. (C) Representative histograms showing the translation level after Puro incorporation are shown for uninfected, Mtb-infected and bystander DCs (those cells that are not infected directly but rather stand nearby). The bar plots show the values of the anti-Puro MFI from four donors. Right panel shows representative plots showing the gating strategy to distinguish the populations within Mtb-infected cultures, which includes RFP+ (Mtb-infected DCs) and RFP- (bystander DCs) cells. (D) Relative contributions of glycolytic and FAO and AAO capacities and glucose and mitochondrial dependences to DC metabolism (N = 4). (E) Kinetic profile of proton efflux rate (PER; lower panel) and oxygen consumption rate (OCR; upper panel) measurements in control and iMtb-stimulated DCs in response to inhibitor treatments (oligomycin, O; ROT/AA, rotenone/antimycin A), obtained using an Agilent Seahorse XFe24 Analyzer. PER and OCR measurements were normalized to the area covered by cells. (F) ATP production rate from mitochondrial oxidative phosphorylation (MitoATP) and glycolysis (glycoATP). MitoATP production rate and glycoATP production rate were calculated from OCR and ECAR measurements in control and iMtb-stimulated DCs (N = 6). (G) Percentages of MitoATP and GlycoATP relative to overall ATP production (N = 6). Statistics in (B, F–G) are from paired t-test (*p<0.05; **p<0.01) for iMtb versus controls. Statistics in (D) are two-way ANOVA followed by Tukey’s multiple-comparisons test (*p<0.05) as depicted by lines. The data are represented as scatter plots, with each circle representing a single individual, means ± SEM are shown.
Figure 2—figure supplement 1

Contribution of the fatty acid oxidation (FAO) to dendritic cell (DC) metabolism in response to irradiated Mycobacterium tuberculosis (iMtb).
Relative contributions of mitochondrial and FAO dependences to overall DC metabolism analyzed with SCENITH in DCs exposed or not to iMtb (N = 6). Paired t-test (***p<0.001) as depicted by lines. The data are represented as scatter plots, with each circle representing a single individual, means ± SEM are shown.
Figure 3 with 1 supplement
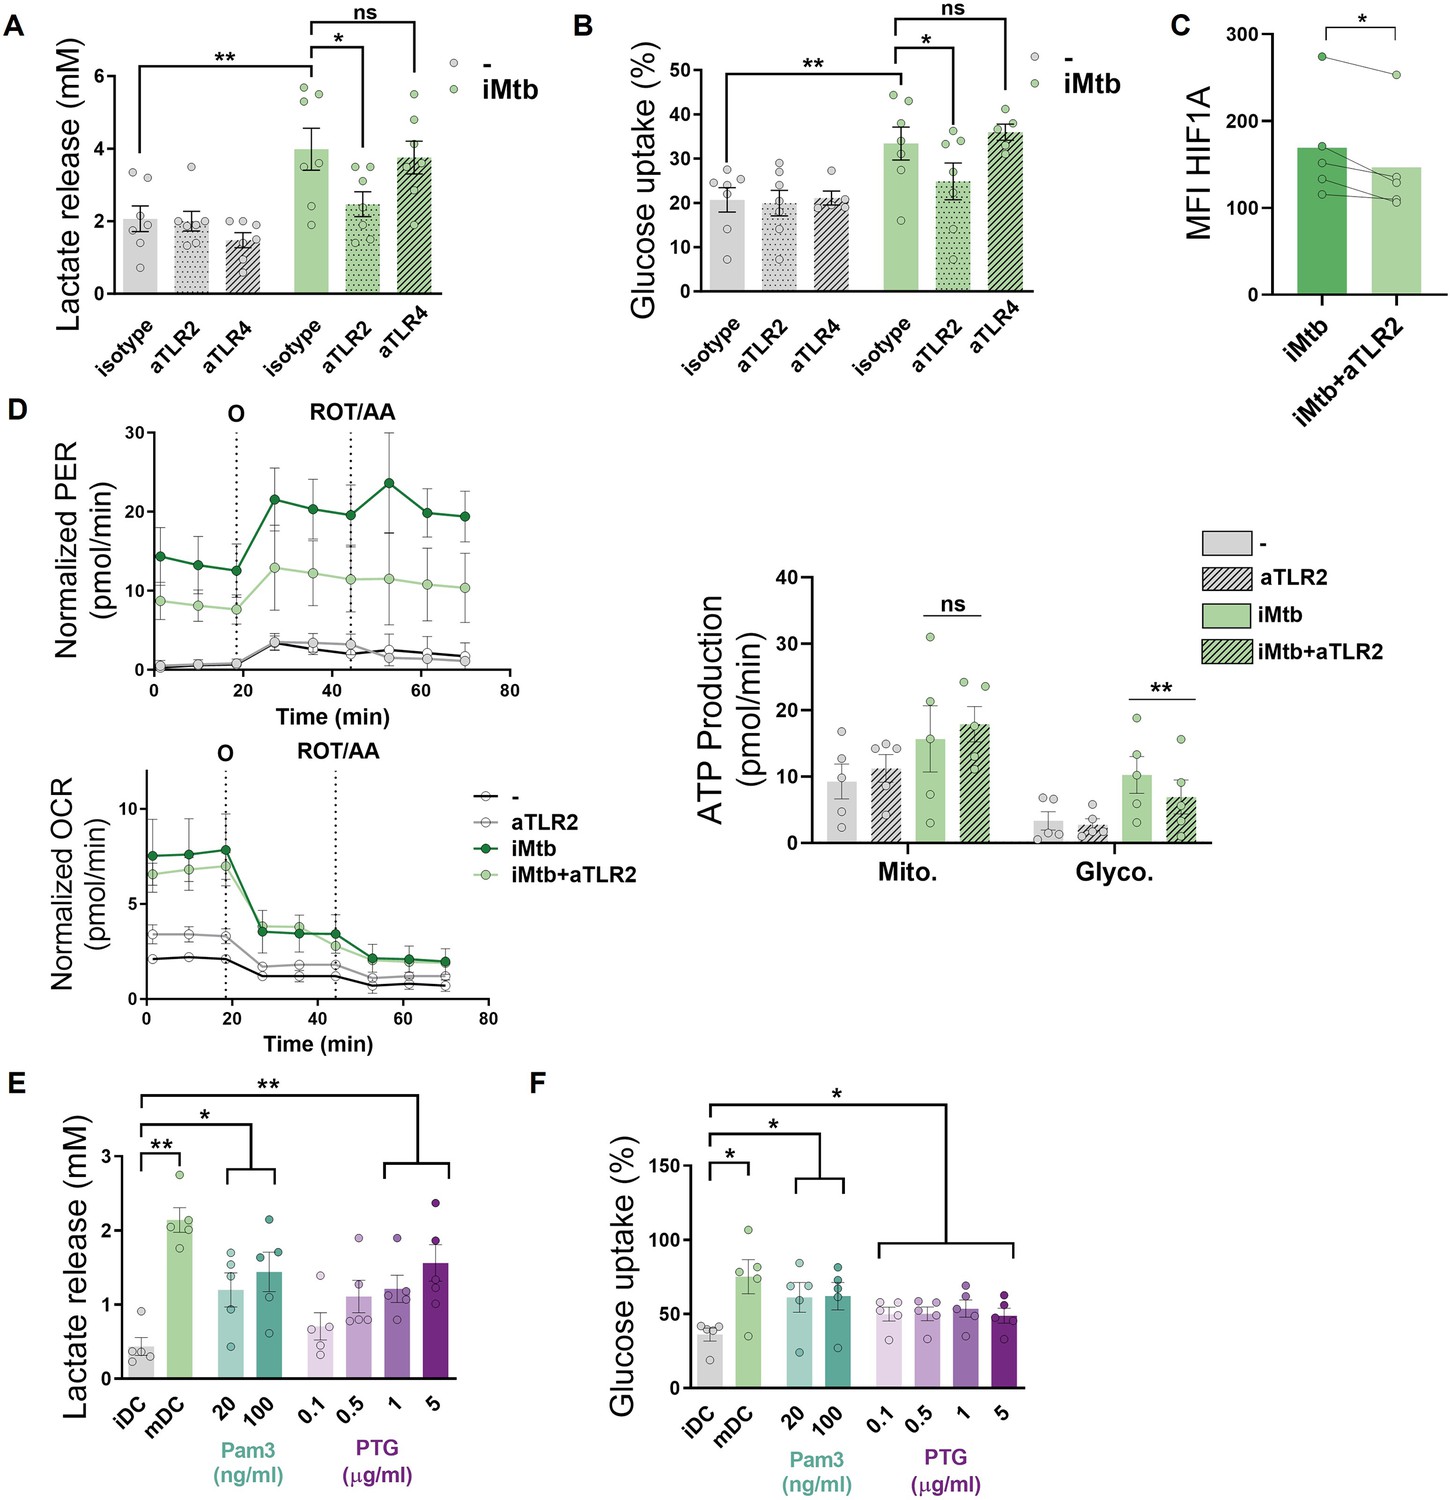
Mycobacterium tuberculosis (Mtb) triggers glycolysis through TLR2 ligation in monocyte-derived dendritic cells (Mo-DCs).
Mo-DCs were stimulated with irradiated Mtb (iMtb) in the presence of neutralizing antibodies against either TLR2 (aTLR2), TLR4 (aTLR4), or their respective isotype controls. (A) Lactate release as measured in supernatant (N = 7). (B) Glucose uptake as measured in supernatant (N = 7). (C) Mean fluorescence intensity (MFI) of HIF1A as measured by flow cytometry (N = 4). (D) Kinetic profile of proton efflux rate (PER) and oxygen consumption rate (OCR) measurements (left panels). Metabolic flux analysis showing quantification of mitochondrial ATP production and glycolytic ATP production (right panel) (N = 5). (E, F) Mo-DCs were stimulated with Pam3Cys or Mtb peptidoglycan (PTG) at the indicated concentrations. (E) Lactate release as measured in supernatant (N = 5). (F) Glucose uptake as measured in supernatant (N = 5). Statistics in (A–B, E–F) are two-way ANOVA followed by Tukey’s multiple-comparisons test (*p<0.05; **p<0.01; ****p<0.0001). Statistics in (C, D) are from paired t-test (*p<0.05) for iMtb versus controls. The data are represented as scatter plots, with each circle representing a single individual, means ± SEM are shown.
Figure 3—figure supplement 1
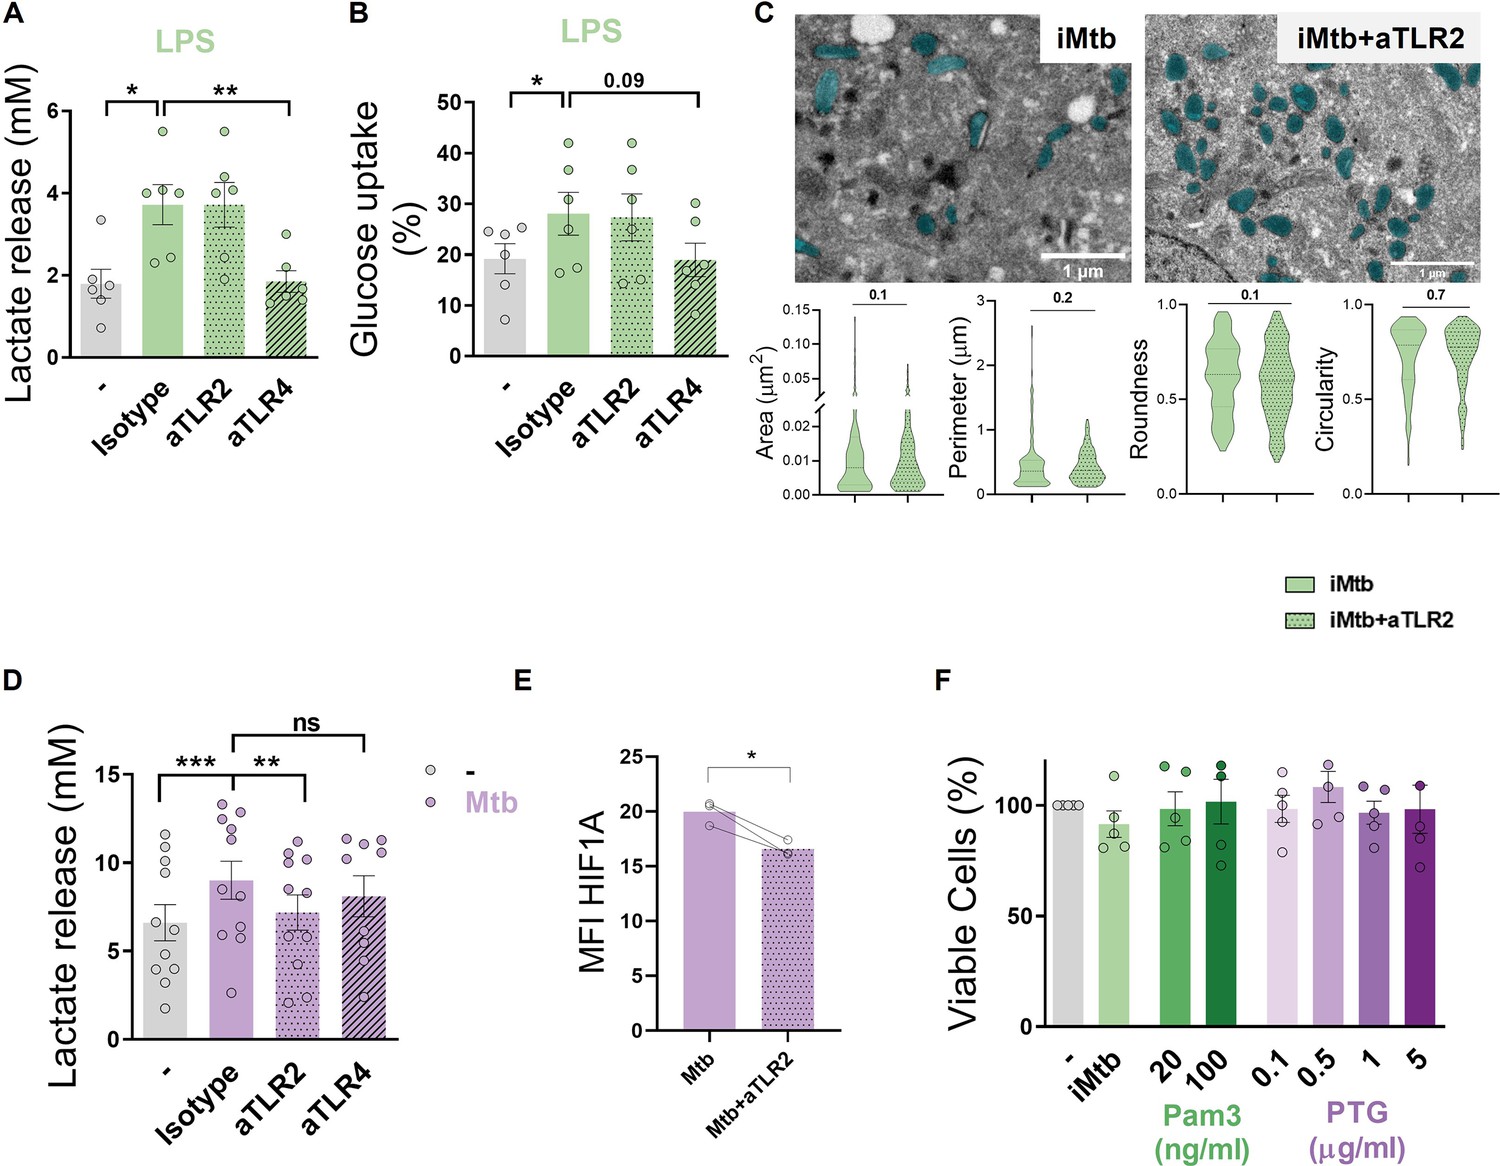
TLR2 ligation triggers glycolysis in monocyte-derived dendritic cells (Mo-DCs).
(A, B) Mo-DCs were stimulated or not with LPS in the presence of neutralizing antibodies against either TLR2 (aTLR2) or TLR4 (aTLR4). (A) Lactate release measured in supernatant (N = 6). (B) Glucose uptake measured in supernatant (N = 6). (C) Morphometric analysis of mitochondria of Mo-DCs stimulated or not with irradiated Mycobacterium tuberculosis (iMtb) in the presence of neutralizing antibodies against TLR2 (N = 4). (D, E) Mo-DCs were infected or not with Mtb in the presence of neutralizing antibodies against either TLR2 (aTLR2), or TLR4 (aTLR4). (D) Lactate release measured in supernatant (N = 11). (E) Mean fluorescence intensity (MFI) of HIF1A as measured by flow cytometry (N = 3). (F) Percentage of viable cells stimulated with the synthetic TLR2 ligand (Pam3), or different doses of the mycobacterial peptidoglycan (PTG) relative to untreated DCs (N = 5). (A–B, D–F) Two-way ANOVA followed by Tukey’s multiple-comparisons test (*p<0.05; **p<0.01), as depicted by lines. (C, E) Paired t-test (*p<0.05). The data are represented as scatter plots, with each circle representing a single individual, means ± SEM are shown.
Figure 4 with 3 supplements
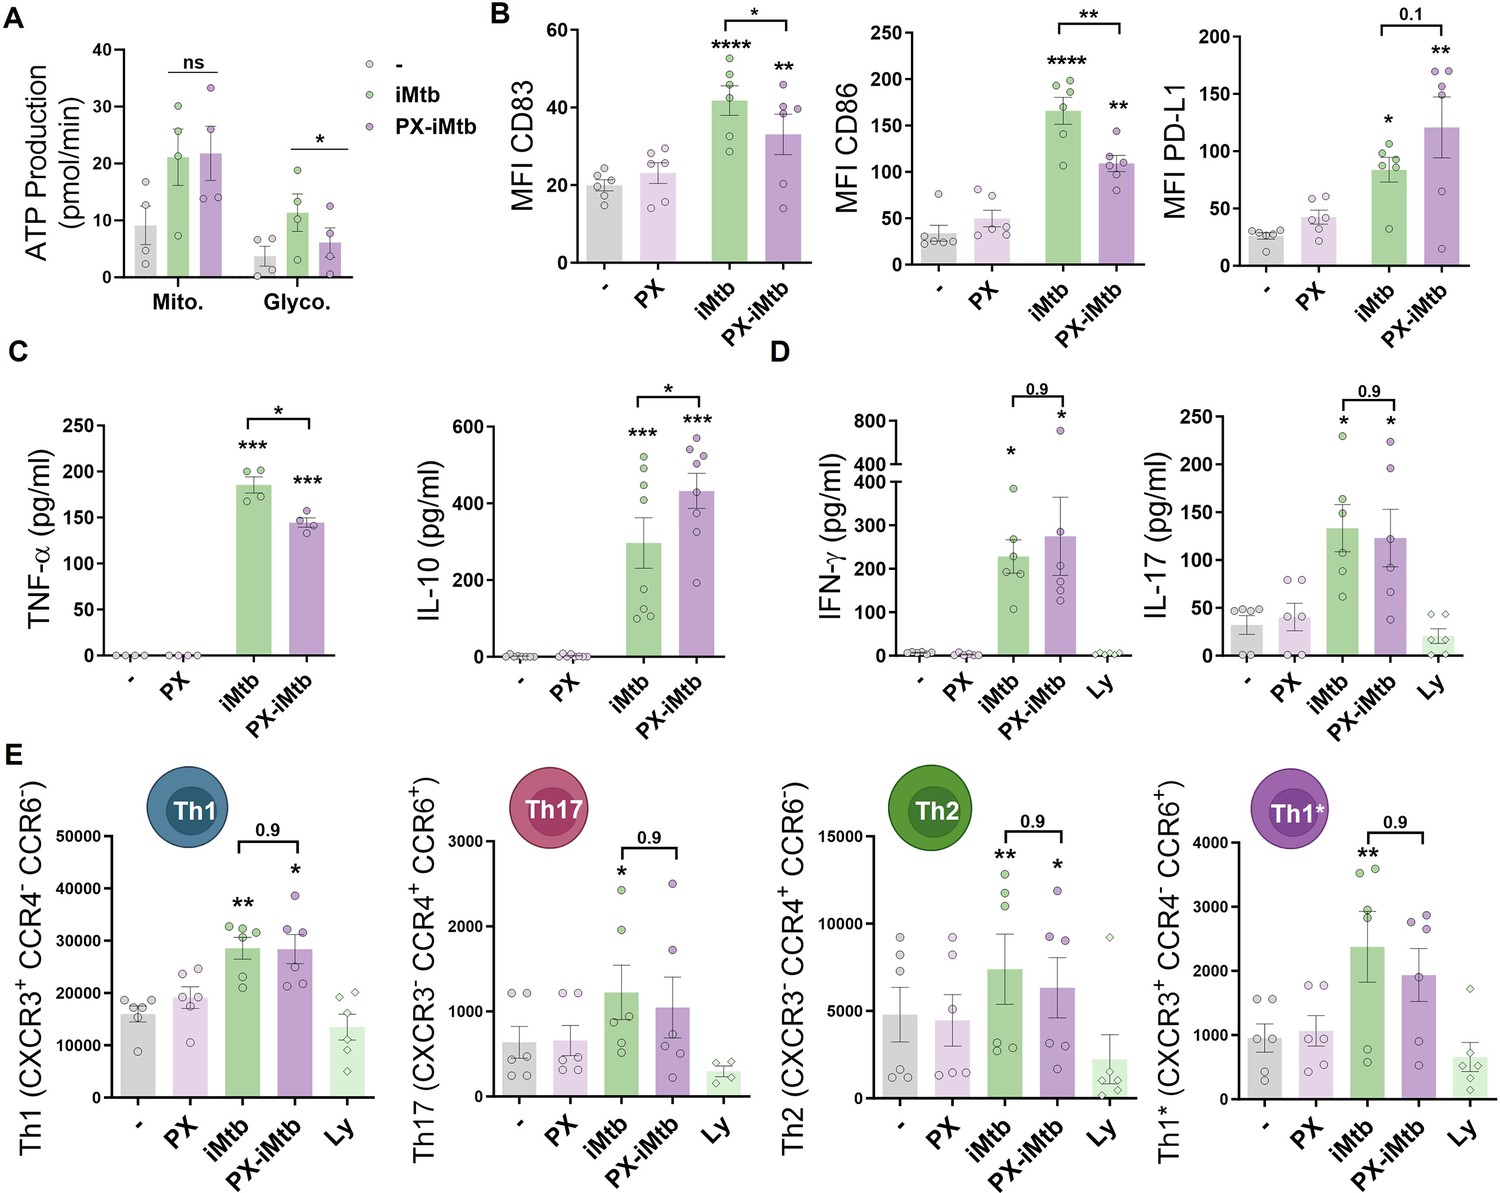
HIF1A is required for dendritic cell (DC) maturation upon irradiated Mycobacterium tuberculosis (iMtb) stimulation but not for CD4+ T lymphocyte polarization.
(A–C) Monocyte-derived DCs (Mo-DCs) were stimulated with iMtb in the presence or absence of the HIF1A inhibitor PX-478 (PX). (A) Metabolic flux analysis showing quantification of mitochondrial ATP production and glycolytic ATP production, as in Figure 2G (N = 4). (B) Mean fluorescence intensity (MFI) of CD83, CD86, and PD-L1 as measured by flow cytometry (N = 6). (C) TNF-α and IL-10 production by Mo-DCs measured by ELISA (N = 4–8). (D, E) Monocytes from PPD+ healthy donors were differentiated toward DCs, challenged or not with iMtb in the presence or absence of PX for 24 hr, washed, and co-cultured with autologous CD4+ T cells for 5 days. (D) Extracellular secretion of IFN-γ and IL-17 as measured by ELISA (N = 6). (E) Absolute abundance of Th1, Th17, Th2, and Th1/Th17 CD4+ T cells after coculture with DCs (N = 6). When indicated, lymphocytes without DCs were cultured (Ly). Statistical significance based on two-way ANOVA followed by Tukey’s multiple-comparison test (*p<0.05; **p<0.01). The data are represented as scatter plots, with each circle representing a single individual, means ± SEM are shown.
Figure 4—figure supplement 1
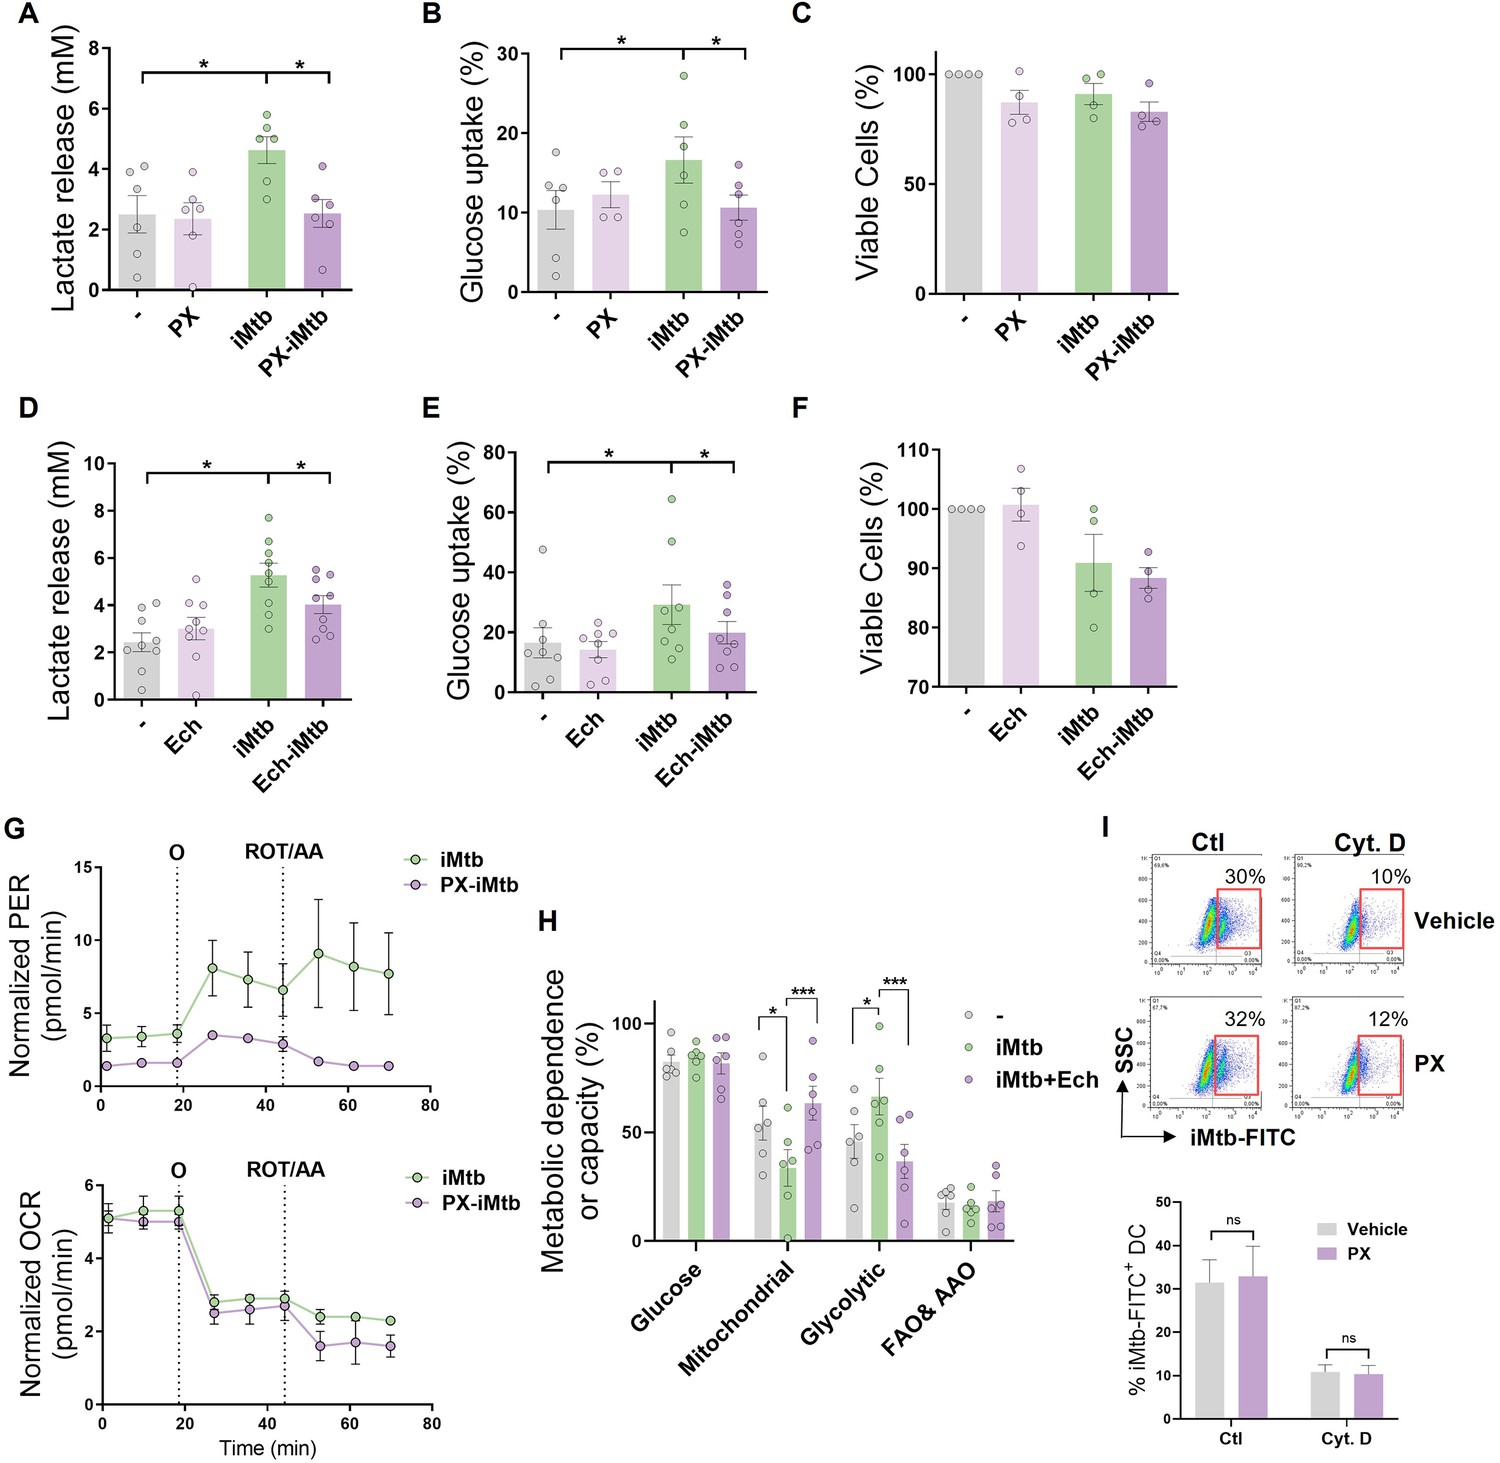
HIF1A activity is required to trigger the glycolytic pathway in irradiated Mycobacterium tuberculosis (iMtb)-stimulated dendritic cells (DCs).
Monocyte-derived DCs (Mo-DCs) were stimulated with iMtb in the presence of PX-478 (PX, A–C) or echinomycin (Ech, D–F), both HIF1A inhibitors. (A, D) Lactate release measured in supernatant (N = 6–8). (B, E) Glucose uptake measured in supernatant (N = 6–8). (C, F) Percentage of viable cells relative to untreated DCs (N = 4). (G) Kinetic profile of proton efflux rate (PER) and oxygen consumption rate (OCR) measurements in iMtb-stimulated DCs and PX-iMtb-stimulated DCs. (H) Relative contributions of glycolytic and fatty acid and amino acid oxidation (FAO and AAO) capacities and glucose and mitochondrial dependences to overall DC metabolism analyzed with SCENITH in DCs exposed to iMtb in the presence or not of Ech (N = 4). (I) Uptake of Mtb-FITC by DCs treated or not with PX-478 in the presence or not of cytochalasin D (Cyt D), a potent phagocytosis inhibitor that interferes with actin polymerization. Representative dot plots and quantifications are shown (N = 4). (A–G, I) Two-way ANOVA followed by Tukey’s multiple-comparisons test (*p<0.05), as depicted by lines. Values are expressed as means ± SEM. (H) Paired t-test (*p<0.05; ***p<0.001) as depicted by lines. The data are represented as scatter plots, with each circle representing a single individual, means ± SEM are shown.
Figure 4—figure supplement 2
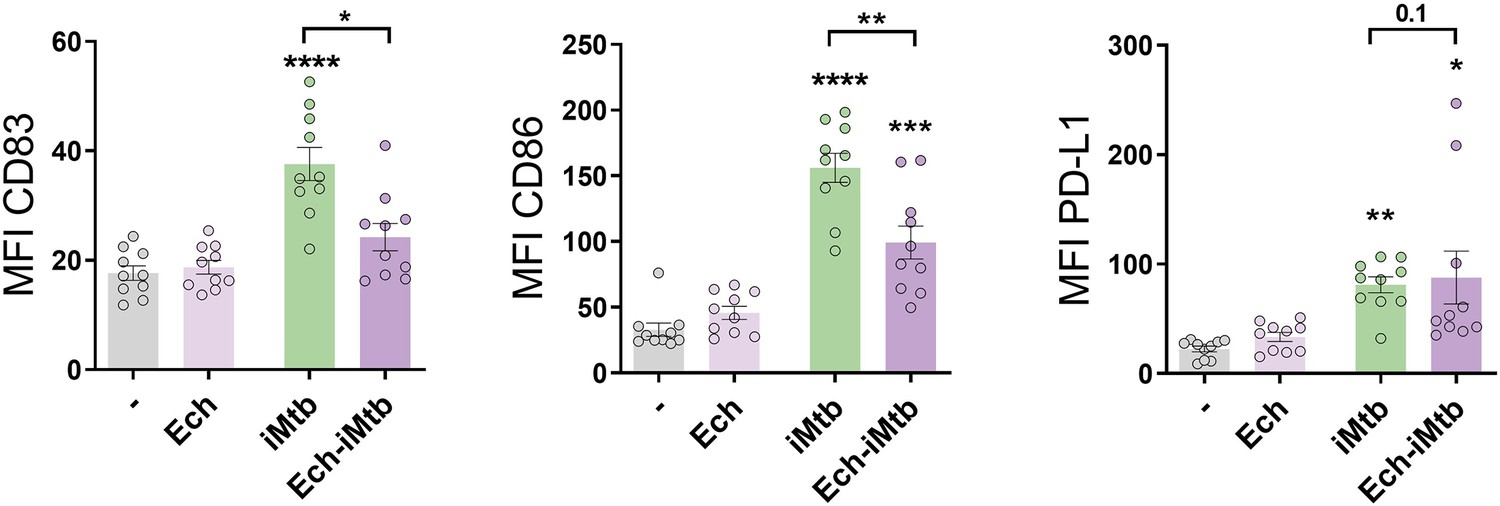
HIF1A is required to adopt a mature phenotype in irradiated Mycobacterium tuberculosis (iMtb)-stimulated dendritic cells (DCs).
Monocyte-derived DCs (Mo-DCs) were stimulated with iMtb in the presence or not of echinomycin (Ech), an HIF1A inhibitor. Mean fluorescence intensity (MFI) of CD83, CD86, and PD-L1 (N = 10). Two-way ANOVA followed by Tukey’s multiple-comparisons test (*p<0.05; **p<0.01; ***p<0.001; ****p<0.0001), compared to control cells or as depicted by lines. The data are represented as scatter plots, with each circle representing a single individual, means ± SEM are shown.
Figure 4—figure supplement 3
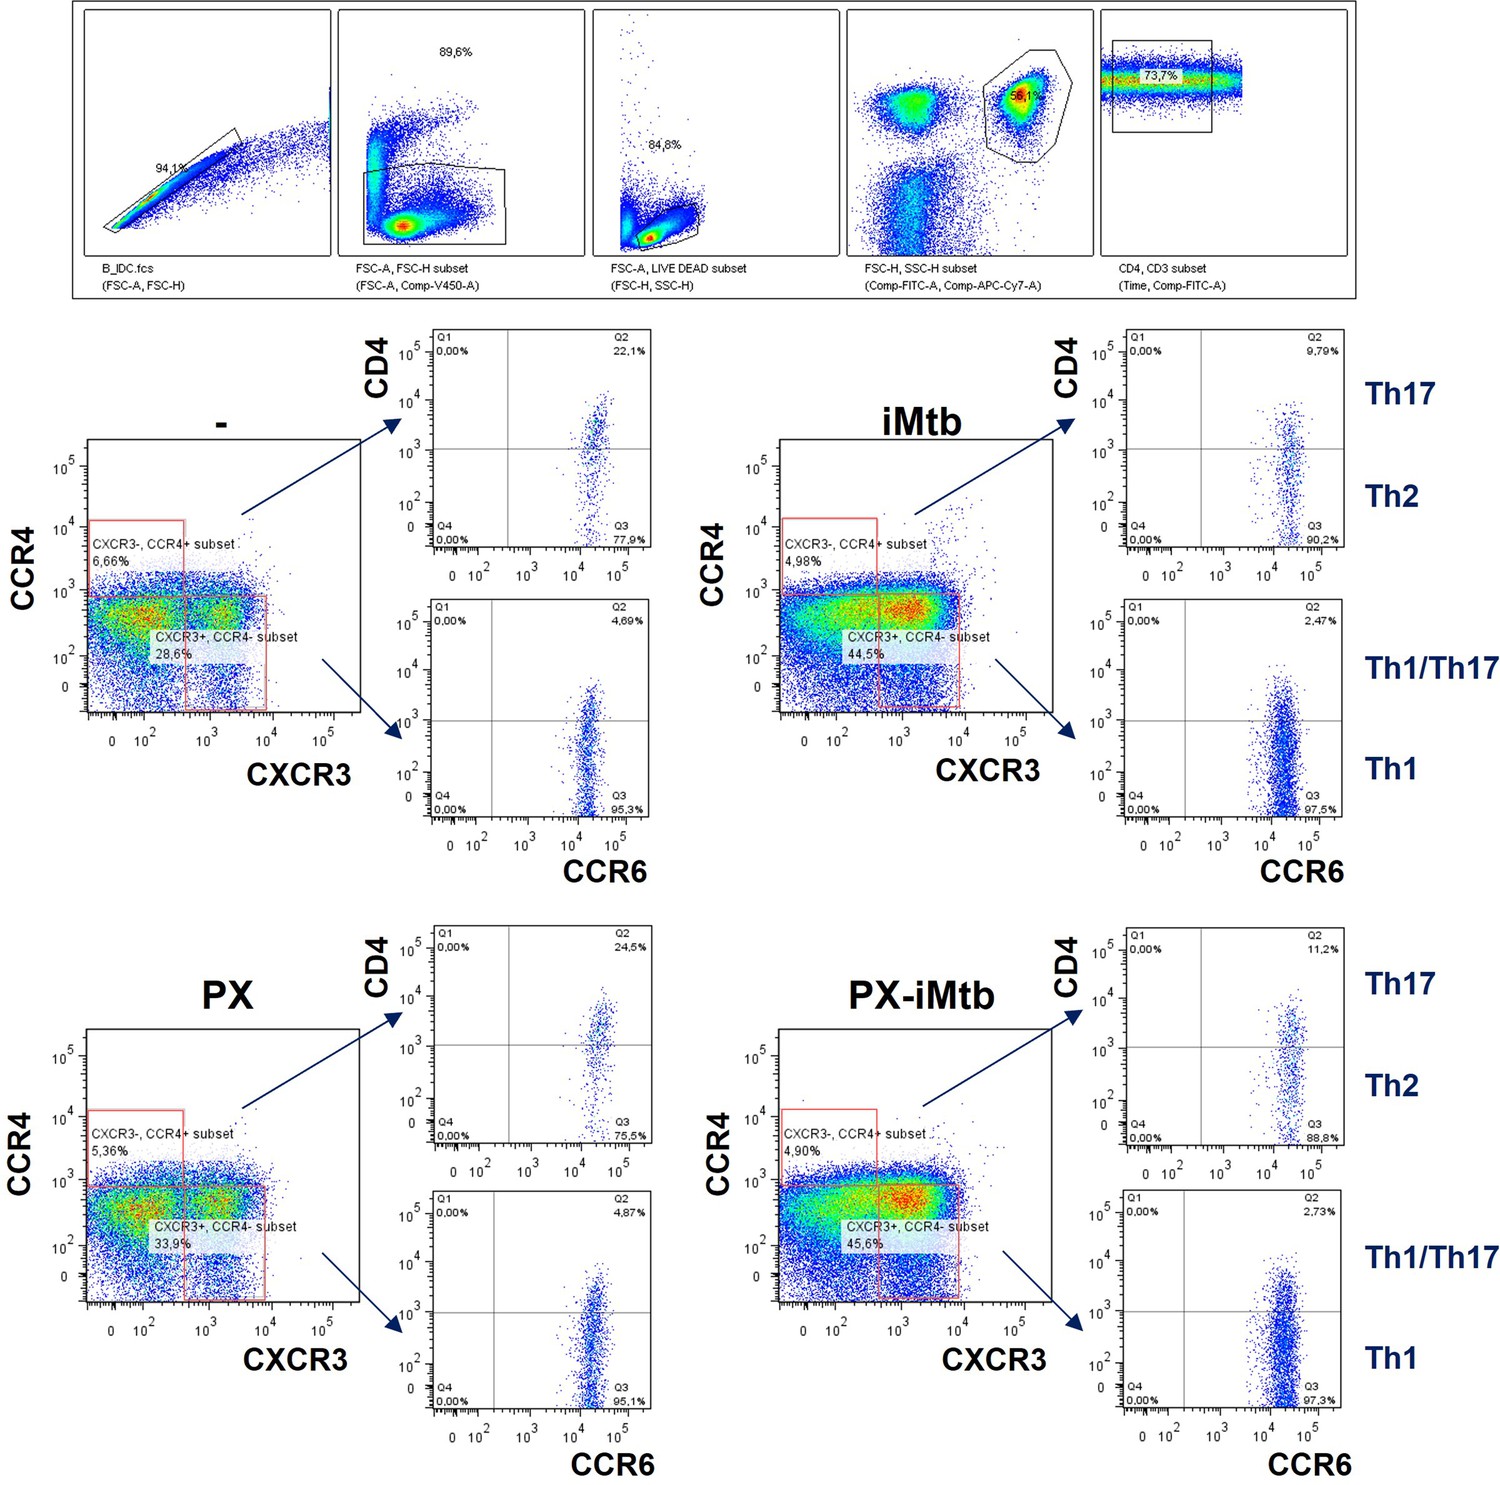
Gating strategy to define CD4+ T cells in response to Mycobacterium tuberculosis (Mtb).
Monocytes from PPD+ healthy donors were differentiated toward dendritic cells (DCs), challenged or not with irradiated Mtb (iMtb) in the presence or not of PX-478, and co-cultured with autologous CD4+ T cells for 5 days. Gating strategy to define Th1 (CXCR3+CCR4−CCR6− cells), Th17 (CXCR3−CCR4+CCR6+ cells), Th2 (CXCR3−CCR4+CCR6− cells), and Th1/Th17 (CXCR3+CCR4−CCR6+ cells or Th1*) CD4+ T populations by FACS.
Figure 5 with 1 supplement
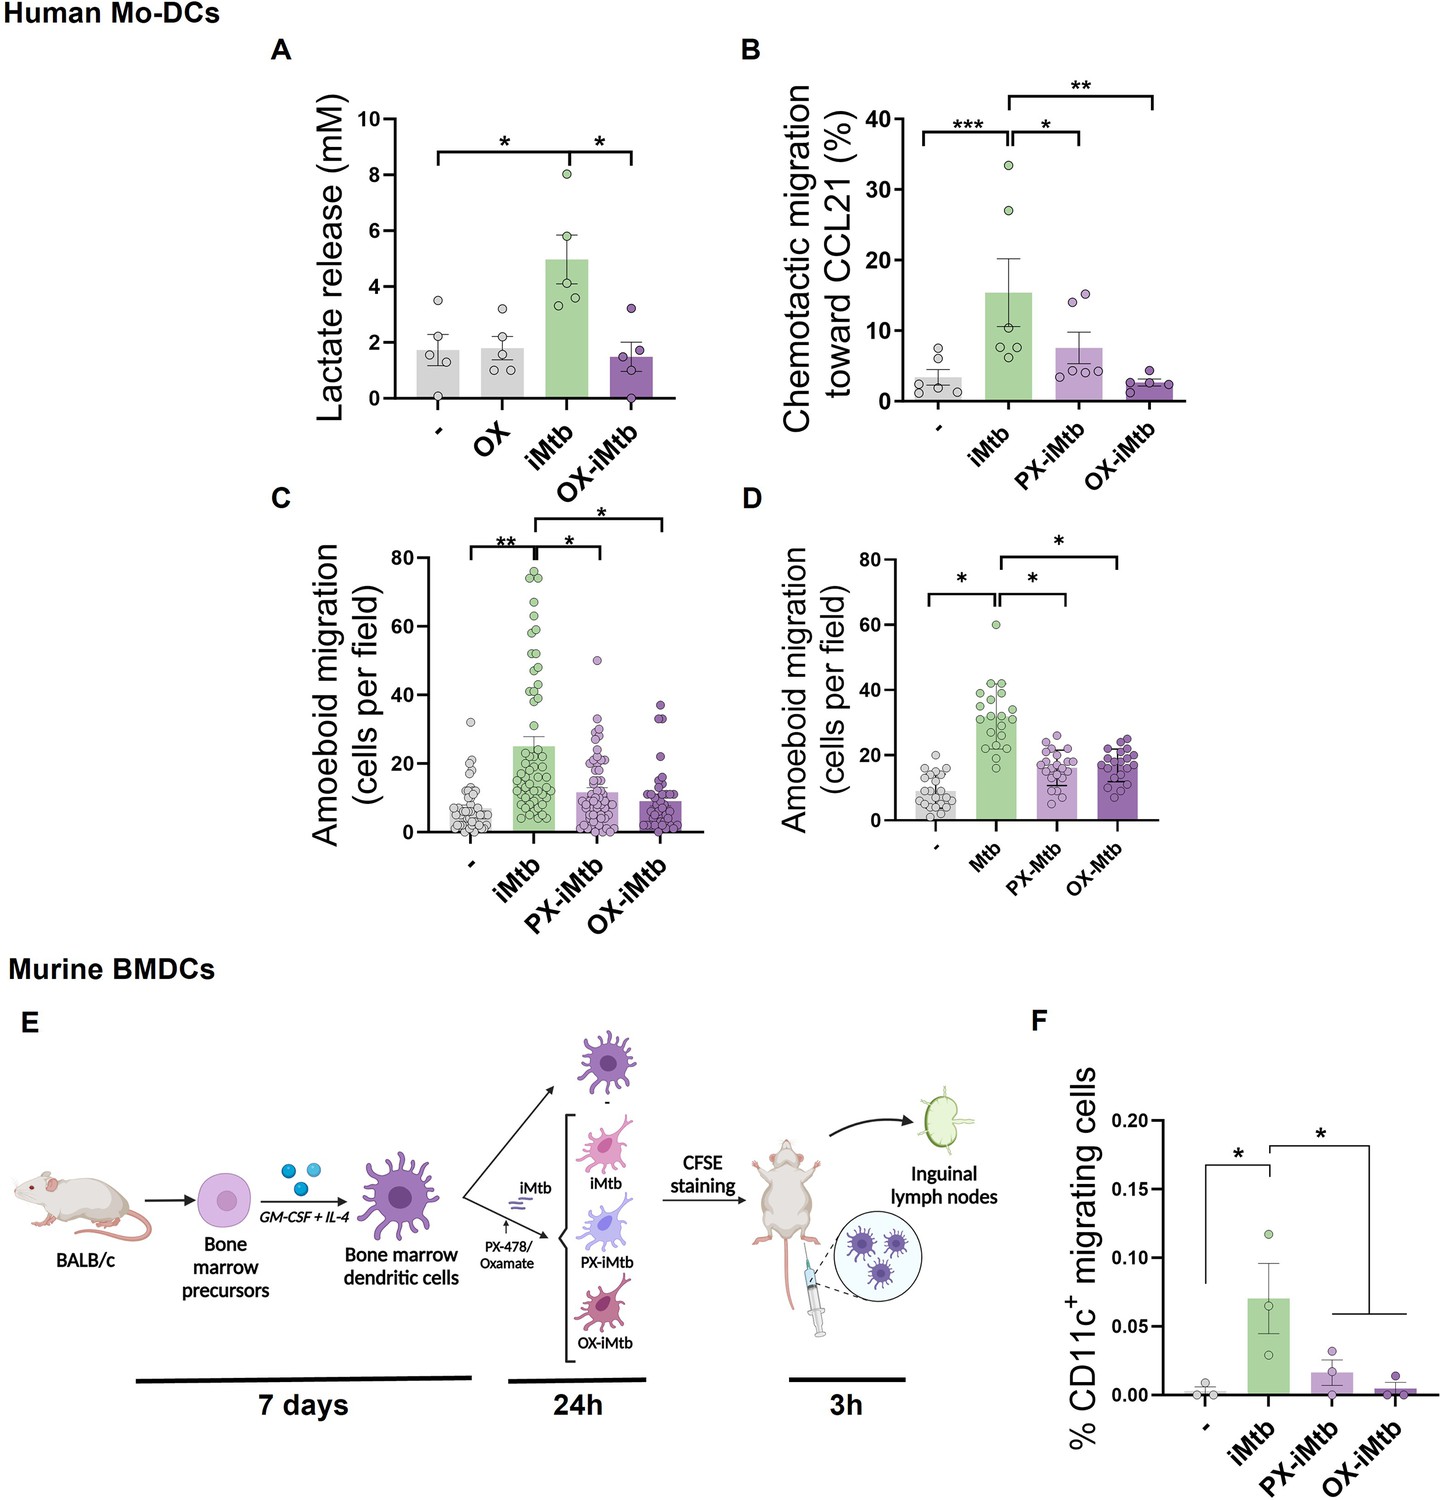
HIF1A-mediated-glycolysis is required to trigger migratory activity in irradiated Mycobacterium tuberculosis (iMtb)-stimulated dendritic cells (DCs).
Monocyte-derived DCs (Mo-DCs) were treated (or not) with HIF1A inhibitor PX-478 (PX) or LDH inhibitor oxamate (OX) and stimulated with iMtb for 24 hr. (A) Lactate release as measured in supernatants in DCs stimulated or not with iMtb in the presence of OX (N = 5). (B) Percentage of migrated cells toward CCL21 relative to the number of initial cells per condition (N = 6). (C, D) Three-dimensional amoeboid migration of DCs through a collagen matrix after 24 hr. Cells within the matrix were fixed and stained with DAPI. Images of the membrane of each insert were taken and the percentage of cells per field were counted. (C) Mo-DCs stimulated with iMtb for 24 hr (N = 5). (D) Mo-DCs infected with Mtb for 24 hr (N = 4). The data are represented as scatter plots, where each circle represents a microphotograph sourced from either five (C) or four (D) independent donors, with each experiment typically including between 5 to 10 microphotographs. (E) Representative schematic of the experimental setup for in vivo migration assays. (F) Percentages of migrating bone marrow-derived DCs (BMDCs) (CFSE-labeled among CD11c+) recovered from inguinal lymph nodes (N = 3). Statistical significance assessed by (A, B) ANOVA followed by Dunnett’s multiple-comparisons test (*p<0.05; **p<0.01); (C, D) Nested ANOVA followed by Dunnett’s multiple-comparisons test (*p<0.05; **p<0.01); (F) ANOVA followed by Holm–Sidak’s multiple-comparisons test (*p<0.05).
Figure 5—figure supplement 1
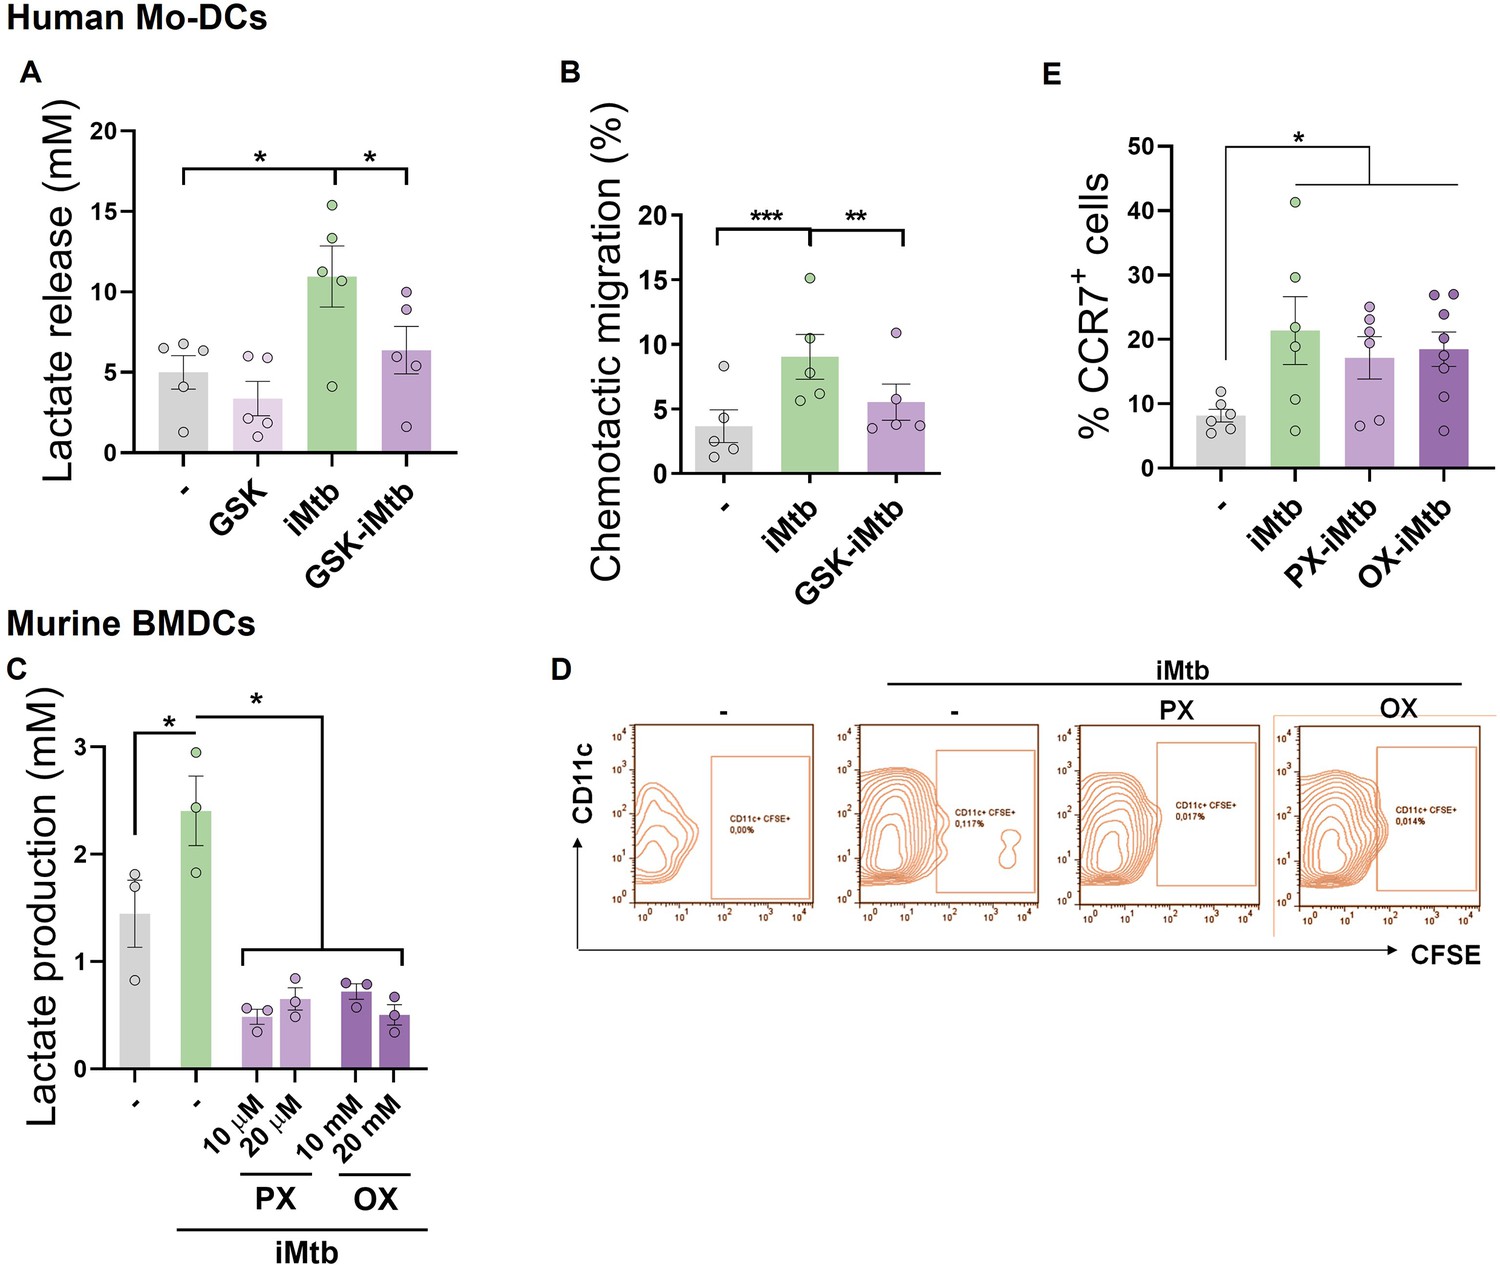
Glycolysis is required to trigger the migratory activity in irradiated Mycobacterium tuberculosis (iMtb)-stimulated dendritic cells (DCs).
(A, B) Monocyte-derived DCs (Mo-DCs) were treated or not with the glycolysis inhibitor GSK2837808A and stimulated with iMtb. (A) Lactate release (N = 5). (B) Chemotactic activity toward CCL21 (N = 5). (C, D) Murine bone marrow-derived DCs (BMDCs) were treated or not with PX-478 or oxamate and stimulated with iMtb for 24 hr. (C) Lactate release (N = 3). (D) Representative dot blots showing the percentages of migrating BMDCs (CD11c+, CFSE-labeled) determined from inguinal lymph nodes. (E) Mo-DCs were stimulated with iMtb in the presence of either PX-478 or oxamate and CCR7 expression was measured by FACS (N = 6). Two-way ANOVA followed by Tukey’s multiple-comparisons test (*p<0.05; **p<0.01; ***p<0.001), as depicted by lines. The data are represented as scatter plots, with each circle representing a single individual, means ± SEM are shown.
Figure 6 with 1 supplement
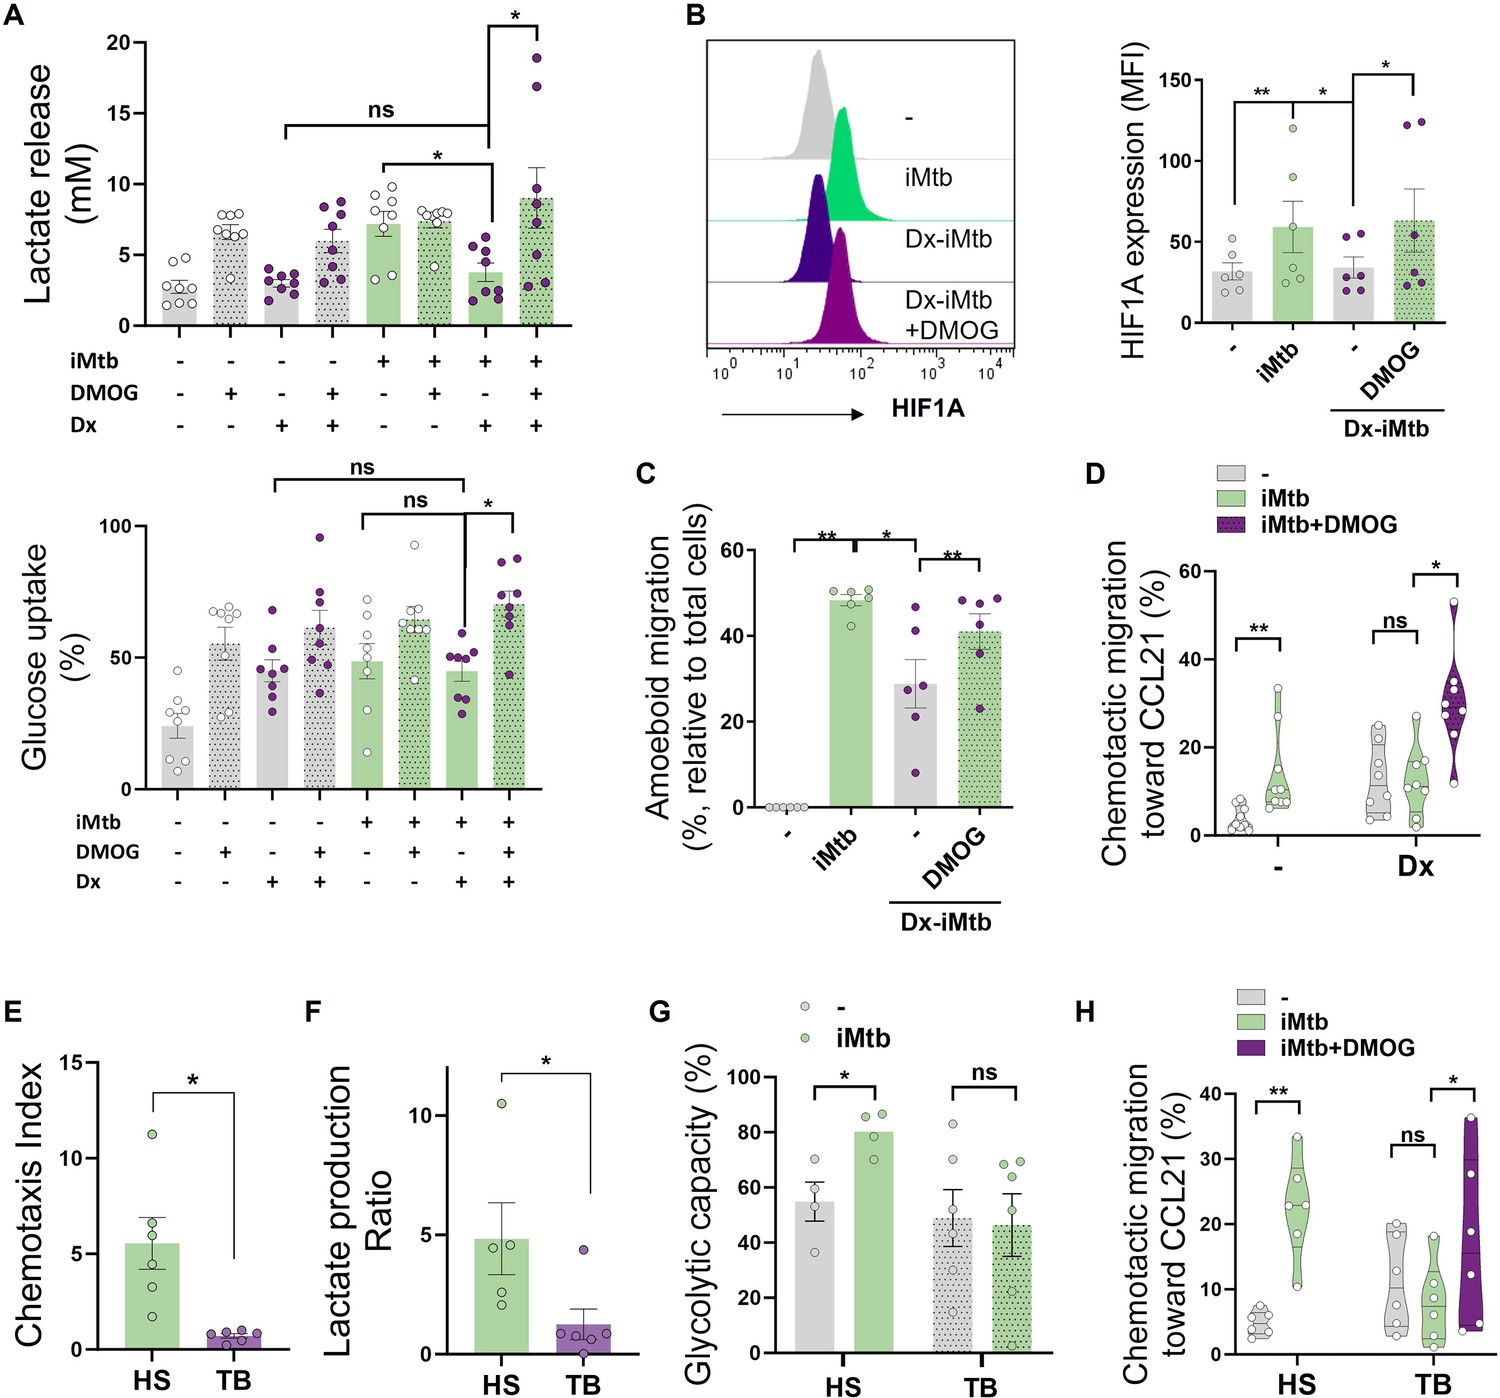
Stabilization of HIF1A promotes migration of tolerogenic dendritic cells (DCs) and monocyte-derived DCs (Mo-DCs) from tuberculosis (TB) patients.
Tolerogenic Mo-DCs were generated by dexamethasone (Dx) treatment and were stimulated (or not) with irradiated Mycobacterium tuberculosis (iMtb) in the presence or absence of HIF1A activator dimethyloxalylglycine (DMOG). (A) Lactate release and glucose uptake as measured in supernatant (N = 8). (B) Mean fluorescence intensity (MFI) of HIF1A. Representative histograms and quantification are shown (N = 6). (C) Three-dimensional amoeboid migration of DCs through a collagen matrix. After 24 hr of migration, images of stacks within the matrix were taken every 30 µm. Percentage of migrating cells was defined as cells in the stacks within the matrix relative to total number of cells (N = 6). (D) Chemotactic activity toward CCL21 in vitro (N = 6). (E–H) Mo-DCs were generated from healthy subjects (HS) or TB patients, and DCs were stimulated (or not) with iMtb. (E) Chemotaxis index toward CCL21 (relative to unstimulated DCs) (N = 6). (F) Lactate production ratio relative to unstimulated DCs (N = 6). (G) Glycolytic capacity assessed by SCENITH (N = 4). (H) Chemotactic activity toward CCL21 of Mo-DCs from TB patients stimulated with iMtb and treated or not with DMOG (N = 6). Statistical significance assessed by (A–D) two-way ANOVA followed by Tukey’s multiple-comparisons test (*p<0.05; **p<0.01); (E–G) unpaired t-test (*p<0.05); (H) paired t-test (*p<0.05). The data are represented as scatter plots, with each circle representing a single individual, means ± SEM are shown.
Figure 6—figure supplement 1
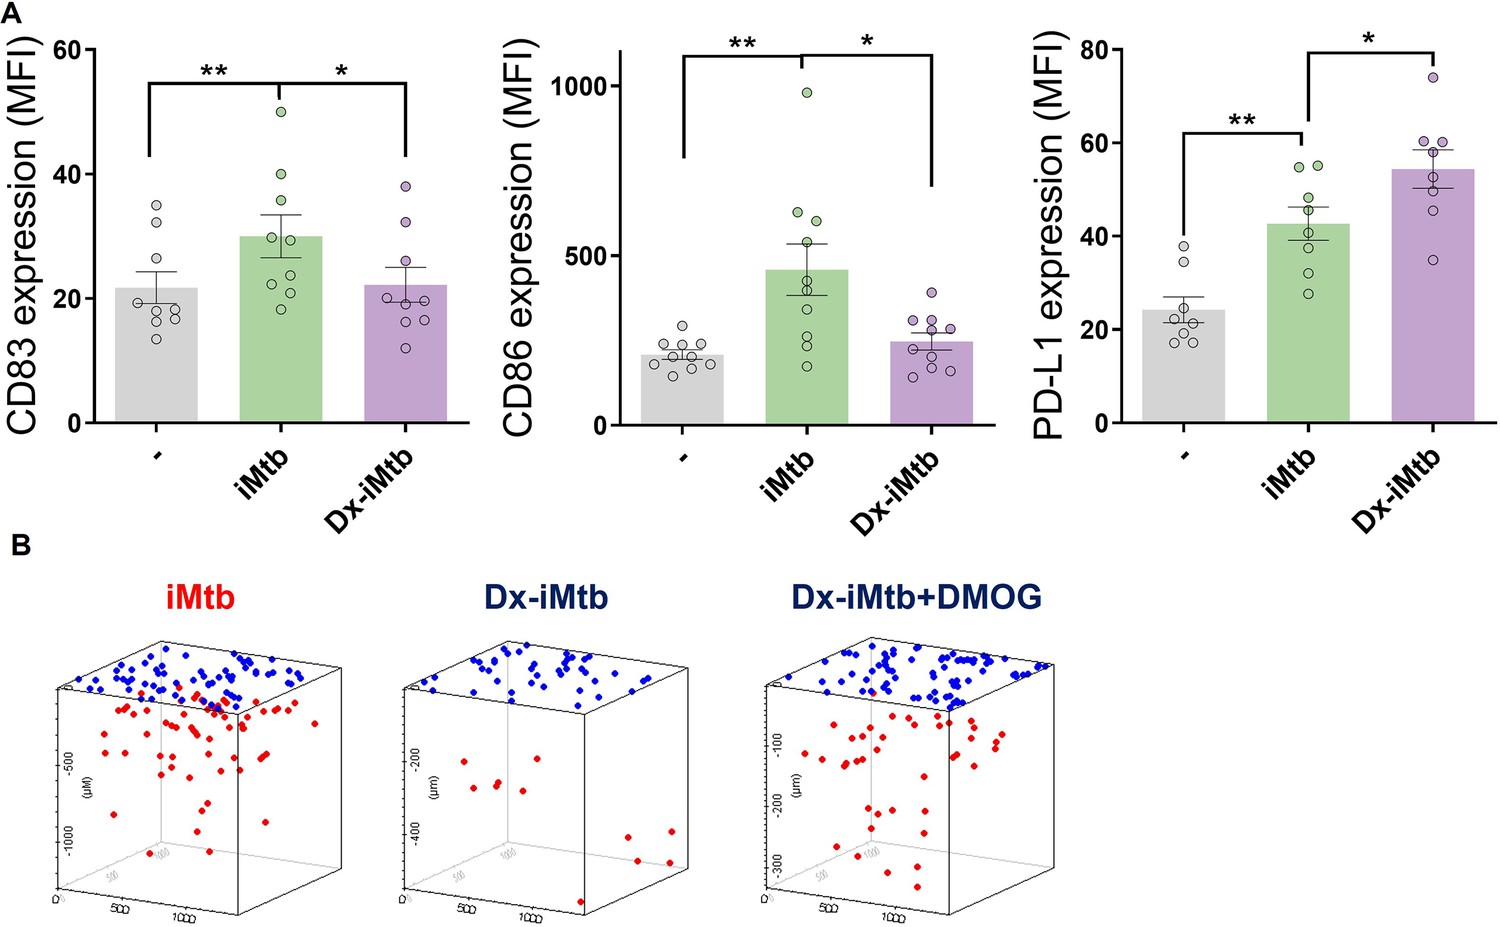
Profile of tolerogenic dendritic cells (DCs) induced by dexamethasone (Dx).
Tolerogenic monocyte-derived DCs (Mo-DCs) were generated in the presence or not of Dx and stimulated with iMtb. (A) Mean fluorescence intensity (MFI) of CD83, CD86, and PD-L1 (N = 9). The data are represented as scatter plots, with each circle representing a single individual. Values are expressed as means ± SEM (B) Representative schemes of migrating cells through a collagen matrix. Two-way ANOVA followed by Tukey’s multiple-comparisons test (*p<0.05; **p<0.01), as depicted by lines.
Figure 7 with 1 supplement
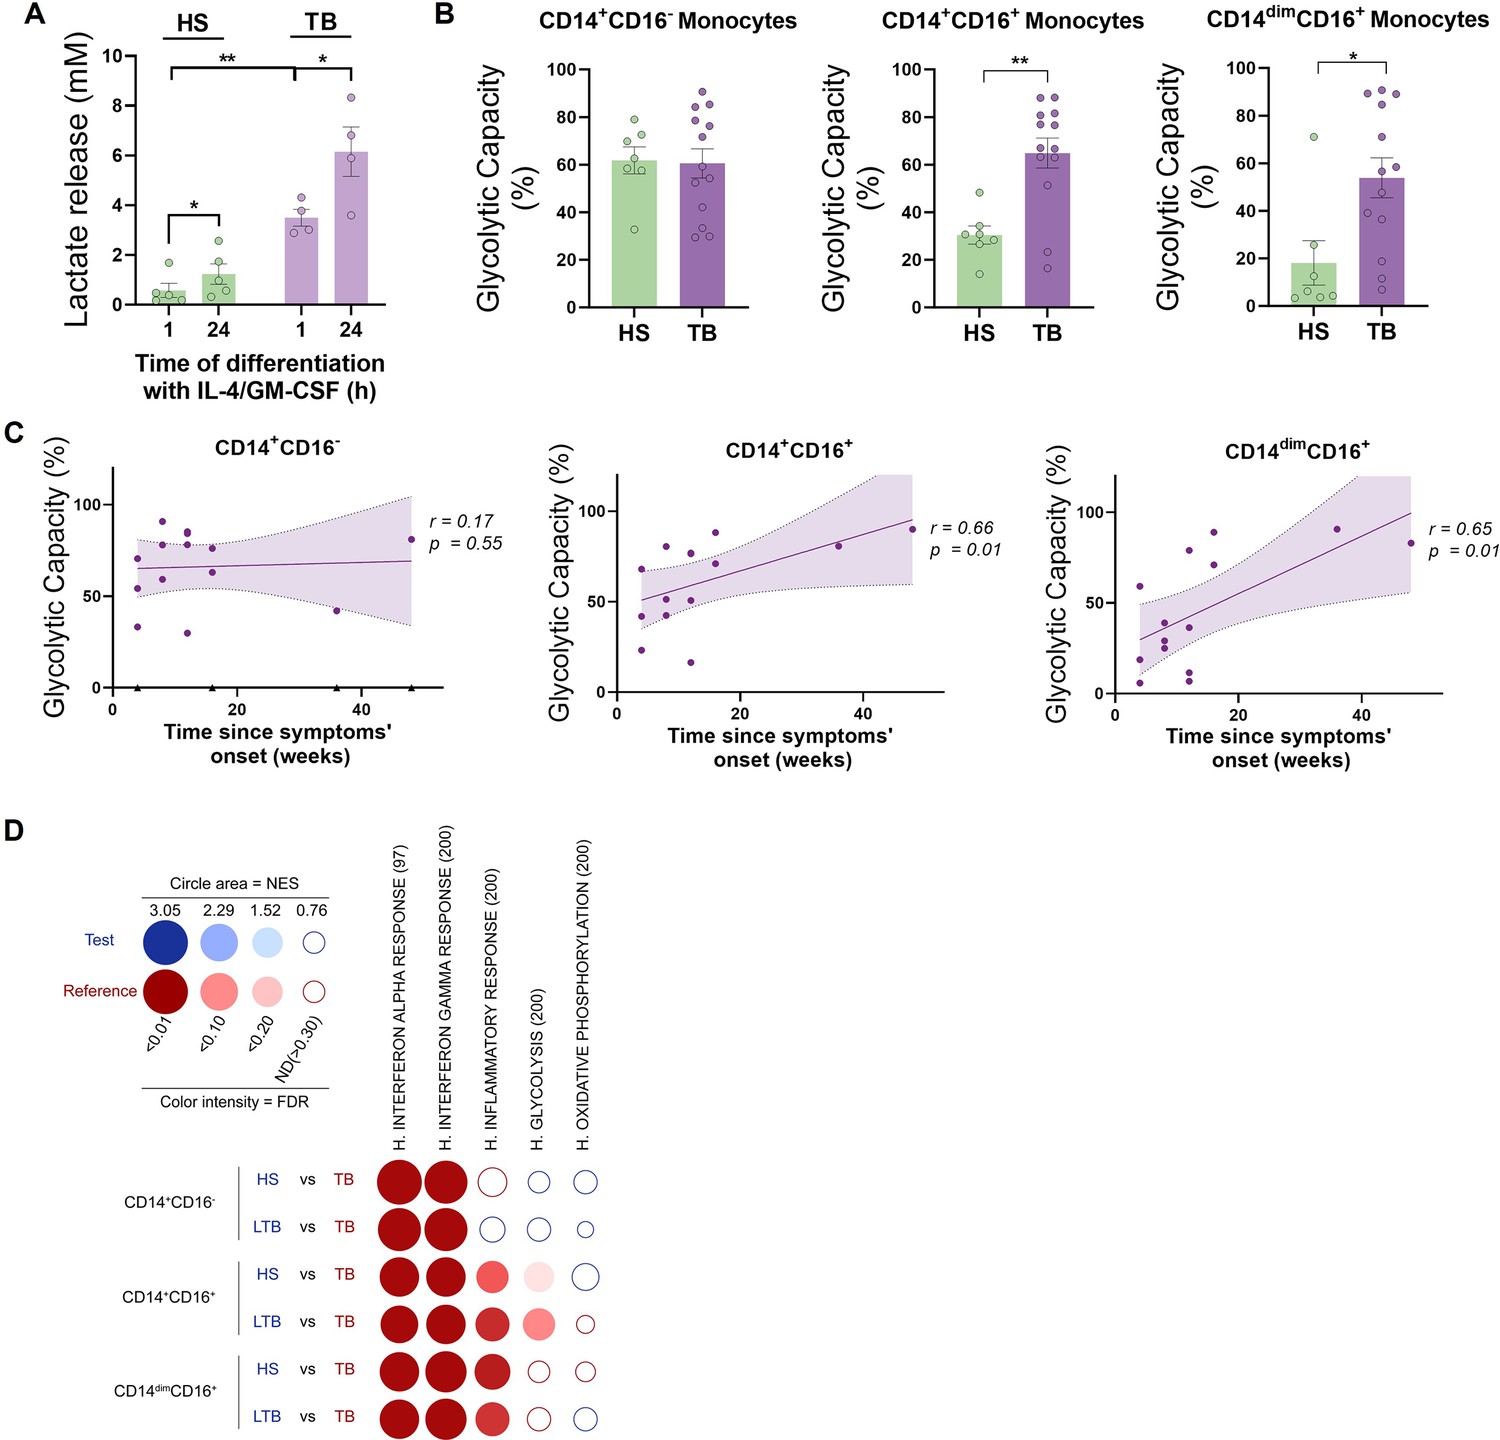
CD16+ monocytes from tuberculosis (TB) patients show increased glycolytic capacity.
(A) Monocytes from TB patients or healthy subjects (HS) were isolated and cultured with IL-4 and GM-CSF for 24 hr. Accumulation of lactate in culture supernatants were measured at 1 and 24 hr of differentiation (N = 5). (B) Glycolytic capacity measured using SCENITH of monocyte subsets as defined by their CD14 and CD16 expression from HS and TB patients (N = 7). (C) Correlation analysis between the baseline glycolytic capacity and the evolution time of TB symptoms for each monocyte subset (CD14+CD16-, CD14+CD16+, and CD14dimCD16+, N = 14). Linear regression lines are shown. Spearman’s rank test. The data are represented as scatter plots, with each circle representing a single individual, means ± SEM are shown. (D) BubbleMap analysis, a high-throughput extension of GeneSet Enrichment Analysis (GSEA), on the pairwise comparisons of monocytes from HS or donors with latent TB (LTB) vs. patients with active TB (TB), for each monocyte subset (CD14+CD16-, CD14+CD16+, and CD14dimCD16+). The gene sets shown come from the Hallmark (H) collection of the Molecular Signature Database (MSigDB). The colors of the BubbleMap correspond to the population from the pairwise comparison in which the geneset is enriched (red if geneset is enriched in TB). The bubble area is proportional to the GSEA normalized enrichment score (NES). The intensity of the color corresponds to the statistical significance of the enrichment, derived by computing the multiple testing-adjusted permutation-based p-value using the Benjamini–Yekutieli correction. Enrichments with a statistical significance above 0.30 are represented by empty circles. Statistical significance was assessed by (A) paired t-test for 0 vs. 24 hr (*p<0.05) and two-way ANOVA for HS vs. TB at each time (**p<0.01); (B) unpaired t-test (*p<0.05; **p<0.01).
Figure 7—figure supplement 1
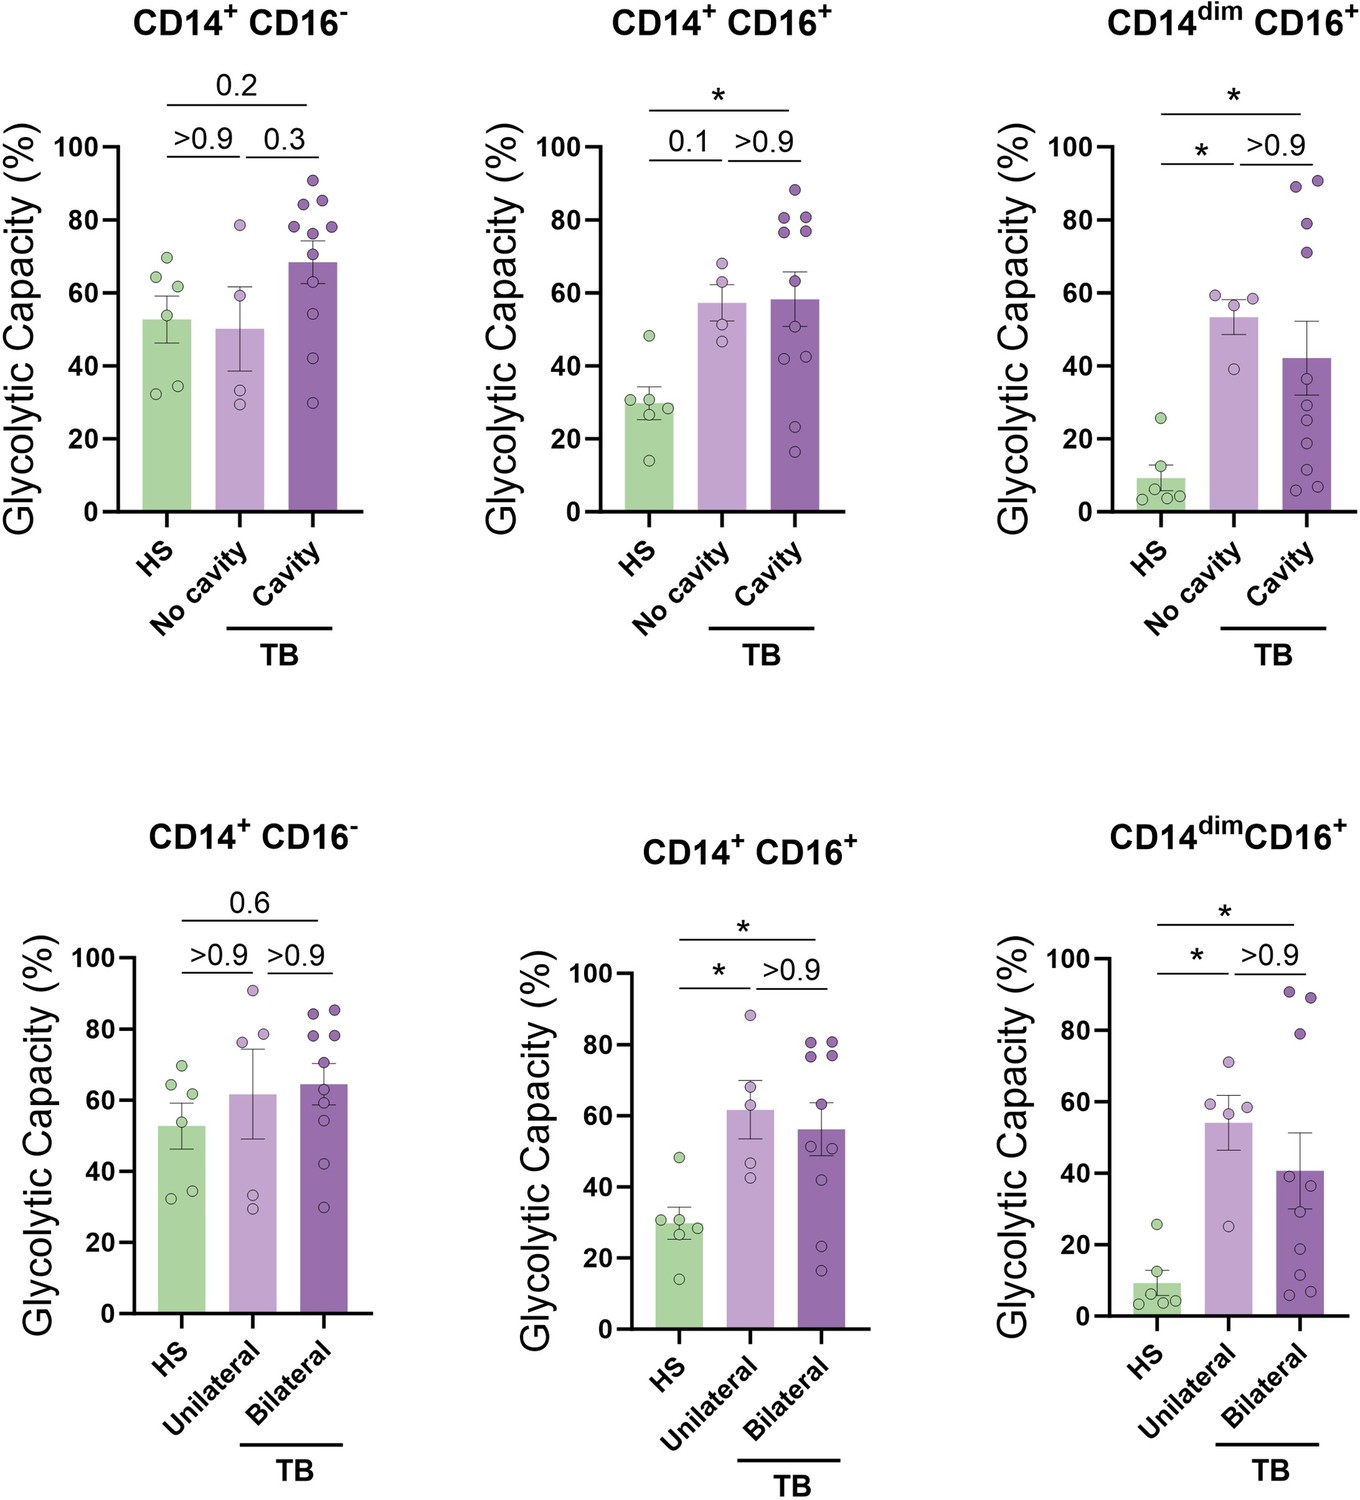
Association between baseline glycolytic status of monocytes and the severity of lung disease.
The glycolytic capacity was assessed in monocyte subsets from tuberculosis (TB) patients with bilateral versus unilateral disease, reflecting the extent of disease (upper panels), or with cavitary versus non-cavitary disease, reflecting the disease severity (lower panels) (N = 4–11). The data are represented as scatter plots, with each circle representing a single individual. p-Values were calculated using the Kruskal–Wallis test with Dunn’s correction for multiple comparisons.
Figure 8 with 2 supplements
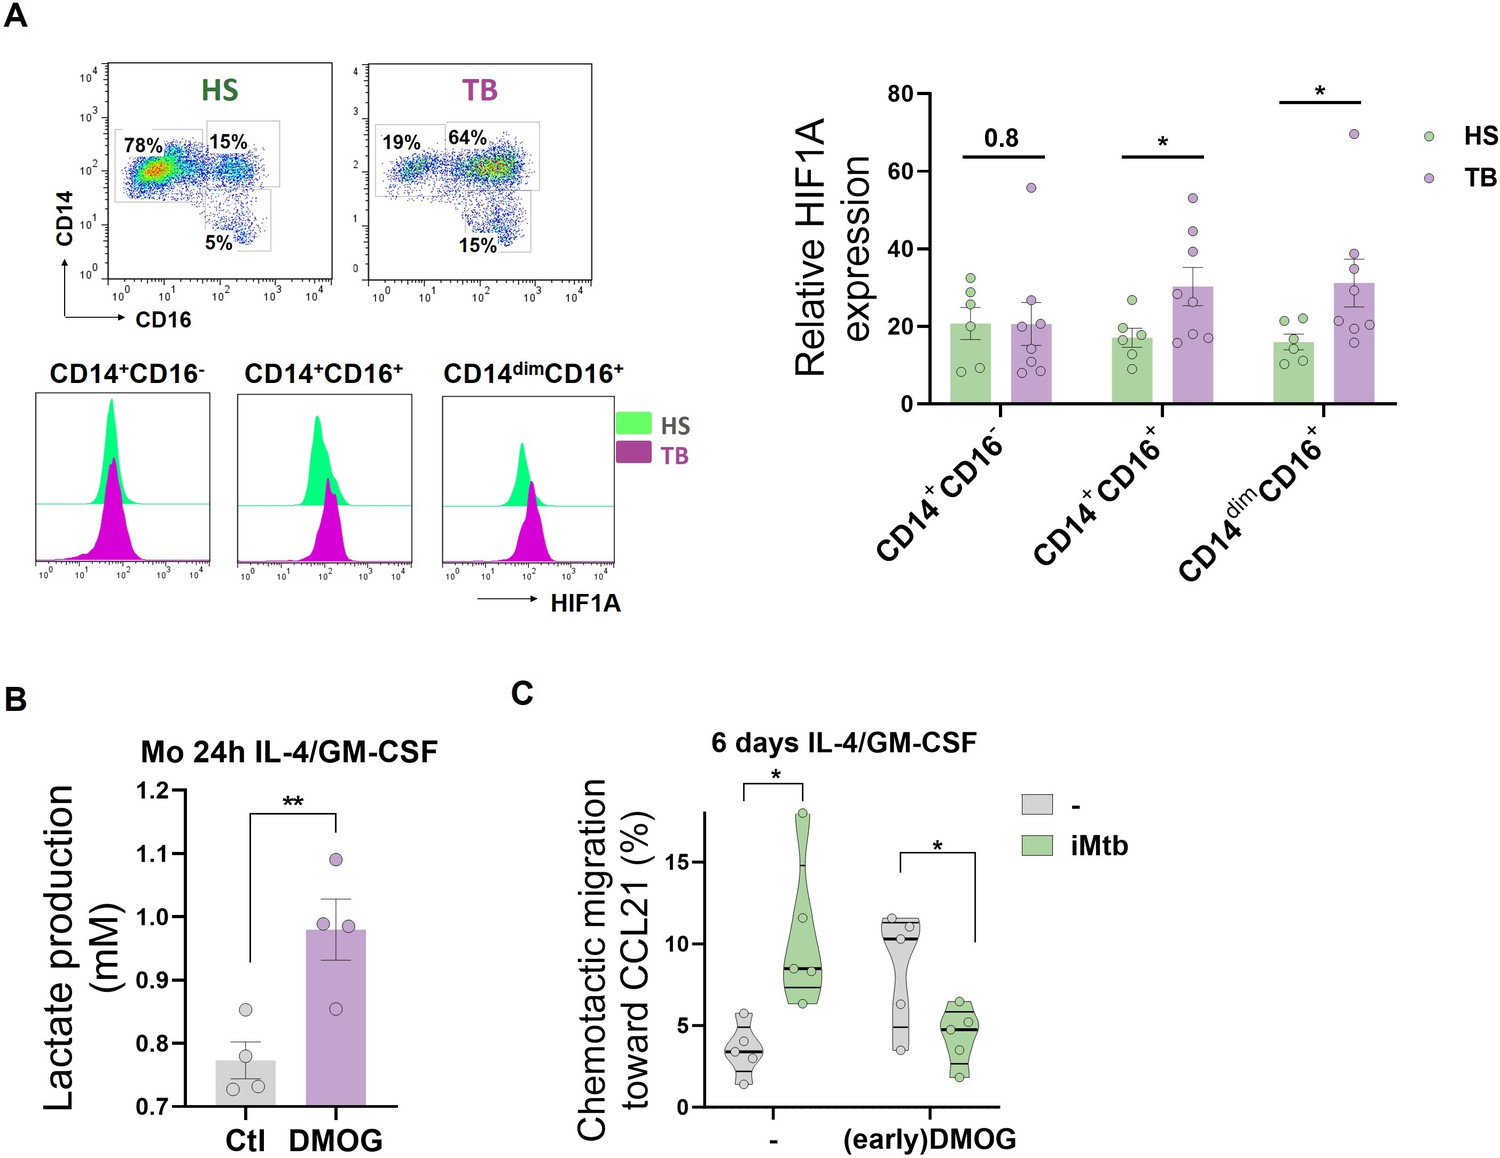
HIF1A activation in CD16+ monocytes from tuberculosis (TB) patients leads to dendritic cells (DCs) with poor migration capacity.
(A) Ex vivo determination of HIF1A expression by monocytes from healthy subjects (HS) or TB patients (TB) for each monocyte subset (CD14+CD16-, CD14+CD16+, and CD14dimCD16+) (N = 6). (B, C) Monocytes from HS were treated with dimethyloxalylglycine (DMOG) during the first 24 hr of differentiation with IL-4/GM-CSF (earlyDMOG) and removed afterward. On day 6 of differentiation, cells were stimulated (or not) with irradiated Mycobacterium tuberculosis (iMtb). (B) Monocyte lactate release after 24 hr of DMOG addition (N = 4). (C) Chemotactic activity toward CCL21 of DCs (N = 5). Statistical significance was assessed by (B) paired t-test (p<0.01); (C) two-way ANOVA followed by Tukey’s multiple-comparisons test (*p<0.05). The data are represented as scatter plots, with each circle representing a single individual, means ± SEM are shown.
Figure 8—figure supplement 1
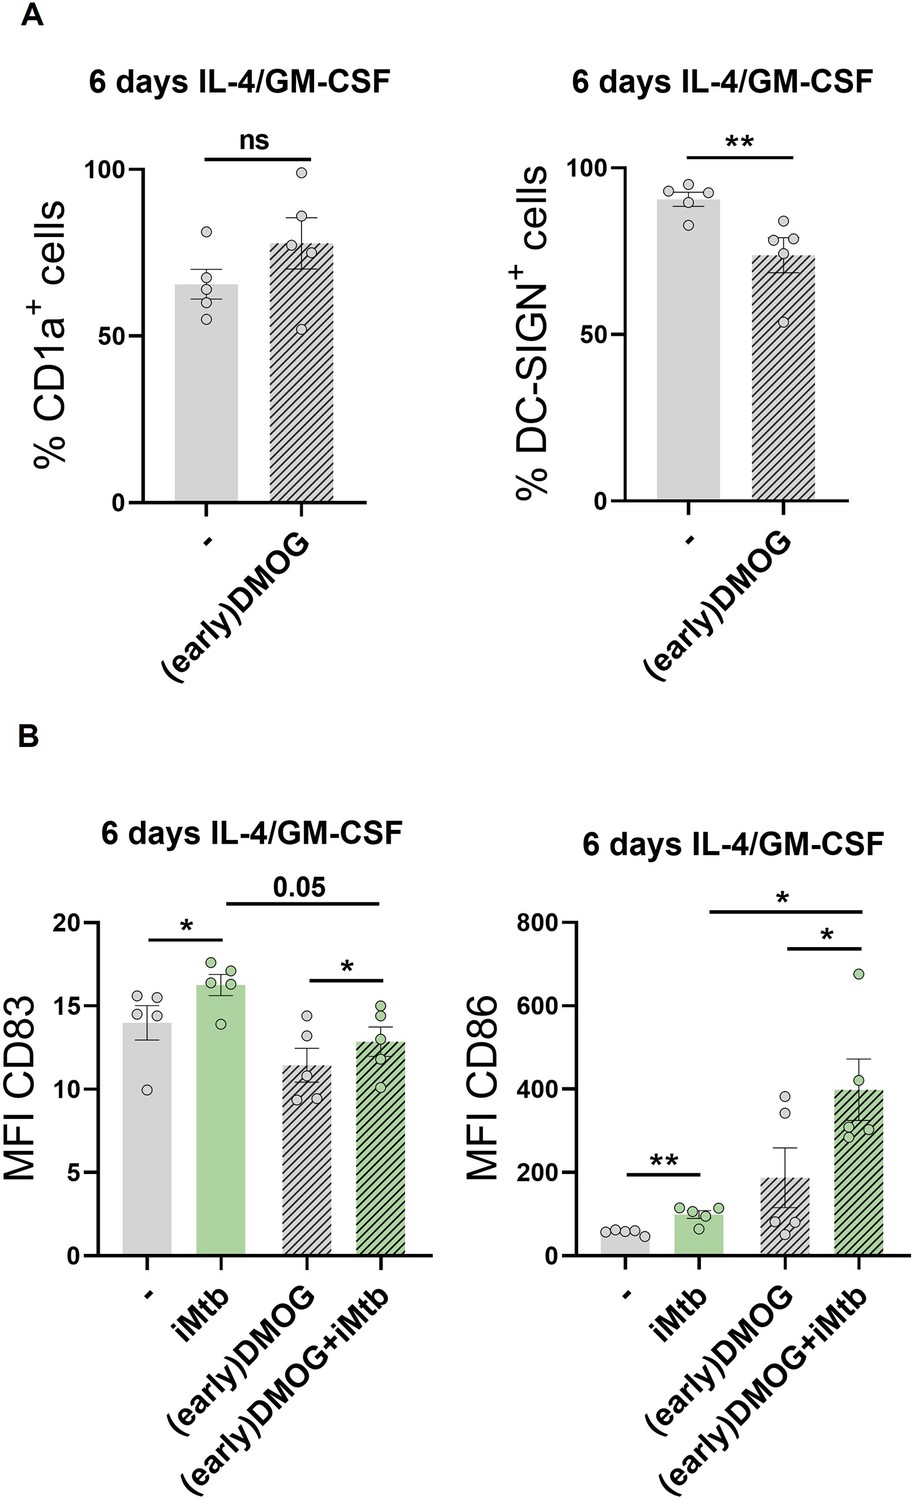
Impact of premature activation of HIF1A in monocytes on the generated dendritic cells (DCs).
Monocytes from healthy subjects (HS) were treated with dimethyloxalylglycine (DMOG) during the first 24 hr of differentiation with IL-4/GM-CSF (earlyDMOG) and removed afterward. On day 6 of differentiation, cells were stimulated or not with iMtb. (A) Percentage of cells expressing CD1a and DC-SIGN after full 6 days of differentiation (N = 5). (B) Mean fluorescence intensity (MFI) of CD83 and CD86 on day 6 differentiated cells stimulated or not with iMtb for further 24 hr (N = 5). The data are represented as scatter plots, with each circle representing a single individual. Statistical significance was assessed by (A) paired t-test (**p<0.01); (B) two-way ANOVA followed by Tukey’s multiple-comparisons test (*p<0.05).
Figure 8—figure supplement 2
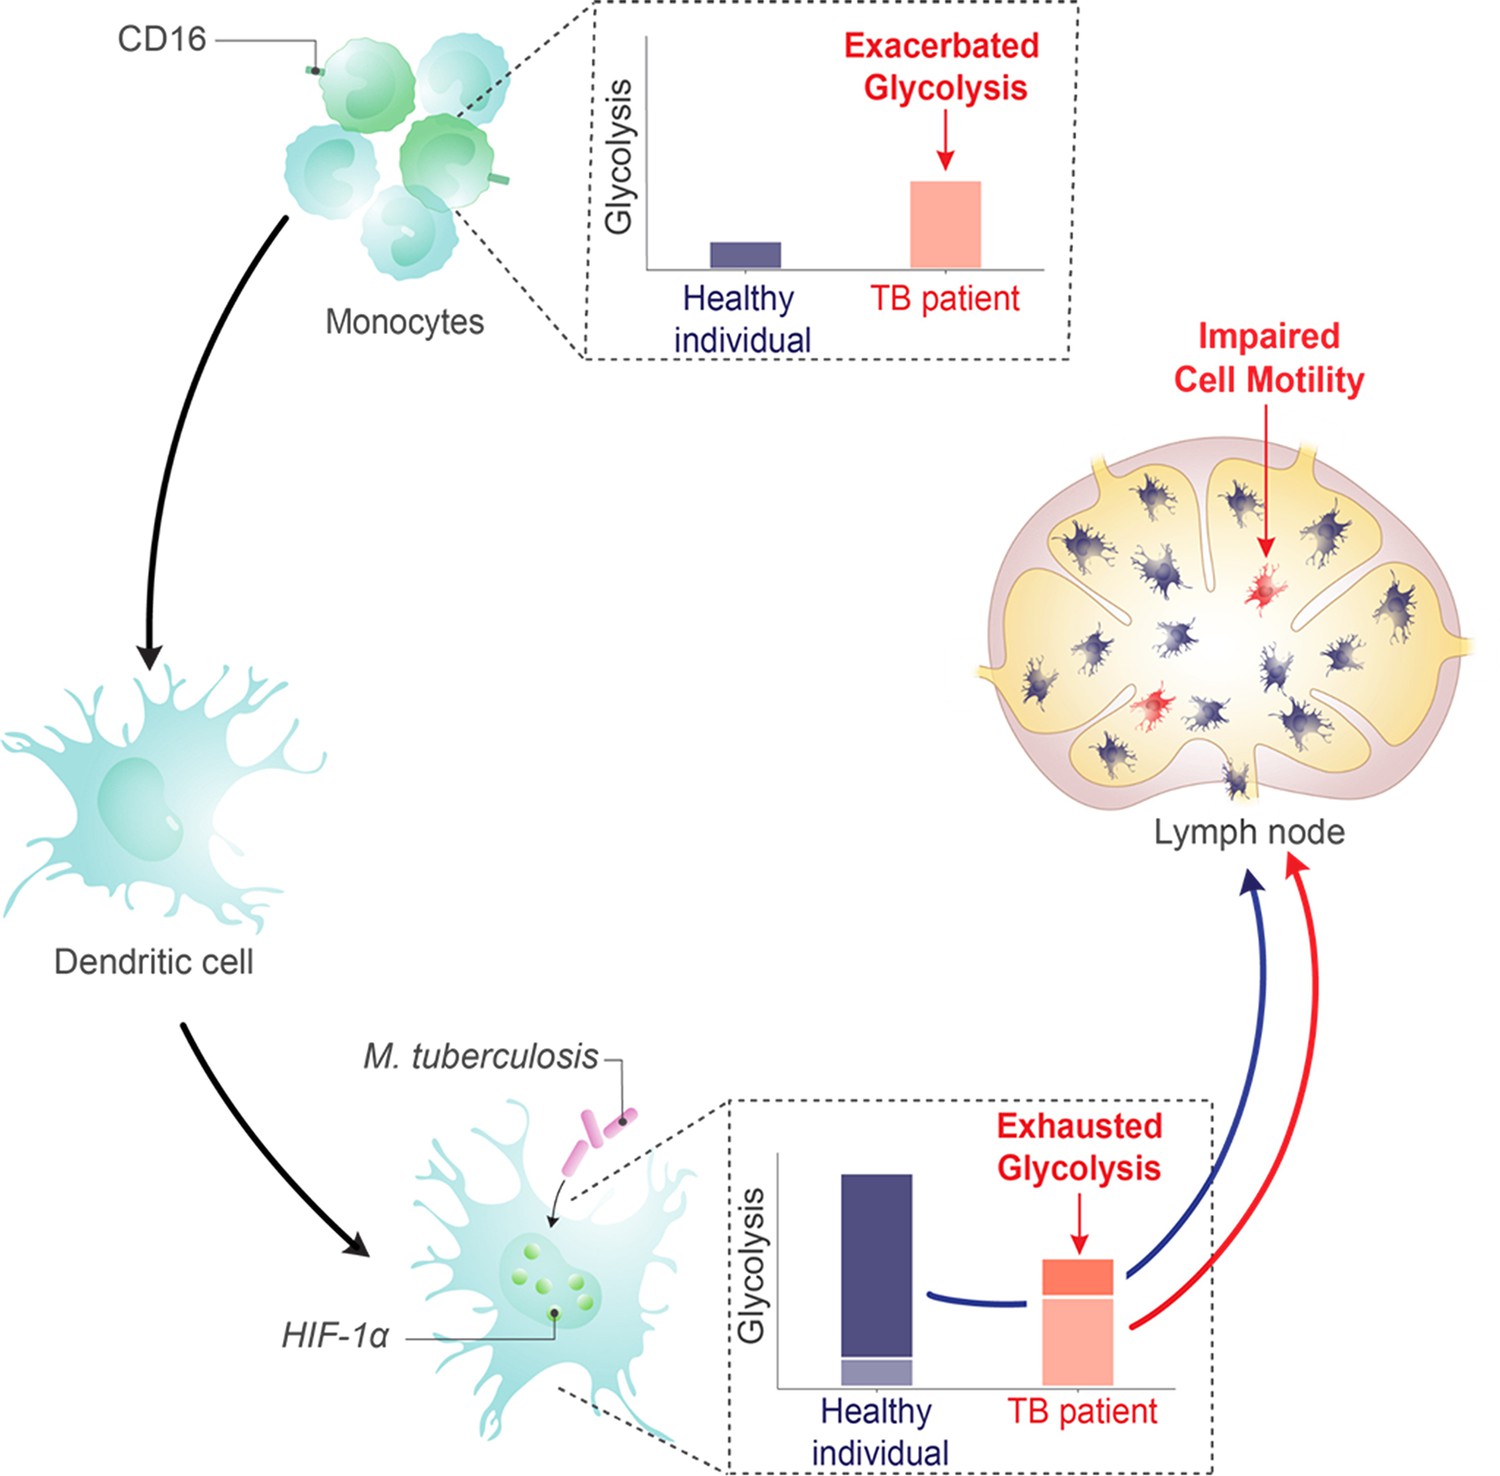
Dual role of the glycolysis/HIF1A axis on dendritic cell (DC) migration in tuberculosis (TB).
Working model showing that DCs enhance their glycolytic activity upon encountering M. tuberculosis, facilitating their migration to lymph nodes. Conversely, in CD16+ monocyte populations of patients with TB, a rise in basal glycolysis/HIF1A axis is noted, resulting in an altered differentiation process that gives rise to DCs incapable of ramping up their glycolysis in response to M. tuberculosis. Consequently, these DCs exhibit poor migratory capabilities.
Author response image 1

Correlation analysis between the baseline glycolytic capacity and the time since treatment onset for each monocyte subset (CD14+CD16-, CD14+CD16+ and CD14dimCD16+, N = 11).
Linear regression lines are shown. Spearman’s rank test. The data are represented as scatter plots with each circle representing a single individual.
Author response image 2

Gene enrichment analysis for glycolytic genes on the pairwise comparisons of each monocyte subset (CD14+CD16-, CD14+CD16+ and CD14dimCD16+) from patients with active TB pre-treatment vs patients with active TB (TB) undergoing treatment for 2 months.
Comparisons with a p-value of less than 0.05 and an FDR value of less than 0.25 are considered significantly different.
Tables
Key resources table
| Reagent type (species) or resource | Designation | Source or reference | Identifiers | Additional information |
|---|---|---|---|---|
| Antibody | Anti-human TLR2 | BioLegend | Cat# 309717 | |
| Antibody | Anti-human TLR4 | BioLegend | Cat# 312813 | |
| Antibody | Anti-human CD1a | eBioscience | RRID:AB_467039 | |
| Antibody | Anti-human DC-SIGN | R&D System | Cat# MAB161 | |
| Antibody | Anti-human CD14 | BD Biosciences | Cat# 557154 | |
| Antibody | Anti-human CD86 | BioLegend | Cat# 374216 | |
| Antibody | Anti-human CD83 | eBioscience | Cat# 14-0839-82 | |
| Antibody | Anti-human CD274 (B7-H1, PD-L1) | BD Pharmingen | Cat# 557924 | |
| Antibody | Anti-human Glut1 | R&D System | Cat# MAB1418 | |
| Antibody | Anti-human HIF1A | BioLegend | Cat# 359704 | |
| Antibody | Anti-human CD4 | BioLegend | Cat# 357402 | |
| Antibody | Anti-human CXCR3 | BioLegend | Cat# 353719 | |
| Antibody | Anti-human CCR4 | BD Biosciences | Cat# 560726 | |
| Antibody | Anti-human CCR6 | BD Biosciences | Cat# 560619 | |
| Antibody | Anti-human CD3 | BioLegend | Cat# 300317 | |
| Antibody | Anti-human CD16 | BioLegend | Cat# 302008 | |
| Antibody | Anti-mouse CD11c | BD Pharmingen | Cat# 561044 | |
| Biological sample (Mycobacterium tuberculosis) | M. tuberculosis H37Rv | N/A | N/A | |
| Biological sample (M. tuberculosis) | Tuberculosis γ-irradiated H37Rv | BEI Resource | Cat# NR-49098 | |
| Biological sample | Patients-derived blood | Hospital F.J.Muñiz (Buenos Aires, Argentina) | N/A | |
| Biological sample | Buffy coats from healthy donors | Centro Regional de Hemoterapia Garrahan (Buenos Aires, Argentina) | N/A | |
| Biological sample | Blood from PPD+ healthy donors | N/A | N/A | |
| Peptide, recombinant protein | Recombinant human GM-CSF | Peprotech | Cat# 300-03 | |
| Peptide, recombinant protein | Recombinant human IL-4 | BioLegend | Cat# 430307 | |
| Peptide, recombinant protein | Recombinant mouse GM-CSF | BioLegend | Cat# 576304 | |
| Peptide, recombinant protein | Recombinant mouse IL-4 | BioLegend | Cat# 574302 | |
| Chemical compound, drug | Lipopolysaccharides from Escherichia coli O127:B8 | Sigma-Aldrich | Cat# 93572-42-0 | |
| Chemical compound, drug | Dexamethasone | Sidus | Cat# 229197-1 | |
| Chemical compound, drug | PX-478 2HCl | Selleck Chemicals | Cat# S7612 | |
| Chemical compound, drug | DMOG | Bertin Technologies | Cat# 300-02 | |
| Chemical compound, drug | GSK2837808A | Cayman Chemical | Cat# 1445879-21-9 | |
| Chemical compound, drug | Echinomycin | Cayman Chemical | Cat# 512-64-1 | |
| Chemical compound, drug | Sodium oxamate | Cayman Chemical | Cat# 565-73-1 | |
| Peptide, recombinant protein | Recombinant Human Exodus-2 (CCL21) | Peprotech | Cat# 300-35A | |
| Chemical compound, drug | Collagen from calf skin | Sigma-Aldrich | Cat# C9791-10MG | |
| Commercial assay or kit | Lactate Kit | Wiener | Cat# 1999795 | |
| Commercial assay or kit | Glicemia Enzimática AA Kit | Wiener | Cat# 1009803 | |
| Commercial assay or kit | Perm2 solution | BD Biosciences | Cat# 340973 | |
| Commercial assay or kit | Trizol reagent | Thermo Fisher Scientific | Cat# 15596026 | |
| Commercial assay or kit | MitoSpy Green FM | BioLegend | Cat# 424805 | |
| Commercial assay or kit | TNF alpha Human ELISA Kit | eBiosciences | Cat# BMS223-4 | |
| Commercial assay or kit | IL-10 Human ELISA Kit | eBiosciences | Cat# BMS215-2 | |
| Commercial assay or kit | IL-17A Human ELISA Kit | eBiosciences | Cat# 88-7176-22 | |
| Commercial assay or kit | IFN gamma Human ELISA Kit | eBiosciences | Cat# BMS228 | |
| Commercial assay or kit | Zombie Violet Fixable Viability Kit | BioLegend | Cat# 423113 | |
| Commercial assay or kit | SCENITH | Gifted by Rafael Argüello | N/A | |
| Sequence-based reagent | Primer: EEF1A1 Fwd: TCGGGCAAGTCCACCACTAC | Marín Franco et al., 2020 | N/A | |
| Sequence-based reagent | Primer: EEF1A1 Rev: CCAAGACCCAGGCATACTTGA | Marín Franco et al., 2020 | N/A | |
| Sequence-based reagent | Primer: HIF1A Fwd: ACTAGCCGAGGAAGAACTATGAA | Marín Franco et al., 2020 | N/A | |
| Sequence-based reagent | Primer: HIF1A Rev: TACCCACACTGAGGTTGGTTA | Marín Franco et al., 2020 | N/A | |
| Sequence-based reagent | Primer: LDHA Fwd: TGGGAGTTCACCCATTAAGC | Marín Franco et al., 2020 | N/A | |
| Sequence-based reagent | Primer: LDHA Rev: AGCACTCTCAACCACCTGCT | Marín Franco et al., 2020 | N/A | |
| Software, algorithm | ImageJ | ImageJ | https://imagej.nih.gov/ij/ | |
| Software, algorithm | Prism (v5) | GraphPad | https://www.graphpad.com/ | |
| Software, algorithm | FlowJo 7.6.5 | TreeStar | https://www.flowjo.com/ | |
| Software, algorithm | FCS Express V3 | DeNovo Software | https://www.denovosoftware.com/ | |
| Software, algorithm | Seahorse Wave | Agilent | https://www.agilent.com/ | |
| Software, algorithm | CFX Maestro | Bio-Rad | https://www.bio-rad.com/ | |
| Software, algorithm | Metamorph | Molecular Devices | https://www.moleculardevices.com/ |
Table 1
Demographic and clinical characteristics of tuberculosis (TB) patients.
| Age, years (range) | 36 (19–67) |
|---|---|
| Gender, % (number/total) | M, 81% (31/38) F, 19% (7/38) |
| Nationality, % (number/total) | Argentina, 76.31% (29/38) Bolivia, 15.78% (6/38) Paraguay, 2.63% (1/38) Peru, 5.26% (2/38) |
| TB disease localization, % (number/total) | Pulmonary, 94% (36/38) Pulmonary + extrapulmonary, 6% (2/38) |
| AFB* in sputum, % (number/total) | 3+, 21% (8/38) 2+, 13% (5/38) 1+, 52% (20/38) -, 13% (5/38) |
| Leukocyte count, mean ± SEM, cell/µl | 8483 ± 509 |
| Lymphocyte mean ± SEM, % | 19 ± 2 |
| Monocyte mean ± SEM, % | 7 ± 0.5 |
-
*
Acid-fast-bacilli (AFB) in sputum: -, 1+, 2+, 3+ are defined according to the International Union Against Tuberculosis and Lung Disease (IUATLD)/World Health Organization (WHO) quantification scale.
Author response table 1
| - | iMtb | - | iMtb | |
| Exp 1 | 12,7 | 30,1 | 1,45 | 10,30 |
| Exp 2 | 4,7 | 7,3 | 6,68 | 13,43 |
| Exp 3 | 16,77 | 25,67 | 6,74 | 18,98 |
| Exp 4 | 2,34 | 21,33 | 0,12 | 3,02 |
| Exp 5 | 9,8 | 31 | 1,46 | 6,03 |
| Exp 6 | 12 | 25 | 1,00 | 20,70 |
Additional files
Download links
A two-part list of links to download the article, or parts of the article, in various formats.
Downloads (link to download the article as PDF)
Open citations (links to open the citations from this article in various online reference manager services)
Cite this article (links to download the citations from this article in formats compatible with various reference manager tools)
Elevated glycolytic metabolism of monocytes limits the generation of HIF1A-driven migratory dendritic cells in tuberculosis
eLife 12:RP89319.
https://doi.org/10.7554/eLife.89319.4


