Single-cell RNAseq analysis of spinal locomotor circuitry in larval zebrafish
- Vollum Institute, Oregon Health & Science University, United States
Figures
Figure 1 with 3 supplements
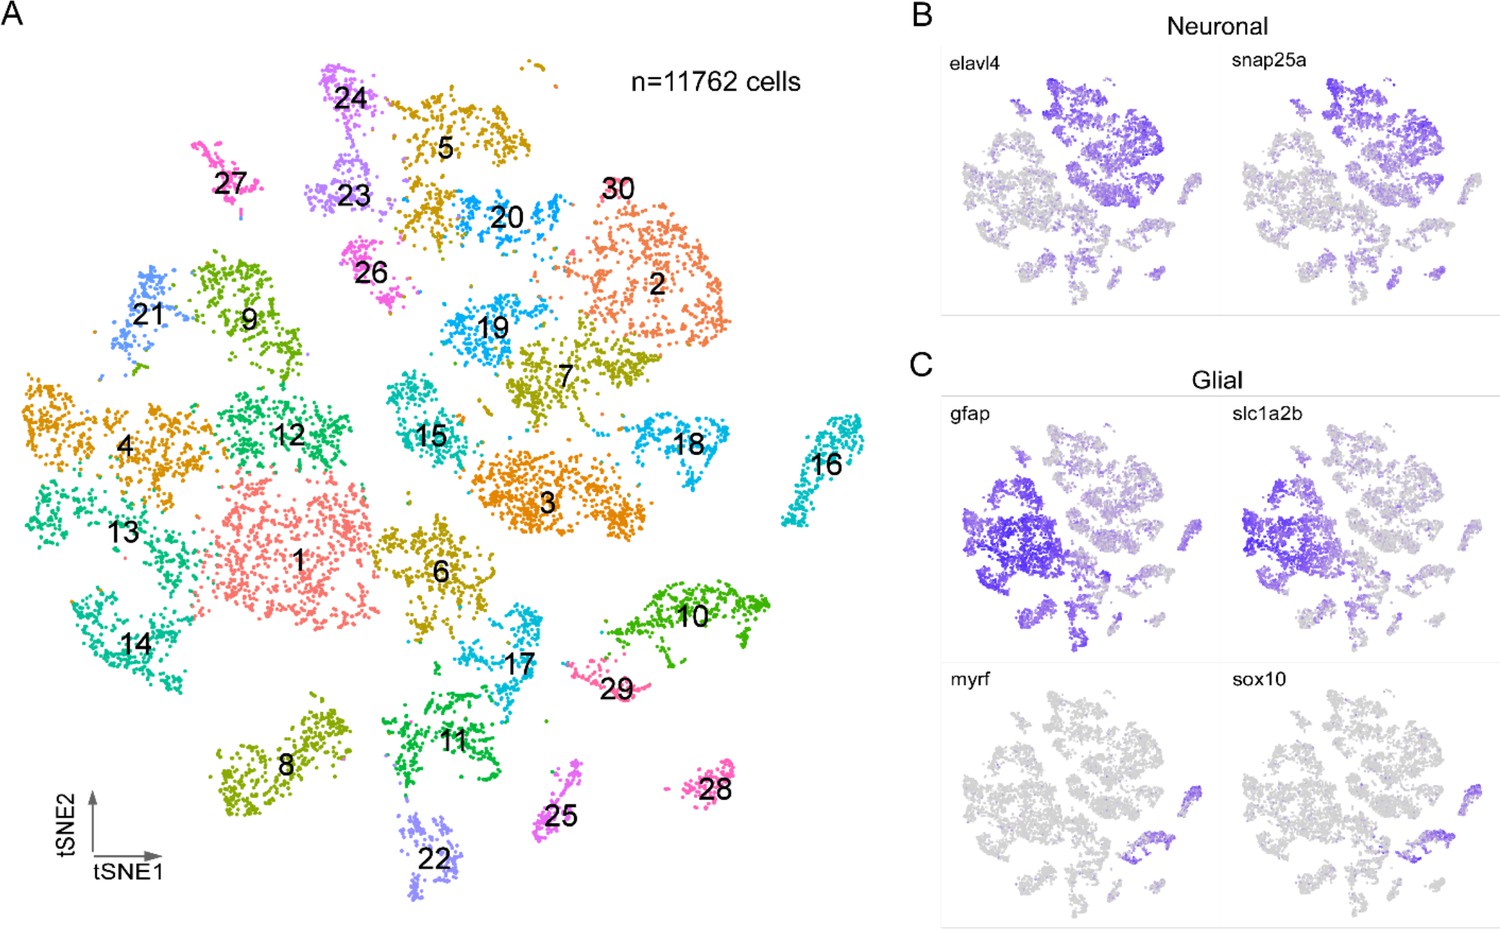
Transcriptional profiling of larval spinal cord.
(A) Visualization of 4 days post fertilization (dpf) spinal cord cells using t-distributed stochastic neighbor embedding (t-SNE). Each dot is a cell and each arbitrary color corresponds to a single cluster. The clusters are individually numbered and the total number of cells indicated. (B, C) Feature plots for two neuron markers (B) and four glial makers (C). Two sets markers are shown to distinguish the two broad types of glial cells, gfap and slc1a2b for astrocytes/radial glia (C, top), myrf and sox10 for oligodendrocytes (C, bottom).
Figure 1—figure supplement 1
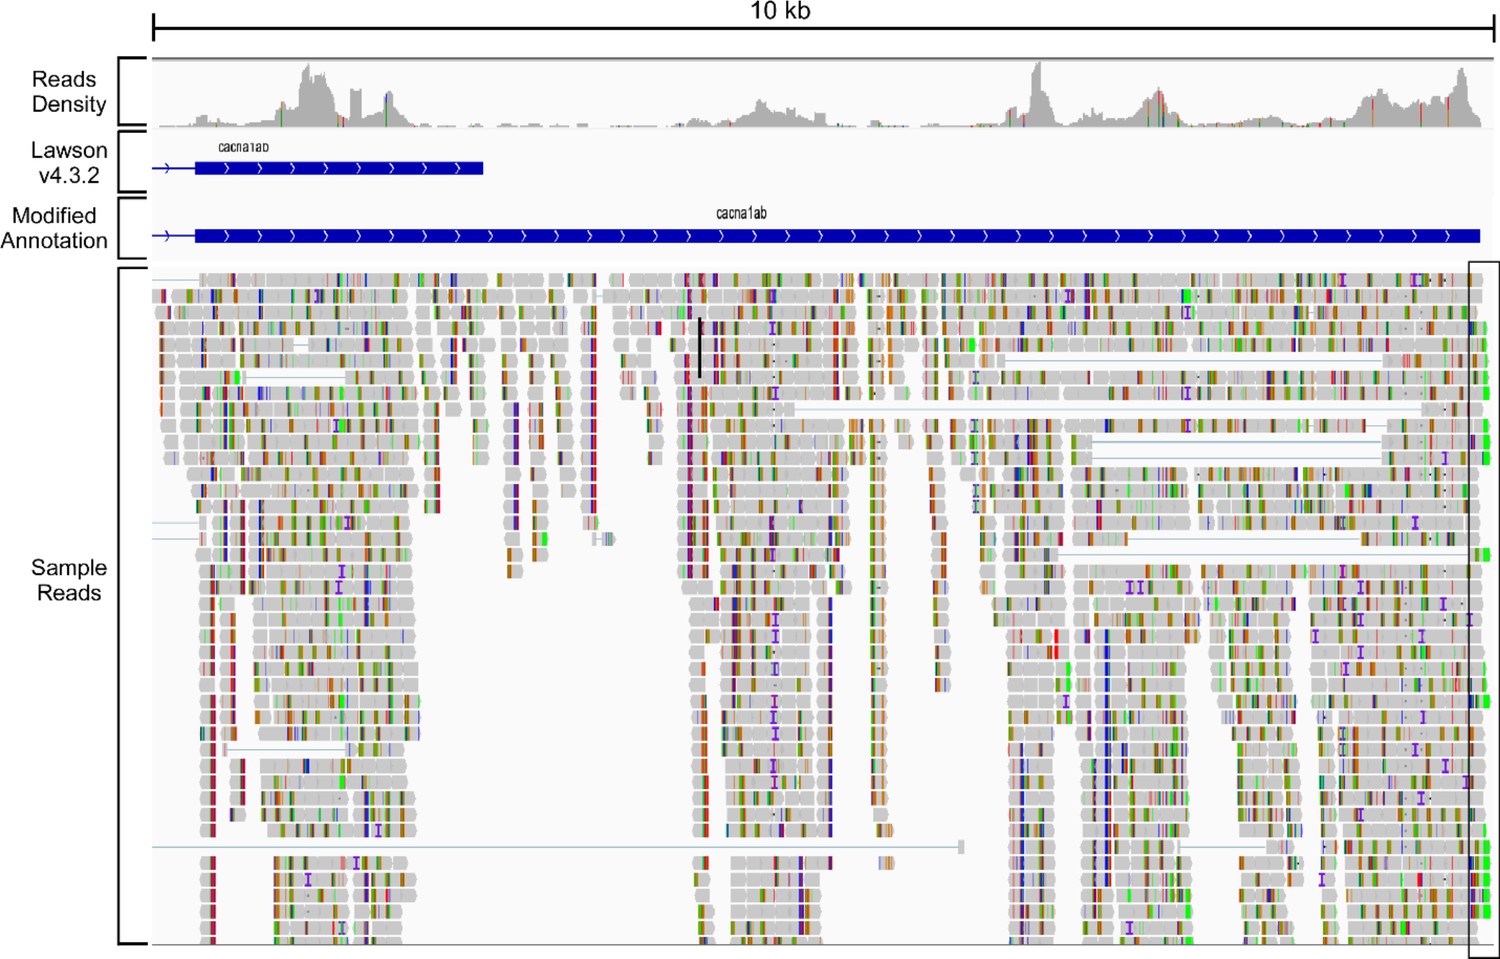
Improved annotation of the cacna1ab gene to extend 3′ untranslated region (UTR).
Select IGV fields shown for 10 kb of the 3′ region of cacna1ab, including the reads density, the annotation based on Lawson v4.3.2. reference genome, the annotation based on our modified reference genome, and sample sequencing reads. Our assignment for the end of 3′ UTR (boxed region) was based on the position of polyA tail in the reads (nucleotide A shown in green).
Figure 1—figure supplement 2
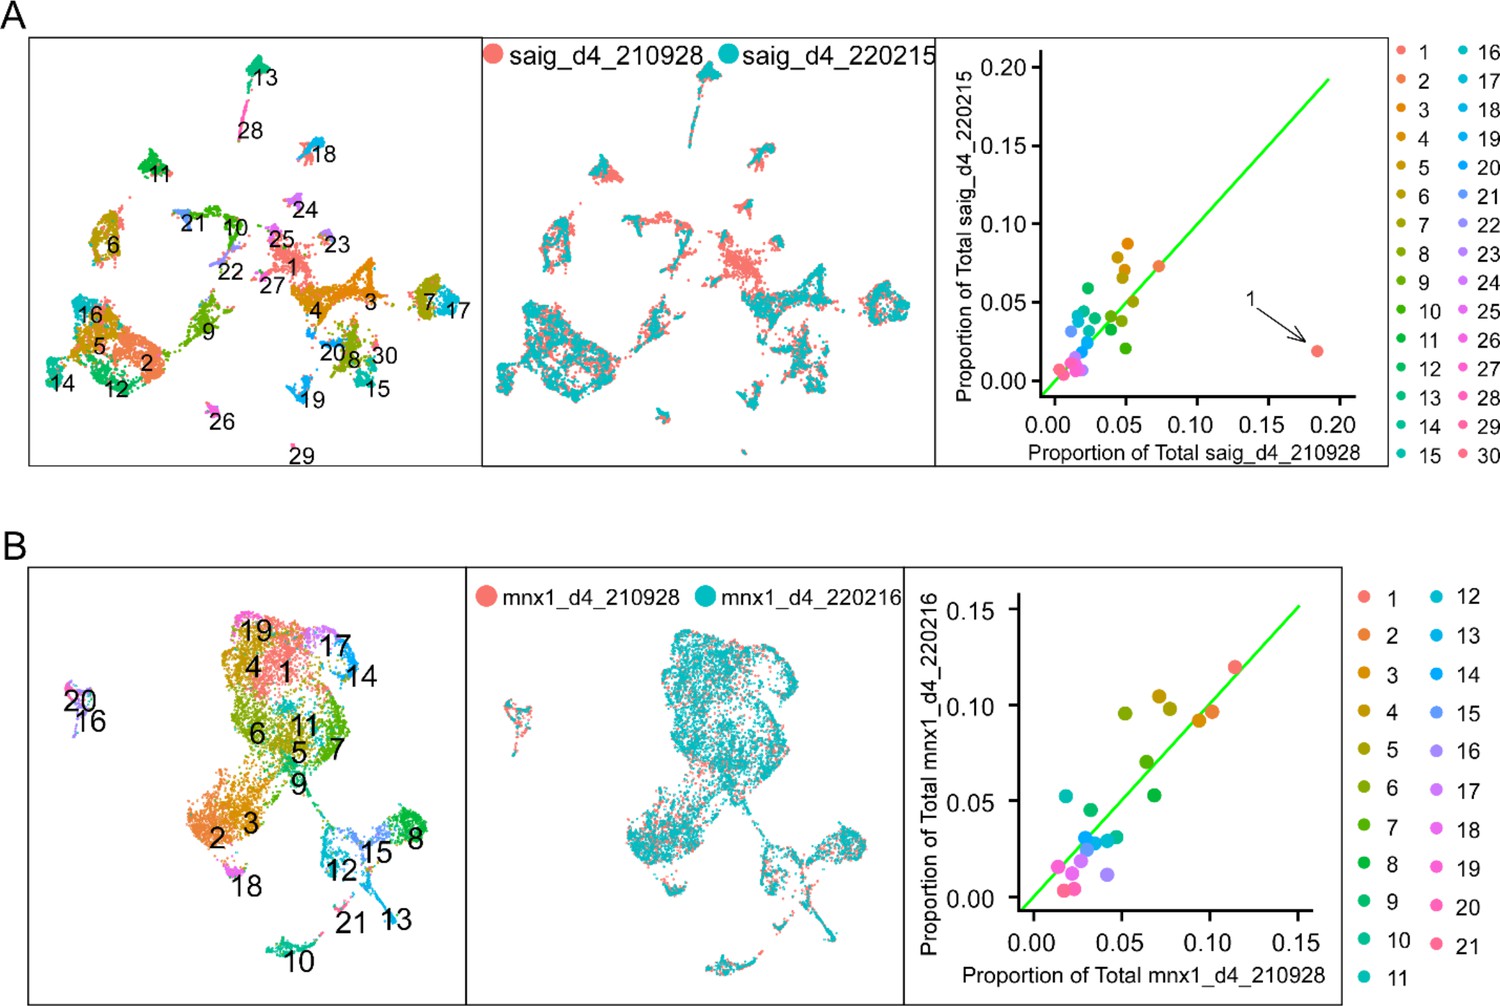
Integration of datasets from duplicated experiments.
(A) Integration of the two full spinal datasets. Uniform Manifold Approximation Projection (UMAP) plots showing the initial clustering of the integrated full spinal data (left) and the projection colored by sample source (middle). The scatterplot shows the proportion of cell of each source accounted for in each cluster (right). Green line indicates where clusters containing an equal proportion of each source would fall. Cluster 1 is a clear outlier with over 90% of its cells belonging to the saig_d4_210928 sample and was not included in the final integrated dataset. (B) Integration of the two FACS-sorted motoneuron (Mn) datasets. Correspondence between duplicates is shown similar to (A).
Figure 1—figure supplement 3
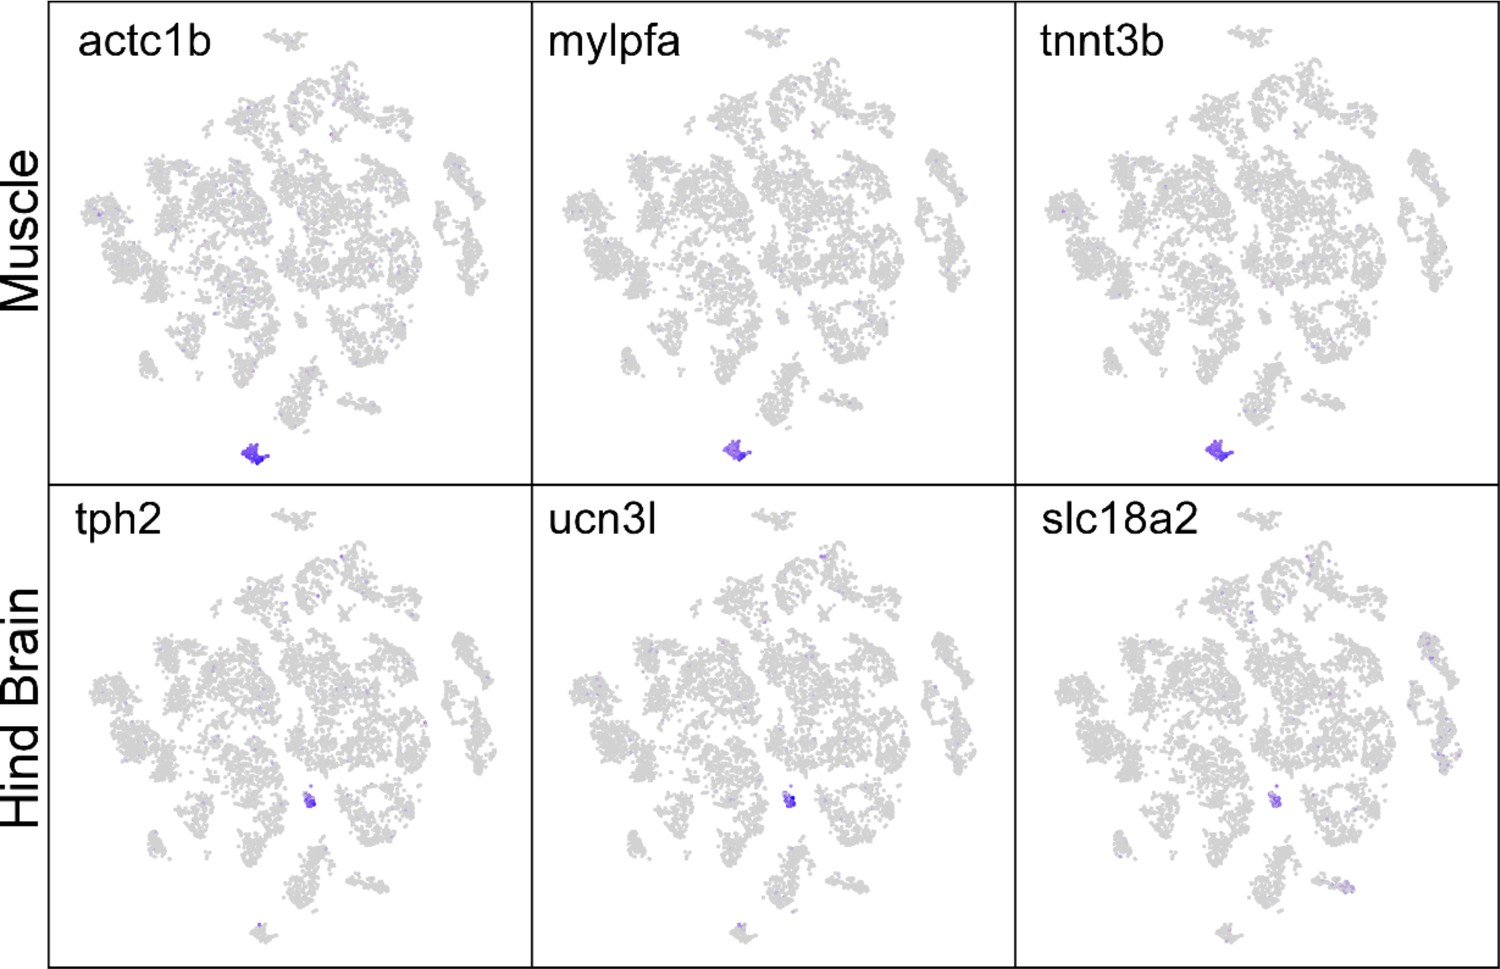
Removal of non-spinal cells.
Feature plots of the muscle markers (actc1b, mylpfa, tnnt3b) and hindbrain markers (tph2, ucn3l, slc18a2) in a t-distributed stochastic neighbor embedding (t-SNE) projection of the combined full spinal cord dataset after quality filters. These small clusters were removed on the basis of their non-spinal origin and not included in the analysis.
Figure 2
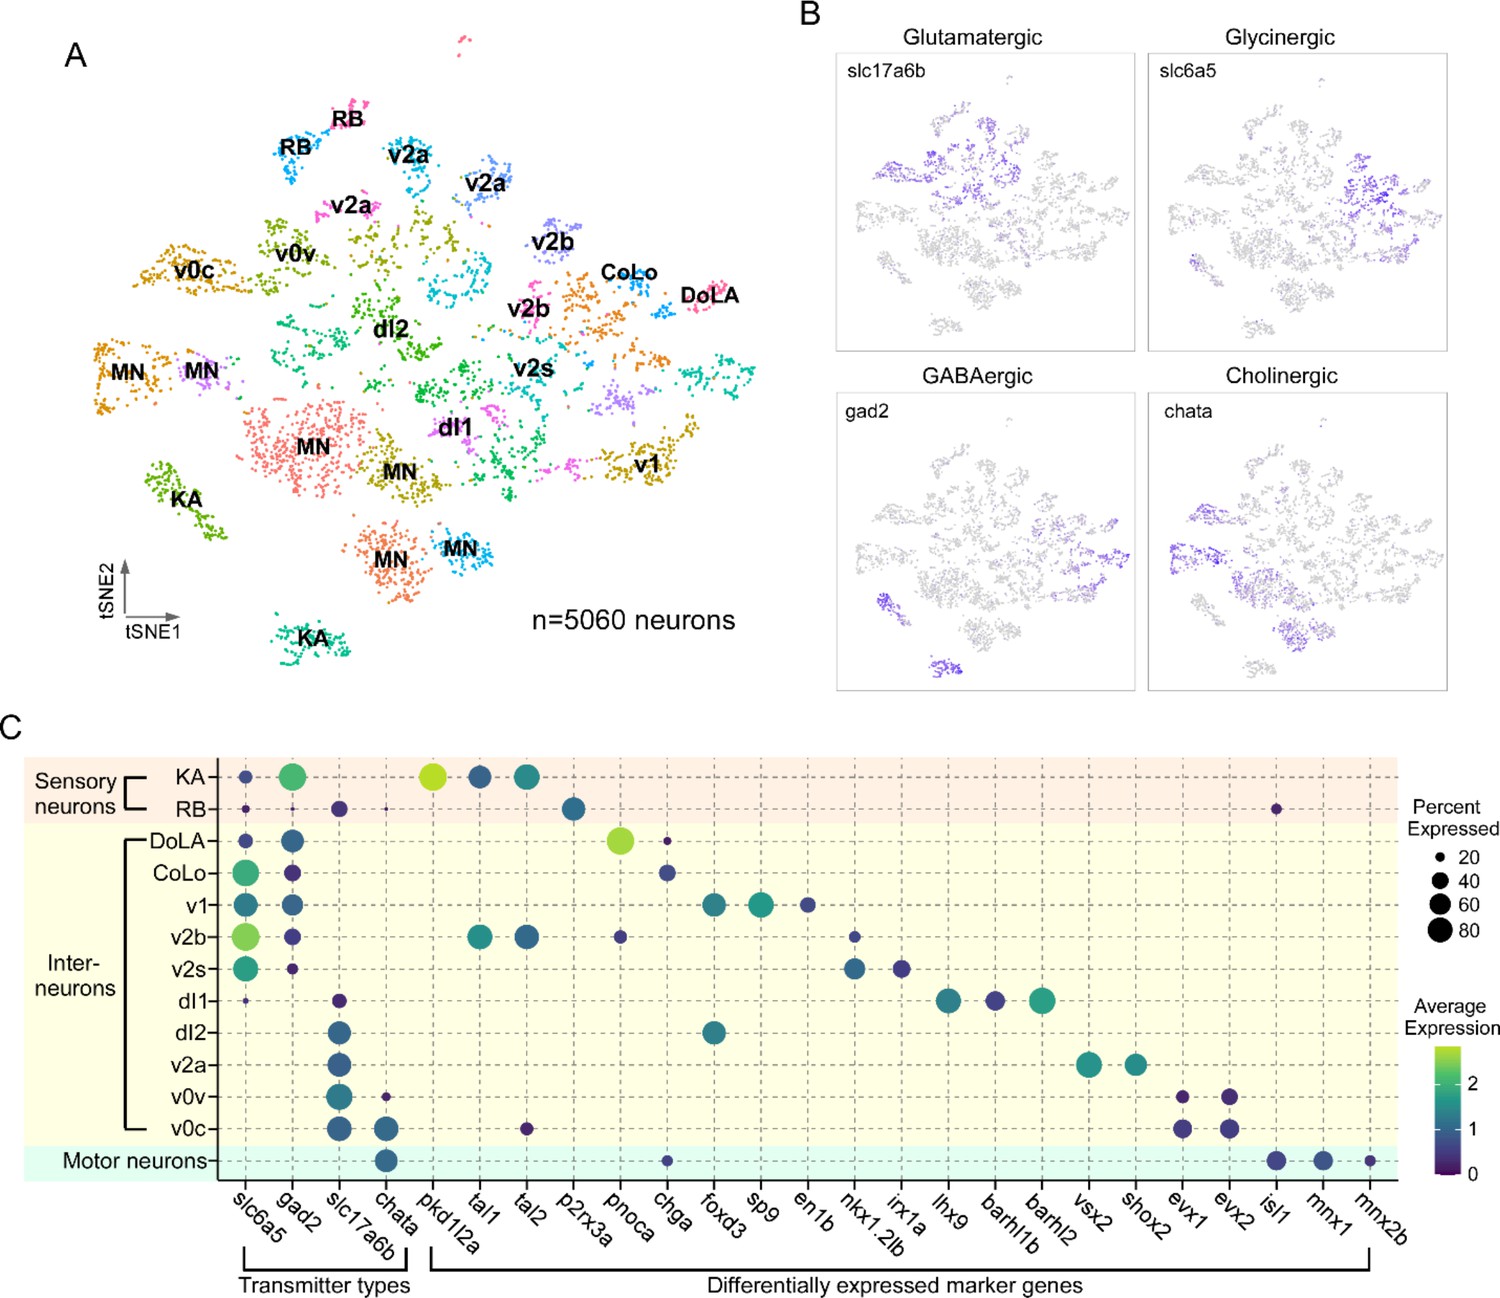
Transcriptional profiling of larval spinal cord neurons.
(A) Visualization of neuronal populations for 4 days post fertilization (dpf) spinal cord using t-distributed stochastic neighbor embedding (t-SNE). Each dot is a cell and each arbitrary color represents a cluster. Cell type identity assigned to each cluster utilized the combination code of neurotransmitter phenotype, marker genes, and morphological labeling. (B) Feature plots for the four major classes of excitatory and inhibitory neurotransmitter genes. Vesicular glutamate transporter vGlut2 (slc17a6b) was used for glutamatergic neurons; glycine transporter glyt2 (slc6a5) for glycinergic neurons; glutamate decarboxylase (gad2) for GABAergic neurons; and choline acetyltransferase (chata) for cholinergic neurons. (C) Dot plot showing neuronal cell identity versus markers used for assignment. Dot size indicates the percentage of cells in the cluster showing expression of the indicated marker, and color scale denotes the average expression level. For visual clarity, dot sizes below 15% expressed are omitted.
Figure 3
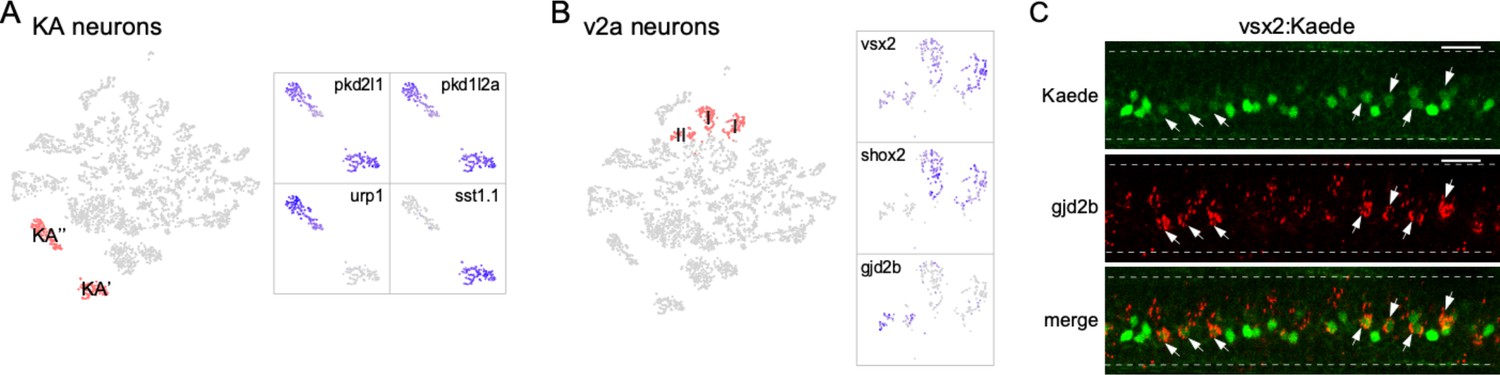
Diversity in neuronal types.
(A) Zoomed feature plots for pkd2l1, pkd1l2a, urp1, and sst1.1 that differentiate the KA′ and KA′′ neurons (right). The two clusters correspond to KA′ and KA′′ neurons indicated in the neuronal t-distributed stochastic neighbor embedding (t-SNE) projection (left, in red). (B) Zoomed feature plots for vsx2, shox2, and gjd2b that differentiate the type I and type II v2a neurons (right). The three clusters corresponding to v2a interneurons indicated in the neuronal t-SNE projection (left, in red). (C) Representative in situ hybridization images showing enriched expression of gjd2b in type II v2a (arrows) in a Tg(vsx2: Kaede) transgenic fish. The two subgroups of v2as were discerned with different levels green Kaede fluorescence. n = 8 fish. Scale bar 20 μm. Spinal cord boundary indicated with dashed lines.
Figure 4

Identification of three different interneuron types using the combination code.
(A) Commissural local (CoLo) interneurons. (A1) A CoLo neuron transiently labeled with GFP was identified by its short axons and localized commissural extension. A cross-section provides a clear view of its commissural branching (left). (A2) Feature plot of chga in the neuronal t-distributed stochastic neighbor embedding (t-SNE) projection. chga expression is localized in the CoLo cluster (red circle with arrow) in addition to a single motoneuron (Mn) cluster. (A3) chga in situ hybridization probes stained a CoLo labeled with GFP. The CoLo in the neighboring hemi-segment that was not labeled by GFP was also positive (arrowheads). Other positive labeling reflect the primary motoneurons (PMns) (see also Figure 5D). n = 6 fish. Boundary of spinal cord and segments indicated (white dash). Scale bar 20 μm. (B) Dorsal longitudinal ascending (DoLA) interneurons. (B1) A DoLA transiently labeled with mCherry was identified by its dorsal position and distinct morphology. (B2) Feature plot of pnoca in the neuronal t-SNE projection. pnoca expression is restricted in the DoLA cluster (red circle with arrow). (B3) In situ hybridization of pnoca shown for several spinal segments. n = 12 fish. Scale bar 100 μm. (B4) In situ hybridization of pnoca colocalized with an mCherry-labeled DoLA neuron. n = 7 cells. Scale bar 20 μm. (C) v0c interneurons. (C1) Zoomed feature plots for evx1, evx2, chata, slc18a3a, slc17a6b, mnx1, mnx2b, and isl1 in the v0c cluster (right). The cluster corresponding to v0c neurons indicated in the neuronal t-SNE projection (left, in red). v0c interneuron cluster is identified by the coexpression of both glutamate (slc17a6a) and acetylcholine (slc18a3a/chata) pathway genes, and absence of Mn markers (mnx1/mnx2b/isl1). (C2) An example of a transiently labeled v0c by mCherry in a 4 day post fertilization (dpf) Tg(mnx1:GFP) fish. (C3) An example of v0c neurons in gray scale showing the morphology, with boundaries of the motor column (green dash) and enlargements along the axon (arrowheads) indicated. n = 37 fish. Scale bar 50 μm in (C2) and (C3). Caudal on right and rostral on left.
Figure 5 with 1 supplement
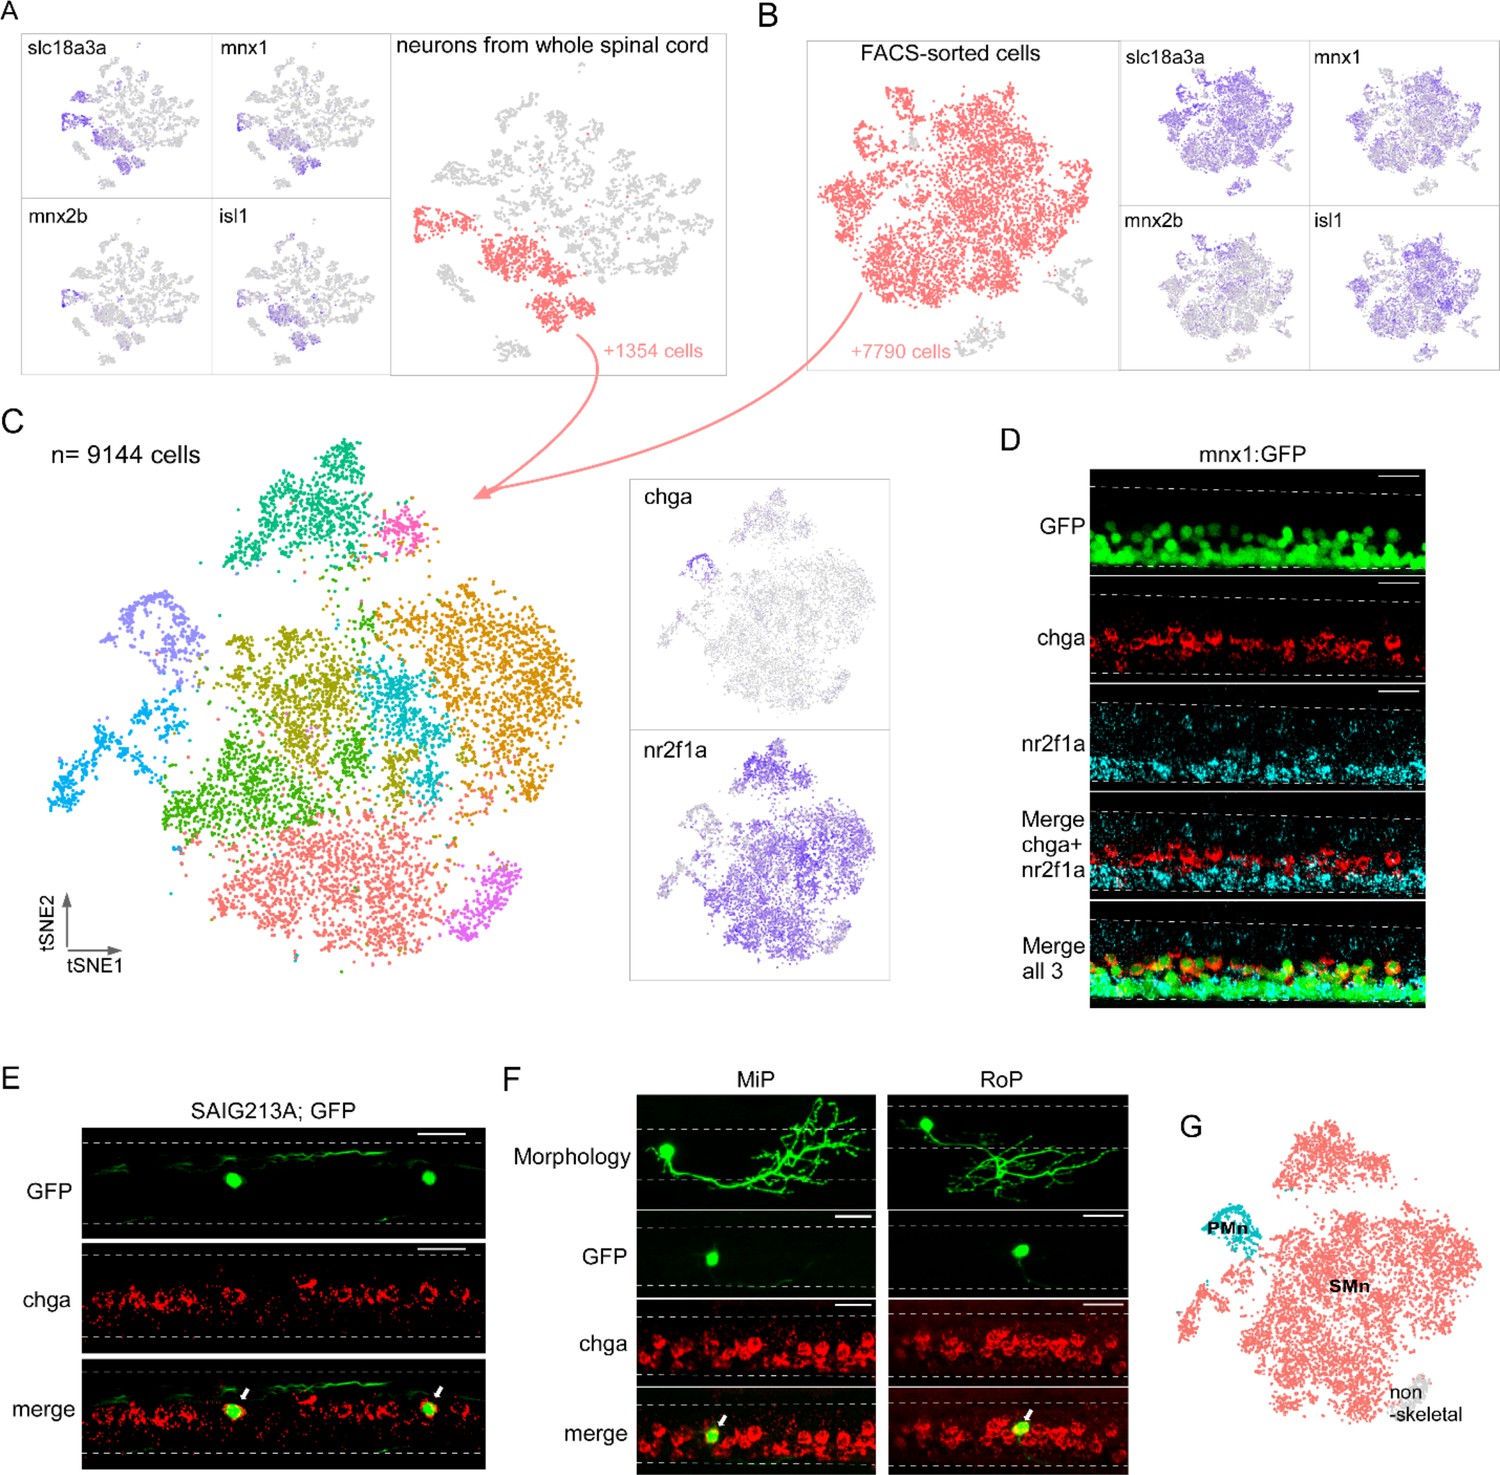
Single-cell transcriptional profiling of motoneuron (Mn) types at larval stage.
Both computational extraction (A) and experimental enrichment (B) approaches were used to isolate Mn populations (red) on the bases of coexpression of acetylcholine transmitter genes (slc18a3a shown) and established Mn markers (mnx1, mnx2b, and isl1). The total numbers of Mns obtained using each approach indicated. (C) The integrated dataset shown in t-distributed stochastic neighbor embedding (t-SNE) projection, along with feature plots for two marker genes, chga and nr2f1a. (D) Representative in situ hybridization images using chga and nr2f1a probes in a 4 day post fertilization (dpf) Tg(mnx1:GFP) fish spinal cord. The motor column, indicated by GFP expression, is located ventrally in the spinal cord (top). chga and nr2f1a signals occupied more dorsal and ventral positions respectively within the motor column (bottom four panels). n = 13 fish. (E, F) in situ hybridization images showing specific expression of chga in primary motoneurons (PMns). Colocalization is shown for GFP-labeled CaP in Tg(SAIG213A;EGFP) fish (indicated by arrows in E, n = 14 fish), and individually labeled MiP and RoP (indicated by arrows in F, n = 4–6 cells). For images in (D–F), dorsal is up. Dashed line indicates the spinal cord boundary. Scale bar 20 μm. (G) PMn (cyan), secondary motoneurons (SMn) (red), and non-skeletal Mn (gray) assignment.
Figure 5—figure supplement 1
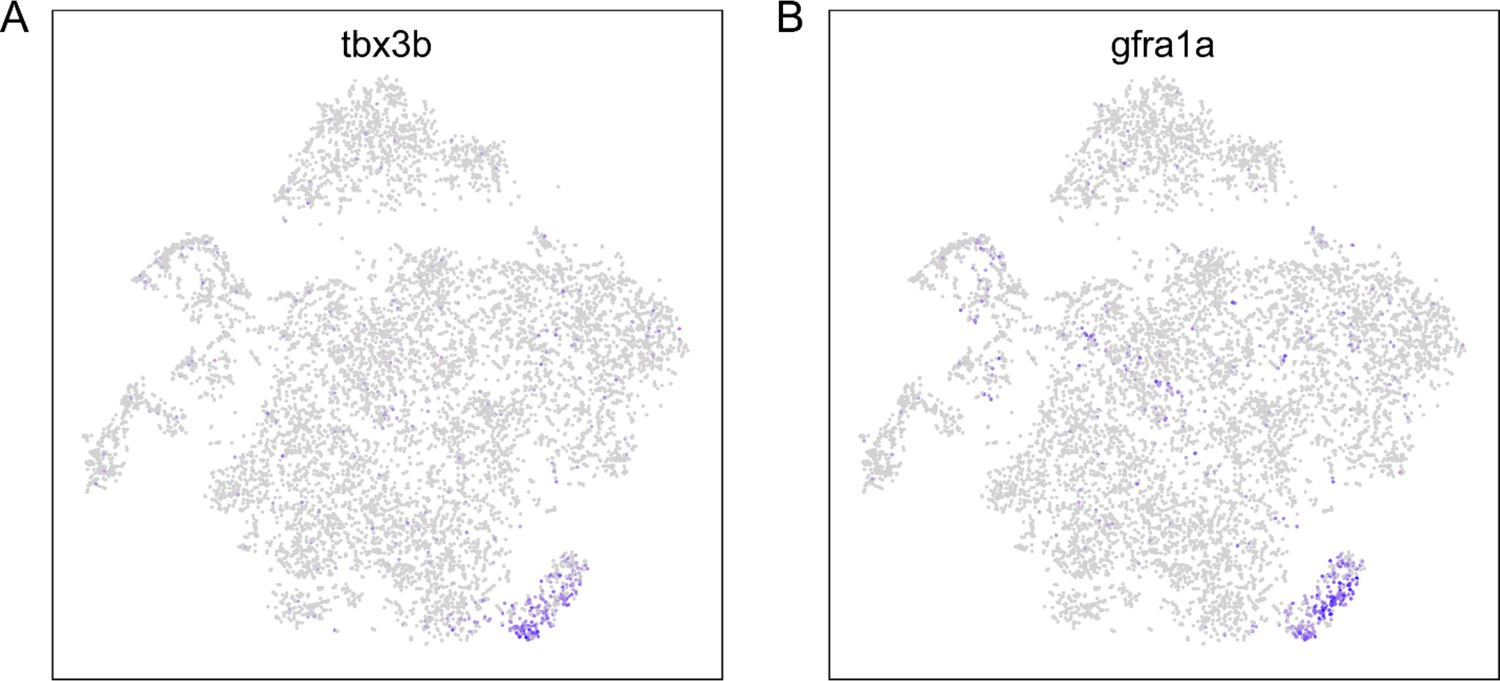
An unidentified cluster in the integrated motoneuron (Mn) datasets.
Feature plots showing restricted expression of tbx3b (A) and gfra1a (B) to a small cluster in the t-distributed stochastic neighbor embedding (t-SNE) projection of Mn dataset as shown in Figure 5C.
Figure 6
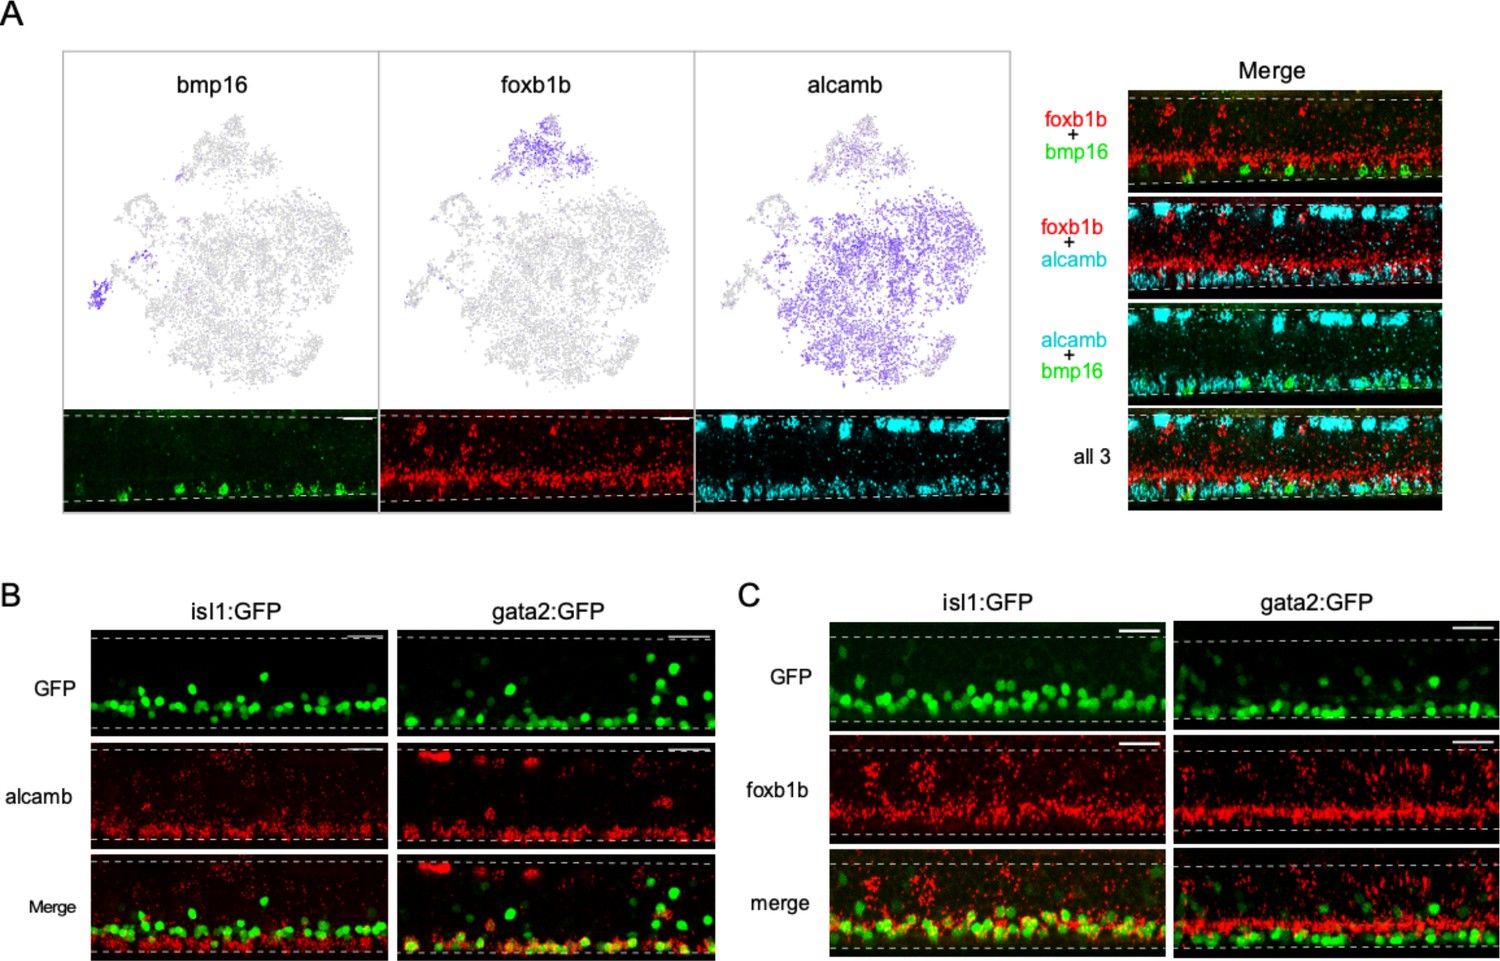
Diversity among secondary motoneurons (SMns).
(A) Differential expression of bmp16, foxb1b, and alcamb associated with distinct SMn clusters. Feature plots in the Mn t-distributed stochastic neighbor embedding (t-SNE) projection (top) and representative in situ hybridization images (bottom) are shown for each marker gene. Merged images of different probe combinations (right) highlight the differences in expression pattern in the motor column. n = 10 fish. (B) Representative in situ hybridization images comparing alcamb expression in GFP-labeled SMn subpopulations in Tg(isl1:GFP) (left, n = 6 fish) and Tg(gata2:GFP) (right, n = 6 fish). Note that alcamb also expresses at high level in the RB neurons located along the dorsal edge of the spinal cord. (C) Representative in situ hybridization images comparing foxb1b expression in GFP-labeled SMn subpopulations in Tg(isl:GFP) (left, n = 14 fish) and Tg(gata2:GFP) (right, n = 12 fish). Scale bar 20 μm; White dashed line indicates the boundary of spinal cords; dorsal is up.
Figure 7 with 2 supplements
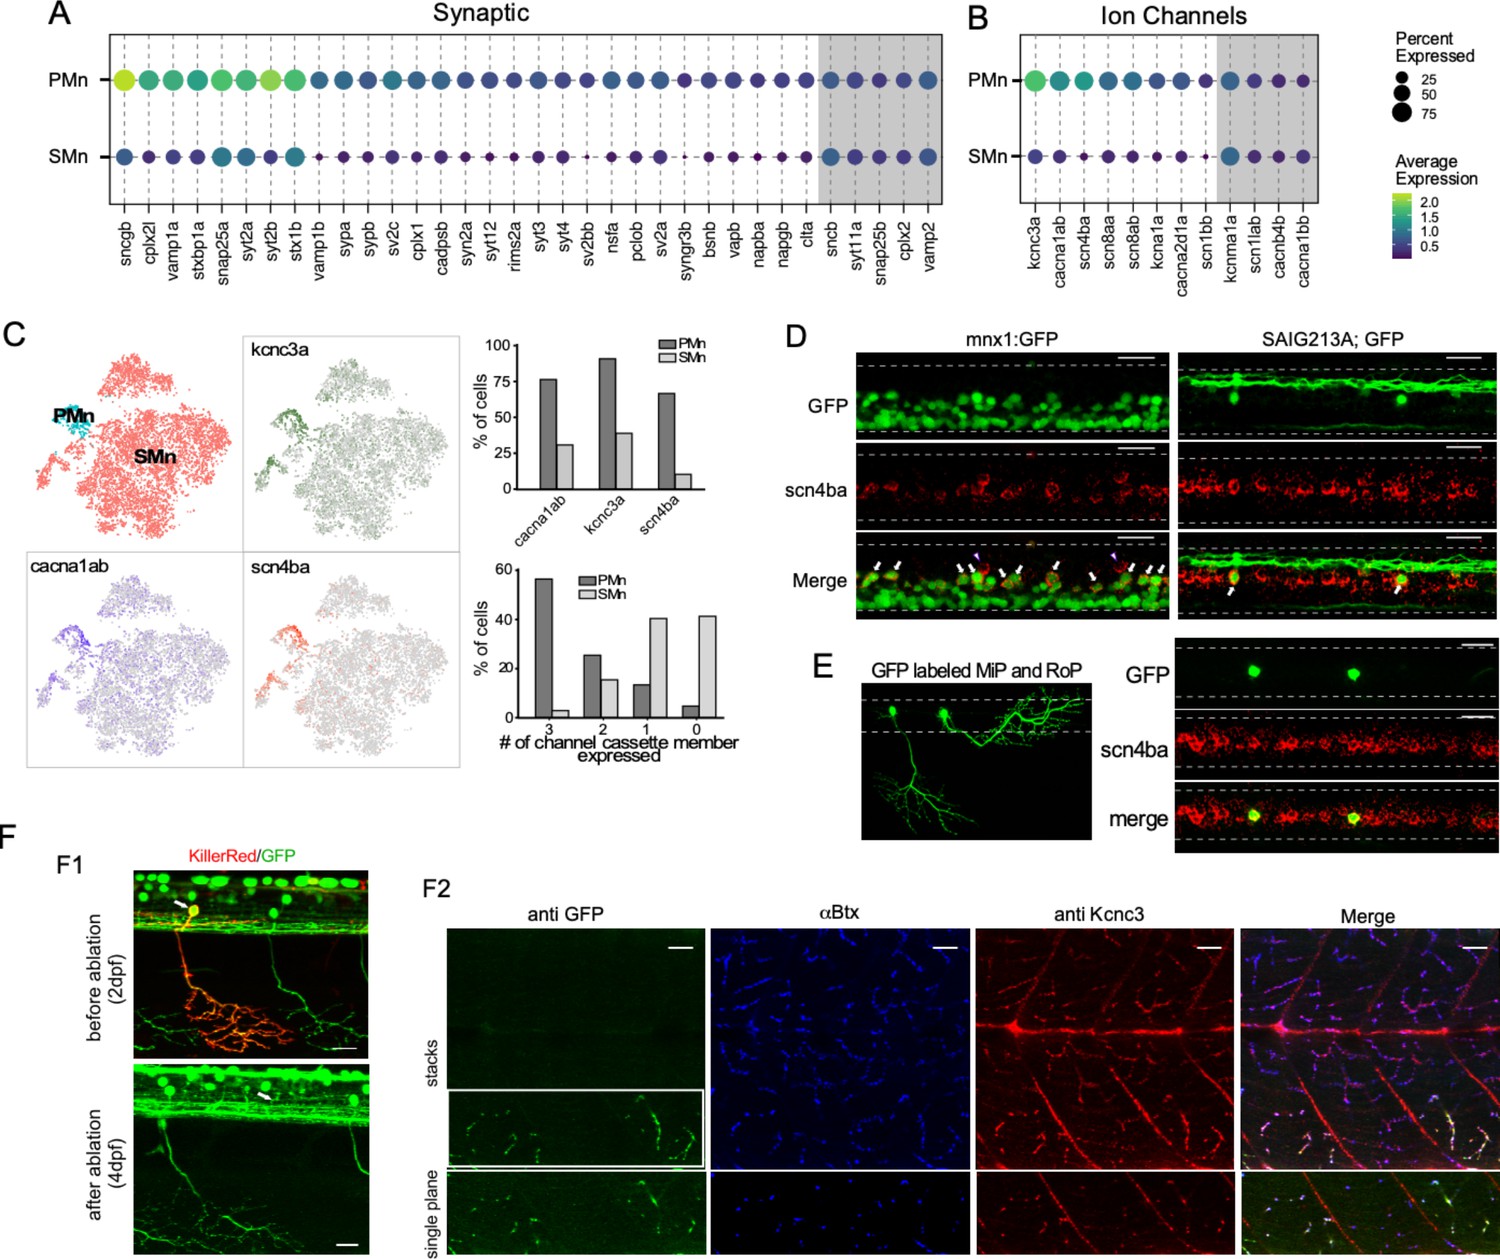
Transcriptome comparison between primary motoneurons (PMns) and secondary motoneurons (SMns).
(A) Dot plot for synaptic genes differentially enriched in PMns compared to SMns. Both percentage of cells with expression and average expression levels are shown. Examples of synaptic genes that are expressed at comparable levels between the two Mn types are shaded in gray. (B) A similar comparison for differentially expressed ion channel genes as shown in (A). (C) Feature plots for three top differentially expressed ion channel genes, cacna1ab, scn4ba, and kcna3a, shown in the Mn t-distributed stochastic neighbor embedding (t-SNE) projection (left). The assignment of Mn type identity was duplicated from Figure 5G for reference (right graphs). The proportion of cells in each Mn type expressing individual cassette member (top) and cassette member combinations (bottom). (D) Representative in situ hybridization images with scn4ba probes in Tg(mnx1:GFP) (left) and Tg(SAIG213A;GFP) (right) transgenic fish. Each image shows approximately two segments of the spinal cord in the middle trunk of 4 days post fertilization (dpf) fish. Arrows indicate the PMns in Tg(mnx1:GFP) and CaP in Tg(SAIG213A;GFP) fish (n = 15–18 fish). Two commissural local (CoLo) interneurons labeled with scn4ba probes are also indicated (arrowhead). (E) Expression of scn4ba in the MiP and RoP PMns. The morphology of GFP-labeled MiP and RoP in an injected fish shown (left). In situ hybridization images with scnba probes in this fish showed colocalization with GFP labeling (right). n = 7–10 cells. Scale bar 20 μm; white dashed line indicates the boundary of spinal cord; dorsal is up. (F) Validation of kcnc3a enrichment in PMns by immunohistochemistry staining. (F1) KillerRed-mediated photoinactivation of CaP. Representative fluorescent images showing approximately two segments of a Tg(SAIG213A;EGFP) fish with a single CaP (arrow) expressing KillerRed, before photo illumination at 2 dpf (top), and ~40 hr after inactivation (bottom). Both the soma (the location indicated by an arrow) and periphery branches (see also F2 leftmost panel) are absent after the ablation. (F2) Immunohistochemical staining of the same fish with a Kcnc3-specific antibody. GFP expression is revealed by anti-GFP antibody staining, and the location of synapses labeled by α-Btx. Top panels represent a maximal intensity projection of a stacked of z-plane images, while the bottom shows a single focal plane of the CaP target field (indicated by a white box). Scale bar 20 μm. n = 5 fish.
Figure 7—figure supplement 1
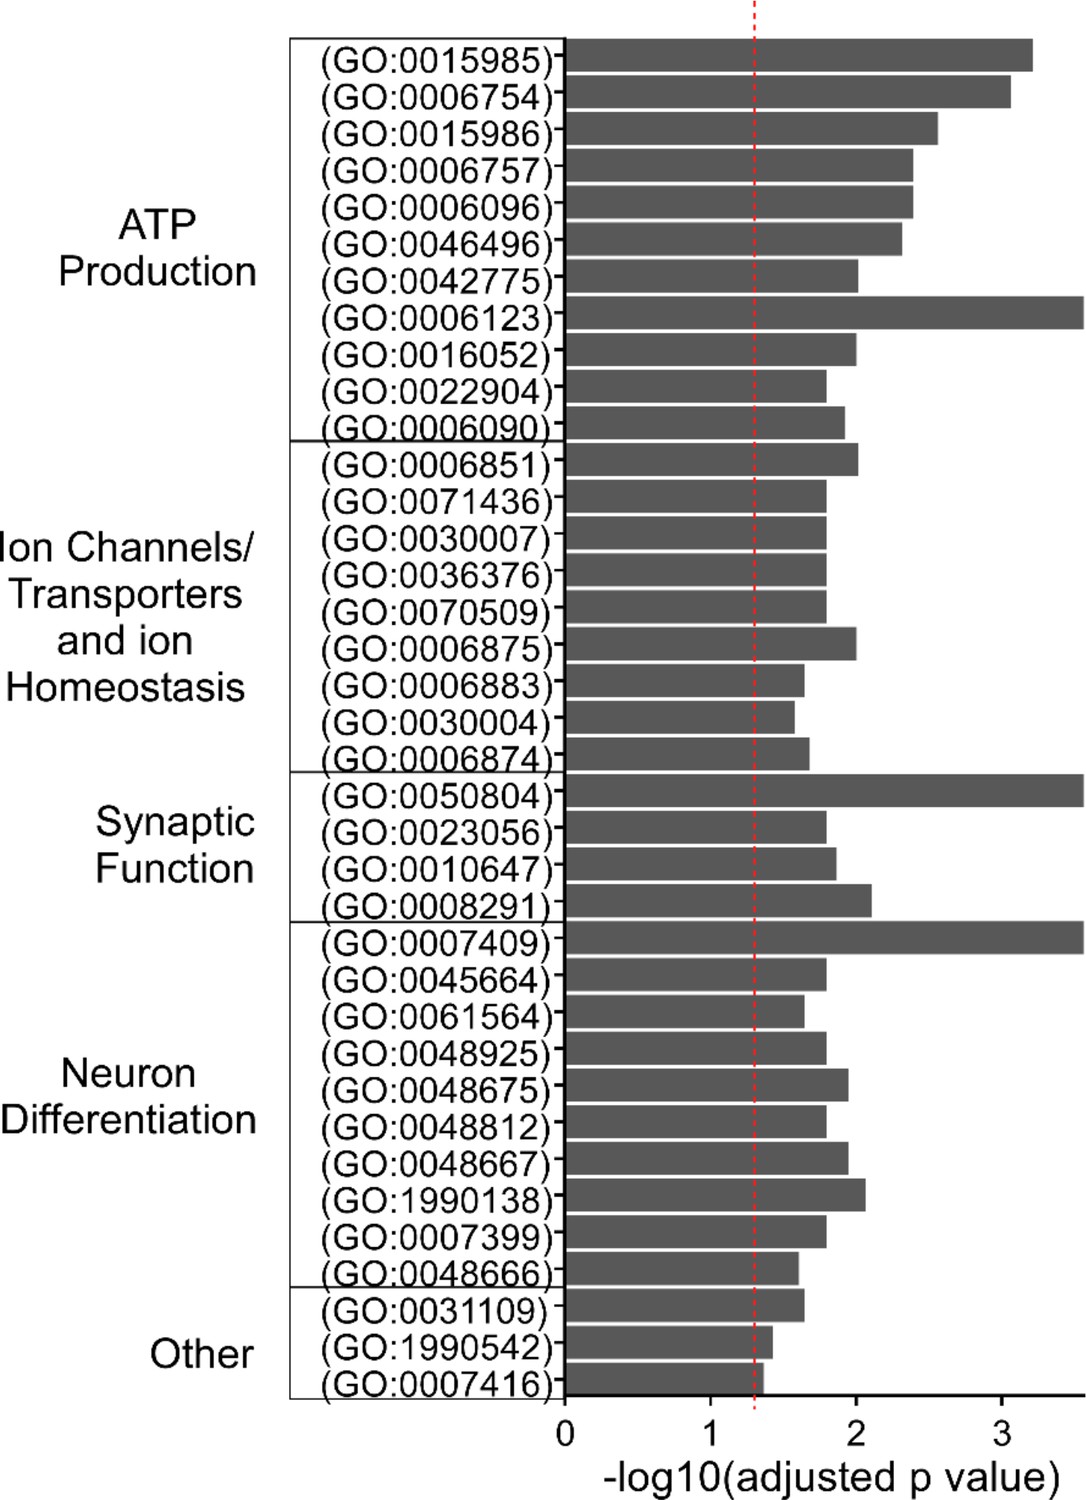
Gene Ontology (GO) analysis for primary motoneuron (PMn) differentially expressed genes (DEGs).
GO terms with significant enrichment for PMn DEGs are shown (red dashed line indicates adjusted p-value of 0.05). GO terms are grouped into broad categories, ATP production (11/37), ion channel/transporters and ion homeostasis (9/37), synaptic function (4/37), neuron differentiation (10/37), and other miscellaneous terms (3/37).
Figure 7—figure supplement 2
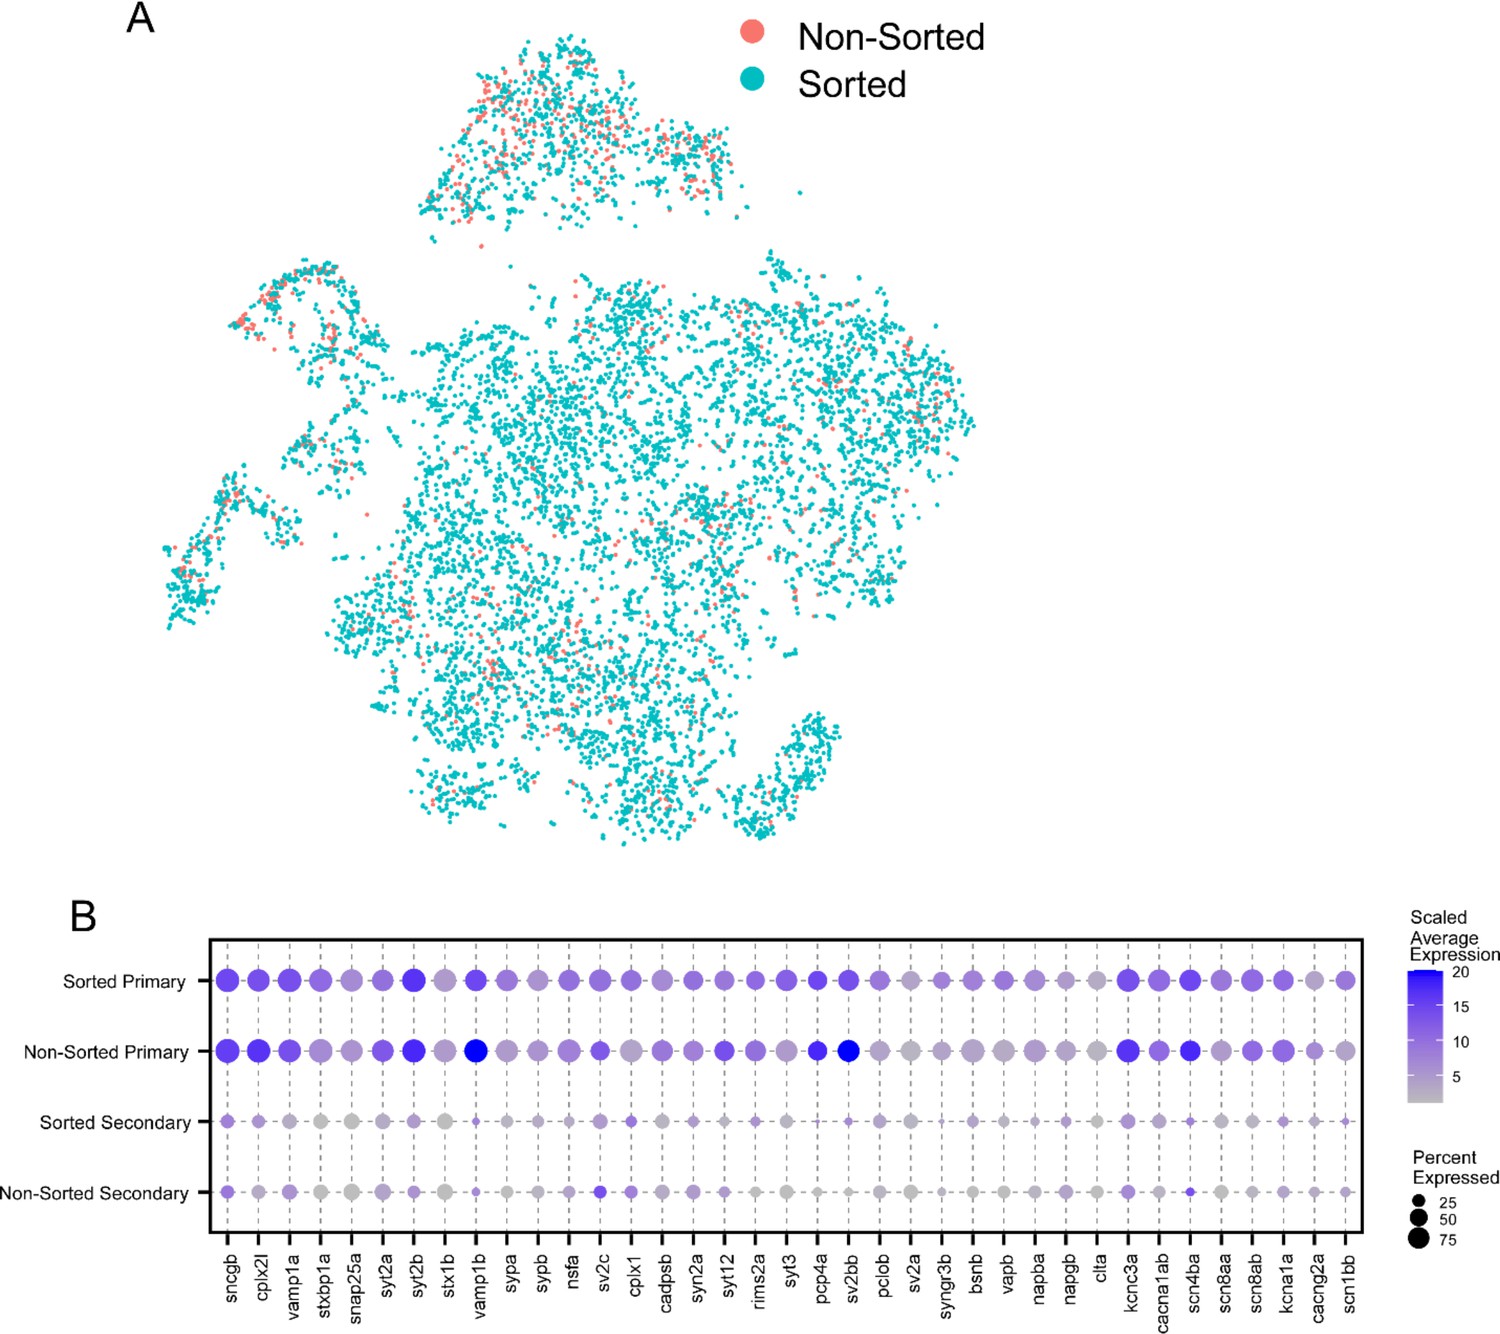
Combining motoneuron (Mn) datasets from two isolation methods.
(A) t-distributed stochastic neighbor embedding (t-SNE) projection of the integrated Mn dataset (as shown in Figure 5C) with cells colored by whether they were sourced from the FACS-sorted dataset (sorted, in teal) or extracted from the full spinal dataset (non-sorted, in orange). (B) Dot plot comparing results of differential expression analysis between primary motoneurons (PMns) and secondary motoneurons (SMns), done separately for the sorted dataset or the non-sorted dataset. Average expression level was scaled to a range of 1–20.
Figure 8
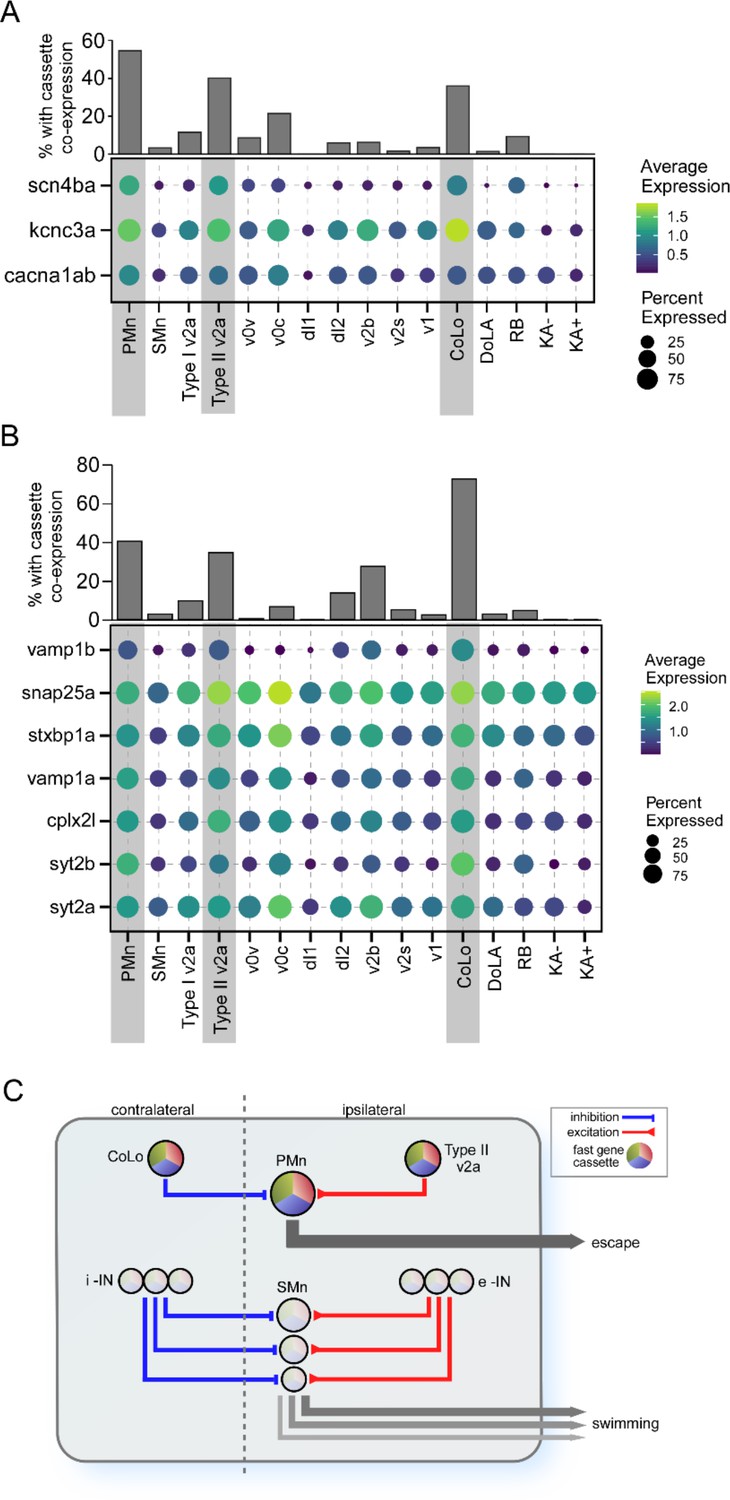
Differential expression of gene cassettes in larval zebrafish escape circuit.
(A) The ion channel cassette. (Lower) Dot plot showing the averaged expression level (color scale) and percentage of cell expressed (dot area) of scn4ba, kcnc3a, and cacna1ab channel genes in different neuronal types. The three neuronal types located at the escape circuit output pathway are highlighted (gray shade). (Upper) Bar graph showing the percentages of cells in each neuronal type coexpressing all three channel genes. (B) The cassette of synaptic genes. Seven top primary motoneuron (PMn) differentially expressed genes (DEGs) encoding proteins involved in synaptic transmission are shown for all neuronal types. (C) Proposed circuitry for separate control over escape and swimming in larval zebrafish. The schematic model is based on published studies and incorporates the role of the DEG cassettes in conferring behavioral and functional distinctions that are manifest both centrally and at the NMJ. The circuitry and cassette expression in the PMn that control escape are illustrated at the top, and the SMn circuitry that controls swim speed is illustrated at the bottom. Swim speed is dependent on Mn size as published, which is determined at the levels of both spinal circuitry and neuromuscular synaptic strength. According to this simplified model, the gradient of synaptic strength and speed at the NMJ is set by the levels of cassette expression among Mns. i-IN, inhibitory interneurons; e-IN, excitatory interneurons.
Tables
Table 1
Combination codes used for assigning cell types to clusters.
| Cell type | Neurotransmitter | Markers | % of neurons |
|---|---|---|---|
| KA | GABA | pkd1l2a, tal1,tal2 | 7.0 |
| RB | Glutamate | p2rx3a | 3.8 |
| DoLA | GABA | pnoca | 1.4 |
| CoLo | Glycine | chga | 1.1 |
| v1 | Glycine/GABA | sp9, foxd3, en1b | 4.1 |
| v2b | Glycine | tal1, tal2 | 3.6 |
| v2s | Glycine | nkx1.2lb, irx1a | 2.7 |
| dl1 | Glutamate | lhx9, barhl1b, barhl2 | 1.7 |
| dl2 | Glutamate | foxd3 | 3.7 |
| v2a | Glutamate | vsx2, shox2 | 6.2 |
| v0v | Glutamate | evx1,evx2 | 4.0 |
| v0c | Glutamate/acetylcholine | evx1, evx2, | 4.2 |
| Mns | Acetylcholine | isl1, mnx1, mnx2b | 26.8 |
Additional files
-
Supplementary file 1
Table of differentially expressed genes (DEGs) in spinal neuron clusters.
- https://cdn.elifesciences.org/articles/89338/elife-89338-supp1-v1.xlsx
-
Supplementary file 2
Table of differentially expressed genes (DEGs) in primary motoneurons (PMns) versus secondary motoneurons (SMns).
- https://cdn.elifesciences.org/articles/89338/elife-89338-supp2-v1.xlsx
-
Supplementary file 3
Changes to the Lawson v4.3.2 reference genome.
- https://cdn.elifesciences.org/articles/89338/elife-89338-supp3-v1.xlsx
-
MDAR checklist
- https://cdn.elifesciences.org/articles/89338/elife-89338-mdarchecklist1-v1.docx
Download links
A two-part list of links to download the article, or parts of the article, in various formats.
Downloads (link to download the article as PDF)
Open citations (links to open the citations from this article in various online reference manager services)
Cite this article (links to download the citations from this article in formats compatible with various reference manager tools)
Single-cell RNAseq analysis of spinal locomotor circuitry in larval zebrafish
eLife 12:RP89338.
https://doi.org/10.7554/eLife.89338.3


