H1 restricts euchromatin-associated methylation pathways from heterochromatic encroachment
- Department of Molecular, Cell and Developmental Biology, University of California, Los Angeles, United States
- Eli & Edythe Broad Center of Regenerative Medicine & Stem Cell Research, University of California, Los Angeles, United States
- Howard Hughes Medical Institute, University of California, Los Angeles, United States
Figures
Figure 1 with 1 supplement
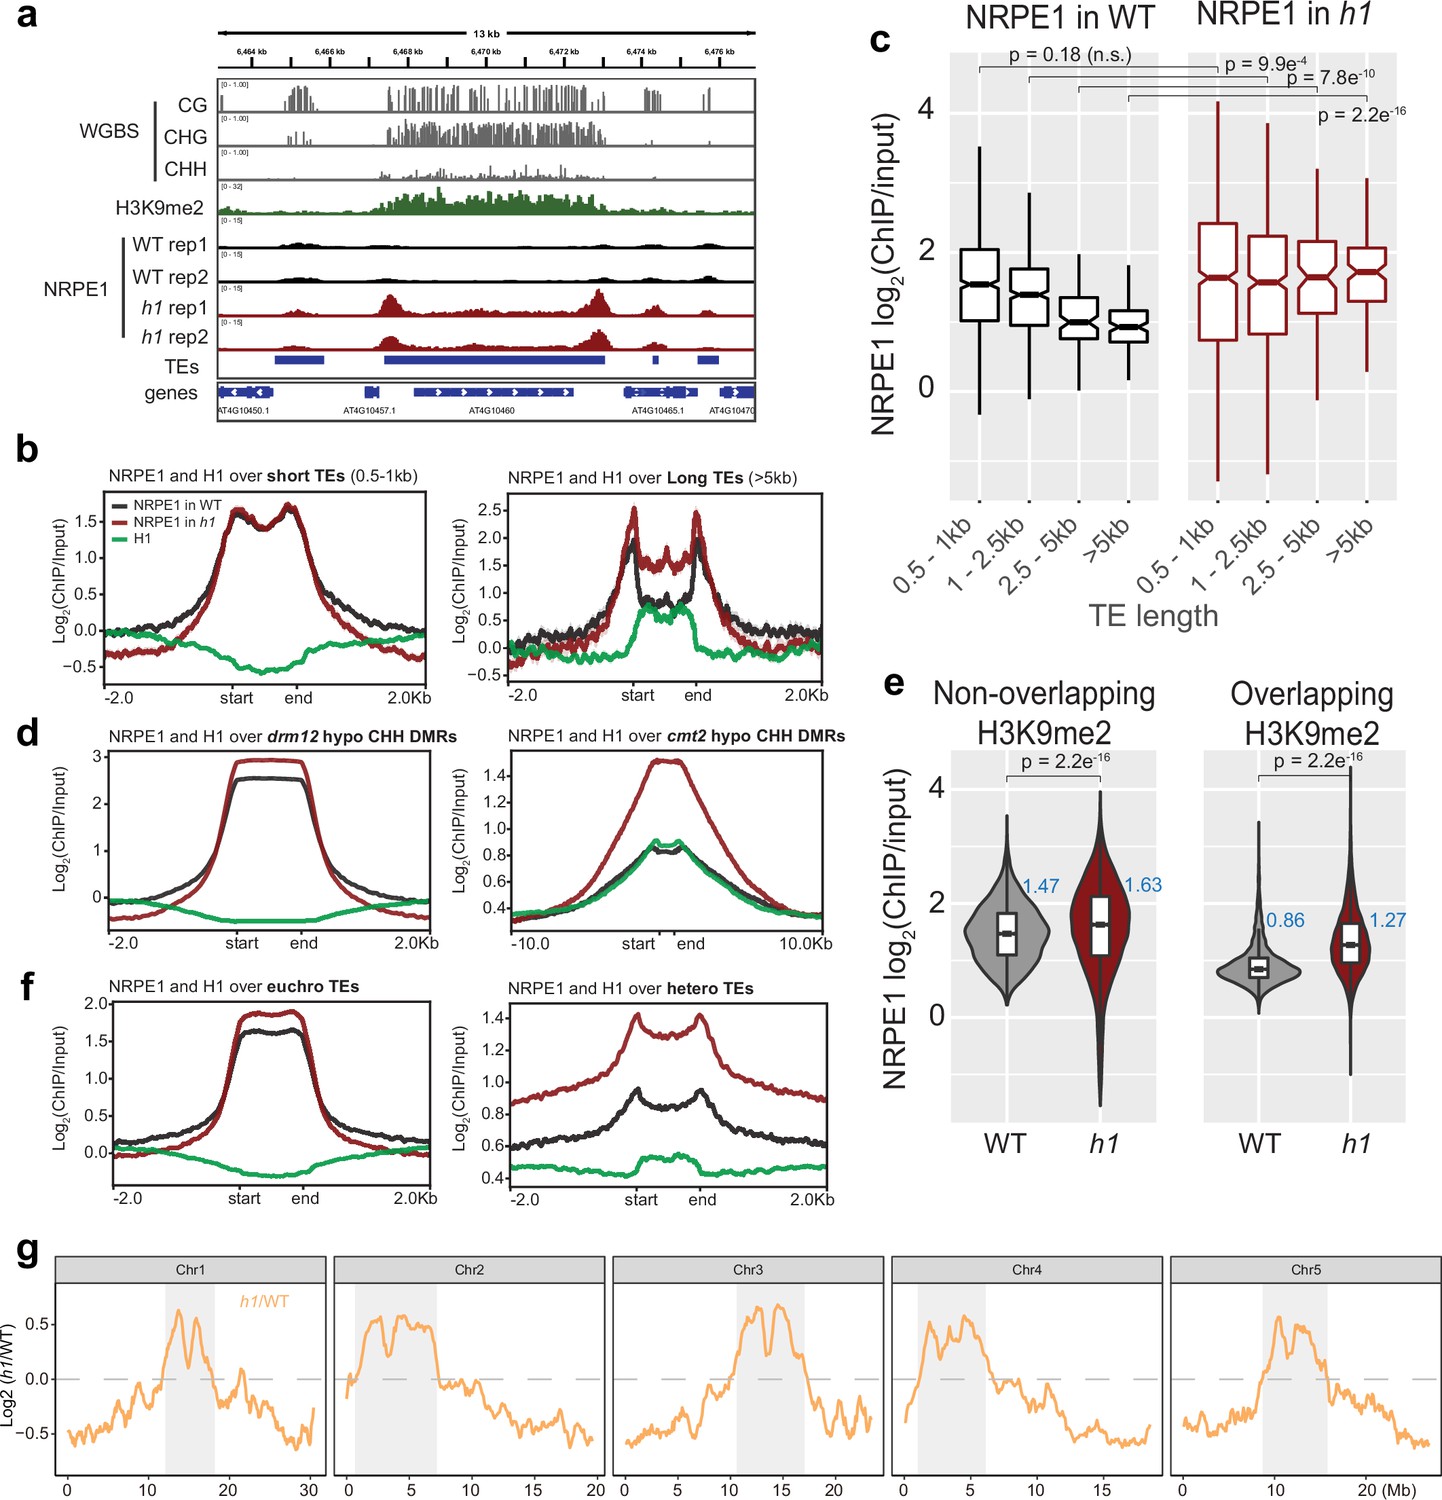
NRPE1 accumulates in heterochromatin in an h1 mutant background.
(A) Genome browser image showing increased NRPE1 enrichment in h1 over heterochromatic (long, H3K9me2 enriched) and not euchromatic (short, not H3K9me2 enriched) transposable elements (TEs). (B) metaplot showing ChIP-seq enrichment of NRPE1 in wild-type (WT) vs. h1, and H1 occupancy in WT for reference (data from GSE122394), at short vs. long TEs. (C) boxplot showing association between NRPE1 and TE length in WT and h1. wilcoxon rank sum test p-values indicated. (D) As in (B) for drm12 vs. cmt2 hypo CHH differentially methylated regions (DMRs). (E) Violin plot inlaid with boxplot showing enrichment of NRPE1 at TEs that overlap with H3K9me2 peaks, vs. TEs that do not, in WT vs. h1. Boxplot medians are shown in blue. Wilcoxon rank sum test p-values indicated. (F) as in (B) at euchromatic vs. heterochromatic TEs. (G) Chromosomal plots showing NRPE1 enrichment in h1 as compared to WT, with pericentromeric regions denoted in gray.
Figure 1—figure supplement 1
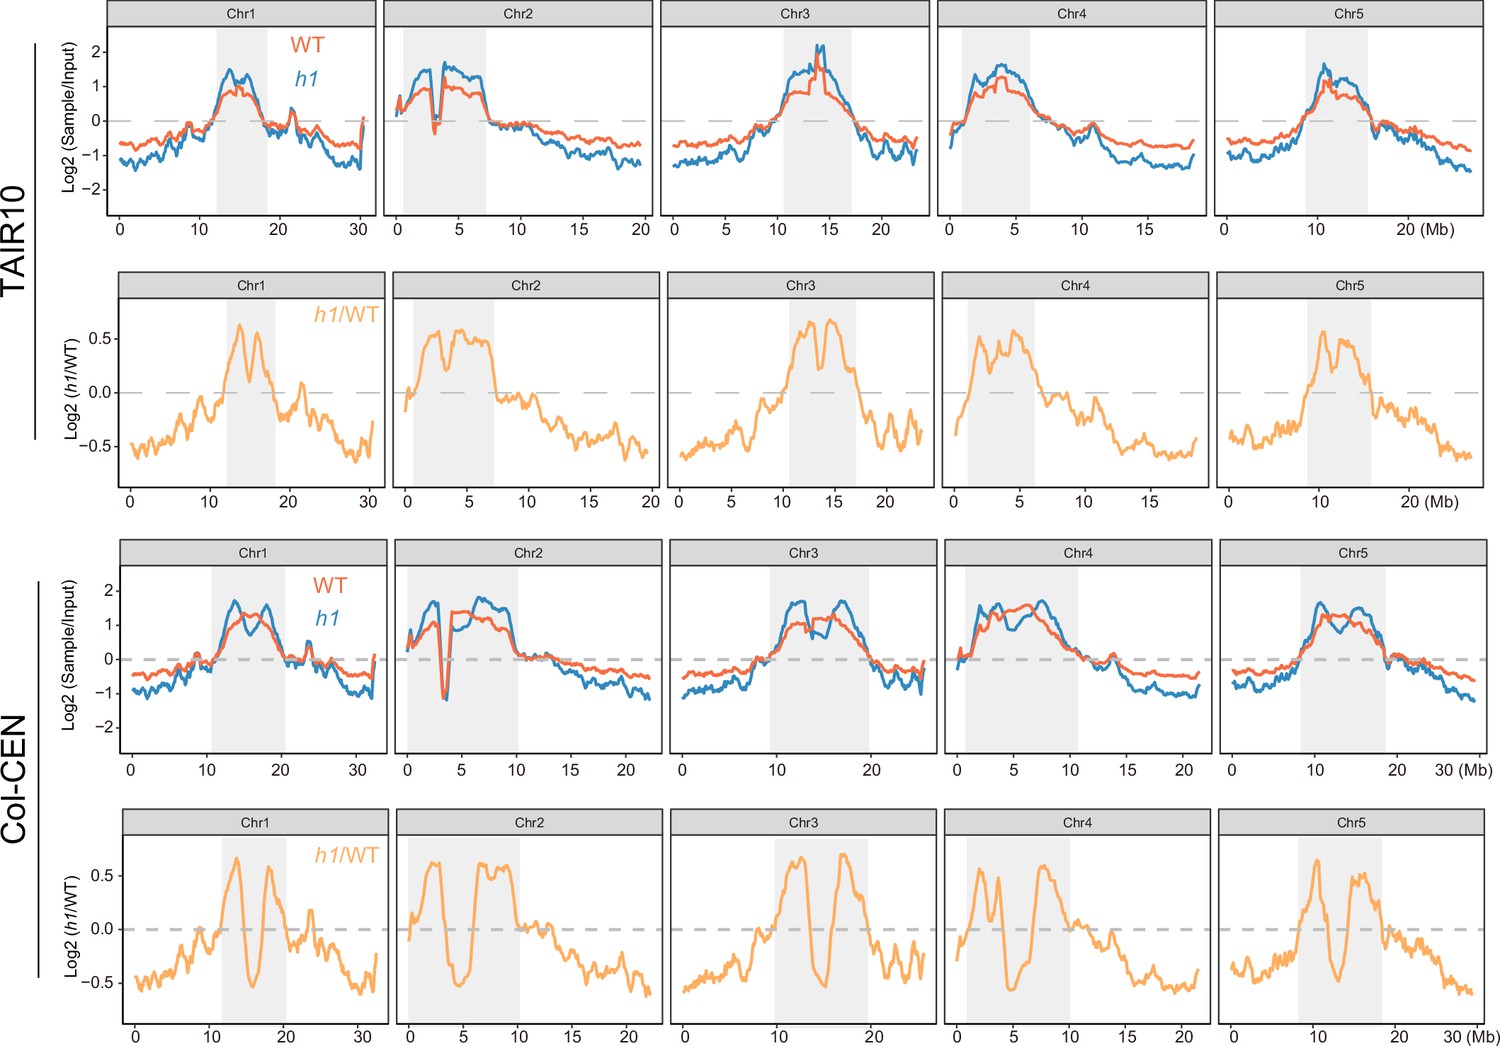
NRPE1 enrichment in wild-type (WT) vs h1 when mapped to either TAIR10 or Col-CEN genome assemblies (Naish et al., 2021).
Figure 2 with 2 supplements
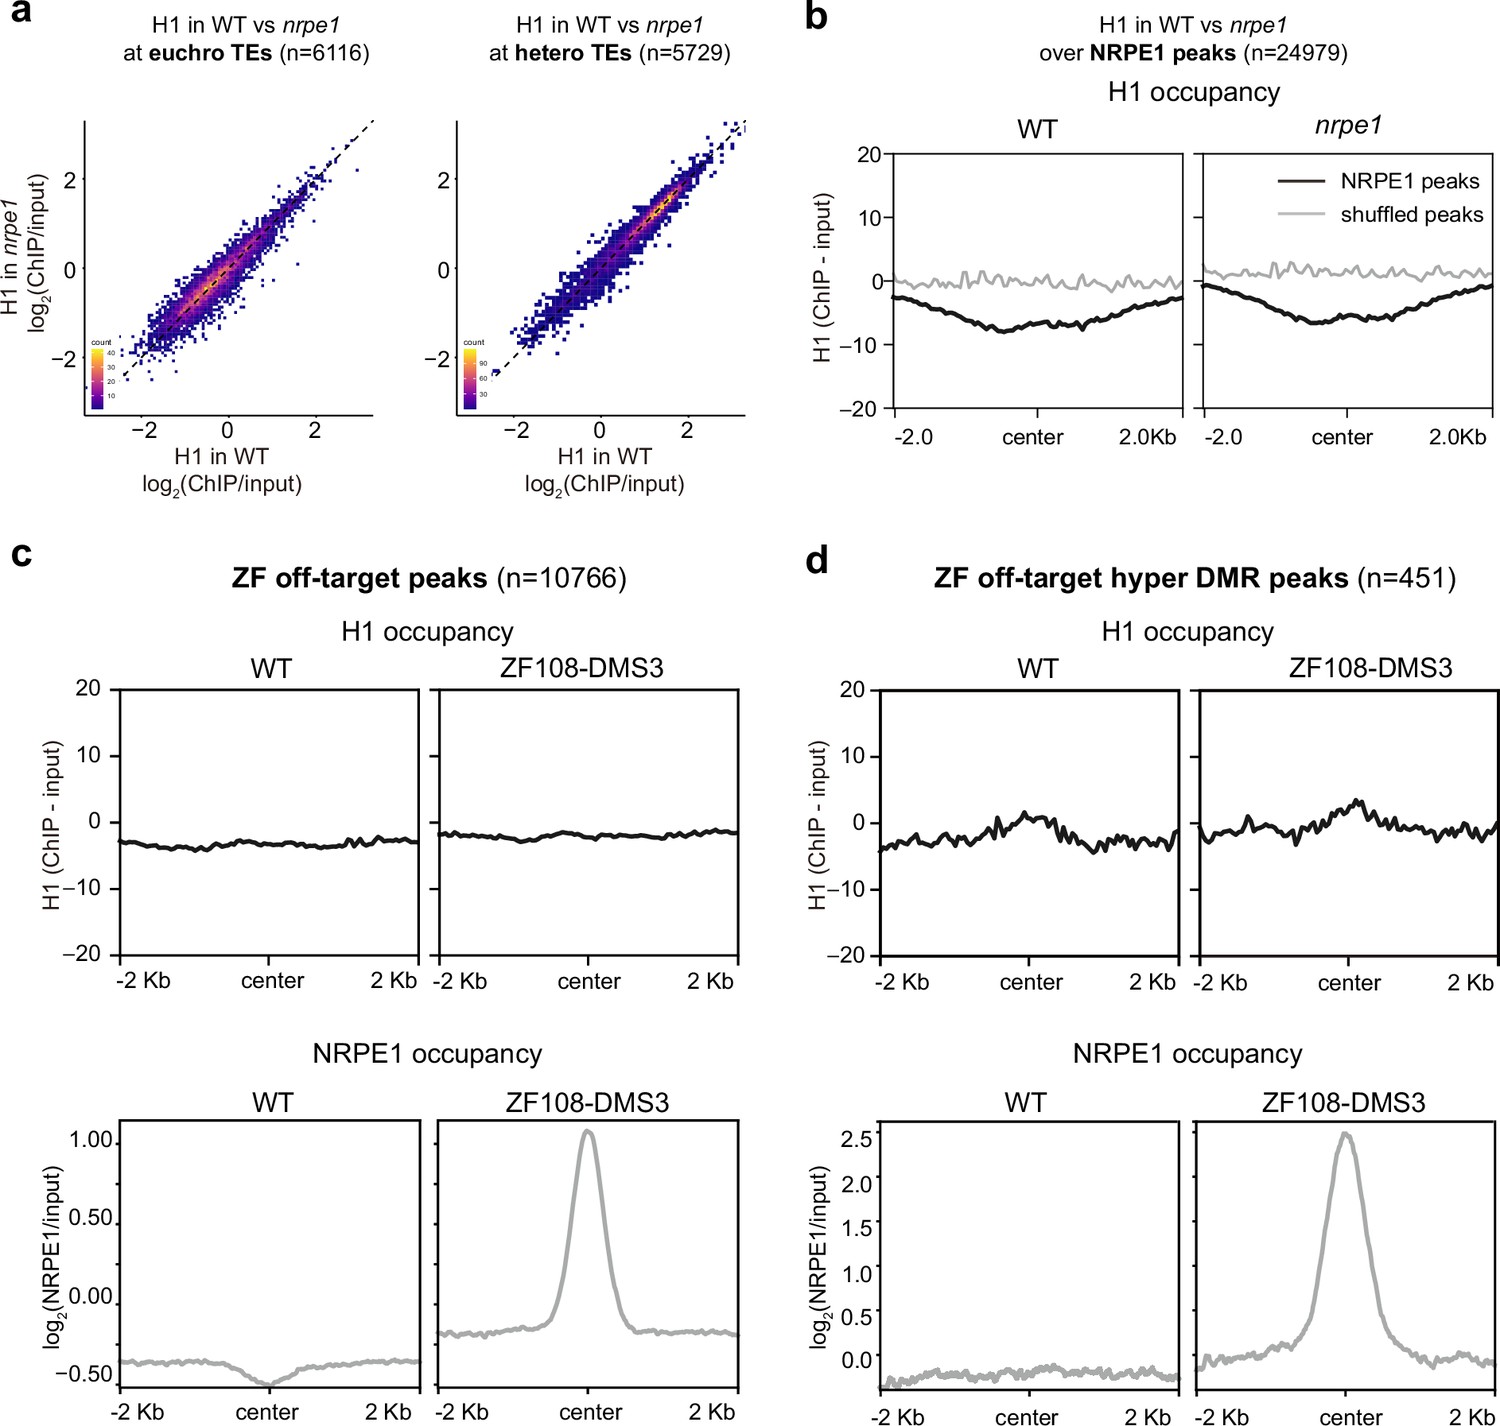
RNA-directed DNA methylation (RdDM) does not reciprocally affect H1 localization.
(A) Scatter plot showing H1 enrichment in wild-type (WT) vs. nrpe1 at euchromatic vs heterochromatic transposable elements (TEs). (B) Metaplot showing H1 enrichment at NRPE1 peaks in WT vs. nrpe1 (C) H1 and NRPE1 occupancy at ZF-DMS3 off target peaks. Upper panel: H1 occupancy in WT vs. ZF108-DMS3. Lower panel: NRPE1 occupancy in WT vs. ZF108-DMS3. Chromatin from the same sample was used for both H1 and NRPE1 ChIP-seq data, so the lower panel serves as a control showing that ZF108-DMS3 is recruited to these off-target regions in these samples, despite H1 localization remaining unchanged. (D) Same as (C) at the subset of regions where CHH methylation is gained in ZF108-DMS3 (Gallego-Bartolomé et al., 2019), indicating that the fully functioning RdDM pathway is recruited to these regions.
Figure 2—figure supplement 1
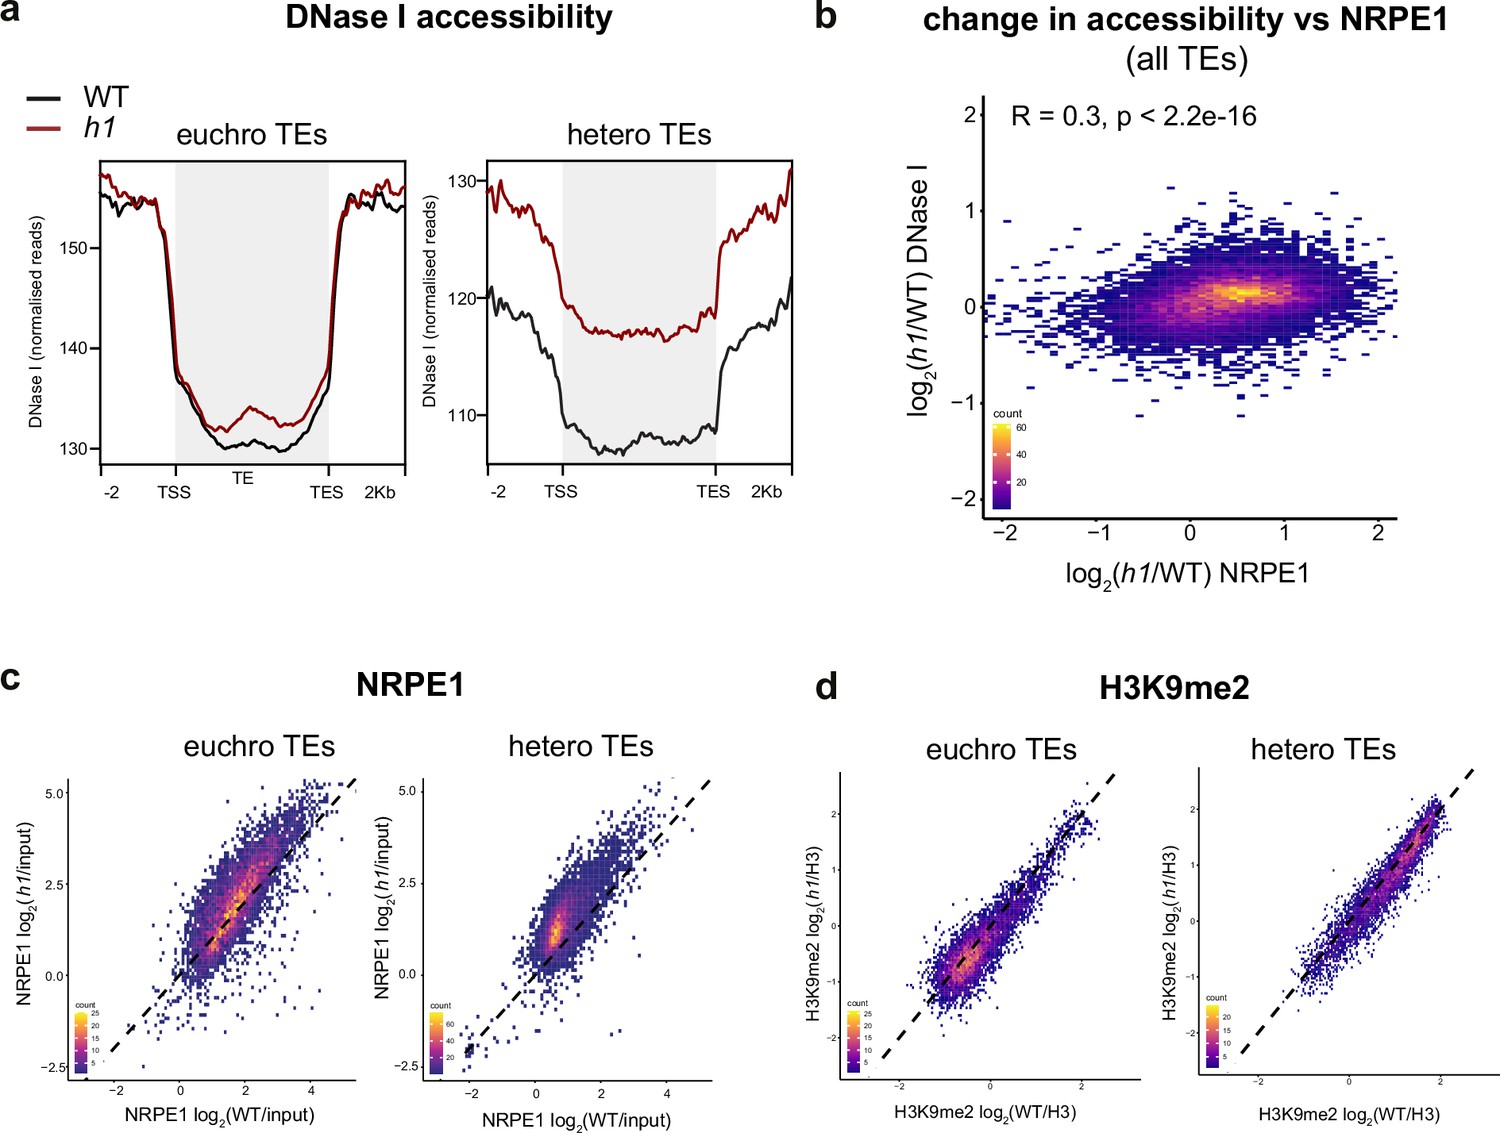
Loss of H1 results in increased heterochromatic accessibility and NRPE1 redistribution.
(A) Metaplot of DNase I accessibility in wild-typee (WT) vs h1 over euchromatic vs heterochromatic transposable elements (TEs). Data is obtained from Choi et al., 2020. (B) Scatterplot showing correlation between change in accessibility and NRPE1 occupancy in h1. R squared and p-value are indicated. (C) Scatterplot correlation comparing NRPE1 enrichment in WT vs h1 at euchromatic versus heterochromatic TEs. (D) Scatterplot correlation comparing H3K9me2 enrichment in WT vs h1 at euchromatic versus heterochromatic TEs.
Figure 2—figure supplement 2
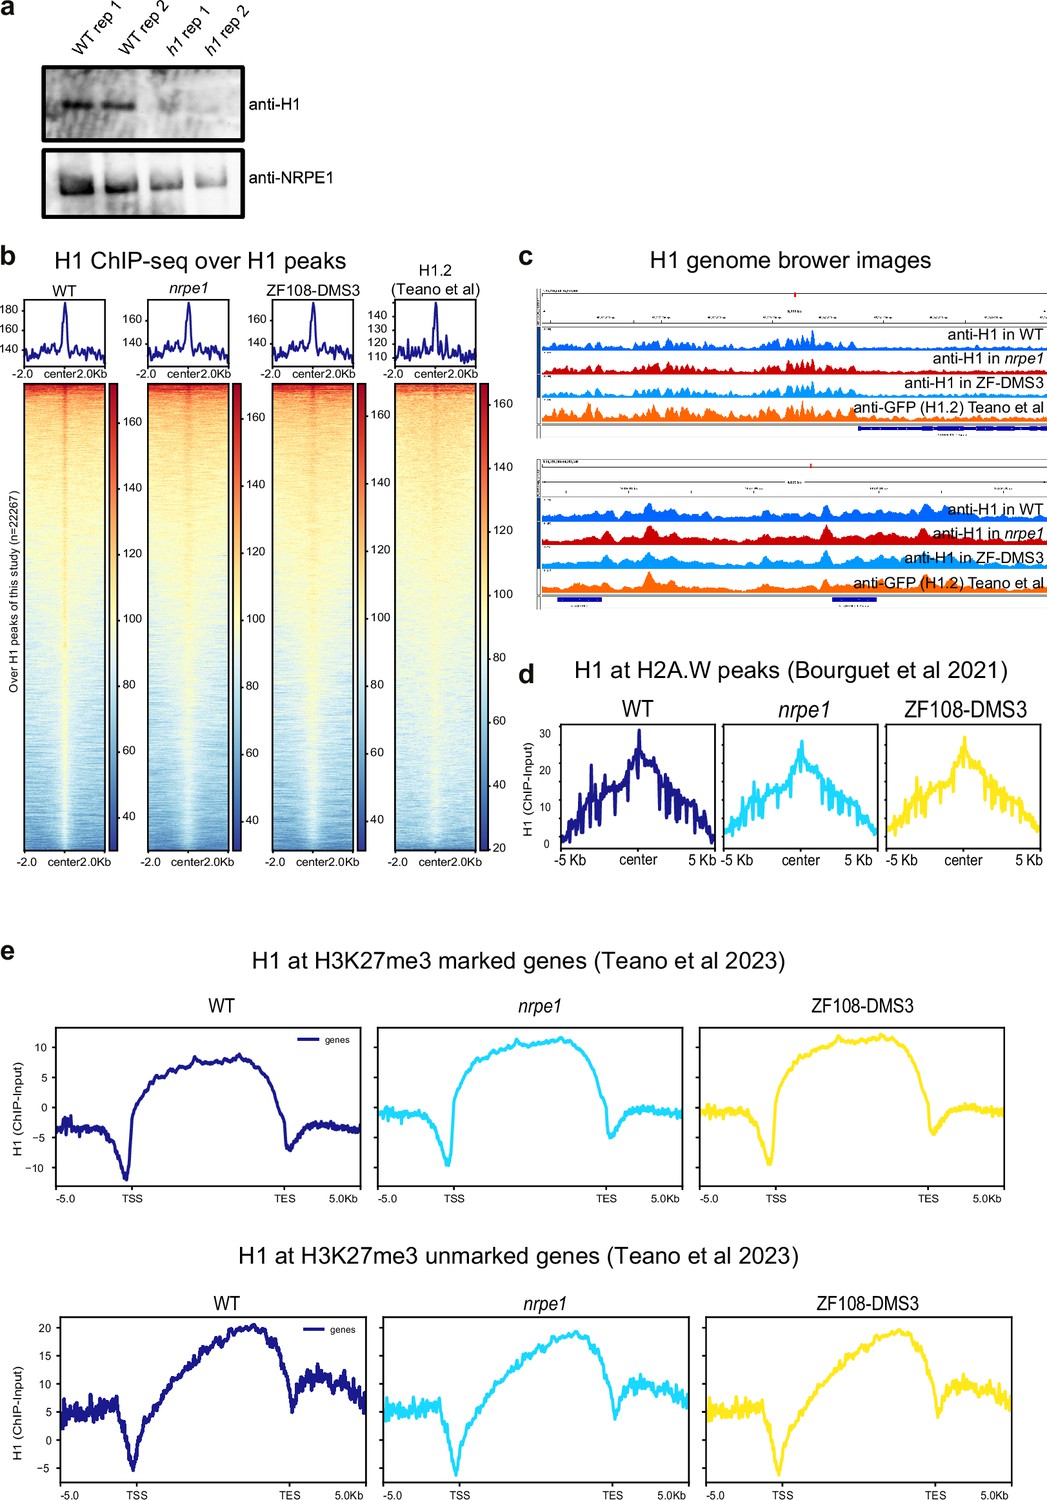
Benchmarking of H1 ChIP-seq.
(A) Western blot of H1 and NRPE1, using same antibodies as used for ChIPseq. H1 is only detectable in the wild-type (WT) samples, not h1 mutant. (B) H1 ChIP-seq metaplots with over WT H1 peaks with libraries indicated (C) Genome browser images of H1 ChIP-seq track (D) H1 enrichment over H2A.W peaks in euchromatic arms (as defined in Bourguet et al., 2021). (E) H1 enrichment patterns over H3K27me3 marked and unmarked genes (as defined in Teano et al., 2023).
Figure 3 with 2 supplements
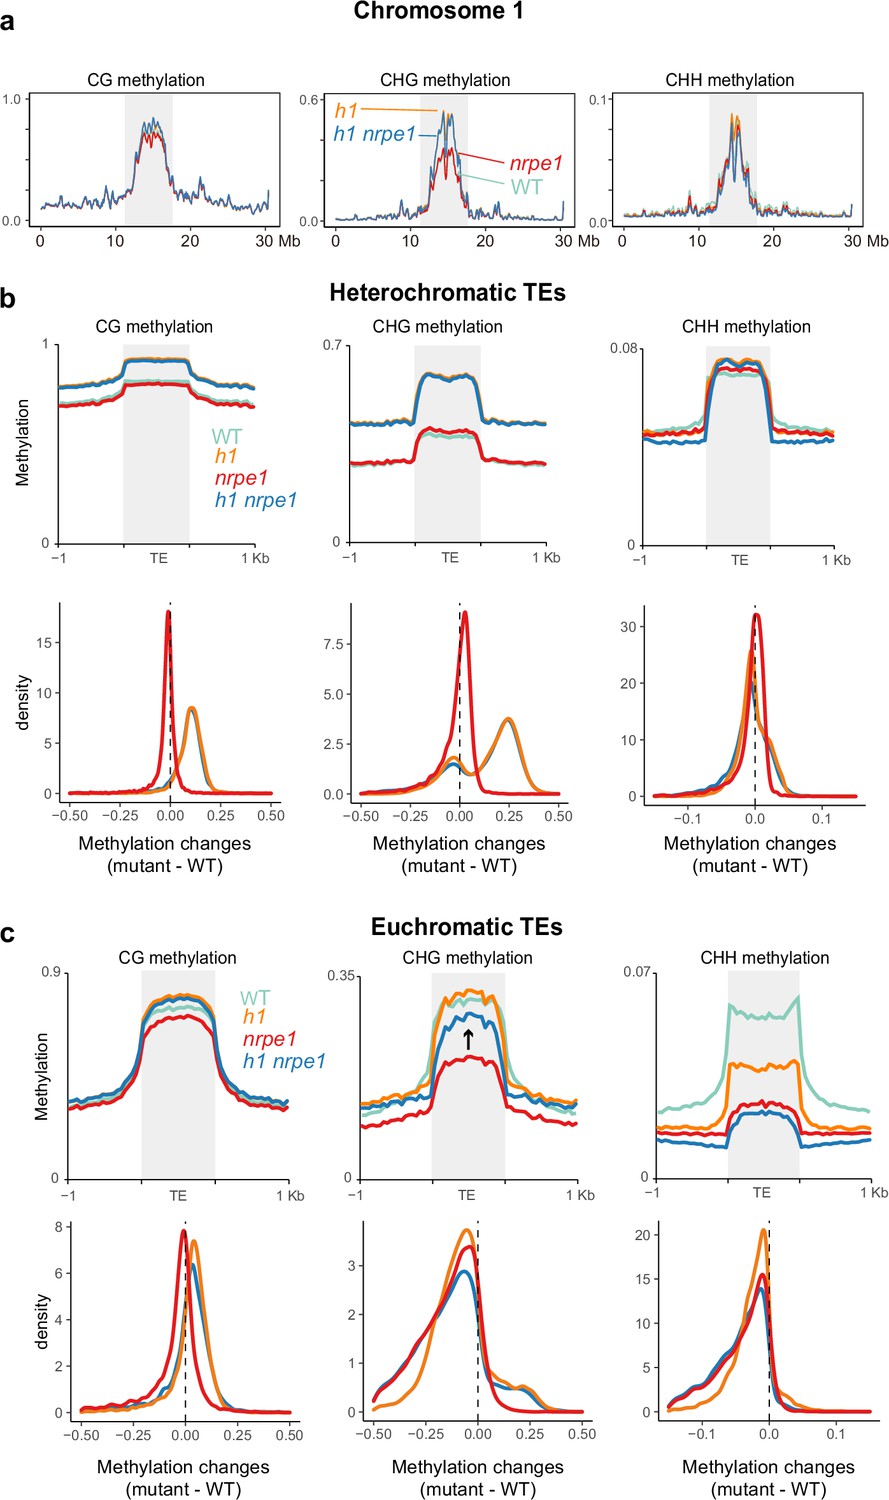
Major CG and CHG methylation gains in h1 are independent of RNA-directed DNA methylation (RdDM).
(A) Chromosomal view of DNA methylation levels (average of 10 kb windows) in the genotypes indicated on chromosome 1. Y-axis indicates fraction methylation (0–1). (B) Methylation level over heterochromatic transposable elements (TEs). Upper panel: methylation metaplots, Lower panel - kernel density plots. In the kernel density plots, the average methylation is calculated for each TE in both mutant and WT, then then the methylation difference is calculated. The plot shows the frequency density of TEs that gain/lose DNA methylation in the regions in the mutants indicated. (C) Methylation level over euchromatic TEs. Upper panel: metaplots, Lower panel - kernel density plots (as above). Arrow highlights the gain in CHG methylation in the h1/nrpe1 double mutant, as compared to nrpe1 alone.
Figure 3—figure supplement 1
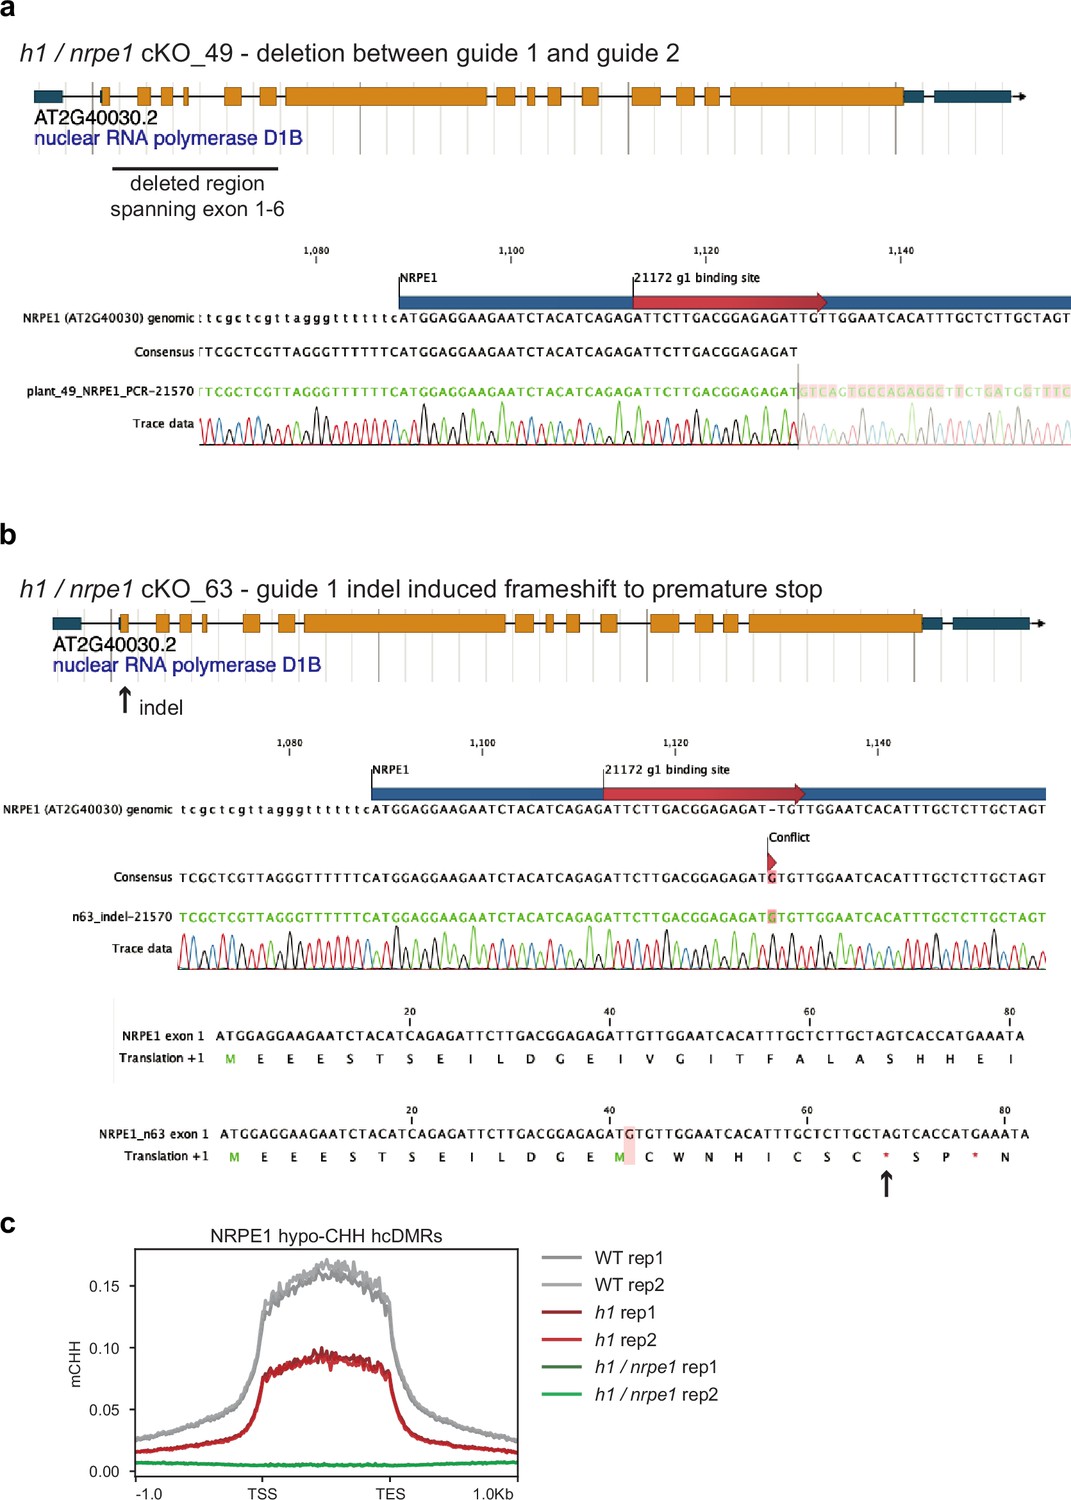
NRPE1 CRISPR knock outs.
(A) h1 /nrpe1 cKO_49 has a deletion spanning exons 1–6. (B) h1 /nrpe1 cKO_63 has an indel induced frameshift leading to a premature stop codon in exon 1. (C) Both knockouts display complete loss of CHH methylation at NRPE1 hypo CHH differentially methylated regions (DMRs).
Figure 3—figure supplement 2
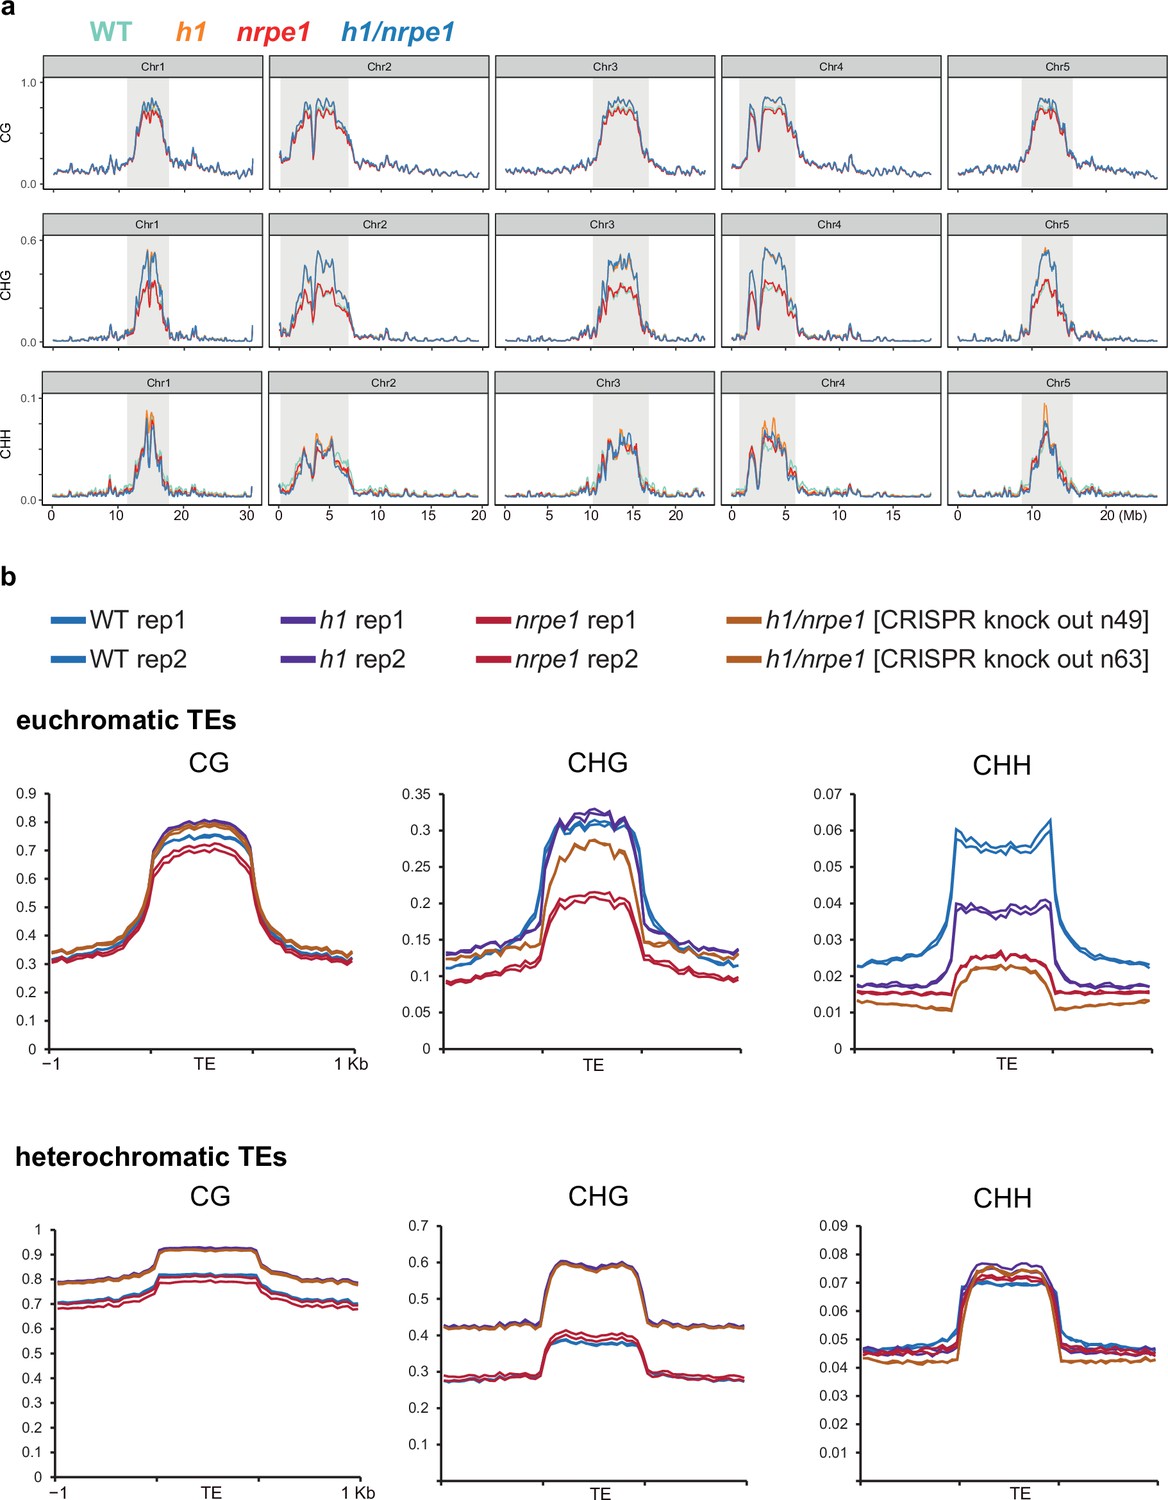
Whole genome DNA methylation analysis in h1 and nrpe1 mutants showing individual biological replicates.
(A) Whole genome view of DNA methylation levels (average of 10 kb windows) in the genotypes indicated (as in Figure 3, including all five chromosomes). Y-axis indicates fraction methylation (0–1). (B) Methylation metaplots over euchromatic (upper) or heterochromatic (lower) transposable elements (TEs) (as in Figure 3, with individual biological replicates plotted separately).
Figure 4 with 1 supplement
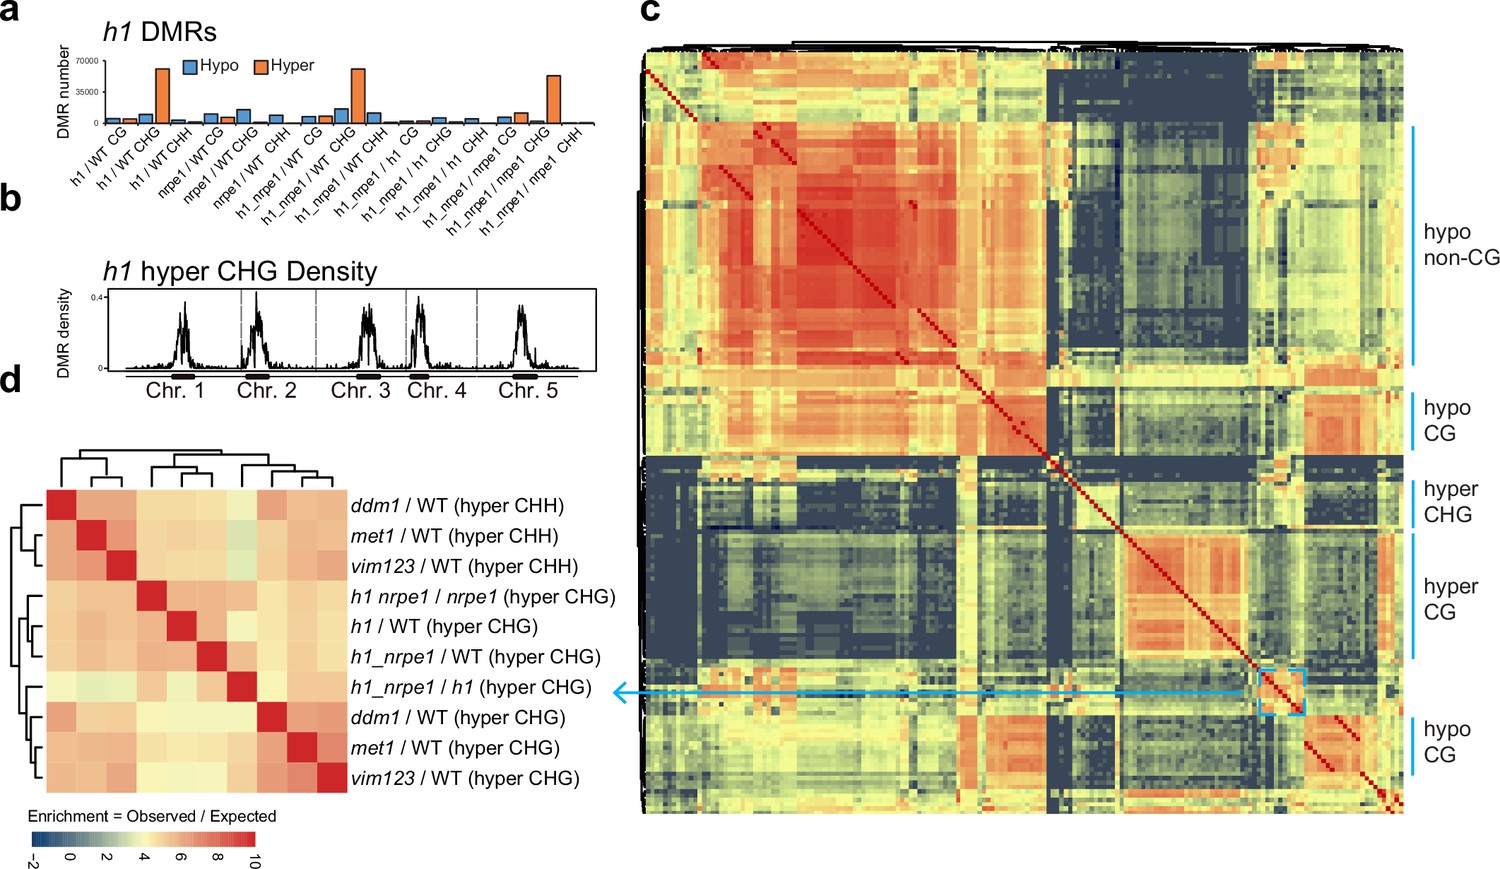
Overlap analysis of h1 hyper CHG differentially methylated regions (DMRs) with 96 methylation mutants.
(A) Number of hypo vs hyper DMRs in genotype comparisons indicated. (B) h1 hyper CHG DMR frequency density plot over Chromosomes 1–5. (C) Similarity matrix based on pairwise overlapping scores (Co-Occurrence Statistics) of DMRs from 96 whole methylomes. The labels on the right summarise the major functional categories of the methylation mutant genotypes in the cluster block. (individual genotypes are shown in Figure 4—figure supplement 1). The color scale represents the number of observed DMR overlaps between the pairwise comparison indicated over the number of overlaps expected by chance (DMRs randomly distributed throughout the genome). Red means highly enriched overlapping DMRs (similar genomic distribution), blue means highly non-overlapping (different genomic distribution) (D) Zoomed in view of the cluster containing h1 hyper CHG DMRs (C) (see blue box and arrow).
Figure 4—figure supplement 1
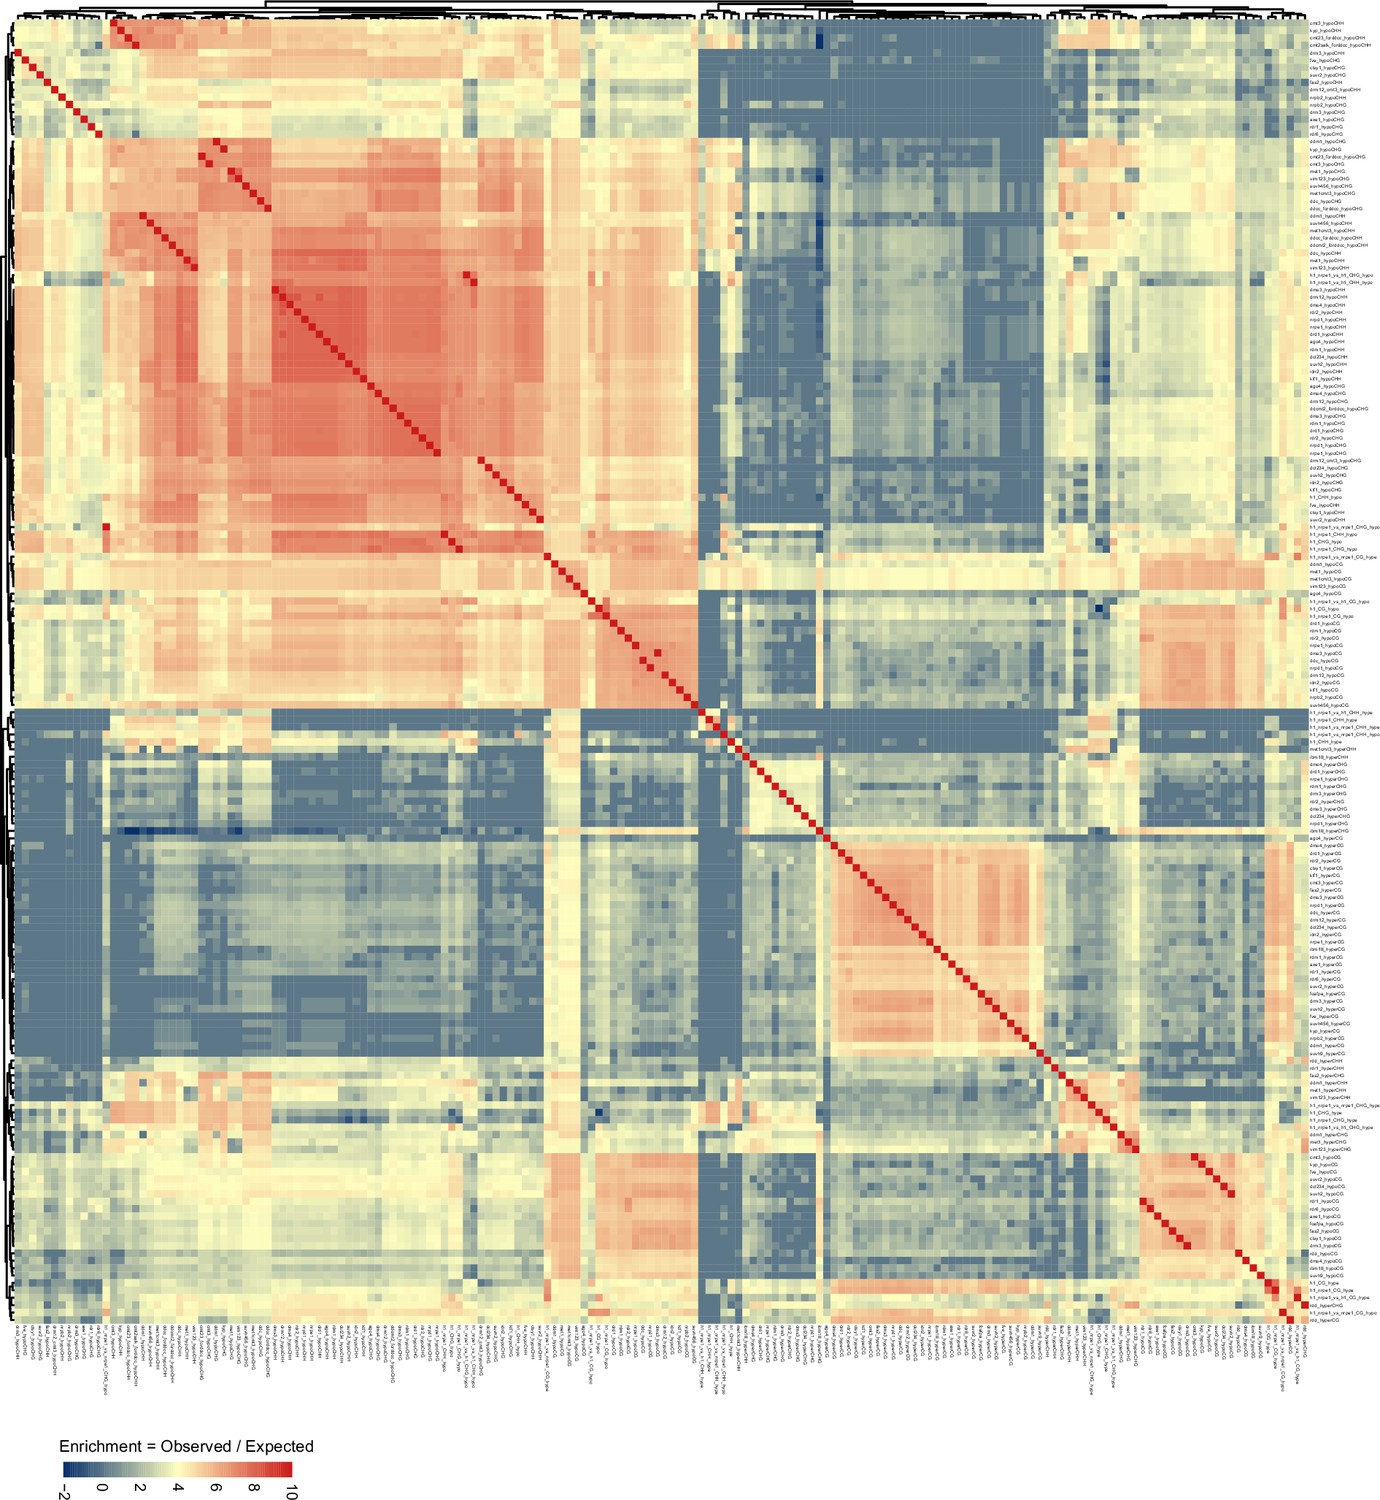
96 mutant genotype comparison, as shown in Figure 4, with differentially methylated region (DMR) genotype comparison labels shown for visual inspection.
Figure 5 with 2 supplements
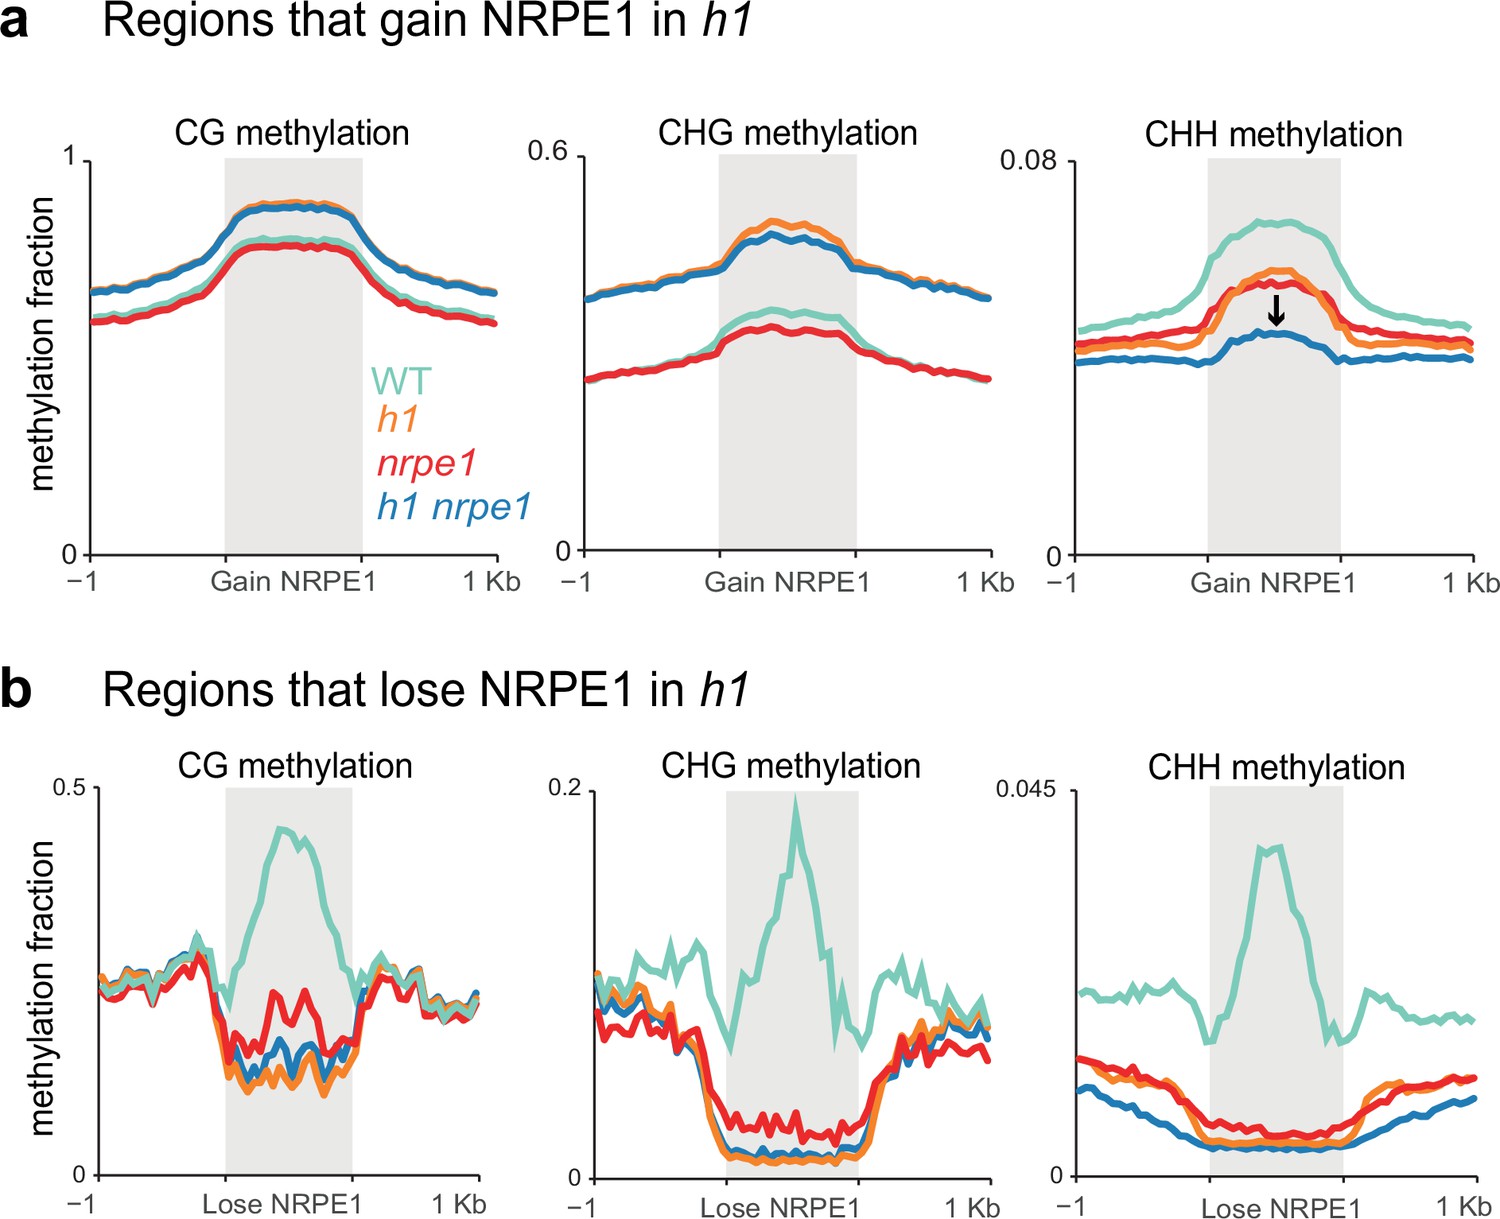
Patterns of NRPE1 re-localization in h1 show corresponding methylation changes.
(A) Methylation metaplot in the genotypes indicated over regions of the genome that gain NRPE1 in h1. Arrow highlights the change in average CHH methylation in the h1/nrpe1 double mutant as compared to the single mutants. (B) Methylation metaplot of the genotypes indicated over regions of the genome that lose NRPE1 in h1.
Figure 5—figure supplement 1
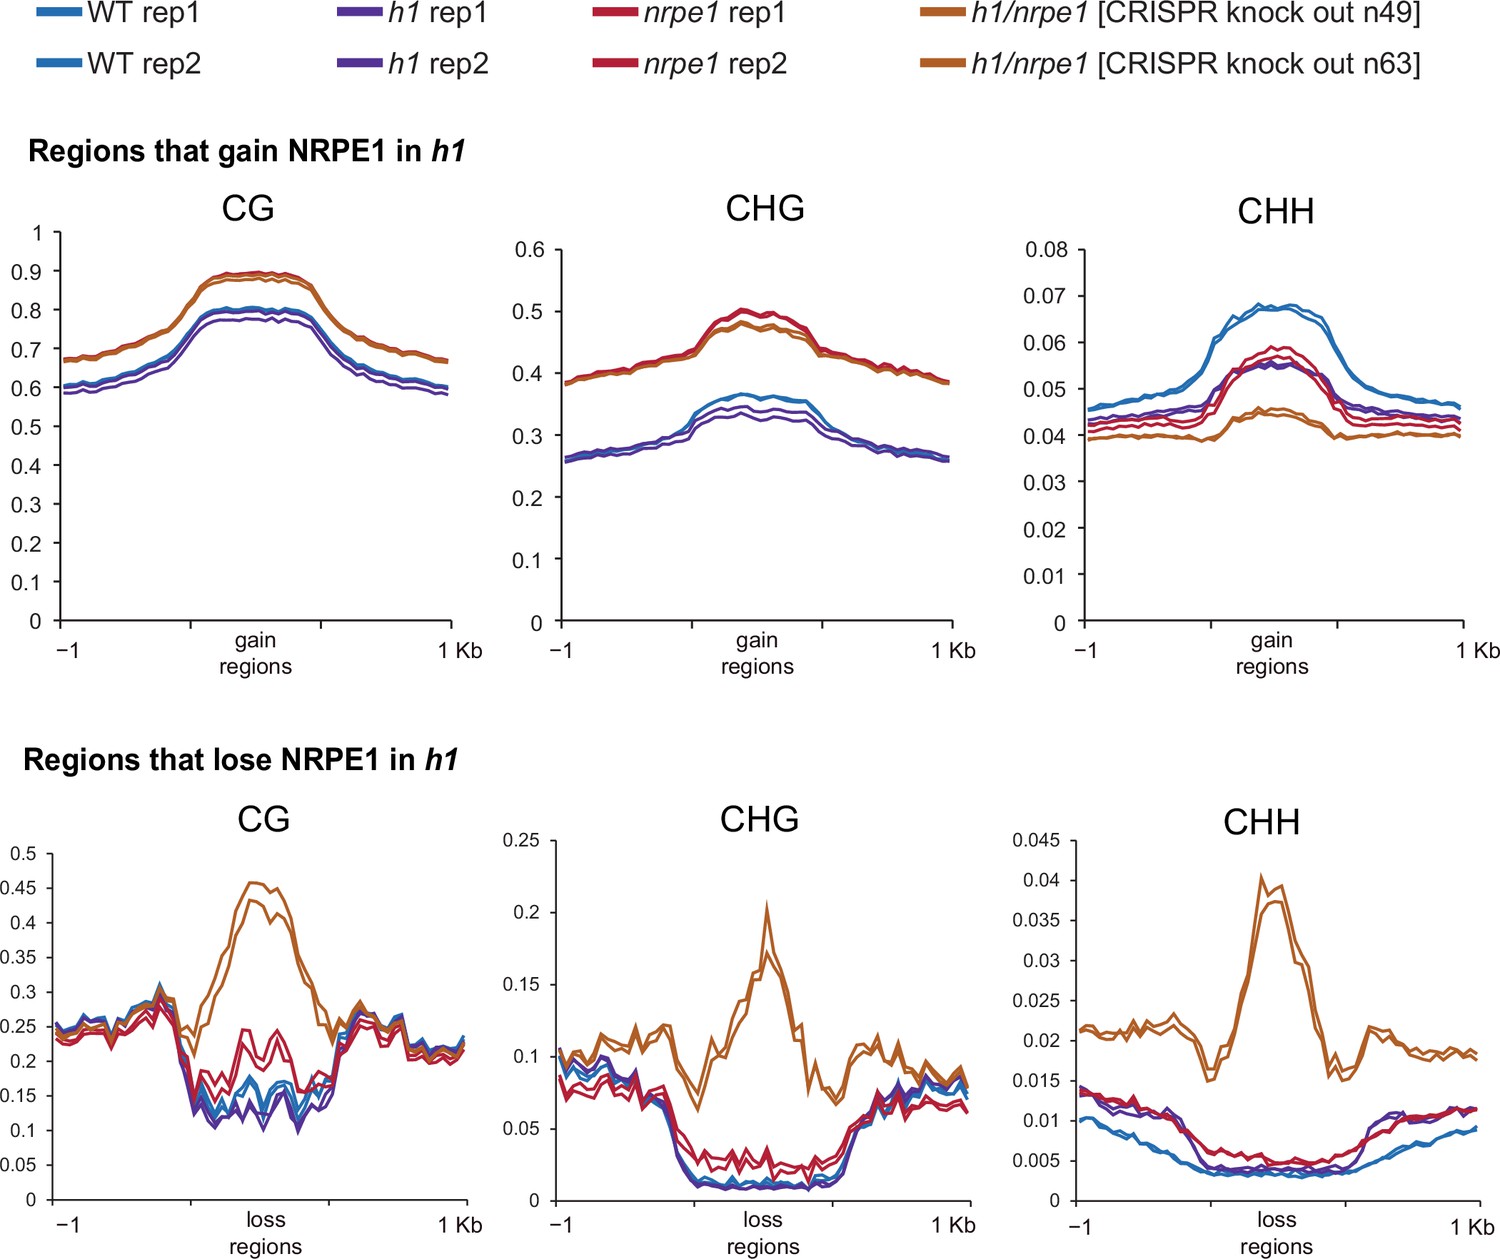
Same data as shown in Figure 5, with individual biological replicates plotted separately.
Figure 5—figure supplement 2
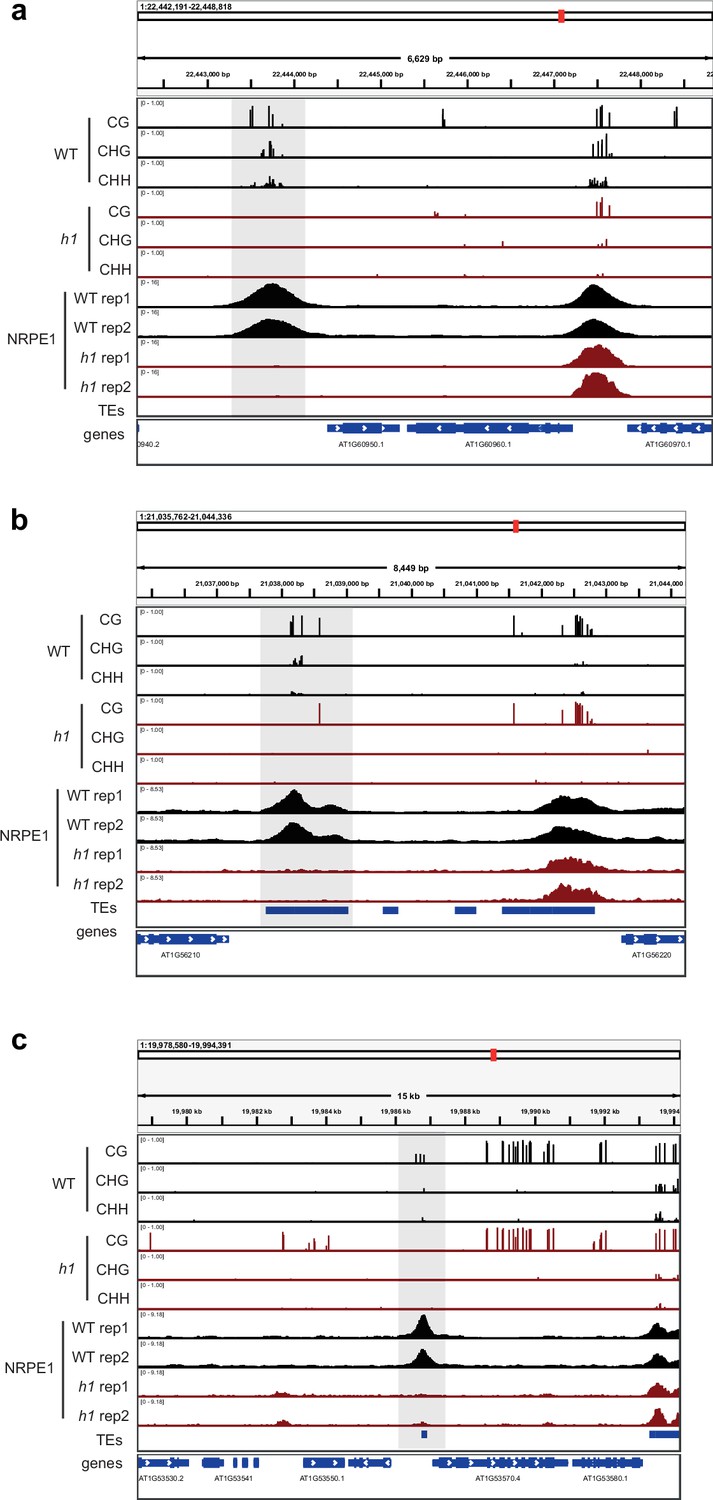
Genome browser images of representative regions that lose both NRPE1 occupancy and DNA methylation in h1.
Regions are highlighted in gray.
Figure 6
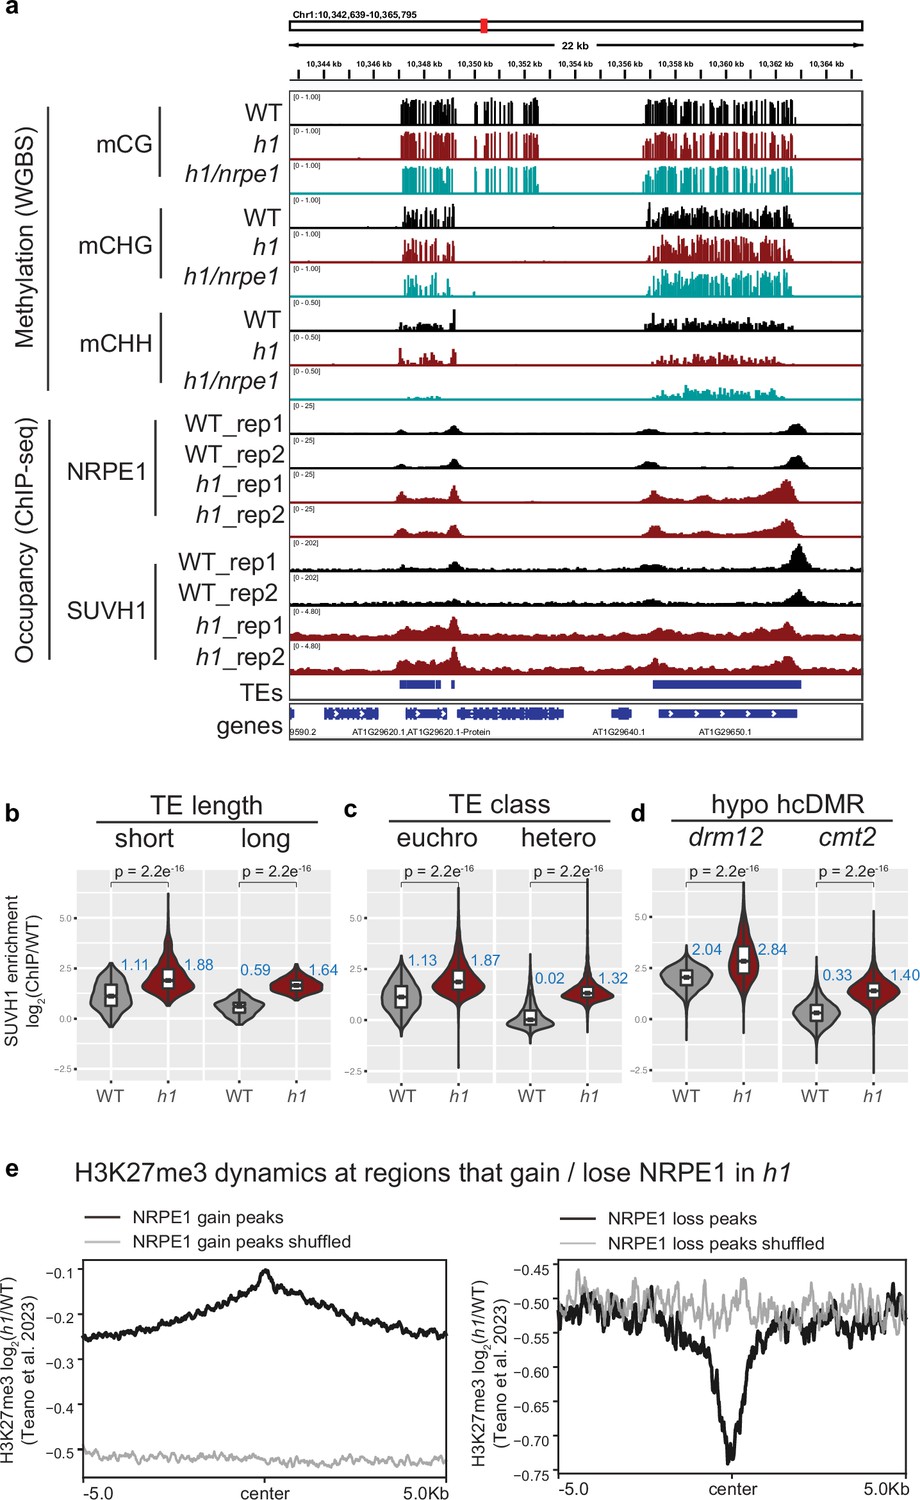
SUVH1 and H3K27me3 encroaches heterochromatin in an h1 mutant background.
(A) Genome browser image showing SUVH1 re-localization in h1 mirrors that of NRPE1. (B–D) Boxplot inlaid violin plots (boxplot medians shown in blue) showing SUVH1 enrichment in wild-type (WT) vs h1 at short vs long transposable elements (TEs) (B), at euchromatic vs heterochromatic TEs (C) and at drm12 vs cmt2 hypo CHH differentially methylated regions (DMRs) (D). Wilcoxon rank sum test p-values indicated. (E) Metaplot of H3K27me3 dynamics in h1 over regions that gain or lose NRPE1 in h1.
Additional files
-
Supplementary file 1
Differential expression analysis of RNA-seq data (from Choi et al., 2020 PMID:31732458) for genes involved in DNA methylation, comparing wild-type (WT) to h1 mutant genotypes.
- https://cdn.elifesciences.org/articles/89353/elife-89353-supp1-v2.xlsx
-
Supplementary file 2
Table showing bisulfite sequencing conversion efficiency estimation for the WGBS libraries generated and analysed in this paper.
- https://cdn.elifesciences.org/articles/89353/elife-89353-supp2-v2.xlsx
-
Supplementary file 3
List of .bed files used for analysis in this paper.
- https://cdn.elifesciences.org/articles/89353/elife-89353-supp3-v2.xlsx
-
MDAR checklist
- https://cdn.elifesciences.org/articles/89353/elife-89353-mdarchecklist1-v2.docx
Download links
A two-part list of links to download the article, or parts of the article, in various formats.
Downloads (link to download the article as PDF)
Open citations (links to open the citations from this article in various online reference manager services)
Cite this article (links to download the citations from this article in formats compatible with various reference manager tools)
H1 restricts euchromatin-associated methylation pathways from heterochromatic encroachment
eLife 12:RP89353.
https://doi.org/10.7554/eLife.89353.3


