The impact of surgery and oncological treatment on risk of type 2 diabetes onset in patients with colorectal cancer: nationwide cohort study in Denmark
- Department of Endocrinology, Copenhagen University Hospital Hvidovre, Denmark
- Department of Medicine, Faculty of Health and Medical Sciences, University of Copenhagen, Denmark
- Department of Surgical Gastroenterology, Copenhagen University Hospital Hvidovre, Denmark
- Steno Diabetes Center Aarhus, Aarhus University Hospital, Denmark
- Centre for Physical Activity Research, Copenhagen University Hospital - Rigshospitalet, Denmark
- Department of Sports Science and Clinical Biomechanics, Faculty of Health Sciences, University of Southern Denmark, Denmark
- Digestive Disease Center, Bispebjerg Hospital, Denmark
- Novo Nordisk Foundation Center for Basic Metabolic Research and Department of Public Health, University of Copenhagen, Denmark
Figures
Figure 1
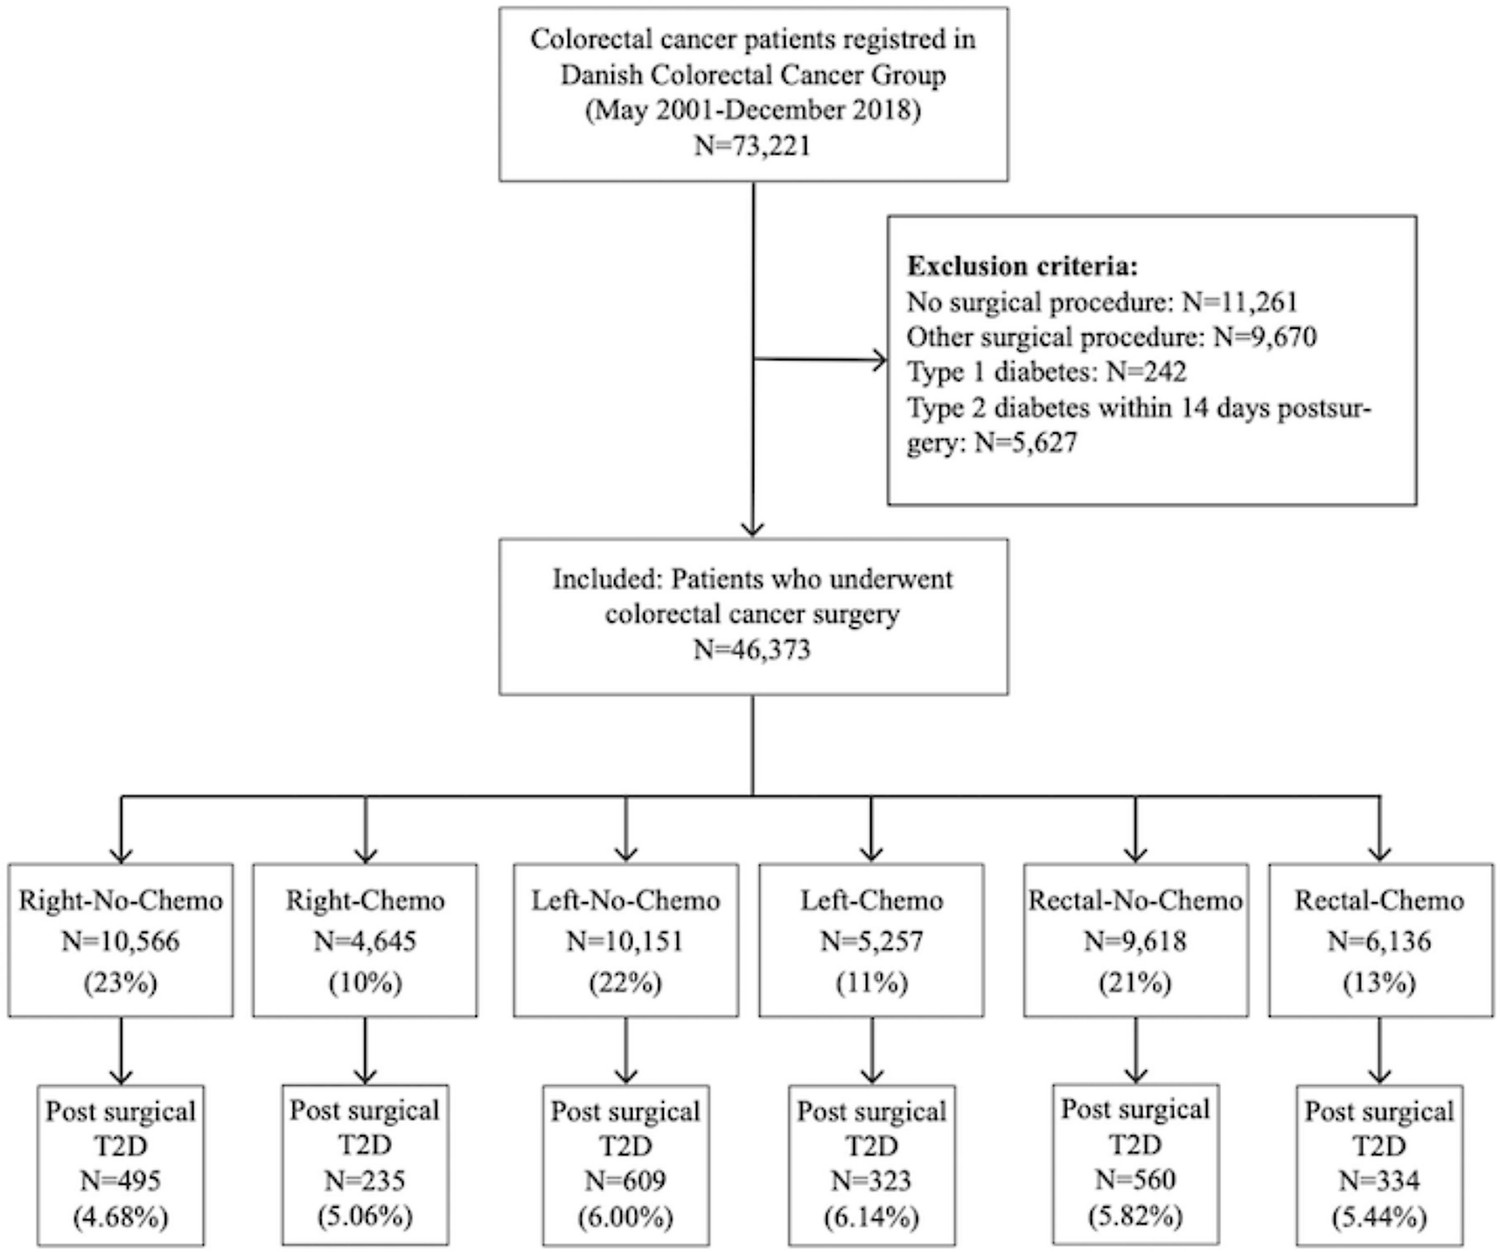
Flowchart of the study.
Figure 2
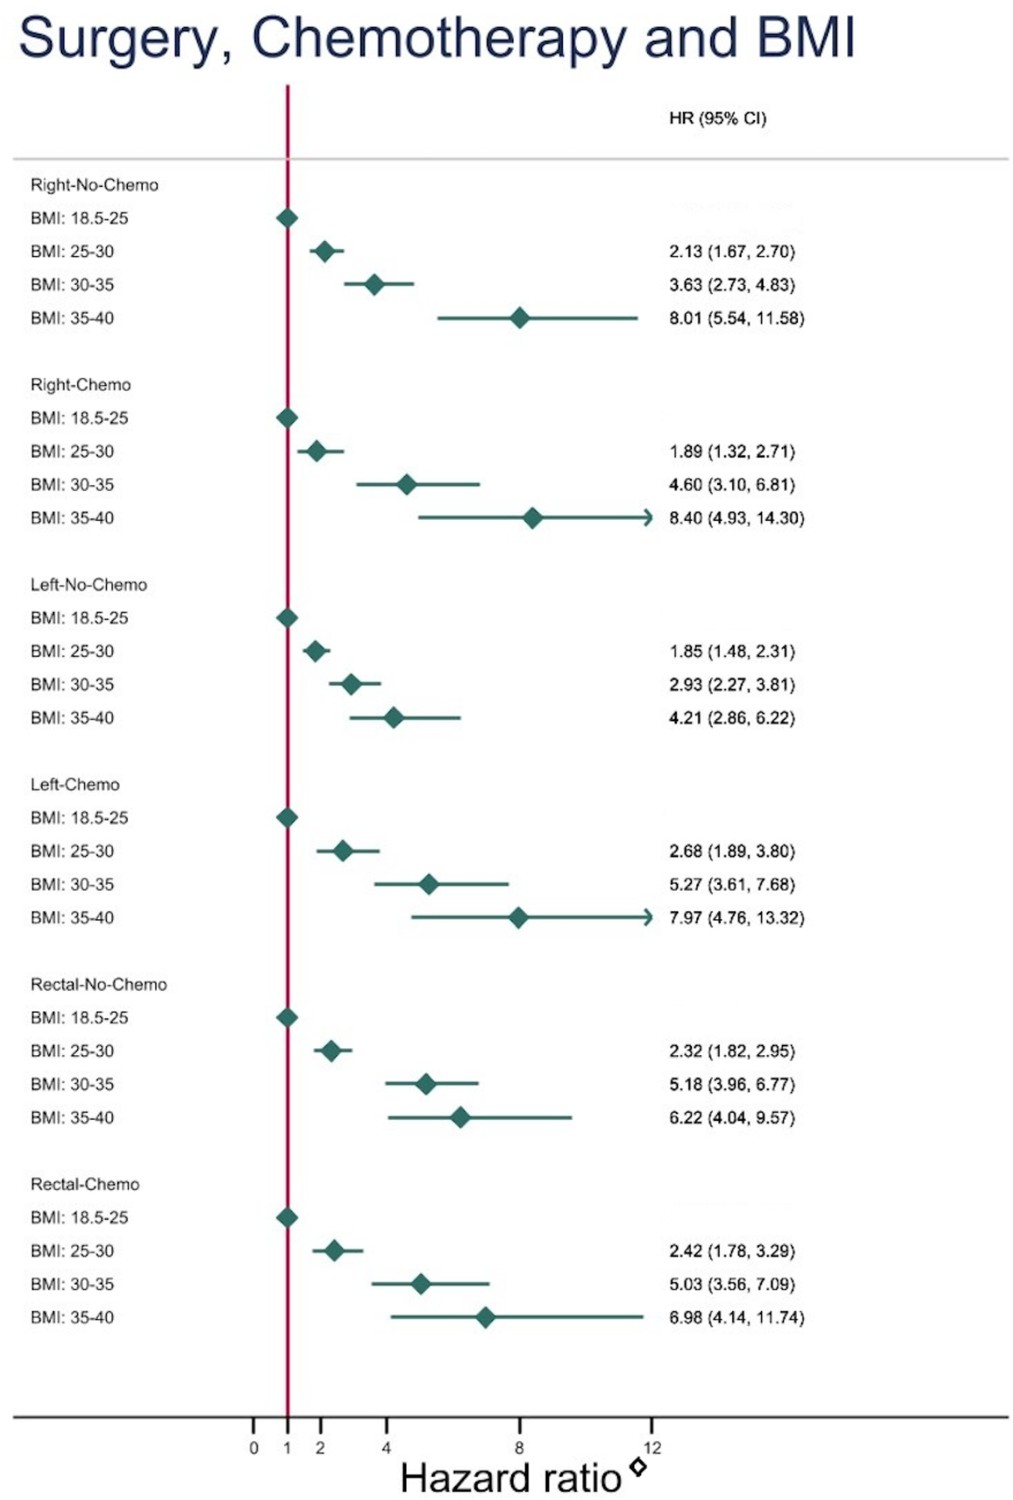
Risk of developing type 2 diabetes depending on body mass index (BMI) subgroups (using normal weight, BMI: 18.5–25 as reference) after different types of colorectal cancer surgery with and without chemotherapy.
Tables
Table 1
Baseline characteristics.
| Right-sided resection (Right)(N=15,211) | Left-sided resection (Left)(N=15,408) | Rectum resection (Rectal)(N=15,754) | ||||
|---|---|---|---|---|---|---|
| Right-No-Chemo | Right-Chemo | Left-No-Chemo | Left-Chemo | Rectal-No-Chemo | Rectal-Chemo | |
| All patients, n (%) | 10,566 (23%) | 4,645 (10%) | 10,151 (22%) | 5,257 (11%) | 9,618 (21%) | 6,136 (13%) |
| Sex, n (%) | ||||||
| Male | 4,338 (41%) | 2,126 (46%) | 5,450 (54%) | 2,834 (54%) | 5,743 (60%) | 3,745 (61%) |
| Female | 6,228 (59%) | 2,519 (54%) | 4,701 (46%) | 2,423 (46%) | 3,875 (40%) | 2,391 (39%) |
| Age, year, mean (SD) | 75.2 (10.0) | 66.9 (10.1) | 72.1 (10.7) | 64.8 (10.1) | 70.0 (10.7) | 64.3 (10.1) |
| BMI, mean (SD) | 25.0 (4.7) | 25.4 (4.7) | 25.7 (4.6) | 25.8 (4.5) | 25.6 (4.4) | 25.6 (4.4) |
| BMI subgroups | ||||||
| <18.5 | 482 (4.6%) | 114 (2.5%) | 287 (2.8%) | 97 (1.8%) | 225 (2.3%) | 143 (2.3%) |
| 18.5–24.9 | 4,183 (40%) | 1,907 (41%) | 3,638 (36%) | 2,004 (38%) | 3,693 (38%) | 2,570 (42%) |
| 25–29.9 | 2,671 (25%) | 1,347 (29%) | 2,945 (29%) | 1,641 (31%) | 3,021 (31%) | 1,993 (32%) |
| 30–34.9 | 814 (7.7%) | 404 (8.7%) | 961 (9%) | 545 (10%) | 889 (9.2%) | 611 (10%) |
| 35–39.9 | 194 (1.8%) | 90 (1.9%) | 214 (2.1%) | 135 (2.6%) | 171 (1.8%) | 132 (2.2%) |
| >40 | 62 (0.6%) | 34 (0.7%) | 69 (0.7%) | 39 (0.7%) | 60 (0.6%) | 30 (0.5%) |
| Missing | 2,160 (20%) | 749 (16%) | 2,037 (20%) | 796 (15%) | 1,559 (16%) | 657 (11%) |
| Smoking, n (%) | ||||||
| Never | 3,132 (30%) | 1,533 (33%) | 3,030 (30%) | 1,804 (34%) | 2,828 (29%) | 2,014 (33%) |
| Current | 1,671 (16%) | 791 (17%) | 1,486 (15%) | 821 (16%) | 1,679 (17%) | 1,305 (21%) |
| Former | 3,376 (32%) | 1,465 (32%) | 3,415 (34%) | 1,700 (32%) | 3,421 (36%) | 2,021 (33%) |
| Missing | 2,387 (22%) | 856 (18%) | 2,220 (21%) | 932 (18%) | 1,690 (18%) | 796 (13%) |
| Alcohol*, n (%) | ||||||
| 1–14 | 4,819 (46%) | 2,342 (51%) | 4,803 (47%) | 2,771 (53%) | 4,886 (51%) | 3,399 (55%) |
| 14–21 | 478 (5%) | 254 (5%) | 618 (6%) | 333 (6%) | 711 (7%) | 494 (8%) |
| >21 | 433 (4%) | 256 (6%) | 593 (6%) | 323 (6%) | 671 (7%) | 412 (7%) |
| None | 2,269 (21%) | 889 (19%) | 1,722 (17%) | 872 (17%) | 1,446 (15%) | 1,006 (16%) |
| Missing | 2,567 (24%) | 895 (19%) | 2,415 (24%) | 958 (18%) | 1,904 (20%) | 825 (13%) |
| ASA score†, n (%) | ||||||
| Healthy (=I) | 1,633 (15%) | 1,331 (29%) | 2,185 (22%) | 1,735 (33%) | 2,541 (26%) | 2,082 (34%) |
| Mild (=II) | 5,457 (52%) | 2,596 (56%) | 5,299 (51%) | 2,857 (54%) | 5,265 (55%) | 3,415 (56%) |
| Sick (=>II) | 3,160 (30%) | 613 (13%) | 2,442 (24%) | 548 (11%) | 1,653 (17%) | 557 (9%) |
| Missing | 316 (3%) | 105 (2%) | 295 (3%) | 117 (2%) | 159 (2%) | 82 (1%) |
| Screening detected tumor, n (%) | 770 (7%) | 299 (6%) | 1,077 (11%) | 457 (9%) | 664 (7%) | 394 (6%) |
| UICC stage‡, n (%) | ||||||
| I/II | 7,002 (66%) | 674 (15%) | 7,339 (72%) | 745 (14%) | 5,940 (62%) | 420 (7%) |
| III/IV | 3,330 (32%) | 3,504 (75%) | 2,506 (25%) | 3,989 (76%) | 2,246 (23%) | 2,471 (40%) |
| Unknown | 234 (2%) | 467 (10%) | 306 (3%) | 523 (10%) | 1,432 (15%) | 3,245 (53%) |
| Radiation, n (%) | - | - | - | - | 1,157 (12%) | 2,983 (49%) |
-
Chemo: chemotherapy.
-
*
Alcohol items per week.
-
†
The American Society of Anesthesiologist score: I: healthy, but with CRC; III: mild systemic disease without substantial functional limitations; >II: severe systemic disease, includes ASA stages III, IV, V, VI.
-
‡
UICC stage, Union of International Cancer Control; stage I: T1 or T2; stage II: T3 or T4; stage III: N1 or N2; stage IV: Disseminated disease at time of diagnosis.
Table 2
Absolute incidence rates of type 2 diabetes (T2D) per 1000 person-years (95% CI) among colorectal cancer patients treated with different types of colorectal cancer surgery with and without chemotherapy.
| Right-sided resection (Right)(N=15,211) | Left-sided resection (Left)(N=15,408) | Rectum resection (Rectal)(N=15,754) | ||||
|---|---|---|---|---|---|---|
| Right-No-Chemo | Right-Chemo | Left-No-Chemo | Left-Chemo | Rectal-No-Chemo | Rectal-Chemo | |
| All patients, n | 10,566 | 4,645 | 10,151 | 5,257 | 9,618 | 6,136 |
| T2D development | ||||||
| Numbers | 495 | 235 | 609 | 323 | 560 | 334 |
| Mean time, year (SD) | 4.1 (3.4) | 4.1 (3.6) | 4.1 (3.5) | 4.4 (3.6) | 4.7 (3.7) | 4.3 (3.5) |
| Person-years | 48,039 | 22,317 | 53,935 | 29,301 | 58,448 | 33,422 |
| Incidence rates | 10.3 (9.4–11.2) | 10.5 (9.3–12.0) | 11.3 (10.4–12.2) | 11.0 (9.9–12.3) | 9.6 (8.8–10.4) | 10.0 (9.0–11.1) |
| Sex | ||||||
| Male | 13 (11–15) | 14 (12–16) | 14 (12–15) | 14 (12–16) | 11 (10–12) | 12 (11–14) |
| Female | 9 (8-10) | 8 (7-10) | 9 (8-10) | 8 (7-10) | 8 (7-9) | 7 (6-8) |
| Age | ||||||
| <50 | 3 (1-8) | 6 (3-11) | 7 (5-12) | 8 (5-12) | 5 (3-8) | 6 (4-10) |
| 50–64.9 | 12 (10–14) | 13 (11–16) | 11 (9–12) | 10 (8–12) | 10 (8–12) | 10 (9–12) |
| 65–74.9 | 12 (11–14) | 11 (9–14) | 12 (11–14) | 14 (12–17) | 14 (12–17) | 11 (10–13) |
| ≥75 | 9 (8-10) | 6 (4-9) | 11 (10–13) | 8 (6-12) | 8 (6-12) | 8 (5-11) |
| BMI subgroups | ||||||
| 18.5–24.9 | 6 (5-7) | 5 (4-7) | 6 (5-8) | 4 (3-5) | 4 (4-5) | 4 (3-6) |
| 25–29.9 | 13 (11–16) | 11 (9–14) | 13 (11–15) | 12 (10–15) | 11 (9–12) | 12 (10–14) |
| 30–34.9 | 23 (18–28) | 30 (23–40) | 21 (17–25) | 24 (19–30) | 25 (21–30) | 24 (19–30) |
| 35–39.9 | 51 (38–70) | 53 (34–84) | 32 (23–45) | 34 (23–52) | 30 (21–44) | 31 (20–48) |
| Missing | 7 (6-9) | 9 (6-12) | 11 (9–12) | 12 (10–16) | 9 (8-12) | 10 (8–14) |
| Smoking | ||||||
| Never | 9 (8-11) | 11 (9–14) | 9 (8-11) | 8 (7-10) | 8 (7-10) | 9 (7-11) |
| Current | 13 (10–15) | 9 (7-13) | 11 (9–14) | 12 (10–16) | 10 (8–12) | 10 (7–12) |
| Former | 11 (10–13) | 12 (10–15) | 13 (11–15) | 13 (11–15) | 11 (9–12) | 11 (9–13) |
| Missing | 8 (7-10) | 9 (6-12) | 11 (10–14) | 12 (9–15) | 9 (8-11) | 11 (8–14) |
| Alcohol** | ||||||
| 1–14 | 11 (9–12) | 10 (8–12) | 10 (9–12) | 10 (9–12) | 9 (8-10) | 10 (8–11) |
| 14–21 | 9 (6-14) | 7 (3-14) | 9 (6-13) | 10 (7–16) | 8 (6-11) | 9 (6-14) |
| >21 | 10 (7–16) | 16 (11–25) | 14 (11–19) | 12 (8–18) | 11 (9–15) | 13 (9–18) |
| None | 12 (10–14) | 14 (10–18) | 13 (11–16) | 12 (9–16) | 13 (11–15) | 10 (7–13) |
| Missing | 9 (7-10) | 10 (7–13) | 12 (10–14) | 12 (10–16) | 10 (9–10) | 10 (8–13) |
| ASA score†† | ||||||
| Healthy (=I) | 7 (6-9) | 5 (3-7) | 7 (6-9) | 7 (5-9) | 5 (4-6) | 6 (4-7) |
| Mild (=II) | 10 (9–12) | 12 (11–15) | 12 (11–13) | 13 (11–15) | 11 (10–12) | 13 (11–14) |
| Sick (=>II) | 14 (12–17) | 17 (13–24) | 17 (12–17) | 18 (14–25) | 15 (12–18) | 12 (8–17) |
| Missing | 6 (3-11) | 15 (7–31) | 13 (8–20) | 11 (5–23) | 9 (5-17) | 10 (4–25) |
| Radiation | ||||||
| Yes | - | - | - | - | 11 (9–13) | 11 (9–13) |
| No | - | - | - | - | 9 (9-10) | 10 (9–12) |
-
Chemo: chemotherapy.
-
*
Alcohol items per week.
-
†
The American Society of Anesthesiologist score: I: healthy, but with CRC; III: mild systemic disease without substantial functional limitations; >II: severe systemic disease, includes ASA stages III, IV, V, VI.
Table 3
Risk of developing type 2 diabetes after different types of colorectal cancer surgery with and without oncological treatment, unadjusted and adjusted analysis.
| Unadjusted | Model 1 | Model 2(a/b) | ||||
|---|---|---|---|---|---|---|
| HR (95% CI) | p-Value | HR (95% CI) | p-Value | HR (95% CI) | p-Value | |
| Surgery and chemotherapy | ||||||
| Right-No-Chemo | ref | |||||
| Right-Chemo | 1.02 (0.87;1.19) | 0.799 | 0.99 (0.83;1.17) | 0.880 | 1.01 (0.85;1.20)a | 0.884 |
| Left-No-Chemo | 1.10 (0.98;1.24) | 0.112 | 0.92 (0.81;1.05) | 0.228 | 0.94 (0.82;1.07)a | 0.333 |
| Left-Chemo | 1.07 (0.93;1.23) | 0.339 | 0.93 (0.79;1.09) | 0.366 | 0.97 (0.83;1.14)a | 0.708 |
| Rectal-No-Chemo | 0.94 (0.83;1.06) | 0.317 | 0.82 (0.72;0.94) | 0.004 | 0.86 (0.75;0.98)a | 0.028 |
| Rectal-Chemo | 0.96 (0.84;1.11) | 0.610 | 0.84 (0.72;0.99) | 0.031 | 0.89 (0.76;1.03)a | 0.126 |
| Surgery and radiation therapy | ||||||
| Rectal-No-Radiation | ref | |||||
| Rectal-Radiation | 1.07 (0.93;1.24) | 0.336 | 0.98 (0.85;1.13) | 0.804 | 0.97 (0.84;1.12)b | 0.691 |
| Surgery | ||||||
| All Colon | ref | |||||
| All Rectal | 0.90 (0.83;0.98) | 0.013 | 0.87 (0.79;0.95) | 0.002 | 0.89 (0.82;0.98)b | 0.015 |
Additional files
-
Supplementary file 1
Risk of developing T2D after different types of colorectal cancer surgery with and without chemotherapy – adjusted for cancer stage, Model 1 and Model 2.
- https://cdn.elifesciences.org/articles/89354/elife-89354-supp1-v1.pdf
-
MDAR checklist
- https://cdn.elifesciences.org/articles/89354/elife-89354-mdarchecklist1-v1.docx
Download links
A two-part list of links to download the article, or parts of the article, in various formats.
Downloads (link to download the article as PDF)
Open citations (links to open the citations from this article in various online reference manager services)
Cite this article (links to download the citations from this article in formats compatible with various reference manager tools)
The impact of surgery and oncological treatment on risk of type 2 diabetes onset in patients with colorectal cancer: nationwide cohort study in Denmark
eLife 12:RP89354.
https://doi.org/10.7554/eLife.89354.3


