How accurately can one predict drug binding modes using AlphaFold models?
- Biophysics Program, Stanford University, United States
- Department of Computer Science, Stanford University, United States
- Department of Molecular and Cellular Physiology, Stanford University School of Medicine, United States
- Department of Structural Biology, Stanford University School of Medicine, United States
- Institute for Computational and Mathematical Engineering, Stanford University, United States
Figures
Figure 1 with 2 supplements
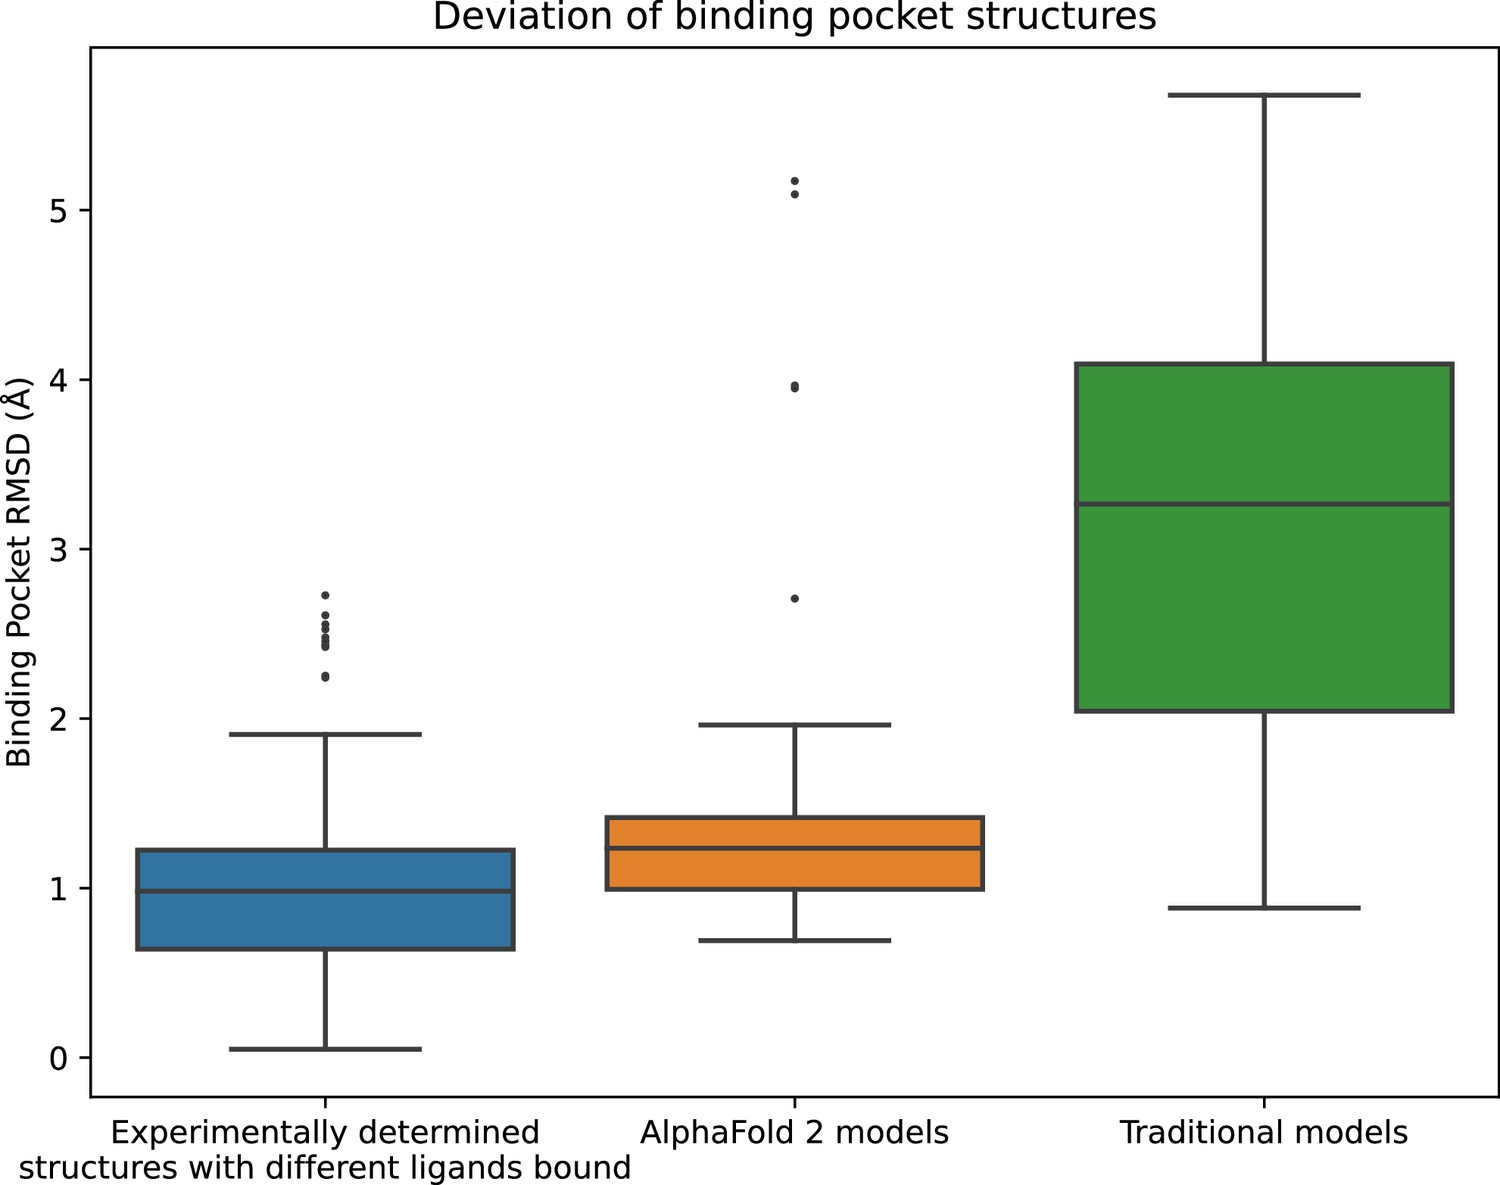
Structural accuracy of modeled binding pockets.
Binding pockets are defined to include all amino acid residues with any atom within 5 Å of the ligand in an experimentally determined structure. We compute all-atom binding pocket root mean squared deviations (RMSDs) between each modeled structure and all experimentally determined structures of the same protein. For comparison, we also compute binding pocket RMSDs between all pairs of experimentally determined structures of the same protein with different ligands bound. The middle line of each box in the plot is the median RMSD, with the box extending from the first to the third quartile and defining the ‘interquartile range’. Whiskers extend to last data points that are within 150% of the interquartile range, and outlier data points beyond those are shown individually. The plotted data is based on 150 RMSD values (comparisons) for experimentally determined structures with different ligands bound, 52 for AlphaFold 2 models, and 78 for traditional models.
Figure 1—figure supplement 1
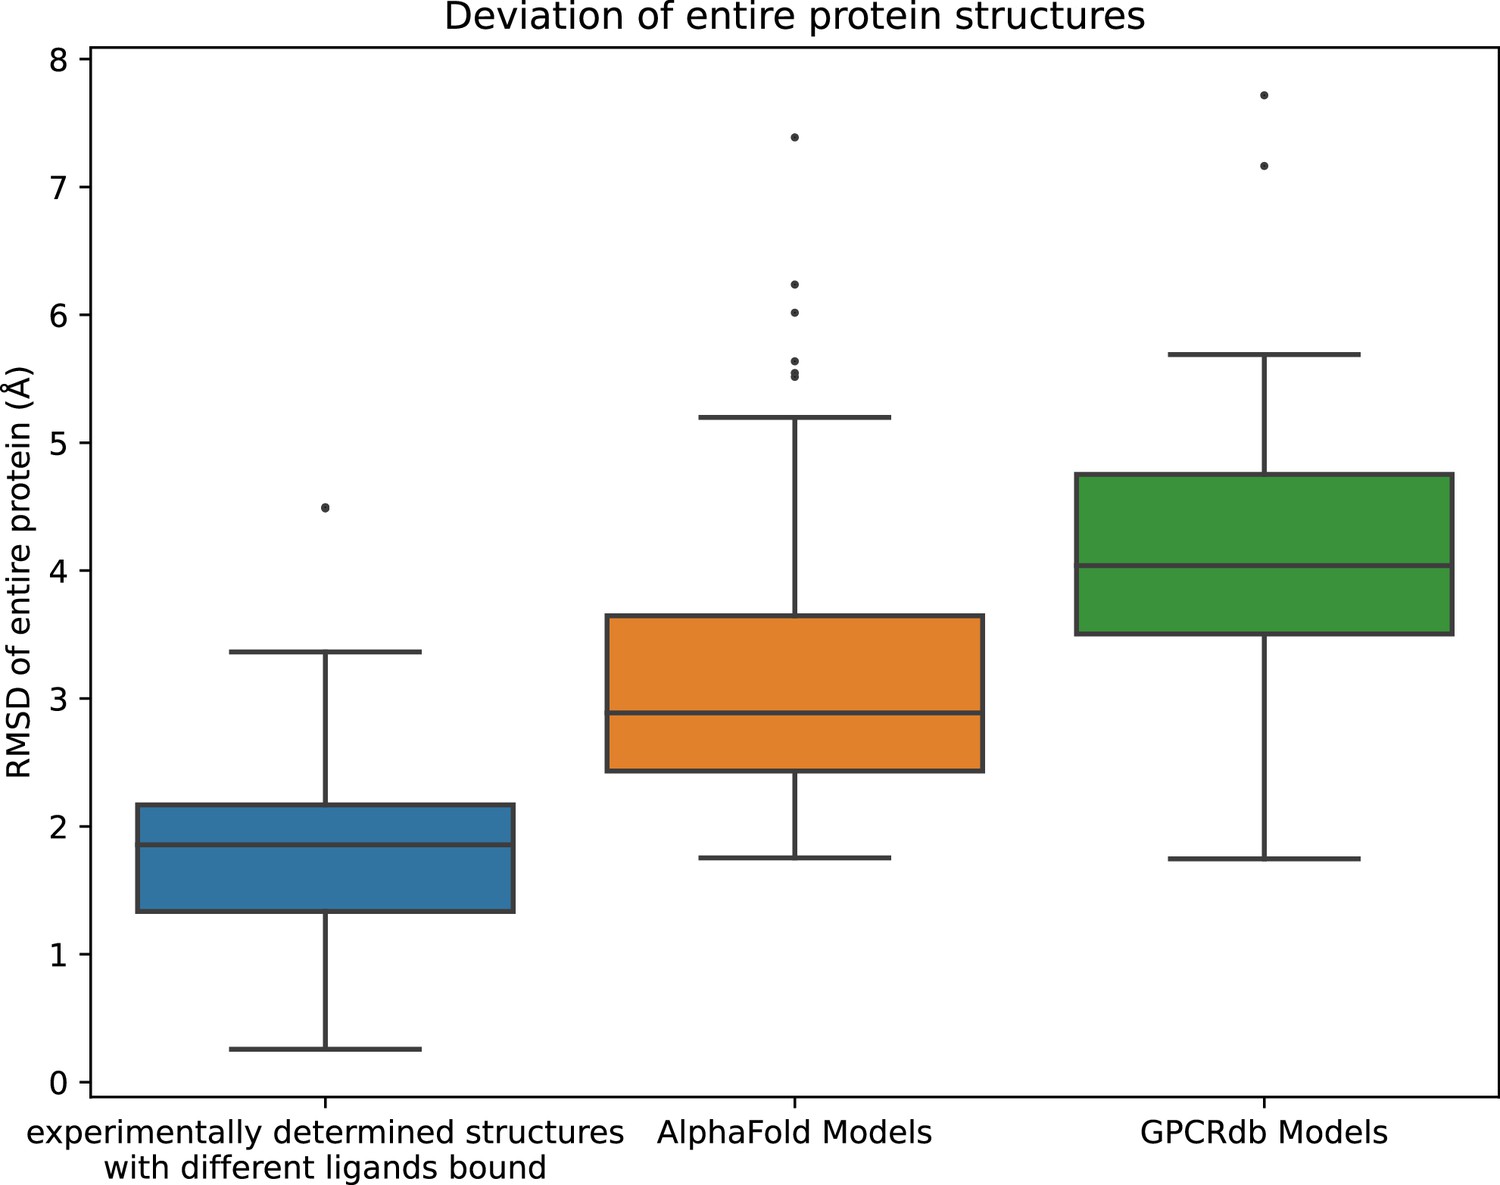
Structural accuracy of modeled proteins.
We compute an all-atom root mean squared deviation (RMSD) between each modeled structure and all experimentally determined structures of the same protein. We also compute an all-atom RMSD between each pair of experimentally determined structures of the same protein with different ligands bound. The middle line of each box in the plot is the median RMSD, with the box extending from the first to the third quartile and defining the ‘interquartile range’. Whiskers extend to last data points that are within 150% of the interquartile range, and outlier data points beyond those are shown individually.
Figure 1—figure supplement 2

Structural accuracy of modeled binding pockets.
This figure is similar to Figure 1 but includes an additional bar for the case where each ligand is docked only to protein structures determined experimentally in complex with a ligand very different from the one being docked. Very different ligands are defined as ligand pairs in which the atom count of the maximal common substructure that is less than half the atom count of the smaller molecule.
Figure 2 with 2 supplements

Accuracy of ligand-binding poses predicted by computational docking to AlphaFold 2 models, traditional template-based models, or protein structures determined experimentally in complex with a ligand different from the one being docked.
We plot the fraction of docked ligands whose pose is predicted correctly (see Methods). Error bars are 90% confidence intervals calculated via bootstrapping. *** for p-values <0.001, ns for p-values >0.05. 40 - 54 ligands were evaluated for each set of structures or models.
Figure 2—figure supplement 1
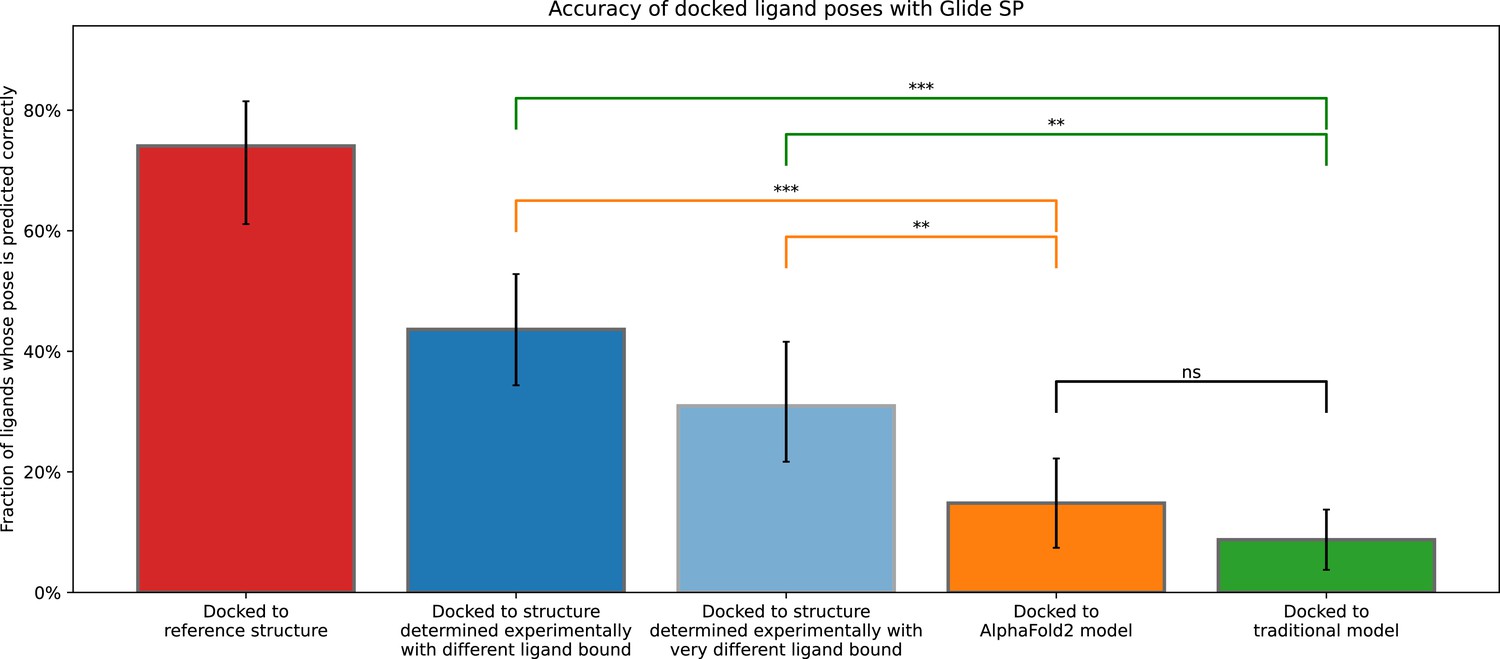
Accuracy of ligand-binding poses predicted by computational docking to AlphaFold 2 models, traditional template-based models, or experimentally determined protein structures.
This figure is identical to Figure 2 apart from the addition of two bars: (1) The red bar (docked to reference structure) is for the case where one docks the ligand from an experimentally determined structure back into the same structure (self-docking); (2) the light blue bar is for the case where each ligand is docked only to protein structures determined experimentally in complex with a ligand very different from the one being docked. Very different ligands are defined as ligand pairs in which the atom count of the maximal common substructure that is less than half the atom count of the smaller molecule. Error bars are 90% confidence intervals calculated via bootstrapping. *** for p-values <0.001, ** for p-values <0.01, ns for p-values >0.05.
Figure 2—figure supplement 2
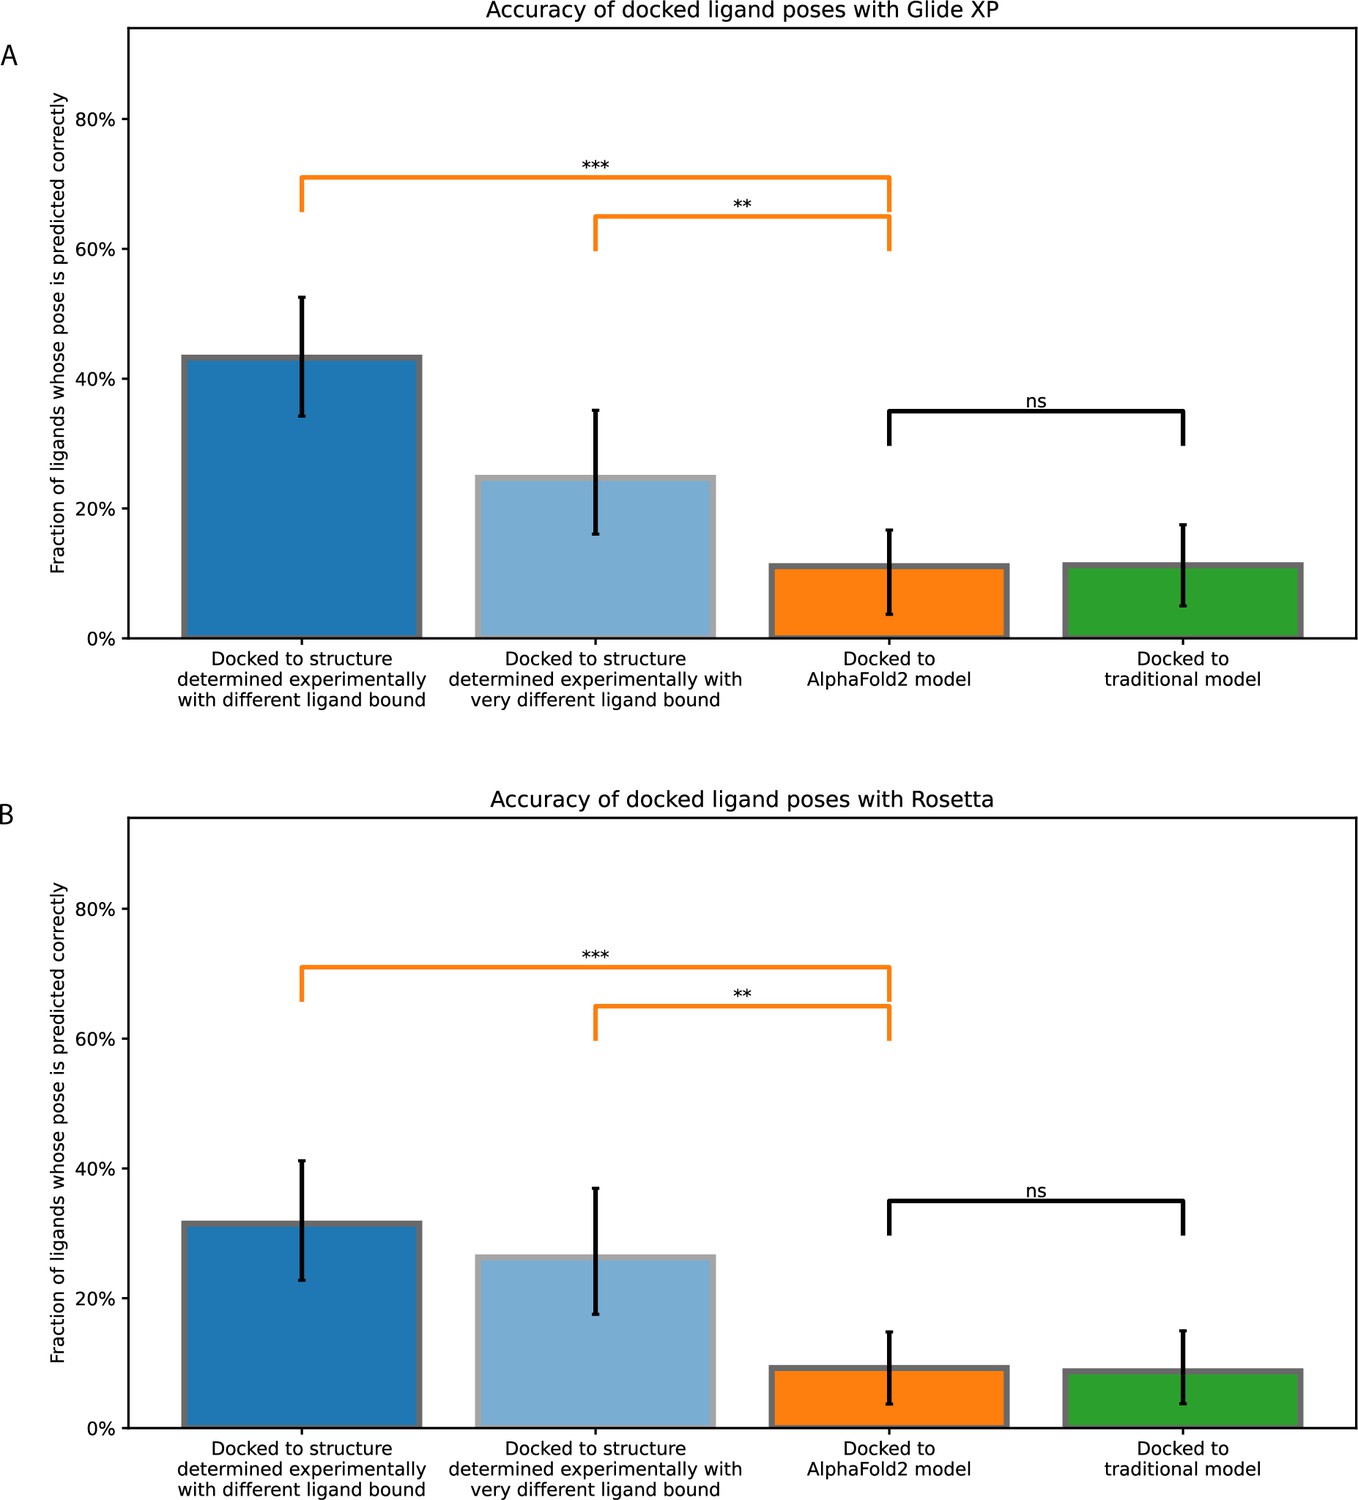
Accuracy of ligand-binding poses predicted by computational docking to AlphaFold 2 models, traditional template-based models, or protein structures determined experimentally in complex with ligands different from the one being docked or very different from the one being docked.
These plots are similar to those of Figure 2 and Figure 2—figure supplement 1, except that docking is performance with (A) Glide Dock XP and (B) Rosetta docking. Error bars are 90% confidence intervals calculated via bootstrapping (see Methods). *** for p-values <0.001, ** for p-values <0.01, ns for p-values >0.05.
Figure 3 with 1 supplement
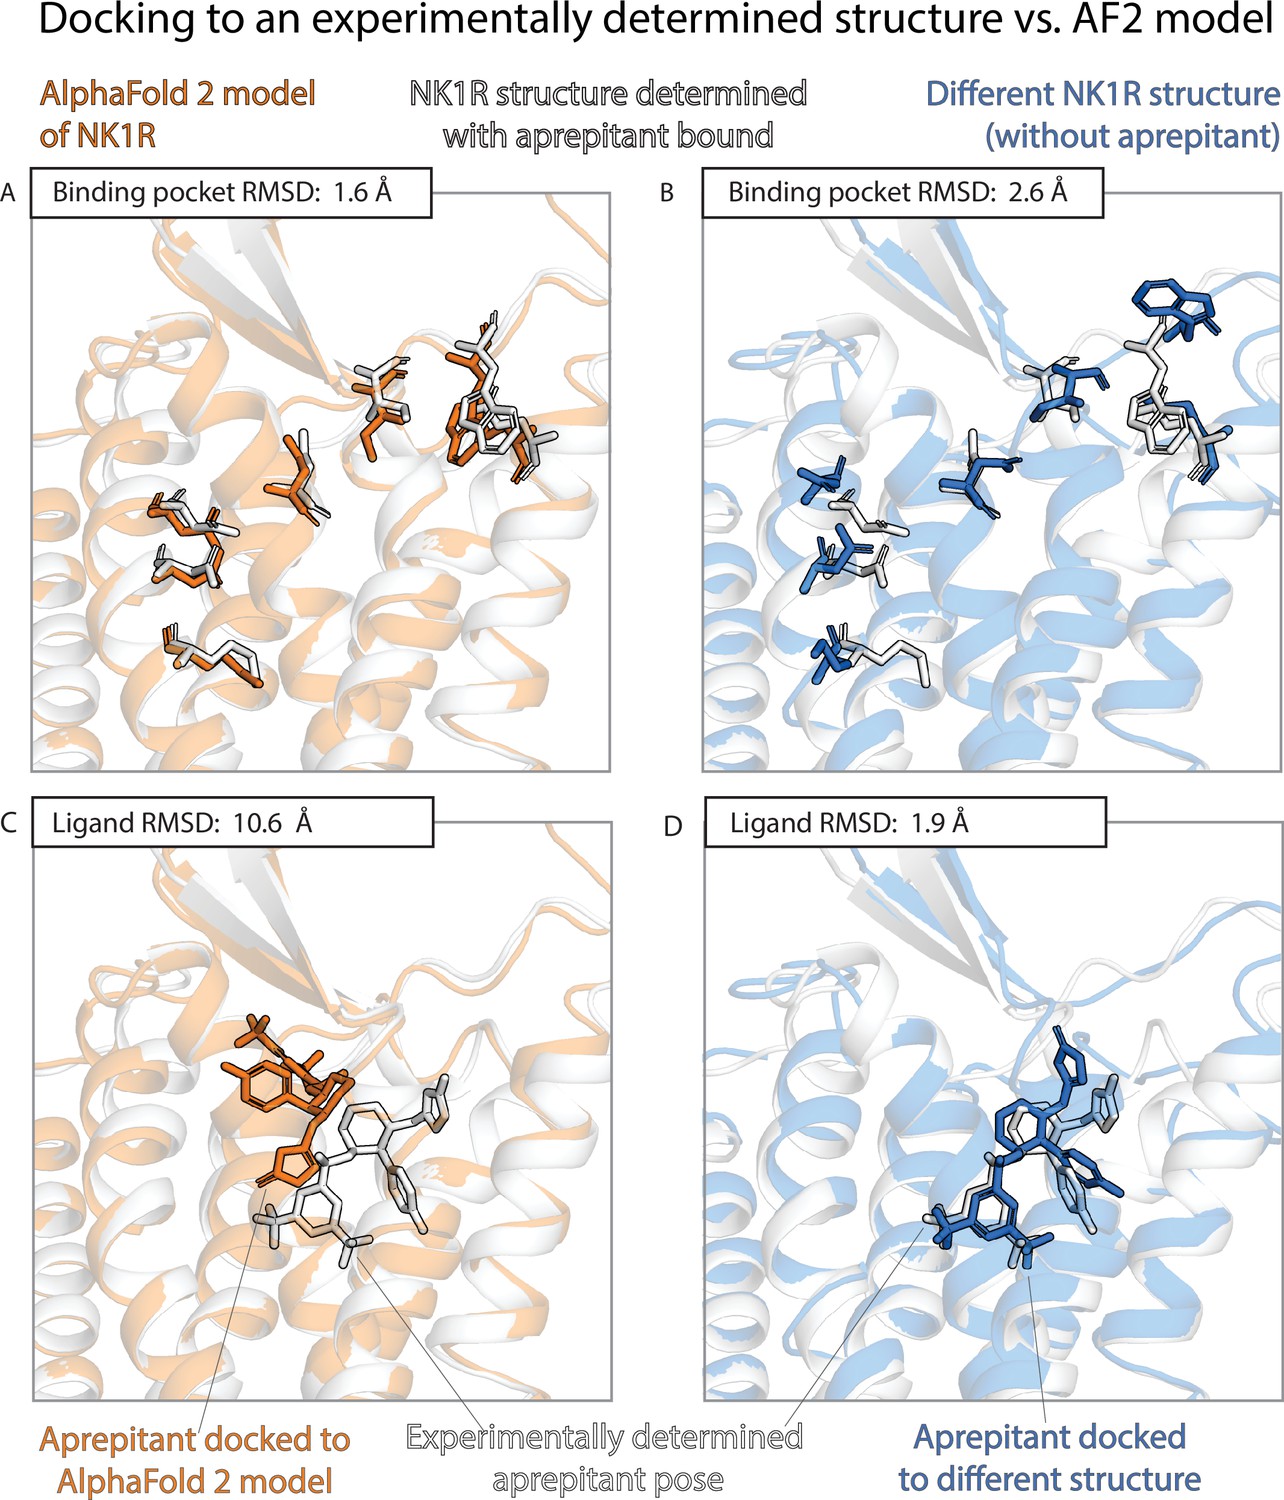
An example in which docking to an AlphaFold 2 (AF2) model yields poor results even though the model’s binding pocket has high structural accuracy.
We predict the binding pose of the drug aprepitant to its target, the neurokinin-1 receptor (NK1R) given either the AF2 model (orange) of NK1R or the experimentally determined structure (blue, PDB entry 6E59) of NK1R bound to a different ligand, L760735. (A, B) The binding pocket of the AF2 model is more similar (lower root mean squared deviation [RMSD]) than the binding pocket of the L760735-bound structure to the binding pocket of the aprepitant-bound structure (the ‘reference structure’, white, PDB entry 6J20). Amino acid residues whose positions differ most from the reference structure are shown in sticks (see Methods). (C, D) The aprepitant binding pose predicted by docking is much less accurate (higher RMSD) when using the AF2 model than when using the L760735-bound structure. Ligand L76035 shares a scaffold with aprepitant; for completeness, we include another example with highly dissimilar ligands in Figure 3—figure supplement 1. We note that the experimentally determined L760735-bound structure is a low-resolution structure with suboptimal goodness of fit to experimental data; despite this, docking aprepipant to this structure yields an accurate pose.
Figure 3—figure supplement 1
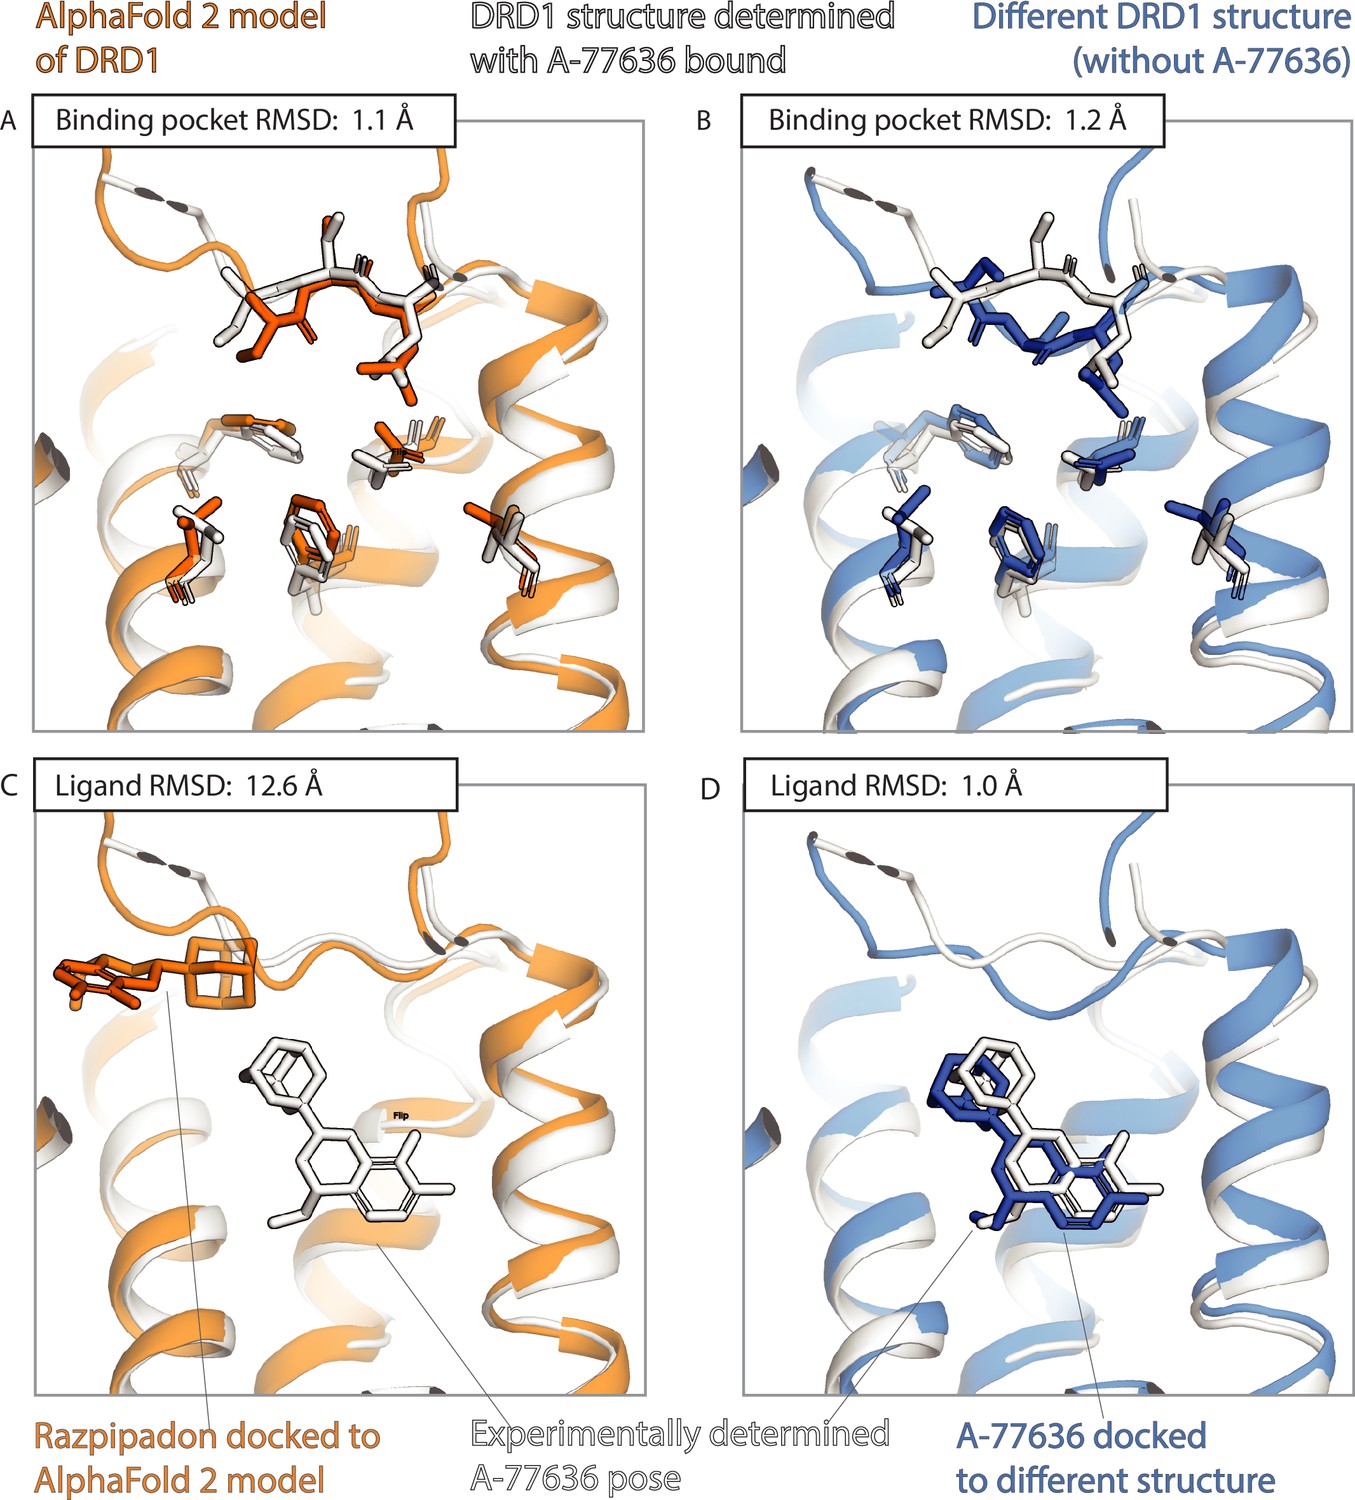
An example in which docking to an AlphaFold 2 (AF2) model yields poor results even though the model’s binding pocket has high structural accuracy.
We predict the binding pose of the drug-like ligand A-77636 to the D1 dopamine receptor (DRD1) given either the AF2 model (orange) of DRD1 or the experimentally determined structure (blue, PDB entry: 7CKY) of DRD1 bound to a different ligand, Razpipadon. (A, B) The binding pocket of the AF2 model is more similar (lower root mean squared deviation [RMSD]) than the binding pocket of the Razpipadon-bound structure to the binding pocket of the A-77636-bound structure (the ‘reference structure’, white, PDB entry: 7CKX). Amino acid residues whose positions differ most from the reference structure are shown in sticks. (C, D) The A-77636-binding pose predicted by docking is much less accurate (higher RMSD) when using the AF2 model than when using the Razpipadon-bound structure.
Figure 4
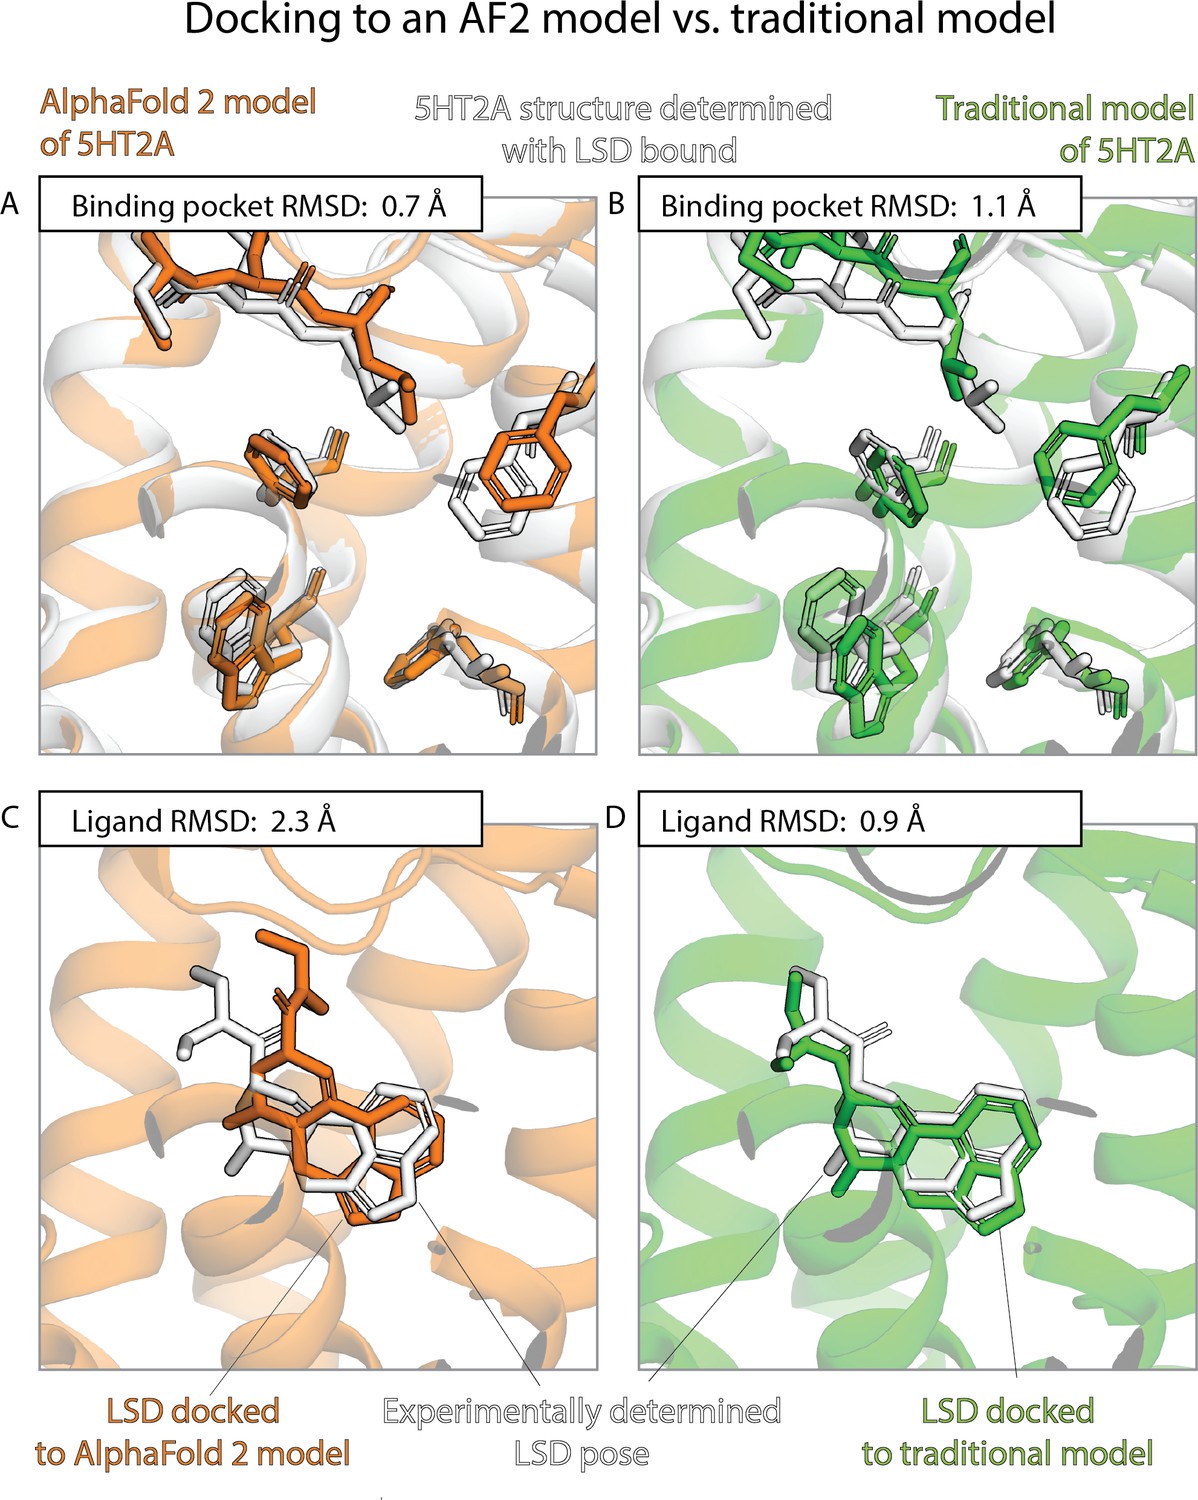
An example in which docking to a traditional template-based model yields better results than docking to an AlphaFold 2 (AF2) model, even though the AF2 model’s binding pocket has higher structural accuracy.
We predict the binding pose of the psychedelic LSD to its primary target, the serotonin 2A receptor (5HT2A) given either the AF2 model (orange) or a traditional model (green) of 5HT2A. (A, B) The binding pocket of the AF2 model is more similar (lower root mean squared deviation [RMSD]) than that of the traditional model to the binding pocket of the experimentally determined LSD-bound structure (the ‘reference structure’, white, PDB entry 6WGT). Amino acid residues that differ most from the reference structure are shown in sticks. (C, D) The LSD-binding pose predicted by docking is less accurate (higher RMSD) when using the AF2 model than when using the traditional model.
Figure 5 with 1 supplement
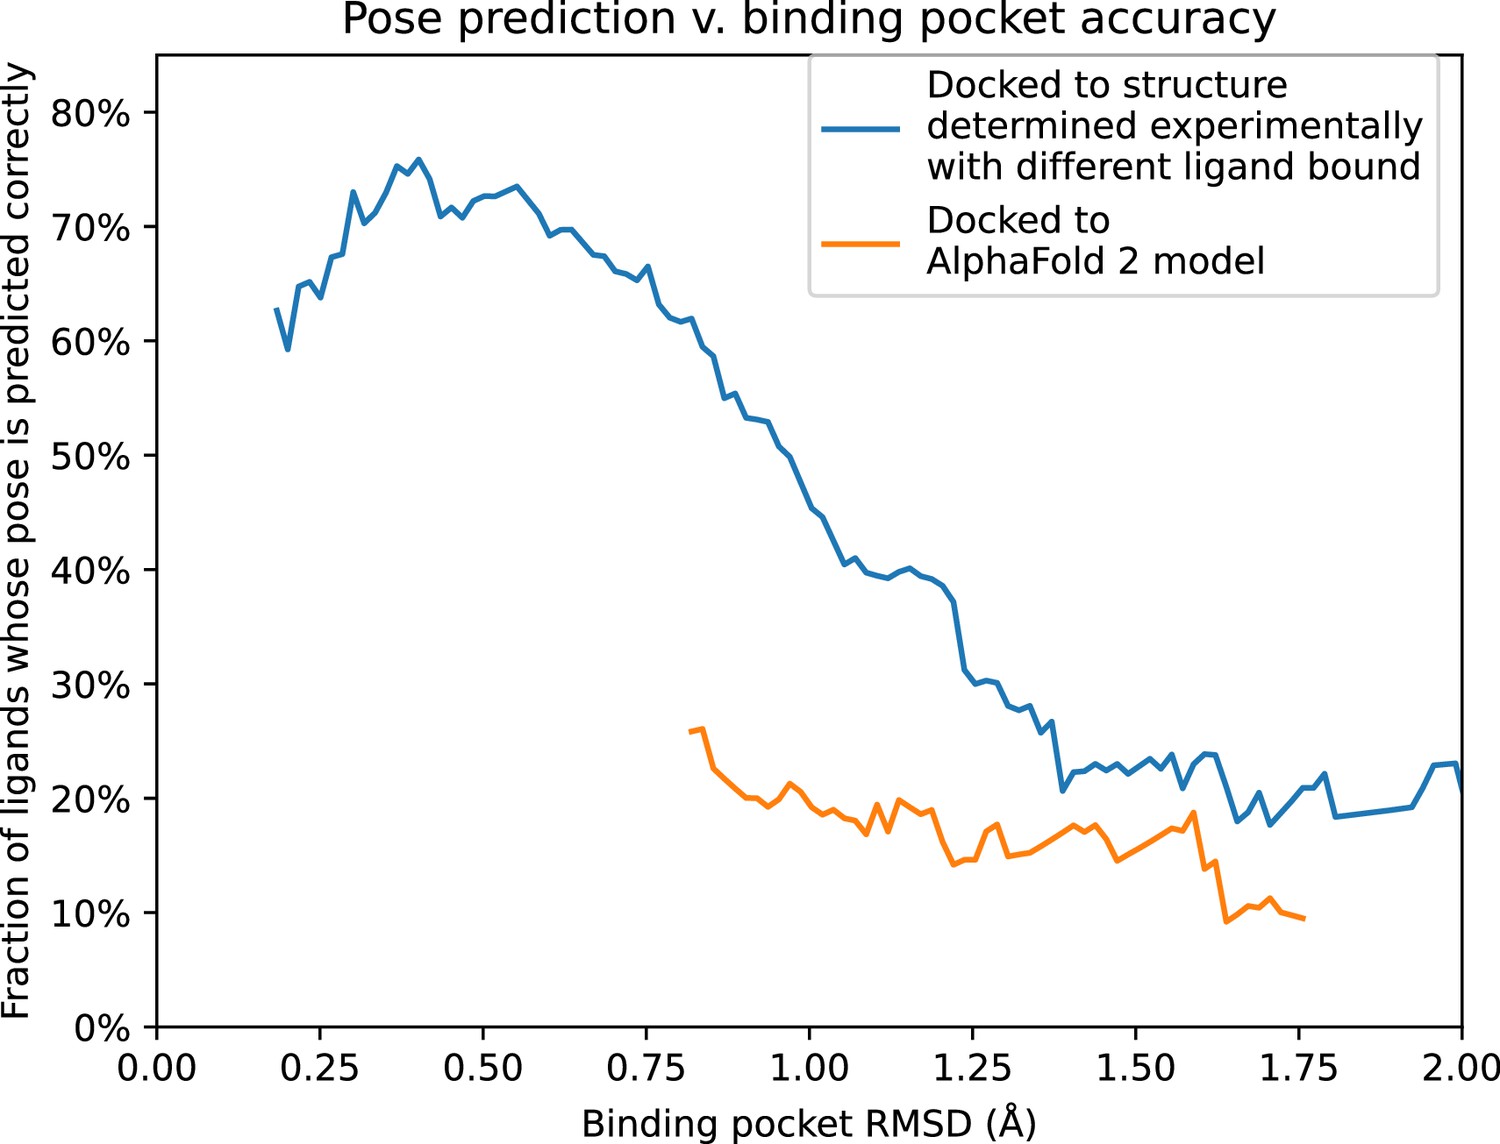
Pose prediction accuracy as a function of binding pocket structural accuracy when docking to AlphaFold 2 (AF2) models or experimentally determined structures.
Docking to an experimentally determined structure generally leads to more accurate pose prediction than docking to an AF2 model with the same binding pocket root mean squared deviation (RMSD). The difference between the two curves is statistically significant for all binding pocket RMSD values below 1.1 Å (see Methods). See Figure 5—figure supplement 1 for additional data, including results for traditional models and for various docking methods.
Figure 5—figure supplement 1

Pose prediction accuracy as a function of binding pocket structural accuracy when docking to AlphaFold 2 (AF2) models, experimentally determined structures or traditional template-based models, with different docking protocols.
Using our docking data, we estimate how the pose prediction accuracy of ligand docking varies with the binding pocket all-atom root mean squared deviation (RMSD) of the structure being docked into (see Methods). In (A) We show calculated p values for the range across binding pocket RMSD. Differences between docking to AF2 and docking to experimentally determined structures are significant for all RMSD values less than 1.1. In (B–F), the shaded regions indicate 90% confidence intervals assigned by bootstrapping (see Methods). (B) We show the same Glide SP results as in Figure 5 but with confidence bounds. In (C), we show what this would look like as we examine backbone binding pocket RMSD instead of all-atom pocket RMSD. In (D–F), we additionally include a curve for docking accuracy with template-based models, (D) with Glide SP, (E) with Glide XP, and (F) with Rosetta. We consistently see that average pose prediction accuracy using AF2 models is lower than when using experimentally determined structures.
Tables
Appendix 1—key resources table
| Reagent type (species) or resource | Designation | Source or reference | Identifiers | Additional information |
|---|---|---|---|---|
| Software | Schrödinger tools | Schrödinger | Version: 2021-1 glide-v9.0 | Glide, Maestro, Protein Preparation Wizard |
| Software | PyMOL | Schrödinger | PyMOL 3.8 | |
| Software | AlphaFold 2.0.1 | https://doi.org/10.1038/s41586-021-03819-2 | ||
| Software | Rosetta GALigandDock | https://doi.org/10.1021/acs.jctc.0c01184 |
Additional files
-
Supplementary file 1
The full list of proteins and structures.
- https://cdn.elifesciences.org/articles/89386/elife-89386-supp1-v1.docx
-
MDAR checklist
- https://cdn.elifesciences.org/articles/89386/elife-89386-mdarchecklist1-v1.pdf
Download links
A two-part list of links to download the article, or parts of the article, in various formats.
Downloads (link to download the article as PDF)
Open citations (links to open the citations from this article in various online reference manager services)
Cite this article (links to download the citations from this article in formats compatible with various reference manager tools)
How accurately can one predict drug binding modes using AlphaFold models?
eLife 12:RP89386.
https://doi.org/10.7554/eLife.89386.2


