Tailoring Tfh profiles enhances antibody persistence to a clade C HIV-1 vaccine in rhesus macaques
- Department of Pathology, School of Medicine, University of Pittsburgh, United States
- Graduate Group in Immunology, University of California, Davis, United States
- California National Primate Research Center, University of California, Davis, United States
- Department of Pathology, Microbiology, and Immunology, School of Veterinary Medicine, University of California, Davis, United States
- Department of Microbiology, Immunology, and Parasitology, Louisiana State University Health Sciences Center, United States
- Bioinformatics Core, Department of Pediatrics, UPMC Children's Hospital of Pittsburgh, United States
- Statens Serum Institute, Denmark
- Center for Human Systems Immunology, United States
- Department of Surgery, Duke University Medical Center, United States
- Duke Human Vaccine Institute, Duke University Medical Center, United States
- Department of Molecular Genetics and Microbiology, Duke University Medical Center, United States
- Department of Integrative Immunobiology, Duke University Medical Center, United States
- Department of Microbiology and Immunology, Emory University, United States
- Yerkes National Primate Research Center, Emory University, United States
Figures
Figure 1 with 1 supplement
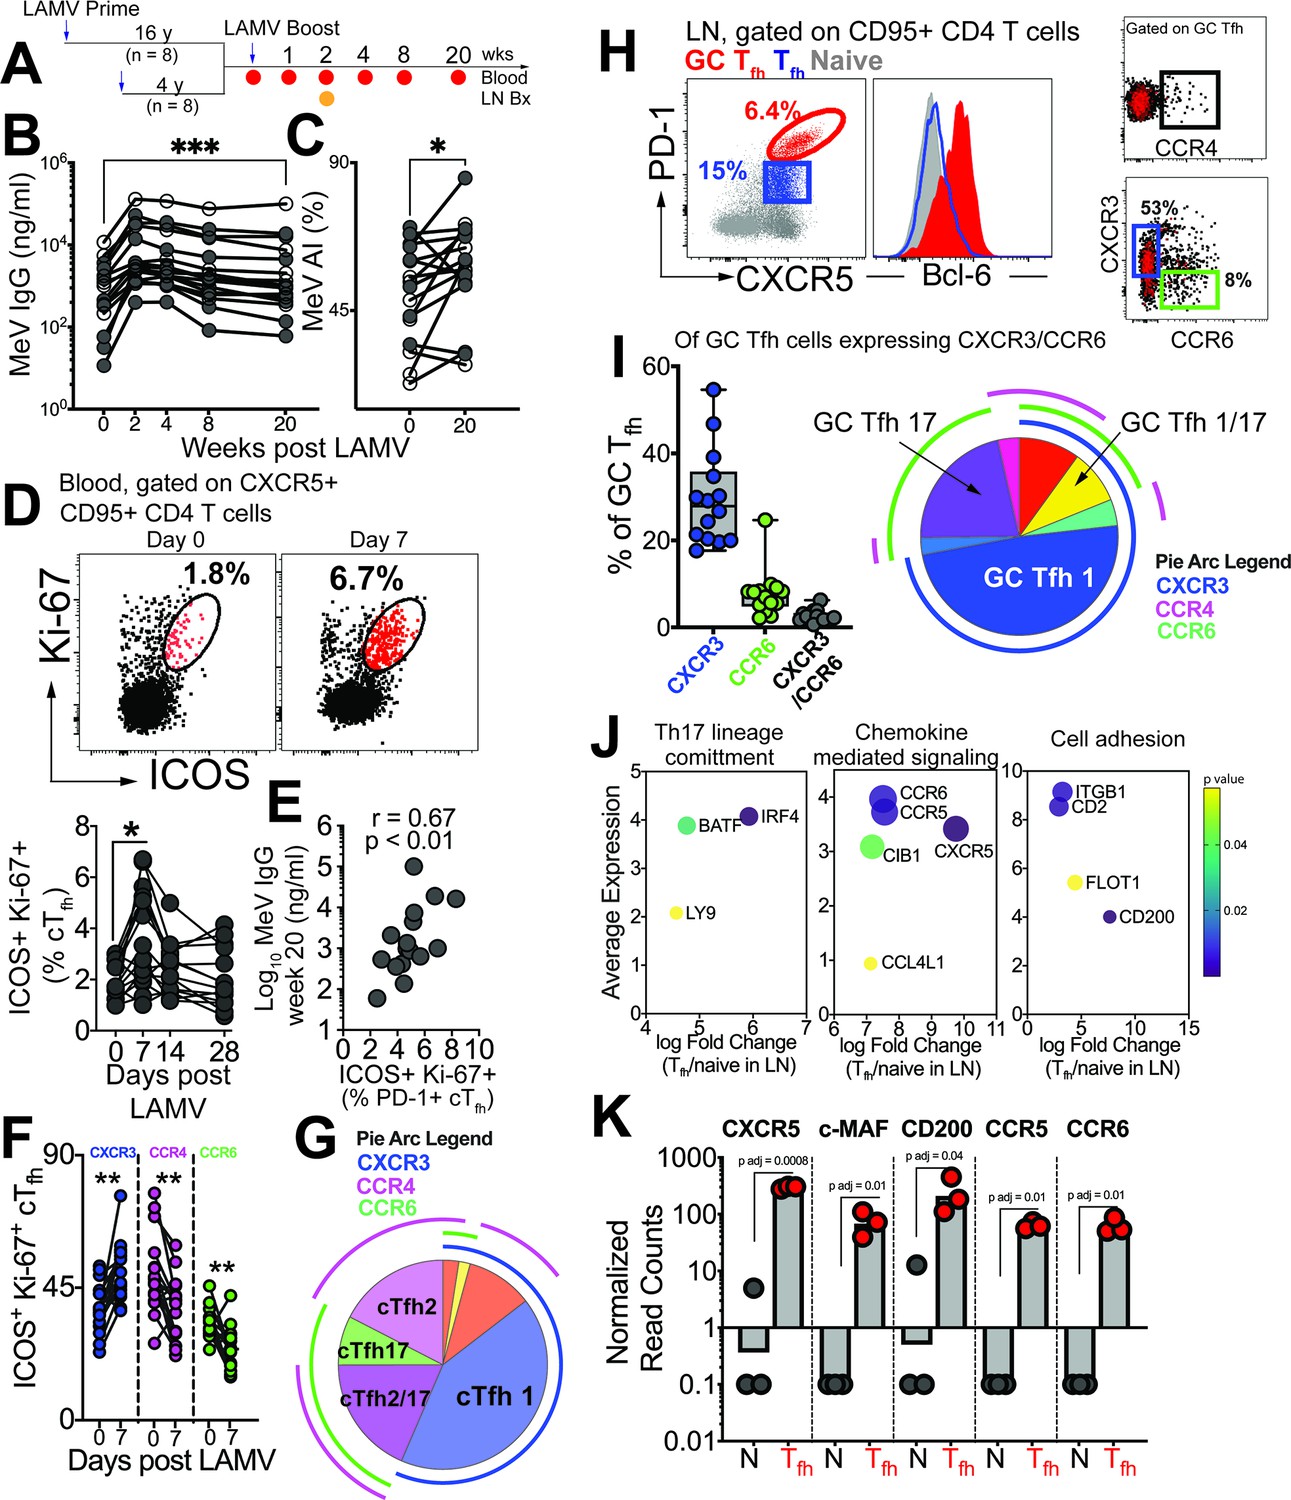
GC Tfh1 and GC Tfh17 cells recalled by measles booster.
(A) Overview of study design; adult female rhesus macaques immunized with Live Attenuated Measles Virus vaccine (LAMV). (B) Serum MeV IgG kinetics measured by ELISA (filled circles, aged rhesus; open circles, young adults). (C) Avidity index (AI) of MeV IgG measured using chaotropic displacement ELISA with sodium thiocyanate at week 20 and week 0 in serum. (D) Representative flow cytometry plots showing ICOS+Ki-67+ circulating (c)Tfh cells in blood at day 0 and day 7 post LAMV. Kinetics of ICOS+Ki-67+ cTfh cells. (E) Correlation between ICOS + Ki-67+cTfh cells at day 7 and MeV IgG at week 20. (F) Th profile of cTfh cells shows induction of CXCR3+ cTfh1 at day 7. (G) Boolean analysis (n=16) shows cTfh1 cells induced 1 week post LAMV. Overlapping pie arcs denote cTfh cells expressing multiple chemokine receptors as denoted by arc color. (H) Representative flow cytometry plots show CXCR5+ PD-1++ GC Tfh cells and histogram shows Bcl-6 expression on GC Tfh cells. Th profile of GC Tfh cells shows expression of CXCR3 and CCR6. (I) Boolean analysis of GC Tfh cells expressing either CXCR3 or CCR6 (n=14) shows proportion of Th1, Th17 and Th1/17 GC Tfh subsets. (J) Bubble plots show genes for significantly enriched pathways related to T helper differentiation on sorted CXCR5 + PD-1+/++ cells. (K) Gene expression on sorted CXCR5 +PD-1+/++ cells. Statistical analysis was performed using two-tailed Wilcoxon matched-pairs signed rank test (in panels B-D, F) or spearman rank correlation test (E); * p<0.05, **p<0.01, *** p<0.001, **** p<0.0001.
Figure 1—figure supplement 1

MeV specific Tfh cells.
(A) Gating strategy to identify CXCR5+ OX40+ CD25+ MeV-specific Tfh cells within PBMCs following stimulation with MeV antigen at Day 0 and Day 7 post LAMV. Right panel illustrates the MeV specific responses in CD4 T cells (%CD95) at weeks 0, 1, and 8 following immunization. (B) Flow plots illustrate gating strategy to identify cTfh cells. (C) Representative histograms show expression of TIGIT, CD200, CXCR3, CCR6, and CCR4 on GC Tfh cells in LN. (D) Sorting schematic to isolate CXCR5 + PD-1+/++ cells for RNA sequencing.
Figure 2 with 2 supplements
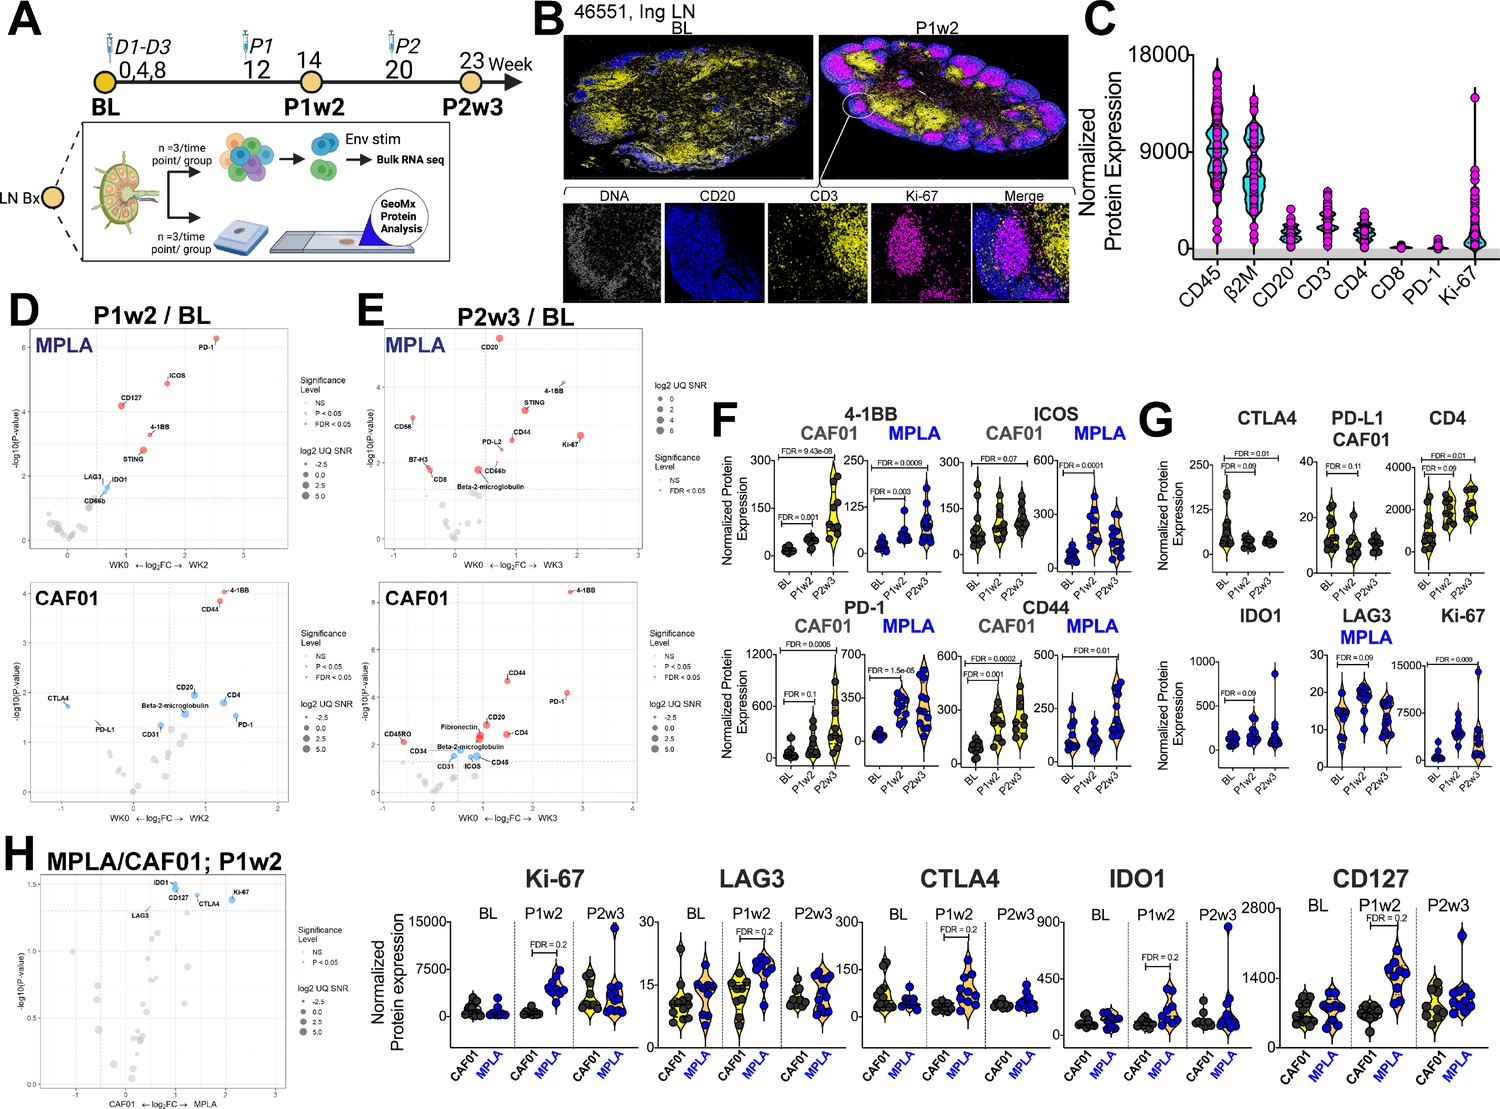
Induction of Robust T Cell Activation in GCs with HIV-1 Env Formulated in CAF01 and MPLA +QS-21 Adjuvants.
(A) Overview of experimental design for in-situ proteomics and transcriptional analysis. (B) Representative images of GC from FFPE sections of inguinal LN at baseline and week 2 post protein 1 immunization with HIV-Env gp140 | MPLA +QS-21; scale bar; top, 3 mm, close up, 300 μm. LN sections were stained for CD20 (blue), CD3 (yellow), Ki-67 (magenta), and DNA (gray) to identify GCs. Circular ROIs (100 μm in diameter, total 60) were selected based on co-localization of CD3 with CD20 +Ki-67+GC B cells for proteomic profiling with a 32-plex antibody cocktail. Normalized protein expression (NPE) values were calculated using three negative control IgG probes. (C) NPE of key lineage markers across all ROIs at BL, P1w2, and P2w3. (D–E) Volcano plots show proteins induced post boost in each vaccine group. (F) Violin plots show common proteins induced post protein boost in MPLA and CAF01 groups. (G) Violin plots of proteins induced with CAF01 and MPLA. (H) Volcano plot (left) and Violin plots (right) of proteins significantly different across HIV-1 Env gp140 MPLA +QS-21 and CAF01 regimens. Differential expression was modeled using a linear mixed-effect model to account for the sampling of multiple ROI/AOI segments per patient/tissue. Criterion of significance was nominal p-value <0.05, plots show False discovery rate (FDR).
Figure 2—figure supplement 1
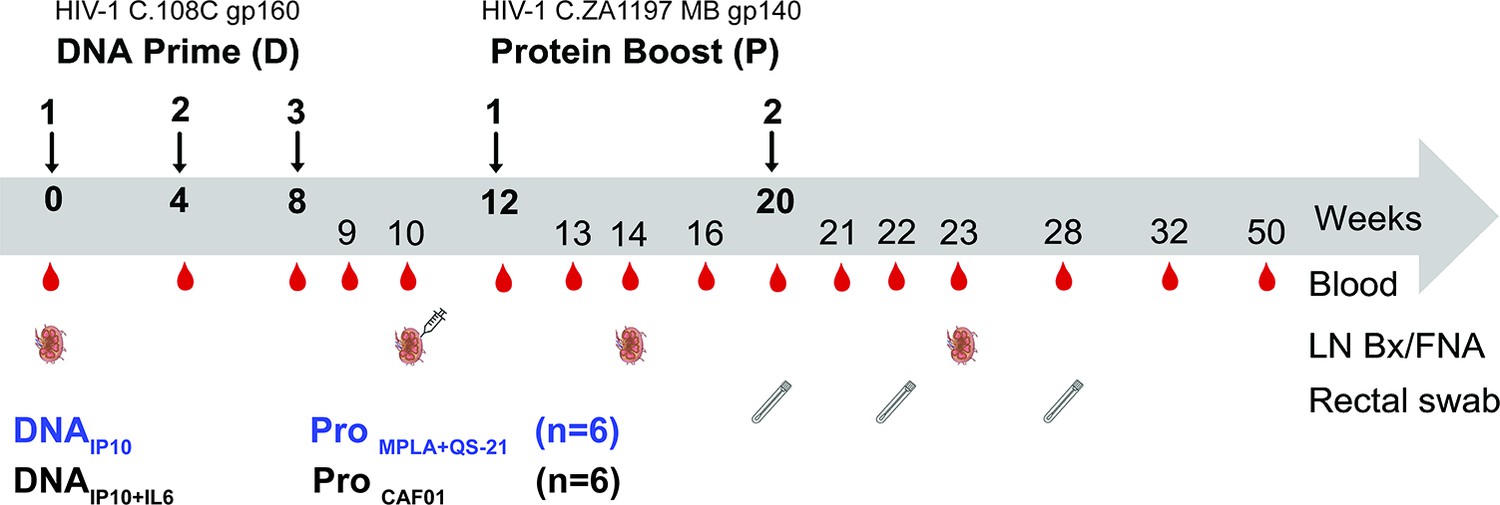
Experimental design of DNA-prime/Protein-boost Clade C HIV-1 immunization.
Figure 2—figure supplement 2
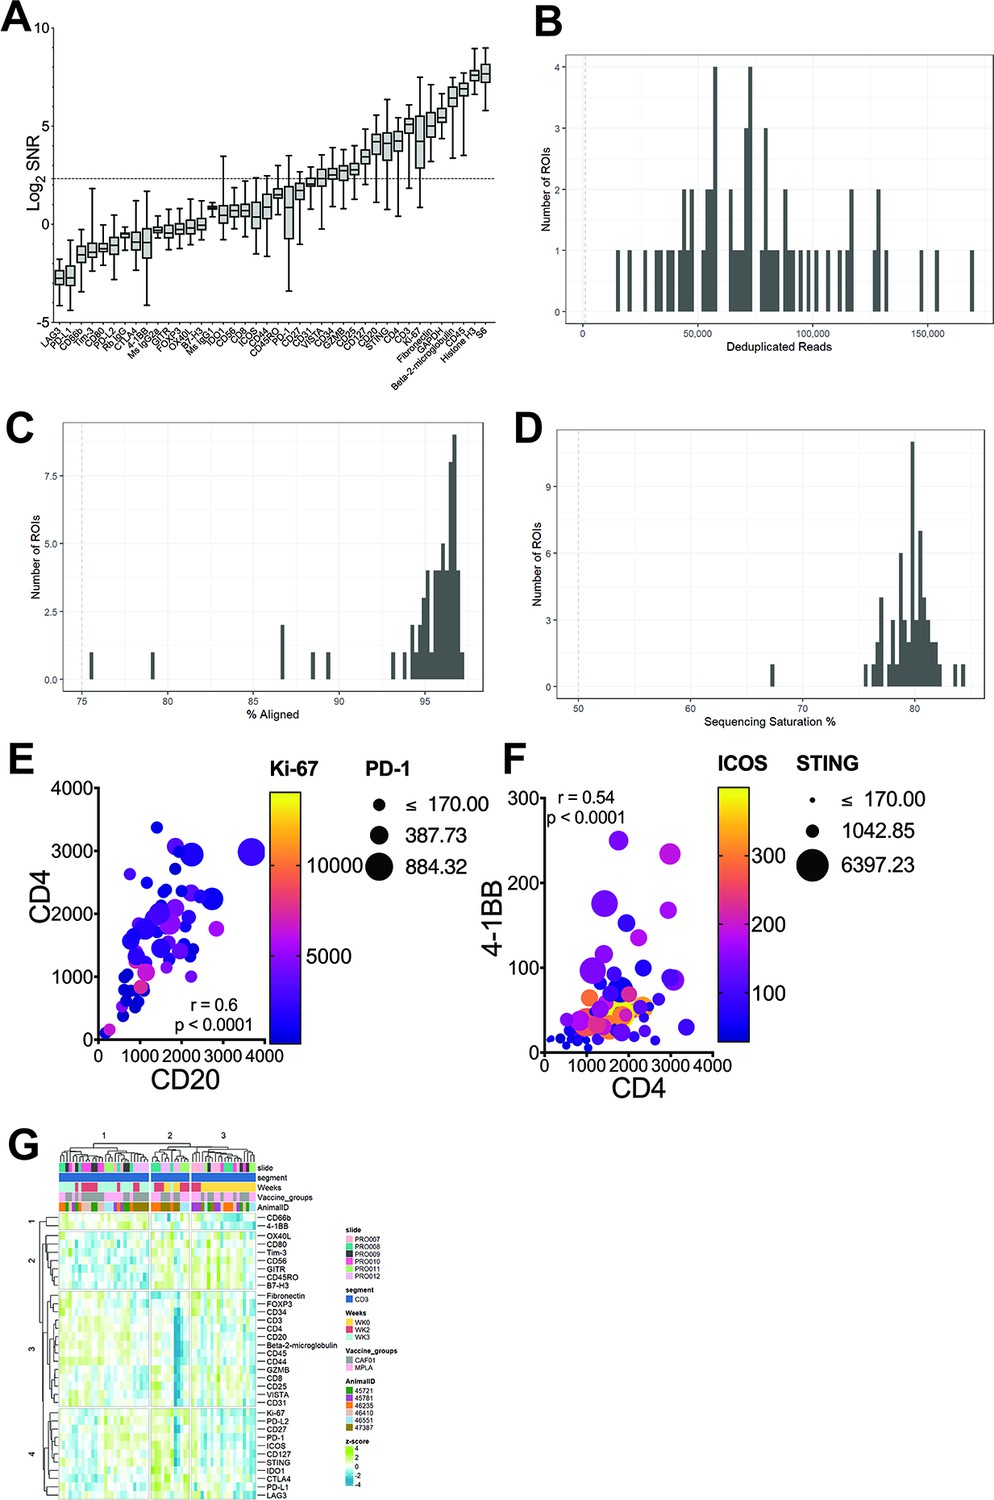
Sequencing QC histograms show (A) Signal-to-noise ratio computed by dividing raw count values by the geometric mean of the negative IgG probes.
Quality control metrics- (B) deduplicated reads, (C) percent aligned reads, (D) sequencing saturation. (E) Bubble plot shows correlation of CD20 protein expression with CD4; bubble size corresponds to PD-1 expression, color intensity, Ki-67 expression; Spearman value, two-tailed p value of 60 pairs. (F) Bubble plot shows correlation of CD4 protein expression with 4-1BB; bubble size corresponds to ICOS expression, color intensity, STING expression; Spearman value, two-tailed p value of 60 pairs. (G) Heatmap plots show unsupervised hierarchical clustering of z-score values for each protein across time for each animal.
Figure 3 with 1 supplement
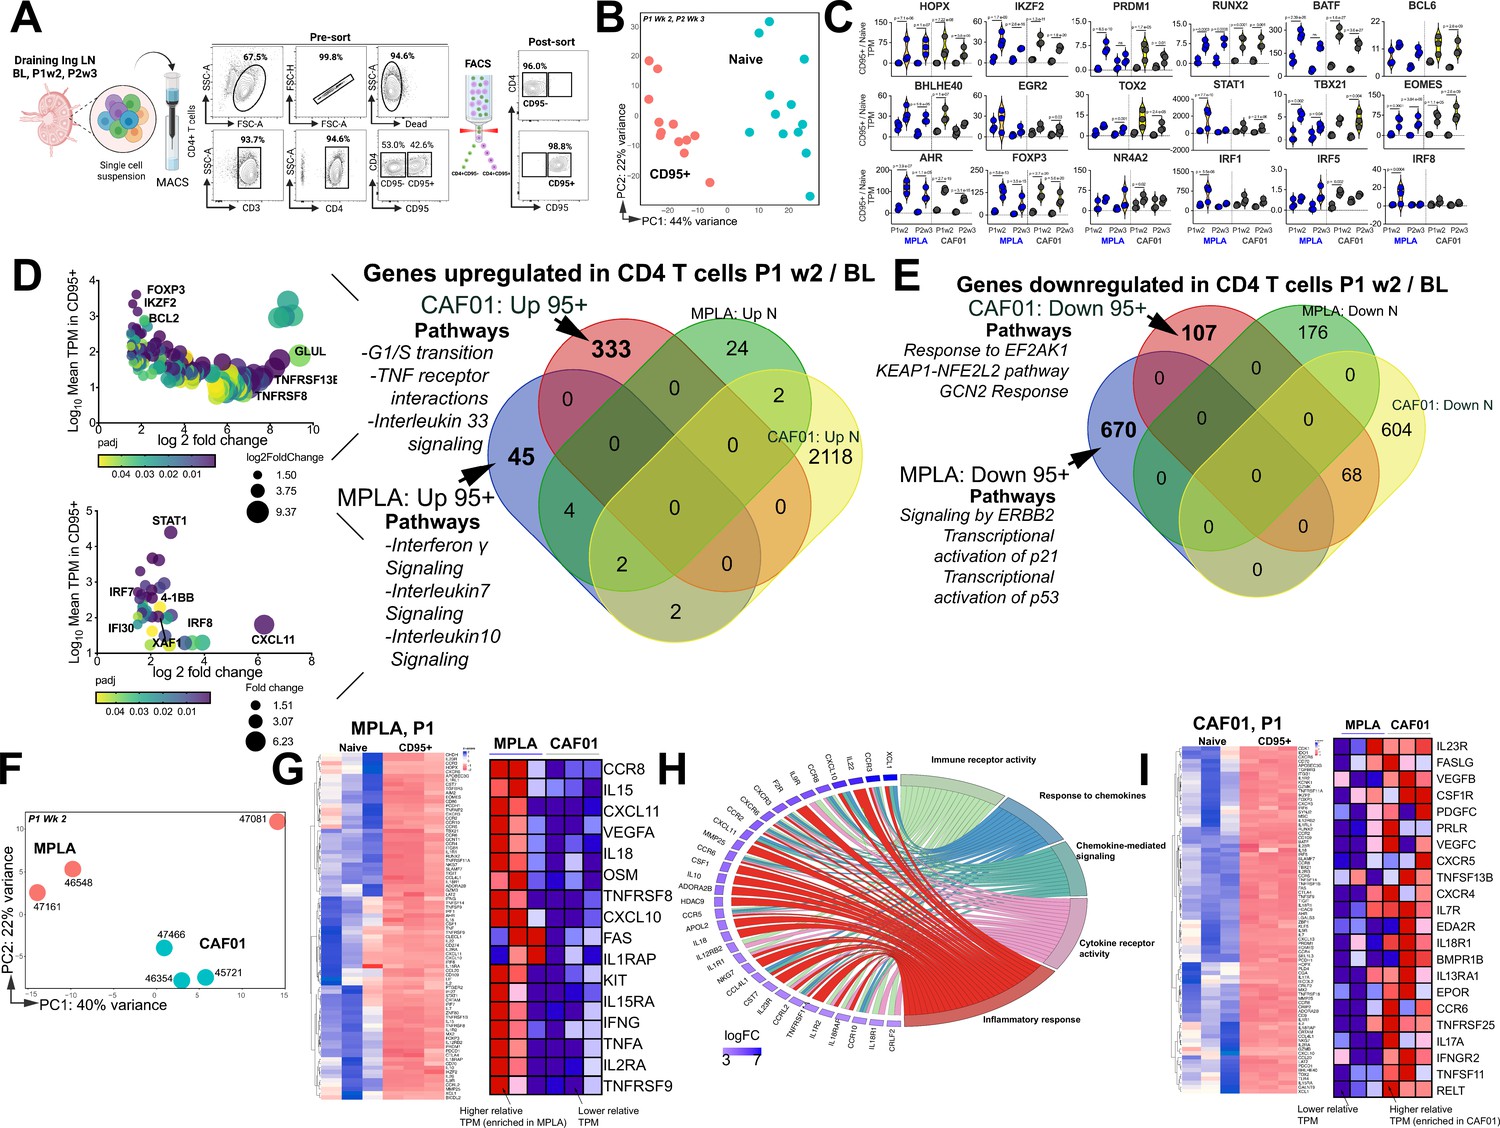
Th1 molecular programs potentiated by HIV-1 Env/MPLA + QS-21.
(A) FACS purified CD95- (naive [N]) and CD95 + CD4 T cells, stimulated overnight with HIV-1 Env, were sequenced to assess transcriptional programs. (B) Principal component analysis (PCA) of all expressed genes shows distinct clustering of N and CD95 + cells. (C) Violin plots show transcripts per million (TPM) values of differentially expressed transcription factors (p adj <0.05) in CD95 + CD4 T cells relative to naive CD4 T cells post vaccination. (D) Bubble plots depict DEG at P1w2 versus BL in CD95 + CD4 T cells in CAF01 (top) and MPLA (bottom). Venn Diagram of DEG genes upregulated in CD95 + and naive subsets at P1w2 relative to BL shows 45 and 333 genes exclusively upregulated in CD95 + CD4 T cells with MPLA and CAF01, respectively. (E) Venn diagram of significantly downregulated genes. (F) PCA of all expressed genes shows distinct clustering across vaccine groups at P1w2. (G) Heat maps depict log2 gene expression (transcripts per million (TPM)) for highly DEG in CD95 + cells compared to naive cells at P1w2 in MPLA; heat map in inset depicts TPM of genes represented in Cytokine-cytokine receptor interaction pathways across vaccine regimens. (H) Chord plot shows GO Terms enriched with corresponding upregulated genes in CD95 + CD4 T cells at P1w2 with MPLA. (I) Heat maps depict log2 gene expression (TPM) for highly DEG in CD95 + cells compared to naive cells at P1w2 in CAF01; heat map in inset depicts TPM of genes represented in Cytokine-cytokine receptor interaction pathway across vaccine regimens.
Figure 3—figure supplement 1

QC Metrics of RNA sequencing.
(A–B) QC metrics (C) Bar graph shows DEG genes within CD4 subsets post vaccination relative to baseline. (D) PCA plot of CD95 +CD4 T cell subsets at P2w3 (E) Bubble plots show DEG enriched in CD95 +subsets at P1w2 in CAF01 and MPLA. GO-Terms of biological pathways differential induced in MPLA (F) and CAF01 (G) in CD95 +CD4 T cells at P1w2.
Figure 4 with 1 supplement
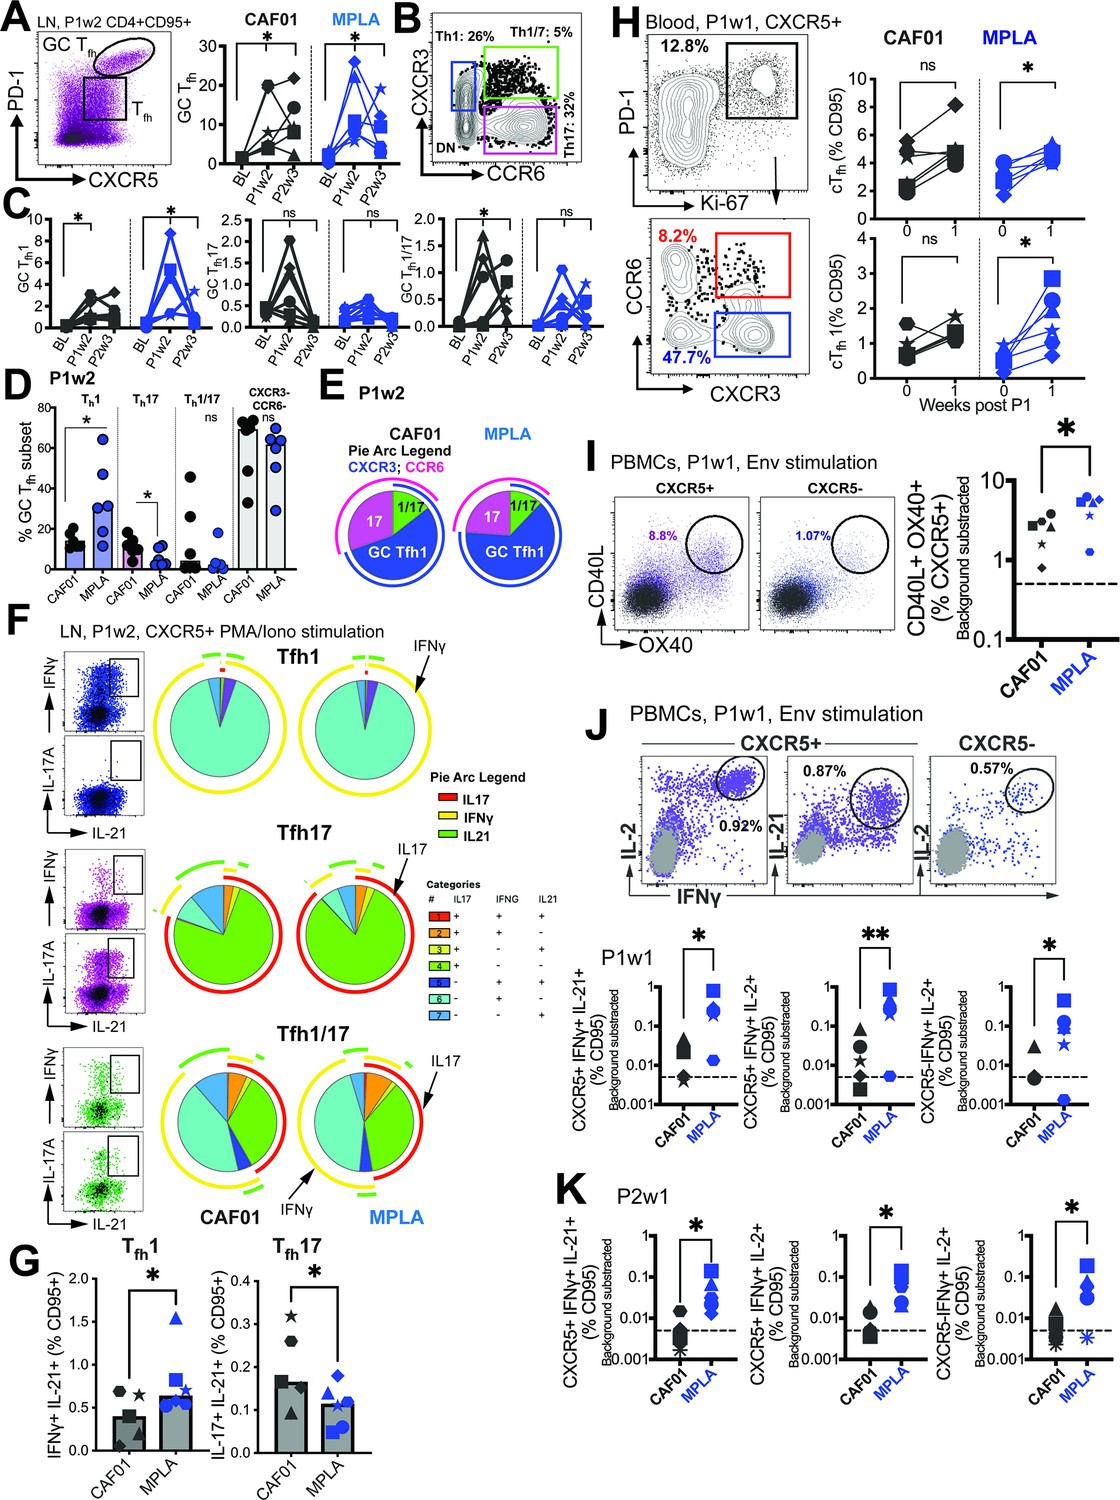
Phenotypically and functionally specialized GC Tfh1 /Tfh17 subsets elicited with HIV-1 Env Formulated in CAF01 and MPLA +QS-21 Adjuvants.
(A) Representative flow cytometry plot illustrates GC Tfh cells and GC Tfh frequencies (%CD95) show in kinetic plot to right. (B) Flow cytometry plot shows identification of GC Tfh1, Tfh17, and Tfh1/17 cells with (C) temporal kinetics expressed as %CD95+. Significance indicates differences in GC Tfh subsets at P1 and P2 relative to baseline. (D) Proportion of Tfh1, Tfh17, Tfh1/7 and CXCR3-, CCR6- GC Tfh cells across CAF01 and MPLA at P1w2. (E) Boolean analysis (n=6 each group) shows proportion of Th1, Th17 and Th1/17 GC Tfh subsets. (F–G) Intracellular cytokine staining (ICS) analysis of Th1, Tfh17, Tfh1/17 subsets at P1w2. (H) Gating strategy (left) and frequencies (right) of circulating Tfh (cTfh) and cTfh1 cells in whole blood at P1w0 and P1w1. (I) Gating strategy (left) and frequencies (right) of activated (CD40L+OX40+) cTfh (CXCR5+) and non-cTfh CD4 T cells (CXCR5-) cells in PBMCs at P1w1. (J) ICS of cTfh and non-cTfh CD4 T cells following Env stimulation at P1w1 and P2w1. Data points show individual animals. Statistical analysis was performed using two-tailed Wilcoxon matched-pairs signed rank test (in panels A, C, H) or Mann-Whitney U test (in panels D; G, I–K); * p<0.05, **p<0.01.
Figure 4—figure supplement 1

Gating strategy to identify GC Tfh and Tfh cells in lymph nodes.
(A) Illustrates gating strategy to identify GC Tfh cells. (B) Frequencies of Tfh cells (CD4+CD95+PD-1+CXCR5+) (Top), Tfh1 cells (CD4+CD95+PD-1+CXCR5+CXCR3+) (Middle), and Tfh1/17 cells (CD4+CD95+PD-1+CXCR5+CXCR3+CCR6+) in lymph nodes. (C) Intracellular cytokine staining (ICS) to identify Env-specific Tfh cells. (D) Co-expression of IL-2 and TNFa in IFNG +versus IFNG- subsets producing IL-21. (E) Serum IL-21 post P1. (F) Gating of AIM assay.
Figure 5
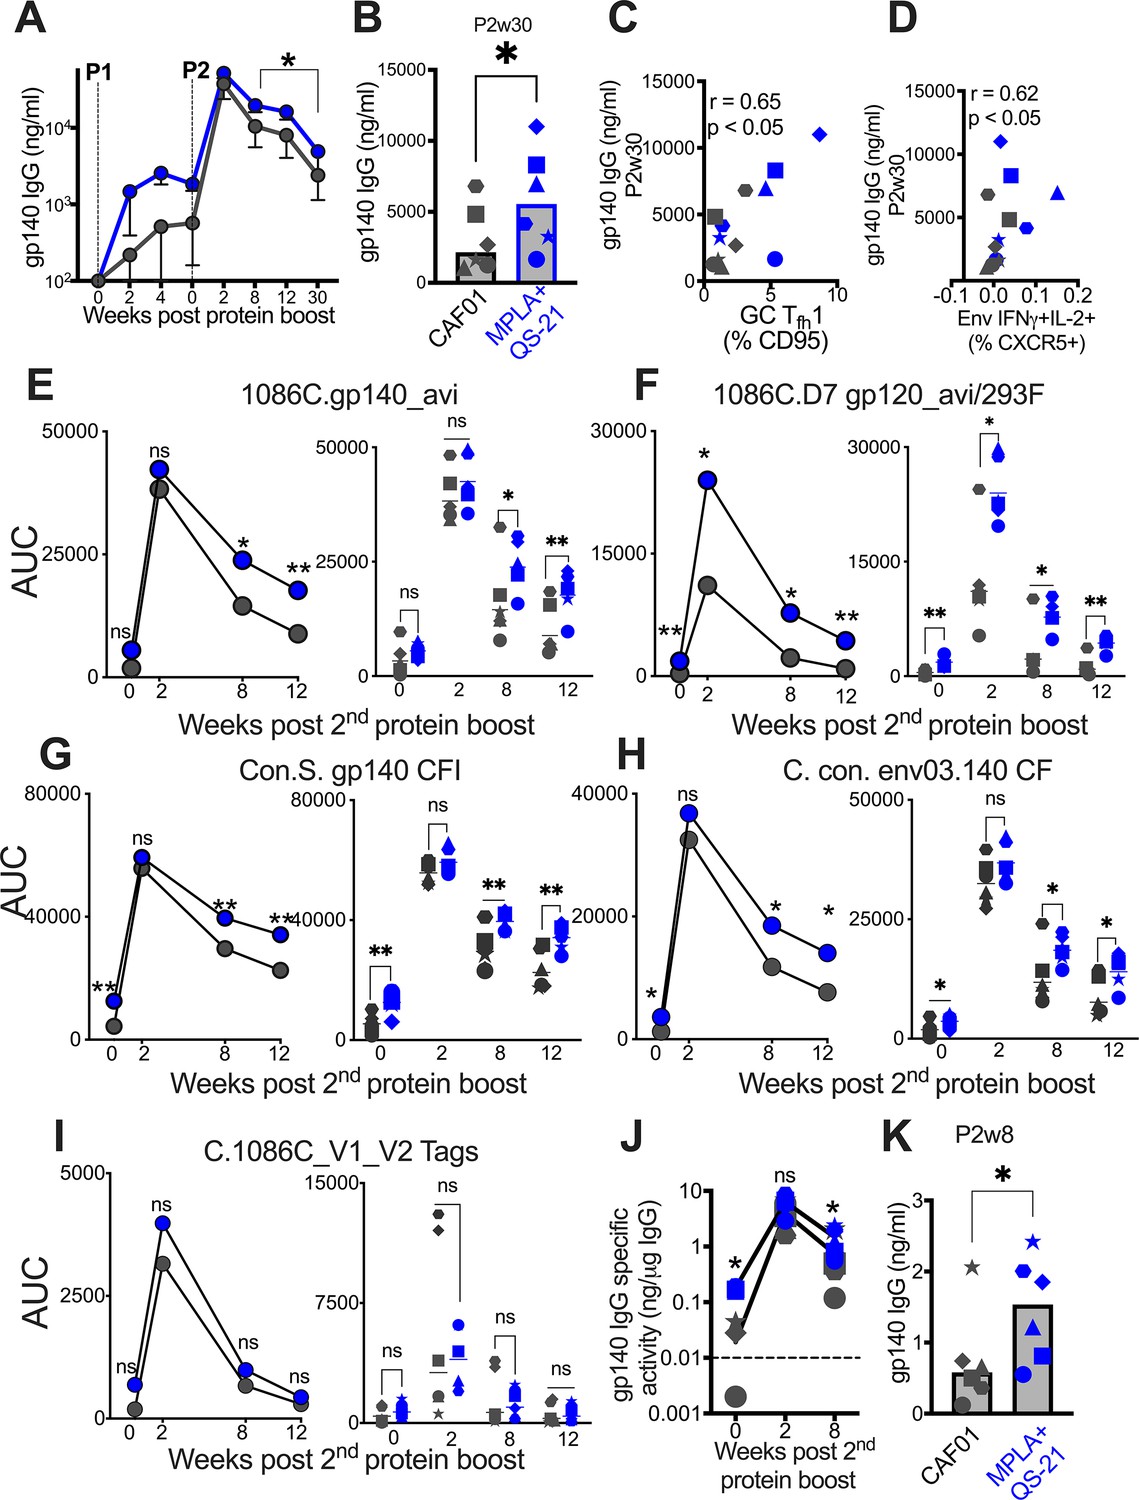
Induction of persistent anti-Env IgG antibodies with HIV-1 Env/MPLA +QS-21.
(A) Kinetics of HIV-1 Env IgG post protein boost (P1 and P2) across vaccine regimens measured by ELISA against C. 1086 gp140. (B) Serum gp140 IgG week 30 post P2w3. (C) GC Tfh1 cells correlate with gp140 IgG at week 30. (D) Env-specific (IFN-g+IL-2+) Tfh cells correlate with gp140 IgG at week 30. (E–I) Area under the curve (AUC) values of IgG temporally shown by antigens, as indicated. (J) Temporal and (K) week 8 measures of gp140-specific IgG levels relative to total IgG in rectal secretions. Data points show individual animals. Statistical analysis was performed using Mann-Whitney U test (in panels A-B, E–K), or two-tailed Spearman rank correlation test (C–D); * p<0.05, **p<0.01.
Figure 6 with 1 supplement
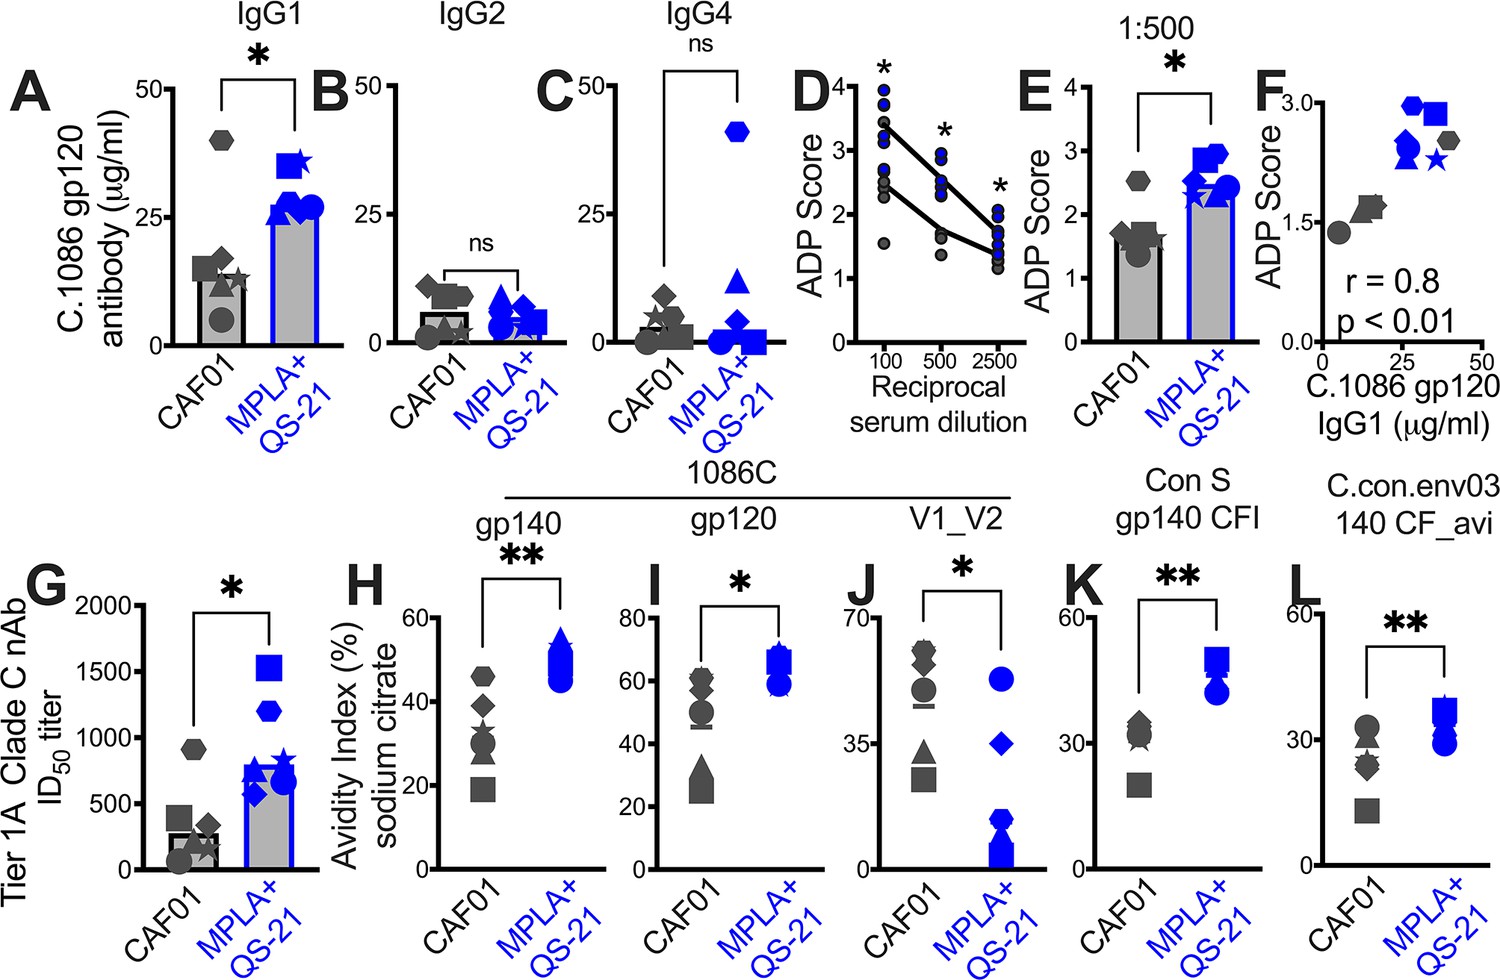
Induction of IgG1 subclass antibodies with greater effector functions with HIV-1 Env/MPLA +QS-21.
Serum C. 1086 gp120-specific (A) IgG1, (B) IgG2 (C) IgG4 antibodies at P2w2. (D–E) Antibody-dependent phagocytosis (ADP) score at P2w8. (F) C. 1086 gp120-specific IgG1 correlates with ADP score. (G) Infectious dose 50% (ID50) titers to Tier 1 A Clade C MW965.26 HIV-1 isolate at P2w2. (H–L) Avidity index (with sodium citrate) across vaccine regimens against specific antigens at P2w8. Data points show individual animals. Statistical analysis was performed using two-tailed Mann-Whitney U test (in panels A-E; G–L), or two-tailed Spearman rank correlation test (F); * p<0.05, **p<0.01.
Figure 6—figure supplement 1

Serum C. 1086 gp120-specific IgG1 (grey), IgG2 (pink), and IgG4 (black) in animals (x-axis – animal IDs) P2w3.
Figure 7 with 1 supplement
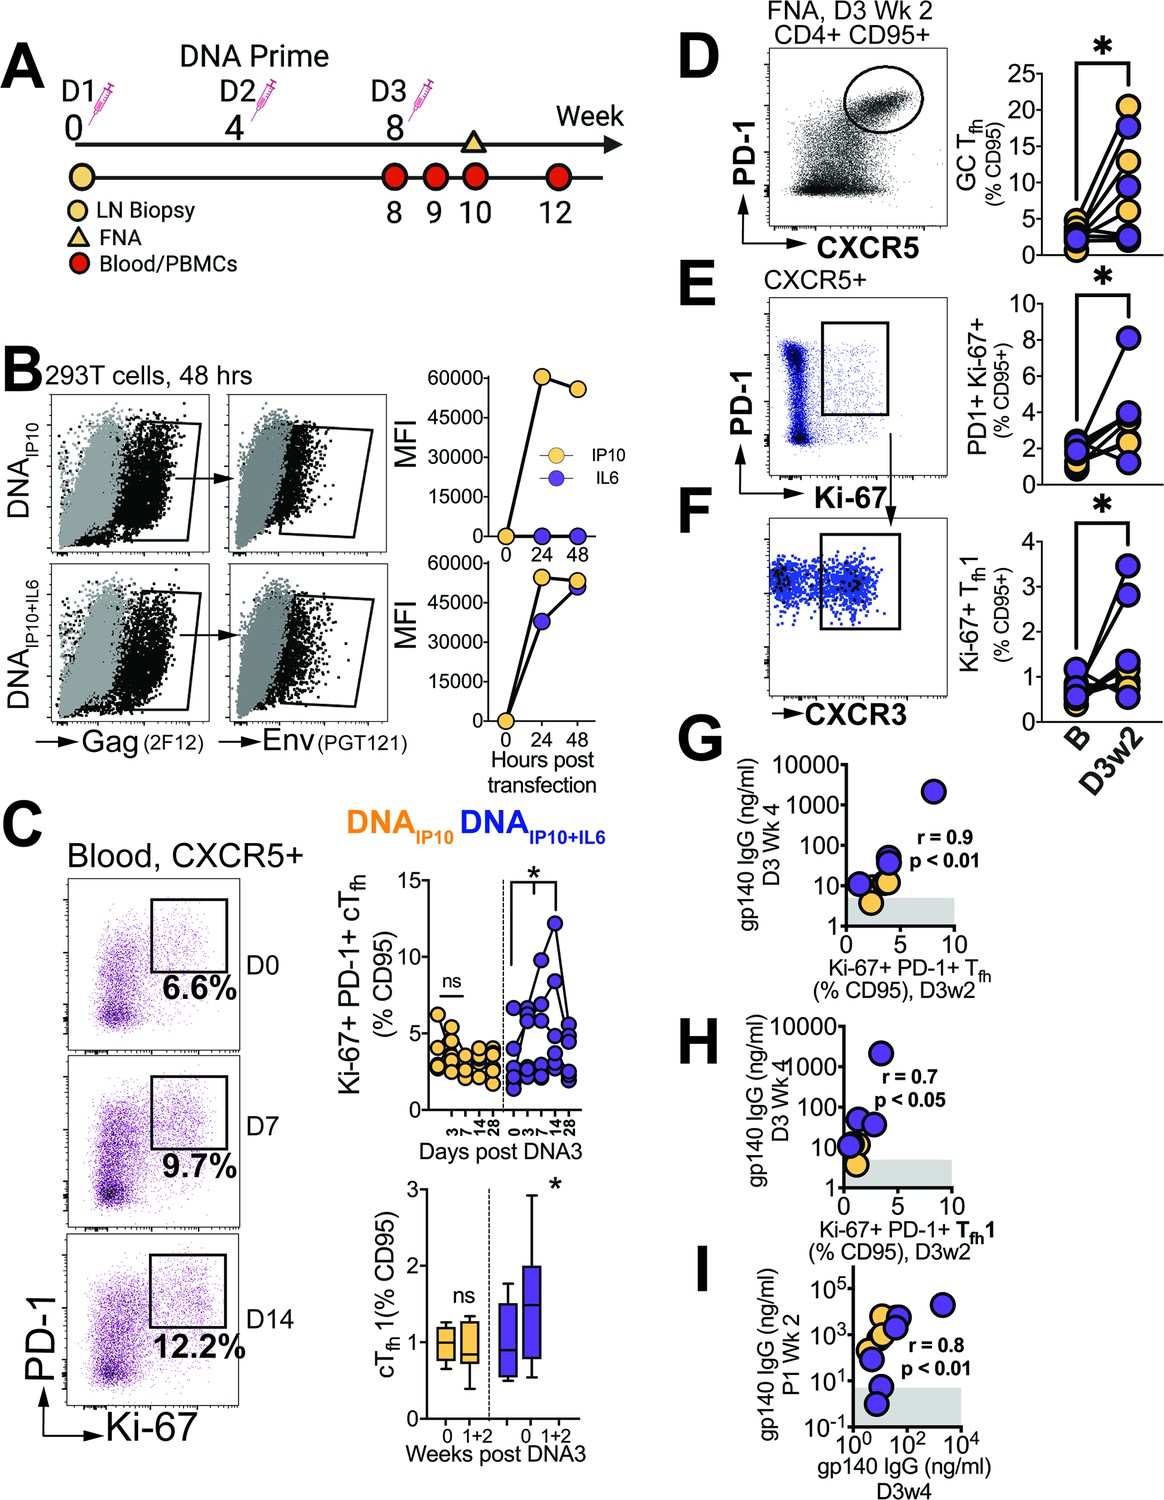
Differentiation of GC Tfh Subsets initiated during the DNA priming phase.
(A) Experimental design of DNA immunization phase; FNA, lymph node fine needle aspirates. (B) Intracellular expression of Gag (2F12), surface expression of HIV-1 Env (PGT121) and IP10 and IL6 in supernatants of transfected 293T cells. (C) Flow cytometry plots show activated (PD-1+Ki-67+) cTfh cells, frequencies post DNA3 (right top); frequencies of cTfh1 cells (right bottom). (D) GC Tfh cells, (E) Ki-67+ PD1+ cells of CXCR5 +subset in lymph node. (F) CXCR3 +subset of Ki-67+ PD-1+ CXCR5+ subset. (G) Ki-67 +PD-1+Tfh in LN correlate with gp140 IgG at week 4 post DNA3. (H) Ki-67 +PD-1+Tfh1 in LN correlate with gp140 IgG at week 4 post DNA. (I) gp140 IgG at week 2 post P1 correlates with gp140 IgG at week 4 post DNA3. Data points show individual animals. Statistical analysis was performed using one-tailed Wilcoxon matched-pairs signed rank test (in panels C-F), or Spearman rank correlation test (G–I); * p<0.05.
Figure 7—figure supplement 1
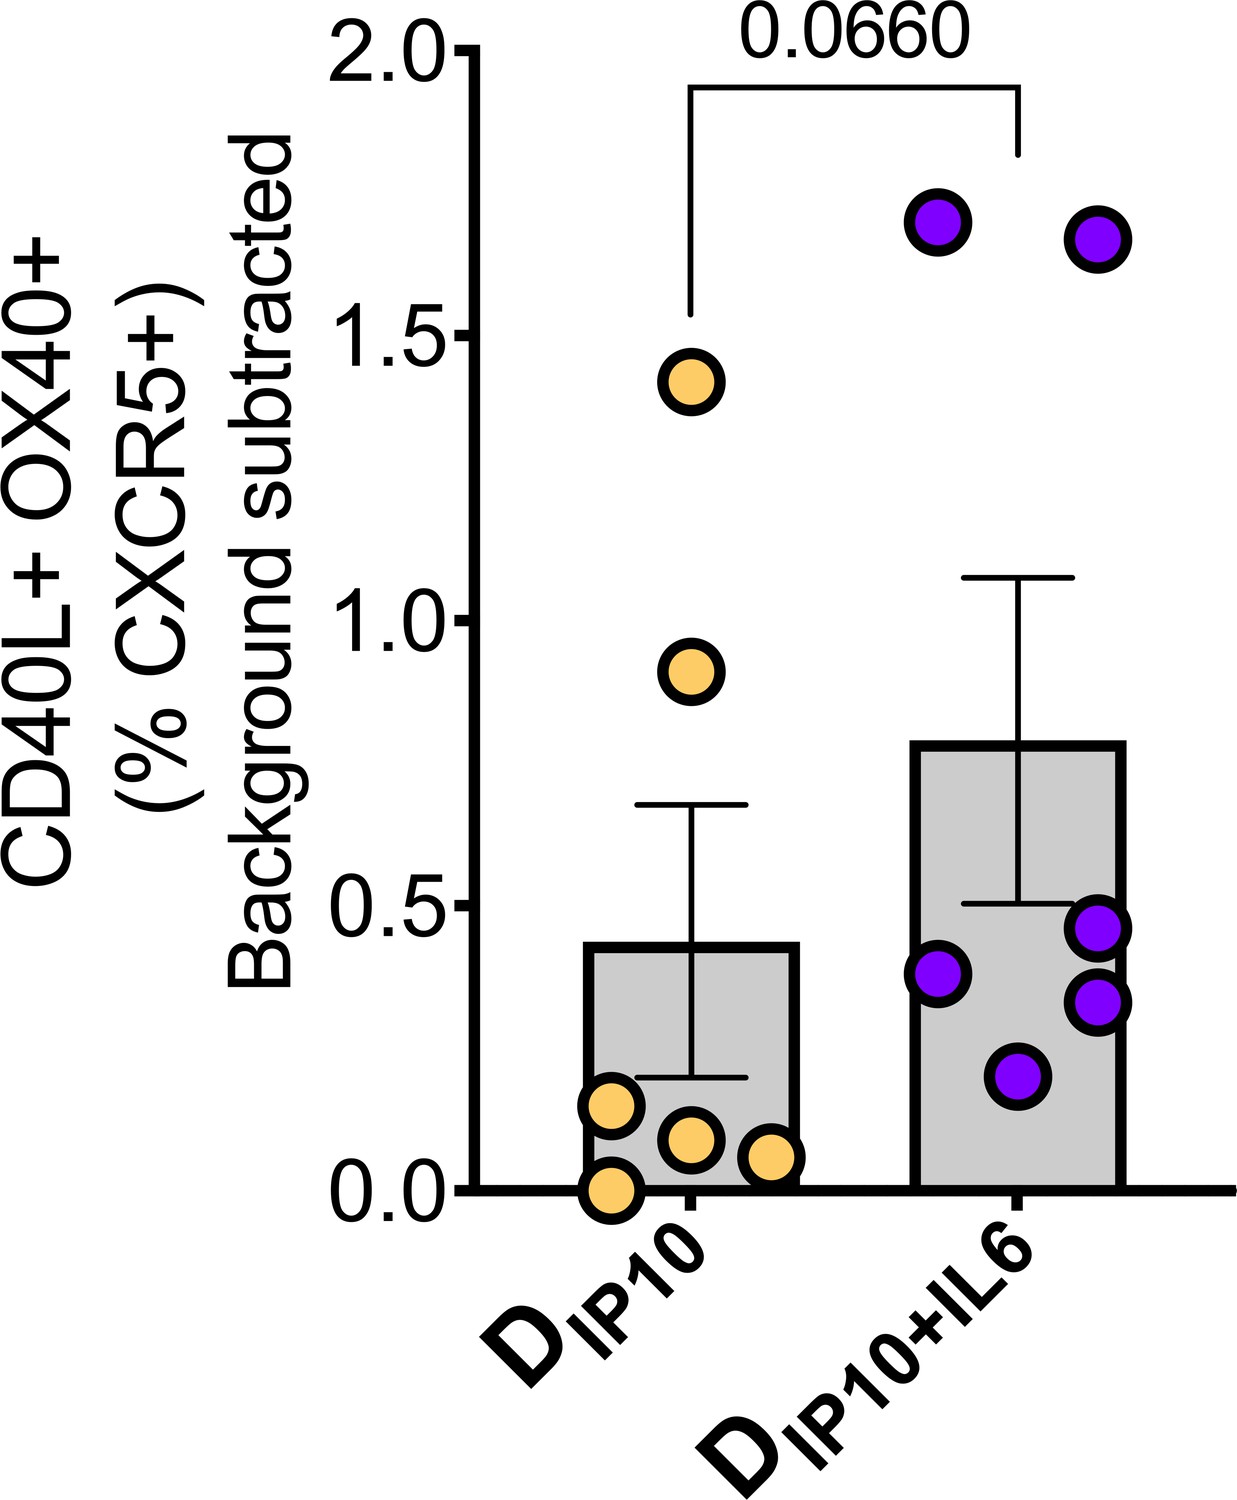
Frequencies of OX40+CD40L+ cTfh cells stimulated ex vivo with Gag and Env.
Tables
Table 1
Flow cytometry antibodies.
| Antibody name | Panel | Vendor | Catalog number/Identifier |
|---|---|---|---|
| Mouse anti-human CD3 (Clone SP34-2) | TFH/AIM/ICS | BD Biosciences | Cat#557917; RRID: AB_396938 |
| Mouse anti-human CD4 (Clone L200) | TFH/AIM/ICS | BD Biosciences | Cat#563737; RRID: AB2687486 |
| Mouse anti-human CD8 (Clone SK-1) | TFH/AIM/ICS | BD Biosciences | Cat#564913; RRID: AB_2833078 |
| Mouse anti-human CD14 (Clone MSE2) | TFH Panel | BioLegend | Cat#301822; RRID: AB_493747 |
| Mouse anti-human CD16 (Clone 3G8) | TFH Panel | BD Biosciences | Cat#563172; RRID: AB_2744297 |
| Mouse anti-human CD20 (Clone 2H7) | TFH Panel | BioLegend | Cat#302314; RRID: AB_314262 |
| Mouse anti-human CD69 (Clone FN50) | TFH Panel | BioLegend | Cat#310944; RRID: AB_2566466 |
| Mouse anti-human CD95 (Clone DX2) | TFH/AIM/ICS | BioLegend | Cat#564710; RRID: AB_2738907 |
| Mouse anti-human CXCR3 (CD183) (Clone 1C6) | TFH Panel | BD Biosciences | Cat# 550967; RRID: AB_398481 |
| Mouse anti-human CXCR5 (CD185) (Clone MU5UBEE) | TFH/AIM/ICS | eBioscience | Cat#12-9185-42; RRID: AB_11219877 |
| Mouse anti-human CCR6 (CD196) (Clone G034E3) | TFH Panel | BioLegend | Cat#353430; RRID: AB_2564233 |
| Armenian Hamster anti- ICOS (CD278) (Clone C396.4A) | TFH Panel | BioLegend | Cat#313534; RRID: AB_2629729 |
| PECy7 anti-human PD1 (CD279) (Clone EH12.2H8) | TFH Panel | BioLegend | Cat# 329918, RRID: AB_2159324 |
| Mouse anti-human Bcl-6 (Clone K112-91) | TFH Panel | BD Biosciences | Cat# 563581 |
| Mouse anti-Ki-67 (Clone B56) | TFH Panel | BD Biosciences | Cat#558616; RRID: AB_10611866 |
| Mouse anti-human CD25 (Clone BC96) | AIM assay | eBioscience | Cat#53-0259-42 RRID: AB_2043827 |
| Mouse anti-human CD134 (OX-40) (Clone L106) | AIM assay | BD Biosciences | Cat#744746; RRID: AB_2742454 |
| Mouse anti-human CD137 (4-1BB) (Clone 4B4-1) | AIM assay | BioLegend | Cat# 309826; RRID: AB_2566260 |
| Mouse anti-human CD154 (CD40L) (Clone 24–31) | AIM assay | eBioscience | Cat#17154842 RRID:AB_1582215 |
| Mouse anti-human TNF-α (Clone Mab11) | ICS assay | BioLegend | Cat# 502906; RRID: AB_315258 |
| Mouse anti-human IFNγ (Clone B27) | ICS assay | BioLegend | Cat# 506518; RRID: AB_2123321 |
| Mouse anti-human IL2 (Clone MO1-17H12) | ICS assay | BioLegend | Cat# 500344; RRID: AB_2564091 |
| Mouse anti-human IL-17 (Clone eBio64DEC17) | ICS assay | eBioscience | Cat# 48-7179-42; RRID: AB_10853643 |
| Mouse anti-human IL-21 (Clone 3A3-N2.1) | ICS assay | BD Biosciences | Cat# 560493; RRID: AB_1645421 |
| APC-Cy7 live/dead | Life Technologies | Cat#L34976 | |
| BV510 live/dead | Life Technologies | Cat#L34966 |
Table 2
Samples for RNA seq and Spatial profiling.
| S.No | Animals ID | Vaccine group | Lymph node collection time points and cells used for | ||
|---|---|---|---|---|---|
| Baseline (WK0) | Week2 post 1st protein boost | Week3 post 2nd protein boost | |||
| 1 | 47161 | MPLA +QS-21 | RNA seq | RNA seq | RNA seq |
| 2 | 45781 | MPLA +QS-21 | Spatial profiling | Spatial profiling | Spatial profiling |
| 3 | 46235 | MPLA +QS-21 | Spatial profiling | Spatial profiling | Spatial profiling |
| 4 | 46551 | MPLA +QS-21 | Spatial profiling | Spatial profiling | Spatial profiling |
| 5 | 46548 | MPLA +QS-21 | RNA seq | RNA seq | RNA seq |
| 6 | 47081 | MPLA +QS-21 | RNA seq | RNA seq | RNA seq |
| 7 | 45721 | CAF01 | RNA seq +Spatial profiling | RNA seq +Spatial profiling | RNA seq +Spatial profiling |
| 8 | 47154 | CAF01 | NA | NA | NA |
| 9 | 46410 | CAF01 | Spatial profiling | Spatial profiling | Spatial profiling |
| 10 | 46354 | CAF01 | RNA seq | RNA seq | RNA seq |
| 11 | 47466 | CAF01 | RNA seq | RNA seq | RNA seq |
| 12 | 47387 | CAF01 | Spatial profiling | Spatial profiling | Spatial profiling |
Additional files
Download links
A two-part list of links to download the article, or parts of the article, in various formats.
Downloads (link to download the article as PDF)
Open citations (links to open the citations from this article in various online reference manager services)
Cite this article (links to download the citations from this article in formats compatible with various reference manager tools)
Tailoring Tfh profiles enhances antibody persistence to a clade C HIV-1 vaccine in rhesus macaques
eLife 12:RP89395.
https://doi.org/10.7554/eLife.89395.3


