Mechanical activation of TWIK-related potassium channel by nanoscopic movement and rapid second messenger signaling
- Departments of Molecular Medicine, The Scripps Research Institute, Scripps, United States
- Scripps Research Skaggs Graduate School of Chemical and Biological Science, The Scripps Research Institute, Scripps,, United States
- Division of Endocrinology and Metabolism, Center for Brain Immunology and Glia, Department of Neuroscience, University of Virginia, United States
- Department of Neuroscience, The Scripps Research Institute, Scripps, United States
- Center on Aging,The Scripps Research Institute, Scripps, United States
- Department of Biology, Howard Hughes Medical Institute, University of Utah, United States
Figures
Figure 1 with 2 supplements
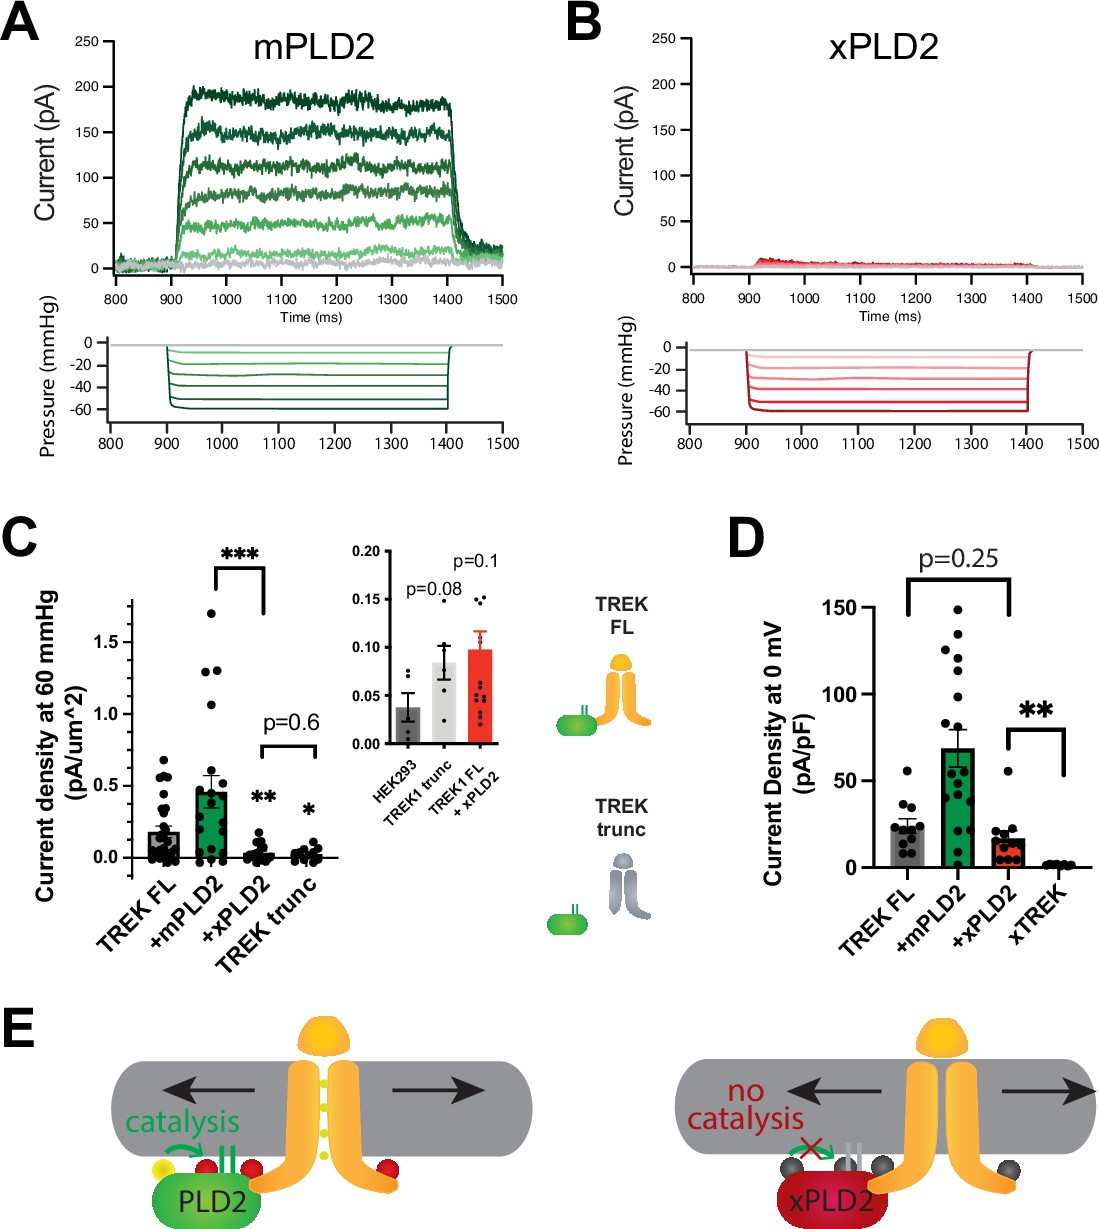
PLD2-dependent and independent mechanical activation of TREK-1 channels.
(A, B) Representative traces from pulled patches of human TREK-1 overexpressed in HEK293T cells with mouse phospholipase D2 (mPLD2, green traces) (A) or catalytically inactive mouse PLD2 (xPLD2, red) (B) under pressure clamp (0–60 mmHg at +30 mV). (C) The data, after subtracting HEK293T background current (0.04 ± 0.02 pA/µm2 n = 5 [inset]), are summarized for –60 mmHg. Compared to endogenous PLD2, the expression of xPLD2 eliminated the majority of detectible TREK-1 pressure current (p<0.007, n = 16–23), as did a functional truncated TREK-1 (TREK trunc) lacking the PLD2 binding site (p=0.002, n = 15–23). The inset compares mock-transfected HEK293T cells with TREK trunc and full-length TREK-1 (TREK FL)+xPLD2, indicative of direct TREK-1 activation. Asterisks indicate significance relative to TREK FL, except where noted by a bar. (D) Whole-cell TREK-1 potassium currents with and without xPLD2. TREK-1 is expressed and functional in the presence of xPLD2. A nonfunctional C-terminal truncation (C321) of TREK-1 (xTREK) is shown with no appreciable current HEK293T cells. (E) Cartoon illustrating PLD2-dependent TREK-1 opening in HEK293T cellular membrane. On the left, membrane stretch (black arrows) mechanically activates PLD2. When PLD2 is active, it makes phosphatidic acid (PA), which evokes the open state of TREK-1. On the right, in the absence of mechanically generated PA, the closed channels remain closed despite the presence of membrane tension. Statistical comparisons were made with an unpaired Student’s t-test.
Figure 1—figure supplement 1
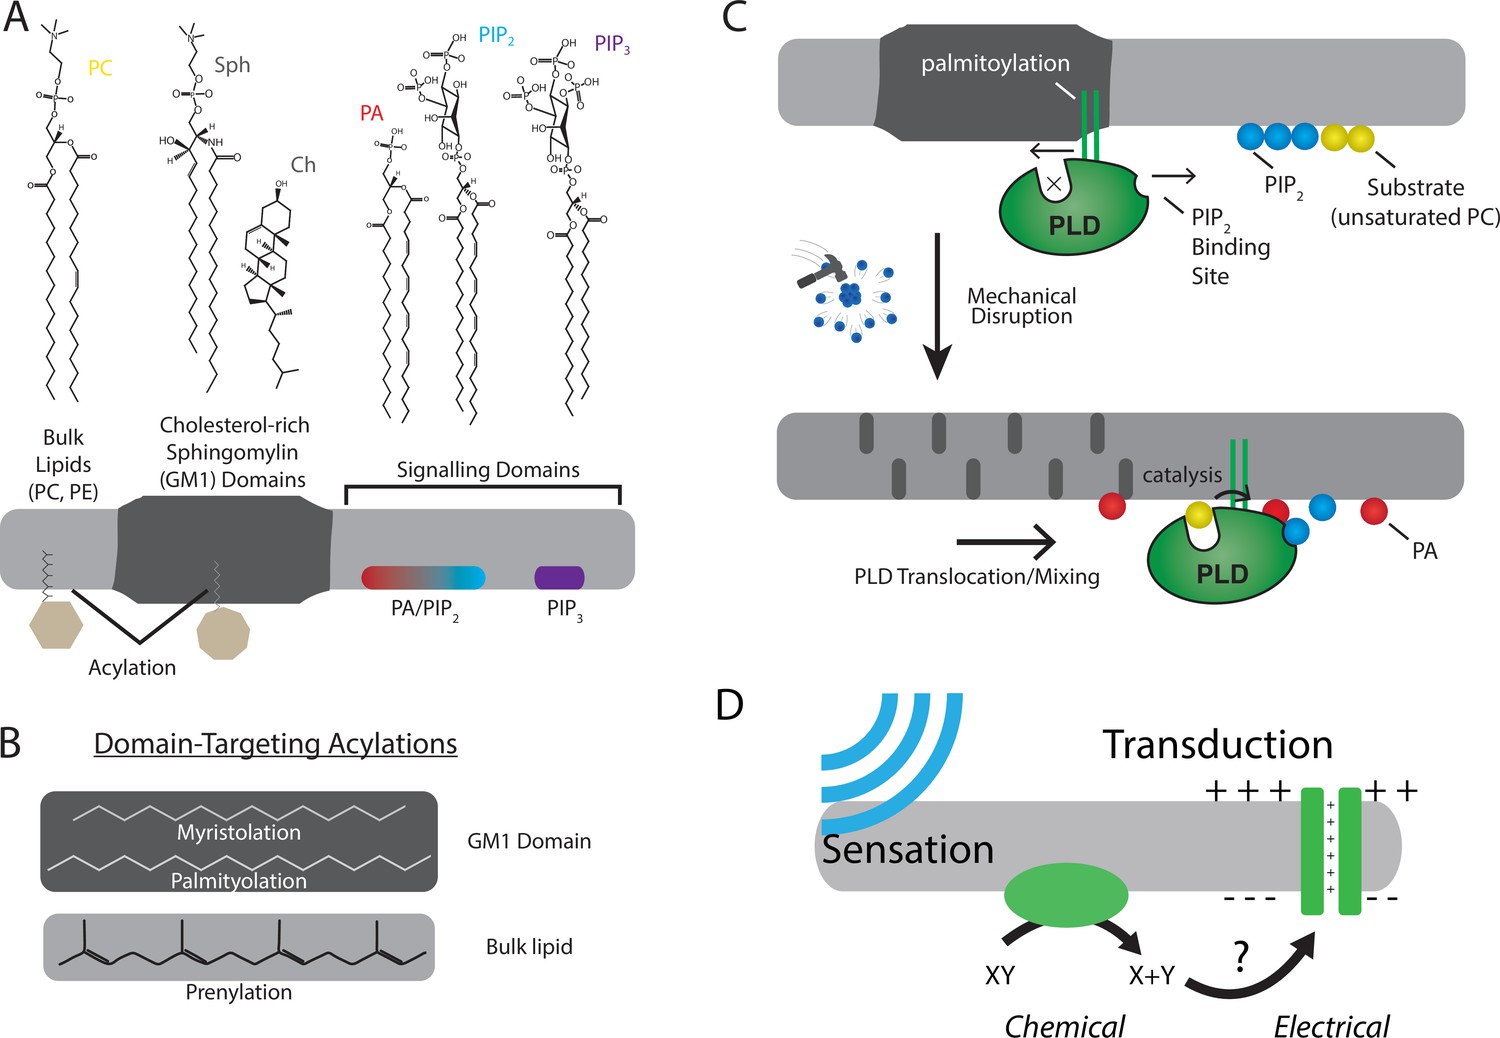
The role of lipids and lipid order in mechanotransduction.
(A) The plasma membrane is composed of lipids that can cluster into separate and distinct domains with unique properties such as thickness and charge. Domains for saturated gangliosides (GM1) are shown separate from phosphatidylinositol 4,5-bisphosphate (PIP2) and phosphatidylinositol 3,4,5 triphosphate (PIP3). These domains contain proteins that are targeted to the domain through post-translational acylation. (B) The types of acylation are shown along with their targeting location. (C, top) The enzyme phospholipase D2 (PLD2, green) is shown with its acylation that binds to the saturated ordered site in GM1. The site discriminates palmitoylated proteins from prenylated proteins. This is called the anesthetic/palmitate (AP) site because anesthetics also compete for this site (not shown) (Pavel et al., 2020; Petersen et al., 2020). (C, bottom) Upon chemical or mechanical disruption of the domain, the binding site is disrupted releasing PLD2 from the AP site. PLD2 is then free to bind PIP2 where it has access to its substrate phosphatidylcholine (PC). (D) Cartoon depicting a mechanically evoked current through a chemical intermediate.
Figure 1—figure supplement 2
Electrophysiology details and methods.
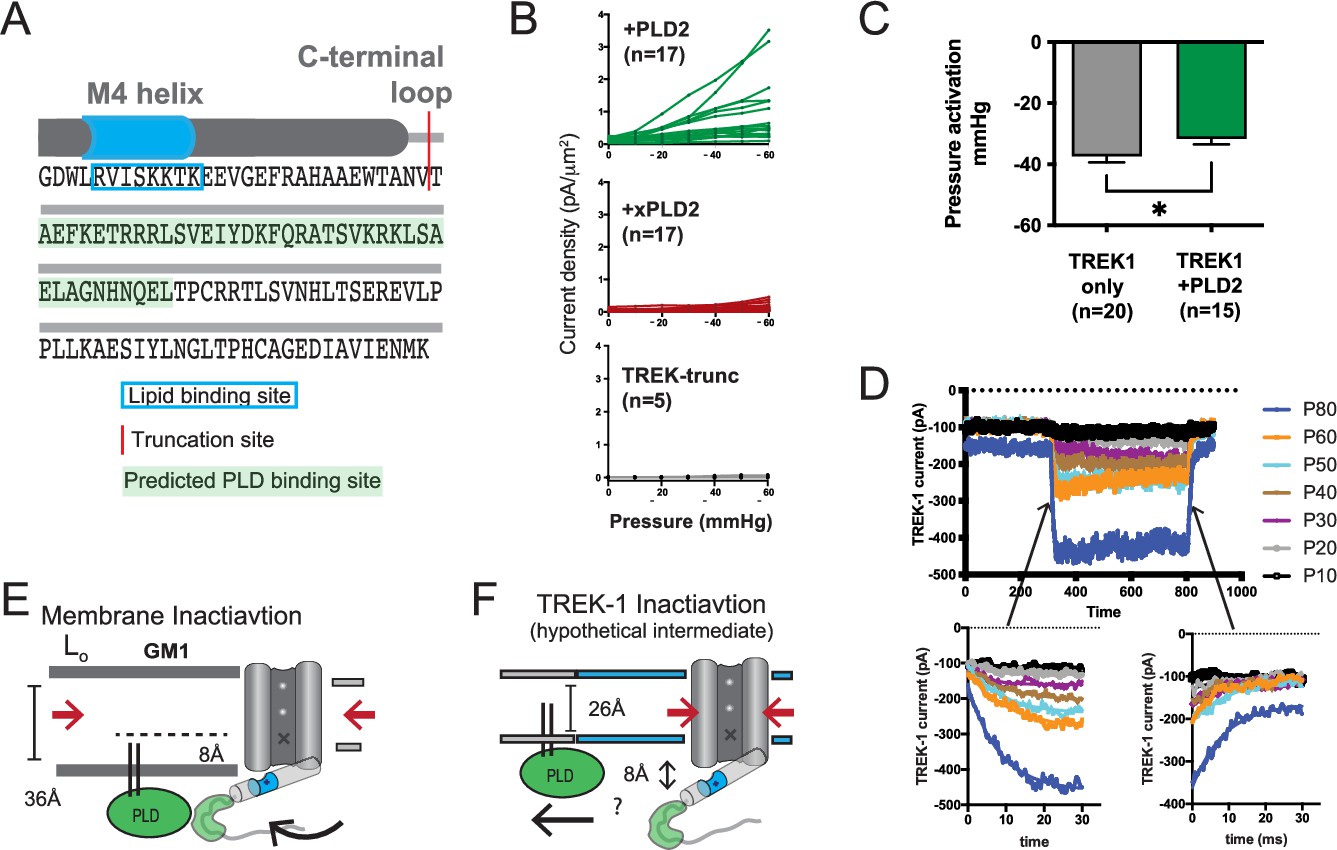
(A) Illustration depicting the C-terminal end of TREK-1. The red region indicates the truncation site used, and the predicted PLD binding site for PLD2 is highlighted. The last transmembrane helix (M4) is depicted as a gray cylinder, and the anionic lipid binding site is highlighted in blue. (B) Individual cell traces showing current densities (pA/µm2) for TREK-1 co-expressed with PLD2 (green), TREK-1 co-expressed with xPLD2 (red), and TREK-1 with a C-terminal truncation (TREK trunc, gray). (C) Half maximal TREK-1 pressure current within a non-saturating pressure range of 0–60 mmHg. Overexpression of PLD2 significantly reduces the apparent pressure required to activate TREK-1 (p<0.05, n = 15–20). (D) Representative cell recording displaying TREK-1 pressure currents in response to pressure steps from 0 to 60 mmHg, taken in 10 mmHg increments. The bottom-left panel illustrates the activation step, and the bottom-right panel shows the deactivation. Both activation and deactivation processes appear to occur within sub-5 ms time frames, near the limit of detection for the experimental setup. (E) Membrane inactivation process. After mechanical stretching, the membrane relaxes, allowing the palmitates from PLD2, to re-associate with the GM1 lipids. Consequently, TREK is drawn into GM1 clusters through its interaction with PLD2. In the absence of phosphatidic acid (PA) and due to an increased hydrophobic thickness of the membrane, the channel’s gate assumes the down (closed) position, marked with an ‘X’. (F) Direct inactivation of TREK-1 through an intermediate. Upon reversal of mechanical stretch (relaxation of the membrane), the channel may transition into a closed conformation due to direct pressure exerted on the channel (indicated by the large red arrows). In a thin membrane, this action could displace the gating helix up to 8 Å away from the membrane, disrupting the PLD2/TREK-1 interaction. This putative intermediate state is expected to be transient as TREK-1 would likely re-associate in thicker lipid regions.
Figure 2 with 2 supplements
Shear induces nanoscopic movement of TREK-1 in HEK293T cells.
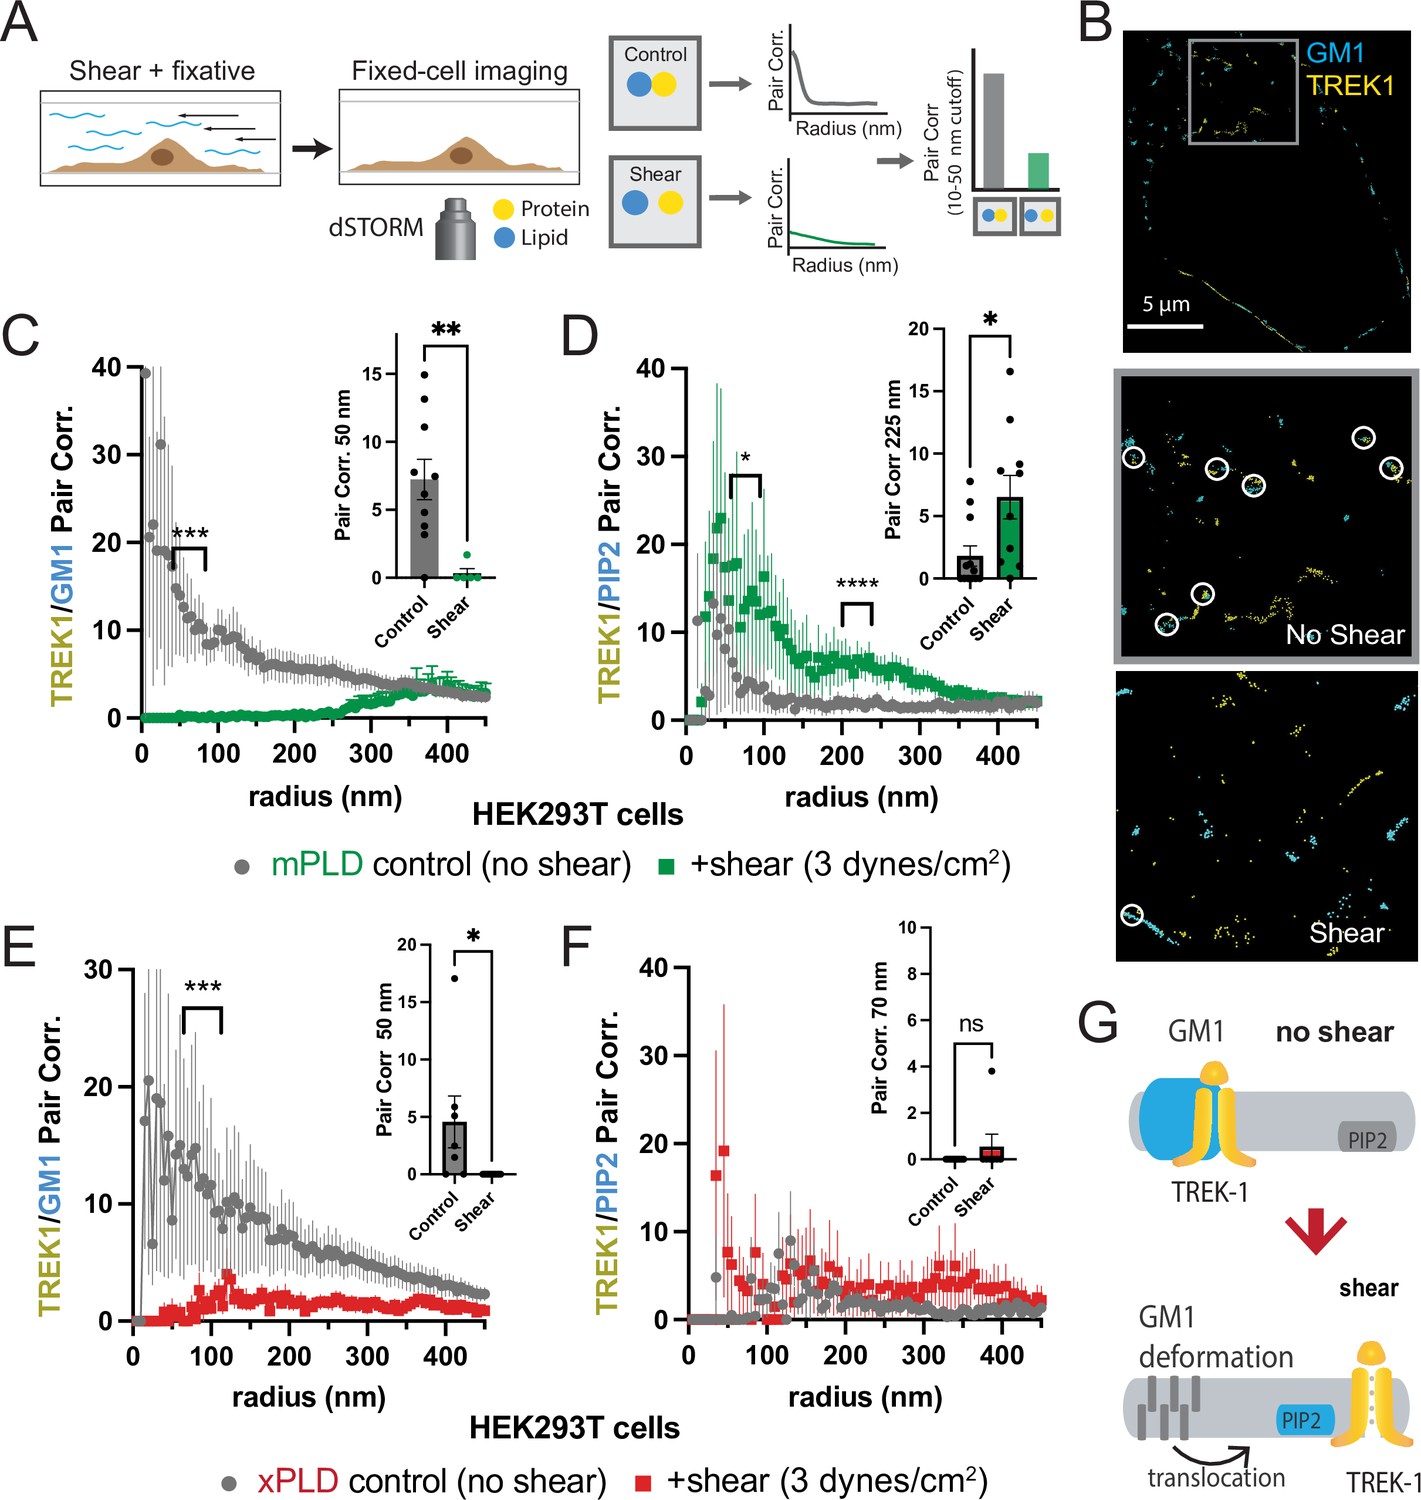
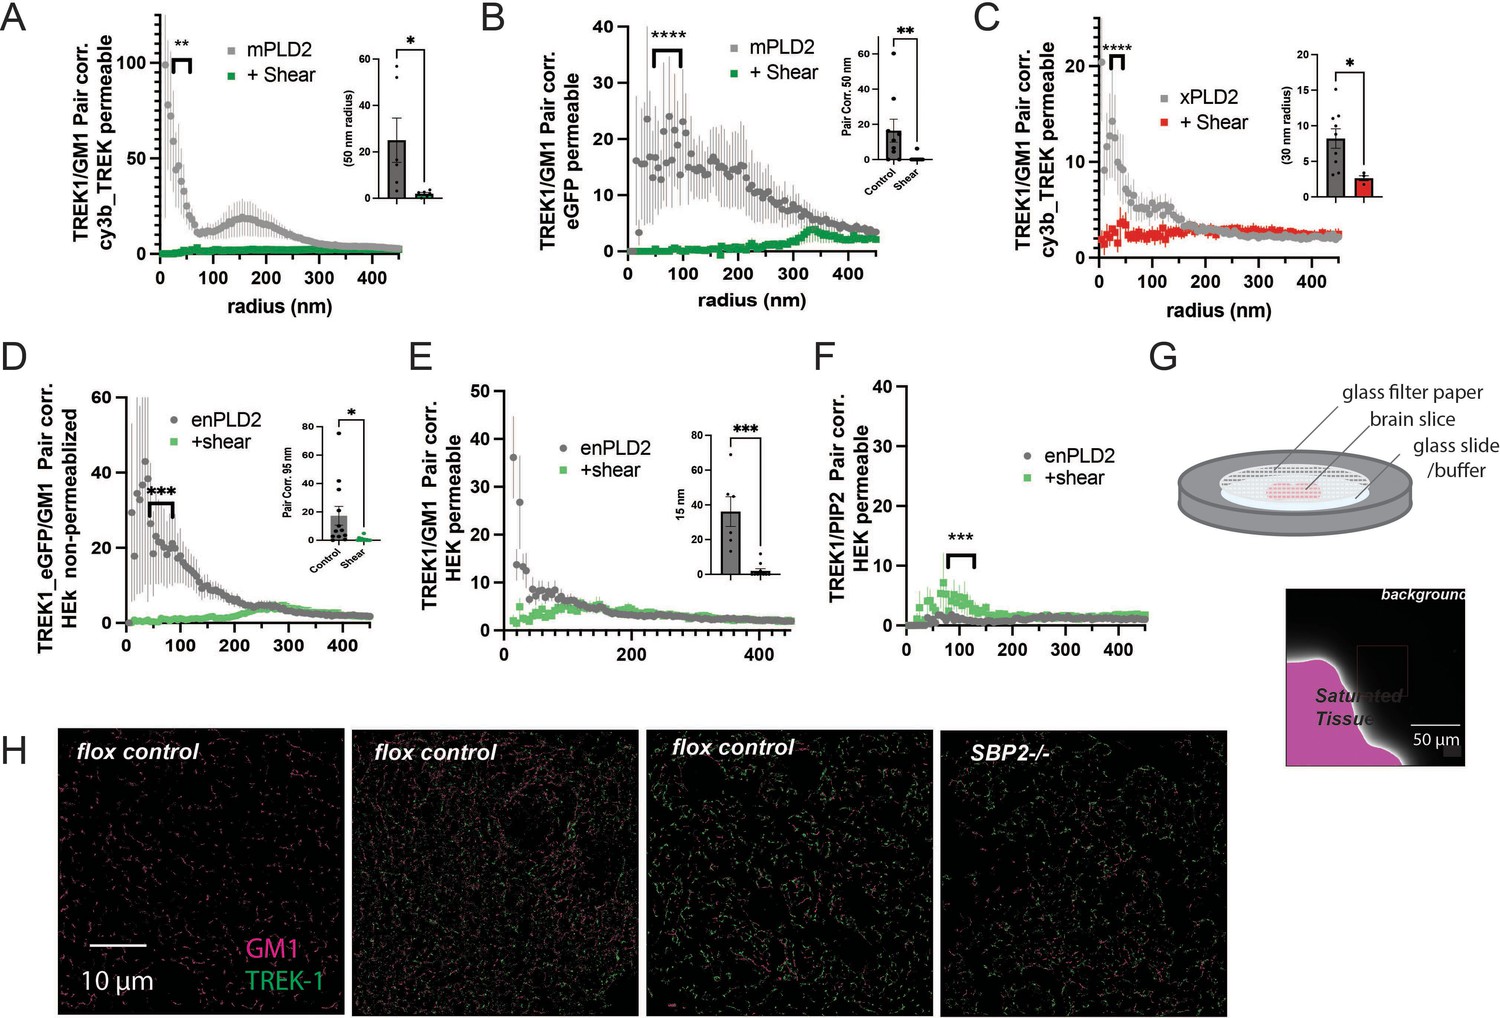
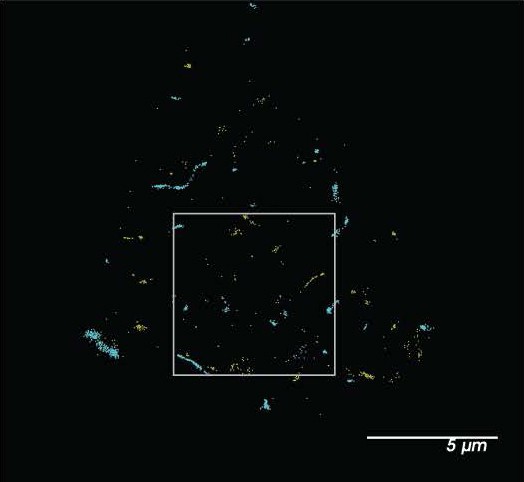
(A) Schematic representation of the shear fixing protocol. Cells grown in a shear chamber are fixed while shear force is applied. Fixed samples are then labeled with fluorescent antibodies or CTxB and subjected to imaging for nanoscopic movement (<250 nm) by two-color super-resolution imaging and pair correlation (Pair corr.). (B) EGFP-STORM imaging of TREK-1:EGFP and Alexa 647 cholera toxin B (CTxB) with and without shear in HEK293T cells. The middle panel, outlined in gray, is a zoomed portion of the cell surface outlined in the top panel. The bottom panel is a zoomed portion of the cell surface from a cell treated with shear (see Figure 2—figure supplement 1I for full image). Locations of TREK-1/GM1 proximity are outlined with a white circle. (C) Pair correlation analysis (Pair corr.) of TREK-1 with GM1 lipids before and after shear (3 dynes/cm2; green) determined by EGFP-STORM imaging when mouse phospholipase D2 (mPLD2) is overexpressed (non-permeabilized). The significance of the Pair corr. change is shown across the range of radii 50–70 nm (along the curve) and at a single 50 nm radius (inset). (D) Combined EGFP-STORM imaging of TREK-1 with Alexa 647-labeled PIP2 in the presence of overexpressed mPLD2 (permeabilized). Significance is shown for radii 70–85 nm along the curve and at a single 225 nm radius (inset). (E, F) Combined EGFP-STORM of TREK-1 in the presence of catalytically inactive PLD2 (xPLD2). Shear (3 dynes/cm2) of TREK-1 is shown as a red curve with xPLD2 present. The experiments are as described in panels (C) and (D). In (E) a significant shift in TREK-1/GM1 Pair corr. is shown for 50–70 nm (along the curve) and at a 50 nm radius (inset). In (F) Pair corr. did not appear to shift significantly, as determined by a Student’s t-test or for multiple point a nested Student’s t-test; *p<0.05, **p<0.01, ***p<0.001, ****p<0.0001. (G) Cartoon illustrating the association of TREK-1 with GM1 lipids prior to shear (top) and with PIP2 lipids (bottom) in response to mechanical shear (red arrow).
Figure 2—figure supplement 1
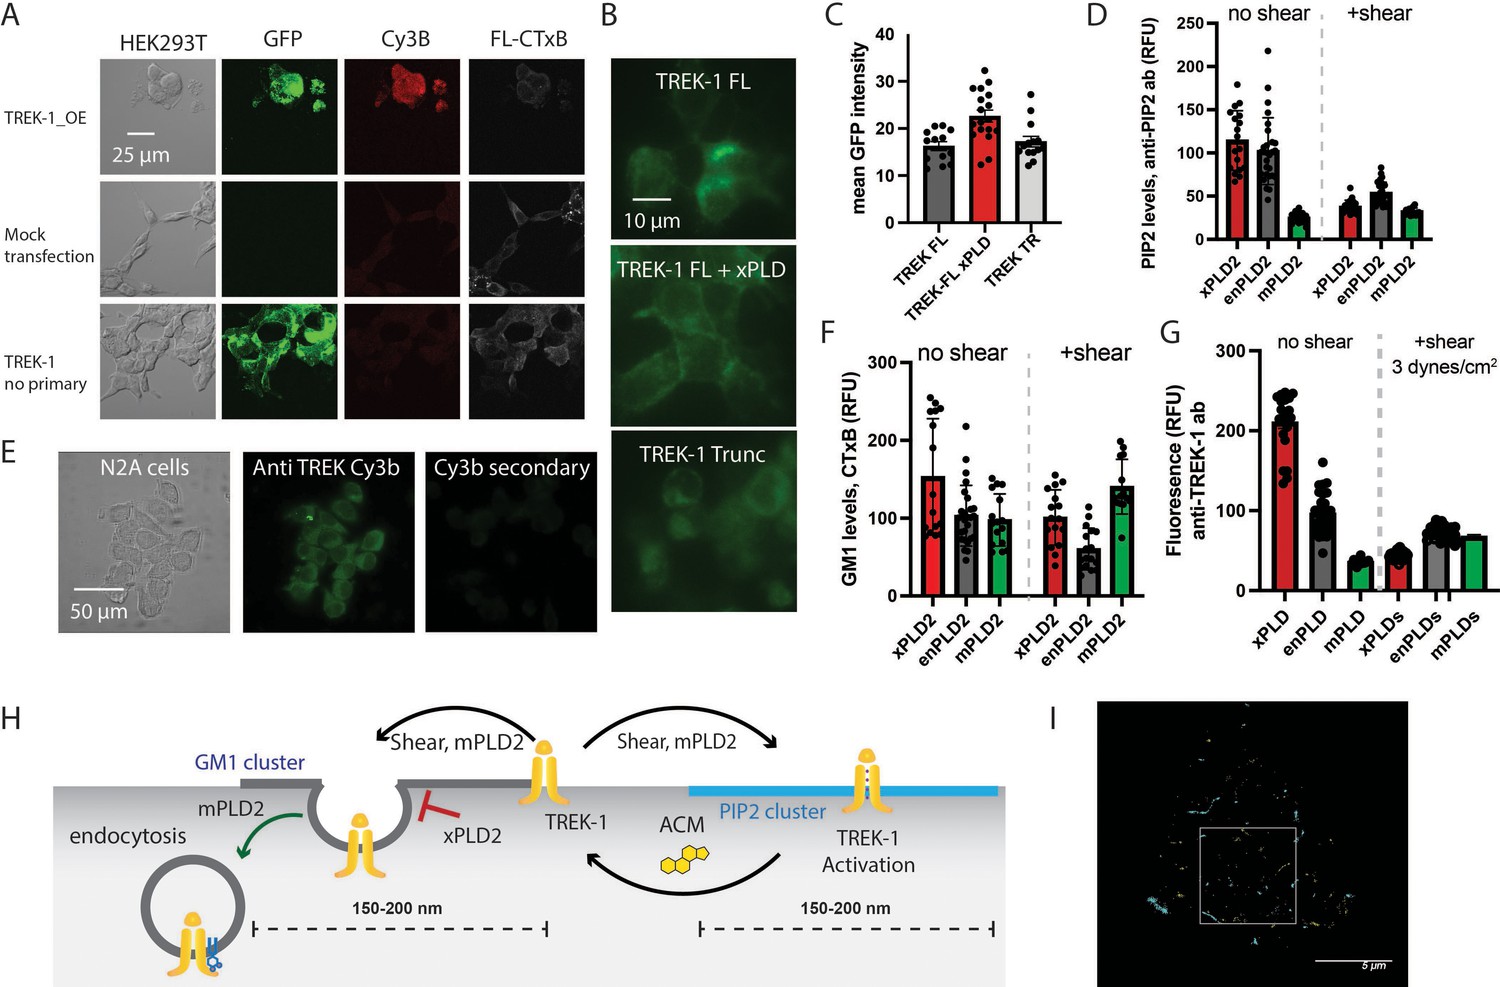
Expression and staining of TREK-1 in cell culture.
(A) Confocal images of HEK293T cells overexpressing human TREK-1 tagged with EGFP. The cells were fixed and stained with anti-TREK antibody, a secondary cy3b antibody (red) and A647 conjugated cholesterol toxin B (CTxB, gray) to label lipids. In the absence of transfection, no GFP signal is observed. A negative control, lacking the primary antibody, exhibits no fluorescence. (B) Visualization of TREK-1 overexpression in HEK293T cells prepared identical to the cells used for ecophysiology experiments in Figure 1. (C) Overexpression of catalytically inactive PLD2 (xPLD) appears to enhance TREK-1 expression. Truncating the c-terminus (TREK trunc) has no discernible effect on expression TREK-1 at the plasma membrane. (D) Shear and overexpression of mPLD2 reduce PIP2 levels on the plasma membrane. (E) Immunostaining of endogenous TREK-1 in neuroblastoma 2a (N2a) cells. (F) Both mPLD2 overexpression and shear dramatically reduced the amount of GM1 observed by fluorescent staining with cholera toxin B (CTxB). (G) Assessment of the impact of shear on TREK-1 levels in HEK293T cells. These cells were transfected with full-length TREK-1 (TREK FL) and either xPLD2 or mPLD2. After 24 hr, the cells were subjected to 3 dynes/cm2 rotary shear and fixed. Both PLD2 overexpression and shear resulted in a reduction of TREK-1 expression, likely due to endocytosis processes. (H) Cartoon illustrating the role of shear, PLD2, xPLD, in endocytosis. Shear and mPLD2 both activate TREK-1 and decrease TREK-1 surface levels. Presumably the decrease is due to endocytosis since mPLD2 and shear are known to increase endocytosis and xPLD2 is known to block endocytosis. (I) dSTORM images showcasing sheared HEK293T cells expressing TREK-1. The image corresponds to the cell depicted in Figure 2B. The highlighted box represents an expanded region of this image.
Figure 2—figure supplement 2
Comparisons of labeling type and permeabilization.
(A) Two-color dSTORM using a Cy3b-labeled TREK-1 antibody after mechanical shear in the presence of overexpressed mouse PLD2 (mPLD2) and full-length human TREK-1. HEK293T cells were fixed, permeabilized, and stained with a Cy3b-conjugated anti-TREK-1 antibody. Pair correlation (Pair corr.) analysis of TREK-1 with alexa-647-conjugated cholera toxin B (CTxB) was conducted via dSTORM, revealing a decrease in Pair corr. with 3 dynes/cm2 orbital fluid shear. (B) Similar experiments as in panel (A), but with Pair corr. analysis from EGFP, which was C-terminally expressed with TREK-1 instead of using a Cy3b-labeled anti-TREK-1 antibody. The use of EGFP in dSTORM buffers resulted in a robust dSTORM signal. This dataset also offers a direct comparison between permeabilized and non-permeabilized cells in Figure 2B. Pair correlation of TREK-1 with GM1 showed dramatic decreased under three different conditions. (C) A comparison of Cy3b-STORM with EGFP-STORM as observed in Figure 2E in the presence of xPLD2. (D, E) A comparison between non-permeabilized (a) and permeabilized (b) HEK293T cells overexpressing full-length human TREK-1 (TREK FL) and endogenous PLD2 (enPLD2), that is, without PLD2 overexpression. Taken from Call et al., 2023. (F) Pair correlation between TREK-1 and PIP2 increased slightly after mechanical shear. Insets in (A–D) illustrate the variability at a single radius. Statistical analysis for single points was conducted using a Student’s t-test, while statistical comparisons at multiple radii were performed with a nested Student’s t-test. (G) Schematic representation of brain slices prepared for dSTORM. Mouse brains, fixed through whole-body perfusion, were sliced and labeled with Cy3b-anti-TREK-1 antibody and A647 CTxB. These slices were mounted on a cover slip with fiberglass filter paper on top to secure the tissue during imaging with dSTORM buffer added to the filter paper. The fluorescent background (640 nm) was undetectable even at saturating light intensities. (H) Example images of brain slices from control and astrocyte-specific SREBP2 null mice. TREK-1 was expressed in most brain regions but not uniformly (left panel). Pair correlation analysis was performed on regions with both TREK-1 and CTxB labeling. The displayed slice is a coronal section near the hippocampus, although the precise region of interest is unspecified. Significance was determined by a Student’s t-test for a single point. For multiple points, a nested Student’s t-test was used (*p<0.05, ** p<0.01, *** p<0.001, ****p<0.0001).
Figure 3 with 1 supplement
Shear mobilizes PLD2 within ordered GM1 lipids.
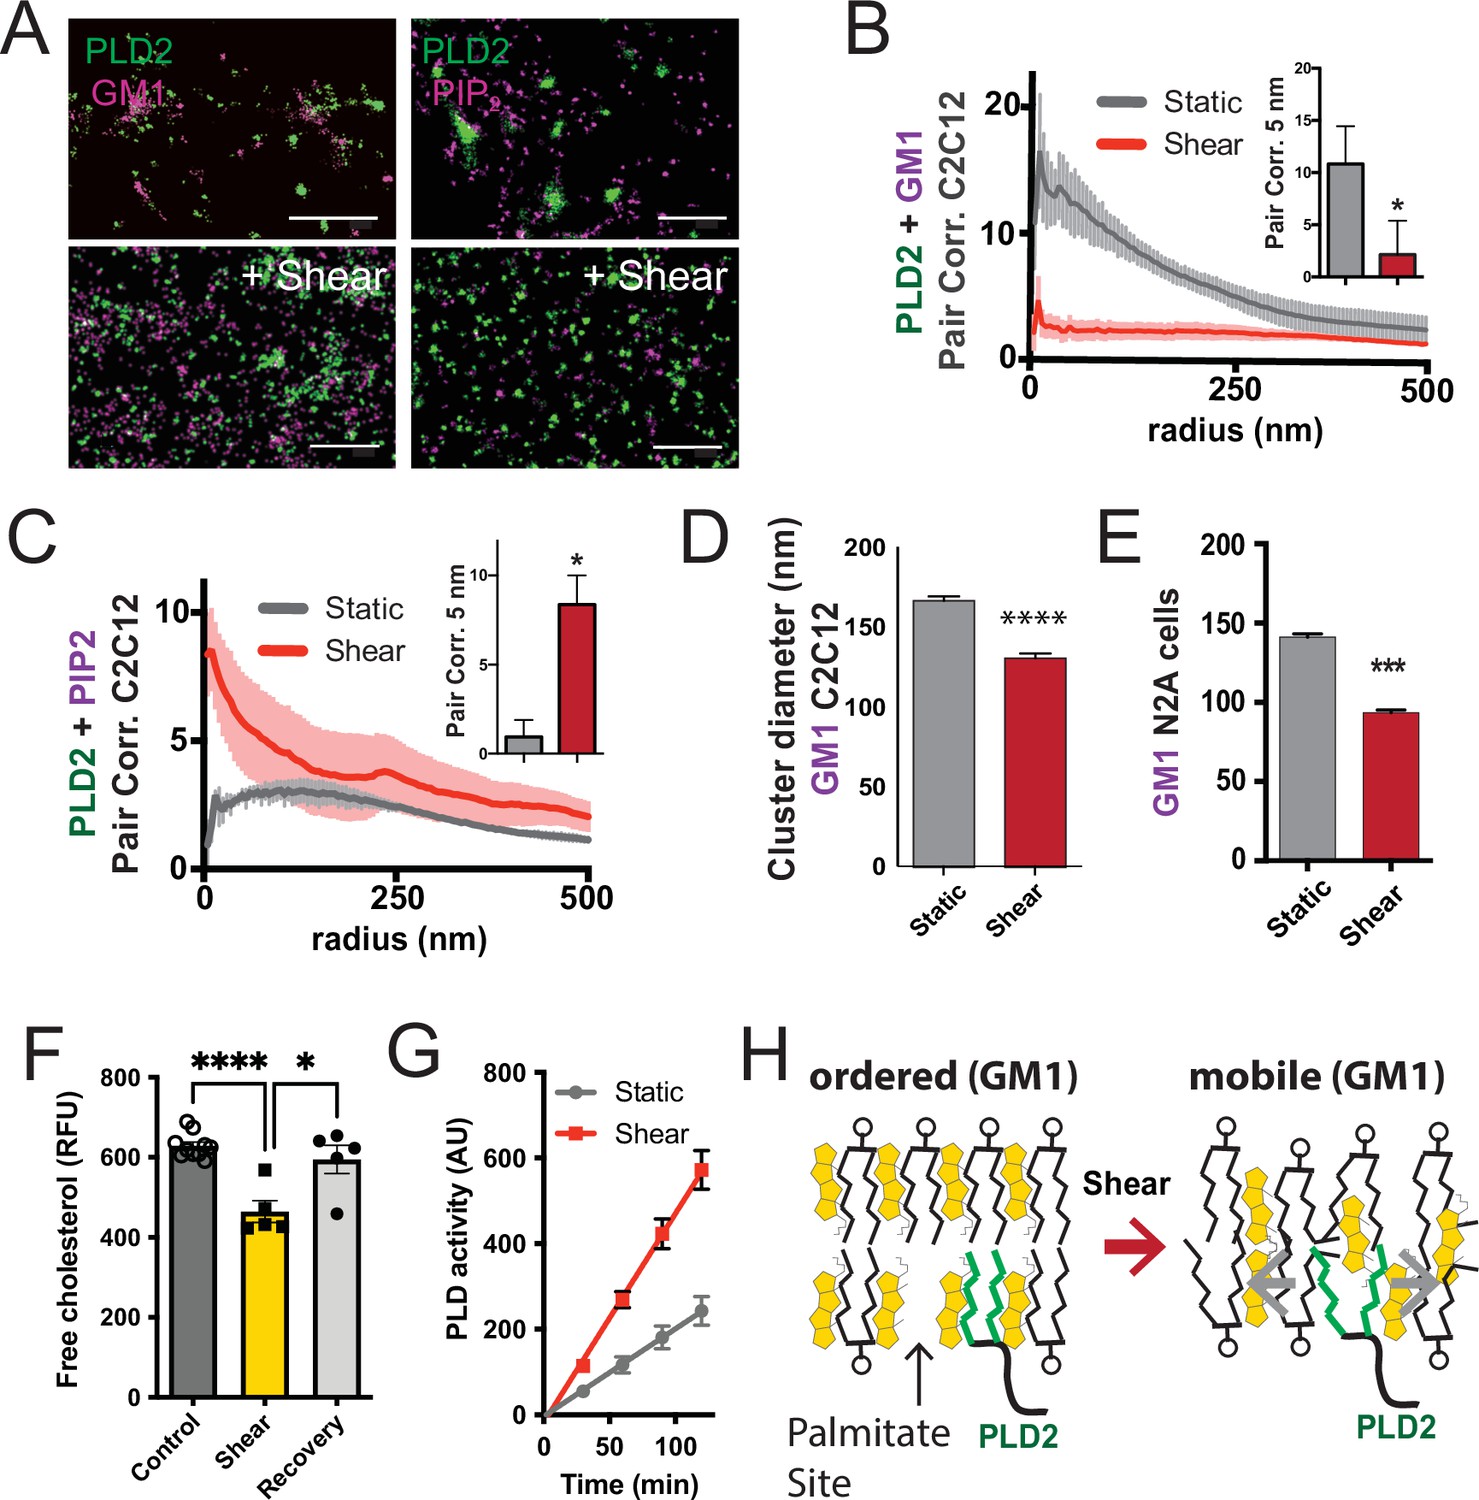
(A) Two-color dSTORM images of fixed C2C12 cells with and without (3 dynes/cm2) shear. Cells were labeled with fluorescent CTxB (ganglioside GM1) or antibodies (anti-PIP2 or anti-PLD2 as indicated) and sheared with the temperature held constant at 37℃. Scale bar = 1 µm. (B) Pair correlation analysis (Pair corr., unitless) of PLD2 with GM1 or PIP2 lipids at a given radius. Error bars are displayed at a given radius. A bar graph (inset) is shown at the shortest calculated radius of 5 nm (single point on the x-axis). Prior to shear (gray line), PLD2 associates with GM1 clusters; after shear, there is almost no association. (C) The opposite was true for phosphatidylinositol 4,5 bisphosphate (PIP2). Prior to shear, PLD2 does not associated significantly with PIP2 clusters, after shear, its association increases dramatically. (D) Cluster analysis of the GM1 lipids from the C2C12 cells shown in (A). (E) Cluster analysis of GM1 lipids in neuroblastoma 2a (N2a) after 3 dynes/cm2 shear force. (F) Fluorescent cholesterol assay. N2a cells grown in 48-well plates were sheared with 3 dynes/cm2 orbital fluid shear, fixed with shear (10 min), and compared to control cells with no shear using a fluorescent cholesterol assay. After shear, a second set of control cells were allowed to recover with no shear and fixative for 30 s (recovery), otherwise the cells were treated identical to experimental cells (n = 5–10). (G) A live PLD activity assay demonstrates that fluid shear (3 dynes/cm2) increases substrate hydrolysis in cultured N2a cells (n > 800 clusters from 5 to 6 cells). (H) Depiction of shear thinning activating PLD2. Left: the palmitates of PLD2 (green lines) are shown bound to the palmitate site in ordered GM1 lipids. Right: after shear cholesterol is reduced, and GM1 lipids are deformed. The deformed surface no longer binds palmitates efficiently allowing the palmitates move freely—a process known as shear thinning. Statistical comparisons were made with an unpaired Student’s t-test (*p<0.05, ***p<0.001, ****p<0.0001).
Figure 3—figure supplement 1
Observing cellular changes in response to mechanical stimulation.
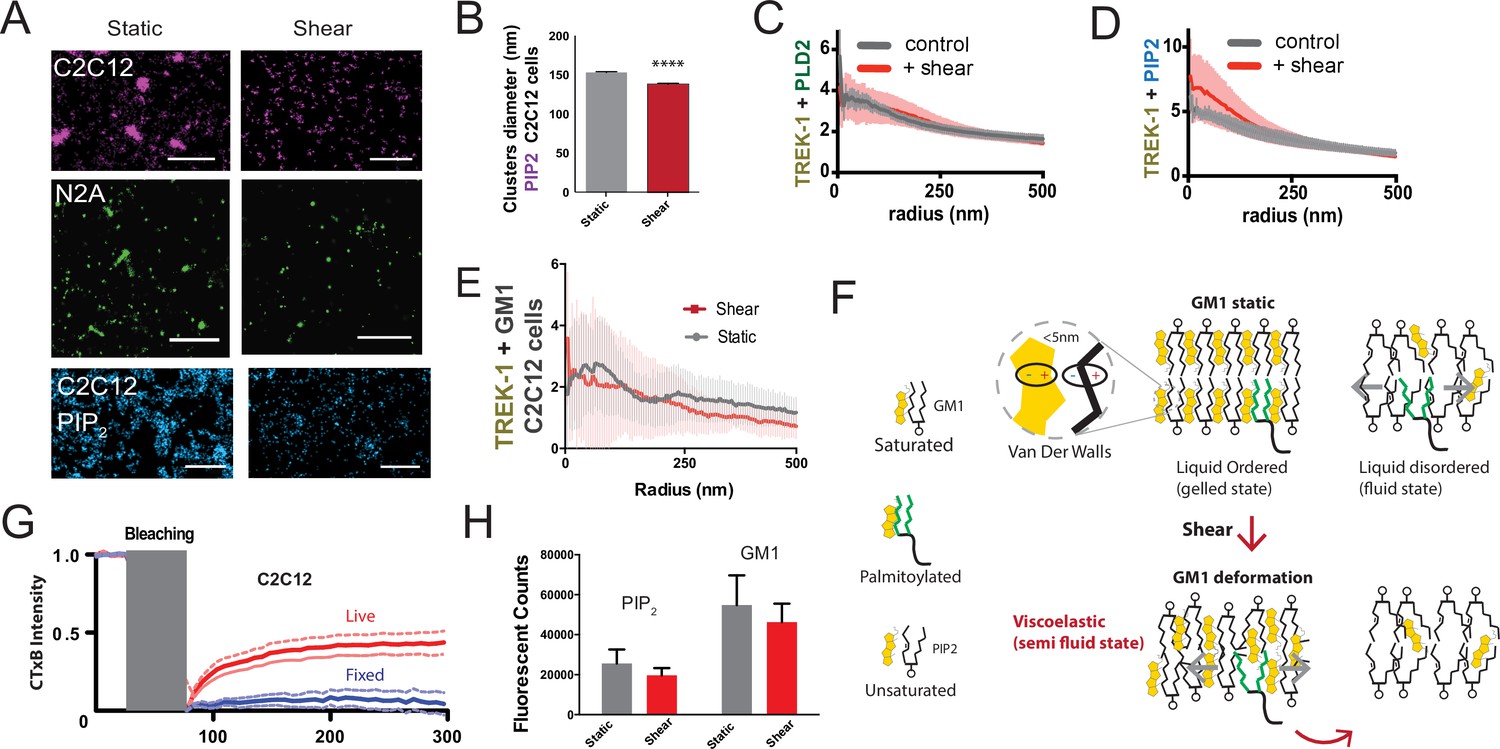
(A) Representative images illustrating the impact of shear on the apparent size of GM1 (maroon and green) in muscle C2C12 and neuronal N2a cells, respectively. PIP2 clusters in C2C12 cells are shown in blue. When shear force is applied, the apparent size decreases. Scale bars = 1 µm. (B) Cluster analysis of PIP2 demonstrates a small but statistically significant decrease in size. (C) Complex formation between TREK-1 and PLD2 before and after shear in C2C12 cells. Pair correlations analysis of TREK-1 and PLD2 before (gray line) and after (red line) 3 dynes/cm2 shear. Their association remains almost identical in both states. (D) Staining of TREK-1 with phosphatidylinositol 4,5 bisphosphate (PIP2) antibody in C2C12 cells. Before shear (gray line) TREK-1 exhibits significant association with PIP2. After shear, this association further enhanced, suggesting some TREK-1 complexes move to PIP2 clusters in C2C12 cells. (E) Pair corr. of TREK-1 with GM1 clusters (CTxB) measured by dSTORM in C2C12 cells prior to cholesterol loading, as shown in Figure 4B. In the low cholesterol state, endogenous TREK-1 shows minimal association with GM1 lipids. (F) Shear thinning model for PLD2. Cholesterol is depicted as packing with saturated lipids and saturated palmitate via Van der Waals interactions (within 5 nm). Unsaturated lipids contain a double bond that alters the packing surface of a lipid. In a perfectly ordered state, palmitoylated proteins are ordered with the GM1 lipids and cholesterol. In the disordered region, palmitates move fluidly within the membrane. After shear, the GM1 lipids remain ordered but deformed. The palmitates no longer efficiently pack with the GM1 lipids, reducing their affinity for the ordered domain and allowing the palmitates to move in the membrane. (G) Fluorescence recovery after photobleaching (FRAP) imaging to examine potential labeling artifacts (Moon et al., 2017; Raghunathan and Kenworthy, 2018; Wang et al., 2018) of pentavalent CTxB that might persist after fixation. The duration of photo bleaching is indicated in gray. The blue line shows that fixation with paraformaldehyde (PFA) and glutaraldehyde effectively restricts the large-scale movement of lipids in fixed cells compared to live cells (red). (H) For both PIP2 and GM1 labeling, shear did not significantly decrease the overall counts measured with dSTORM in C2C12 cells (p>0.05, Student’s t-test).
Figure 4 with 1 supplement
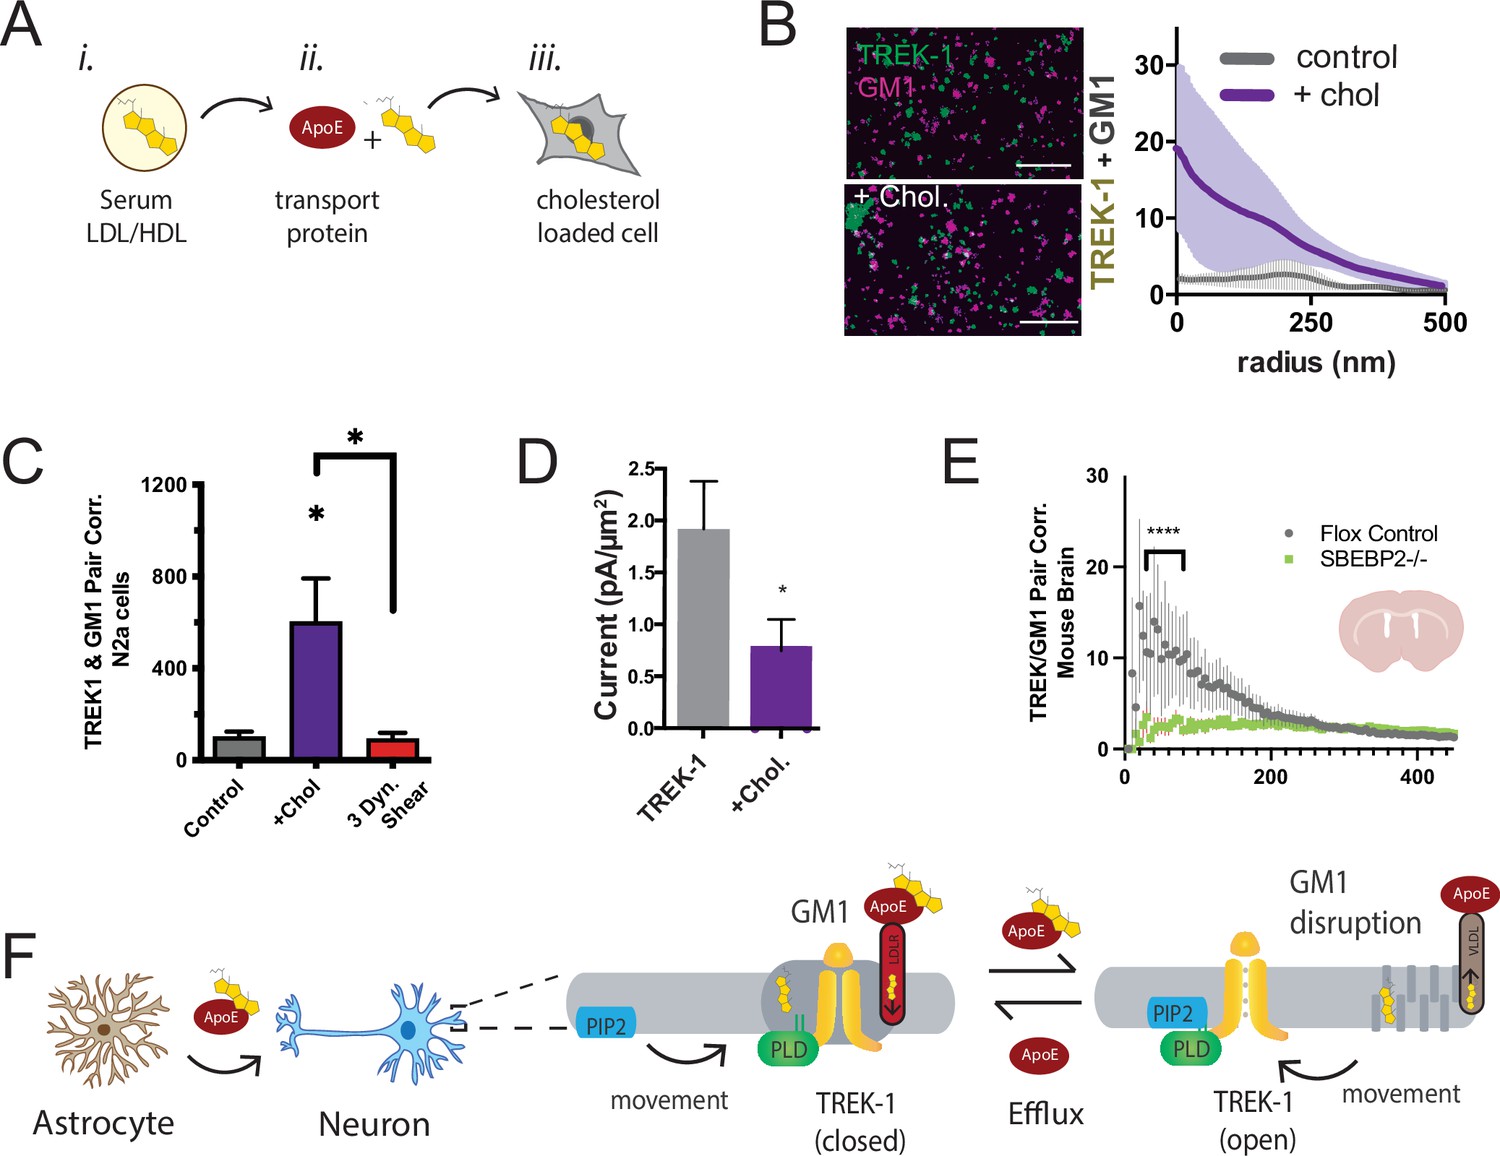
Astrocyte cholesterol regulates TREK-1 through GM1 lipids and spatial patterning.
(A) Uptake of cholesterol into cultured cells using the cholesterol transport protein apolipoprotein E (apoE). (B) Cholesterol/lipid uptake into C2C12 cells with 4 µg/ml (~110 nM apoE, purple line). Cholesterol dramatically increases TREK-1 correlation of TREK-1 with GM1-labeled lipids. Without cholesterol (gray line) very little TREK-1 clusters with GM1 lipids. Scale bars = 1 µm. (C) Pair correlation (Pair corr.) of TREK-1 and CTxB, localized within 5 nm of each other, are shown plotted after cholesterol treatment (apoE + serum, purple shading) or treatment with 3 dynes/cm2 shear (red shading). Cholesterol increased TREK-1 association almost fivefold and shear reversed the effect (n = 4–7); unpaired Student’s t-test. (D) Current densities from whole-cell patch-clamp recordings are shown with and without cholesterol loading with 4 µg/ml apoE in HEK293T cells over expressing human TREK-1. Increasing cholesterol inhibited the channel approximately threefold (Student’s t-test; *p<0.05) (E) Reduction in neuronal cholesterol results in a decrease in correlation between TREK-1 and GM1 cluster in brain slices from a hGFAP-Cre driving the SB2 knockout mouse and its Flox control. Student’s t-test at 25 nm *p,0.05, nested Student’s t-test at 25–50 nm (****p<0.0001, n = 20–24 unspecified cortical regions). (F) Proposed model for cluster associated TREK-1 activation and inhibition. In high cholesterol, TREK-1 clusters with PLD2 and ordered (thick) GM1 lipids inhibiting the channel. In low cholesterol, TREK-1 is partially clustered closer to PIP2 generating basal TREK-1 activity (see also Figure 1C). After shear, the order of GM1 clusters (dark gray) is disrupted further increasing PLD2 and TREK-1 clustering with PIP2 lipids (blue).
Figure 4—figure supplement 1
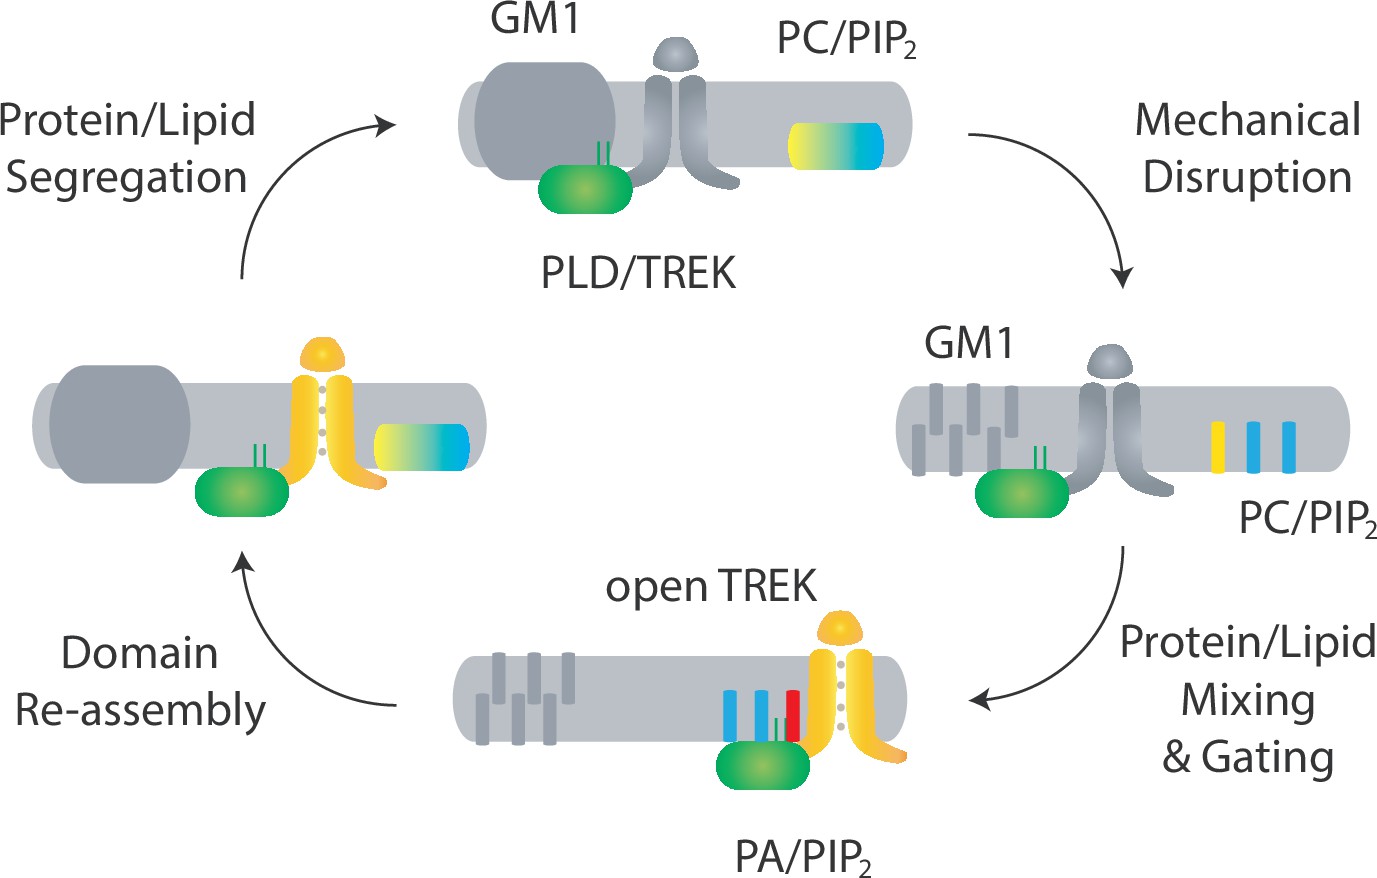
Proposed model for domain-mediated mechanosensation of TREK-1 by spatial patterning.
Top: in domain-mediated mechanosensation, in an unstimulated state, the palmitate site within GM1 domains is intact and binds tightly to palmitates. This tight affinity sequesters the PLD2/TREK-1 complex away from its activating lipids phosphatidylcholine (PC, yellow) and phosphatidylinositol 4,5-bisphosphate (PIP2, blue). Right: upon mechanical stimulation, the palmitate site is disrupted and the PLD2/TREK-1 complex is released, allowing it to diffuse within the plasma membrane and bind to PIP2. Bottom: upon PIP2 binding, PLD2 is becomes activated and makes phosphatidic acid (PA, red), transducing the mechanical signal into a chemical signal. This chemical signal then binds to and activates TREK-1, initiating chemical-to-electrical signal transduction. Left: when the stimulation is removed, the lipid domain reforms, causing the complex to be re-sequestered. The process results in a return to steady-state conditions, as depicted in the top panel.
Figure 5
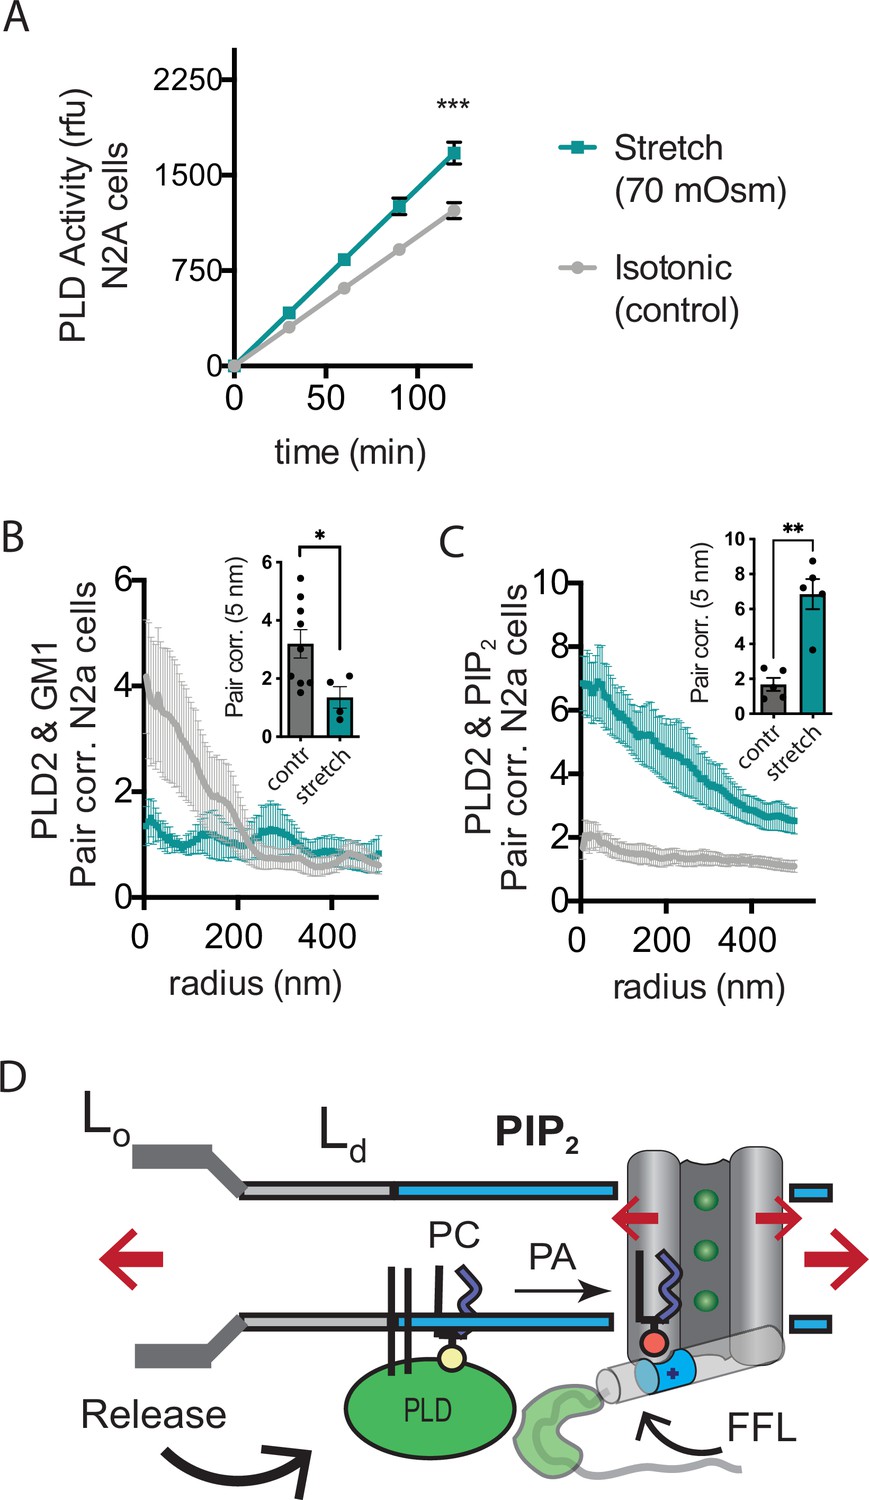
Osmotic stretch activates PLD2 in N2a cells.
(A) Stretch by osmotic swell (70 mOsm buffer) increased PLD2 catalytic activity in live neuroblastoma 2a (N2a) cells compared to isotonic control cells (310 mOsm) (n = 5). (B, C) dSTORM imaging showing PLD2 trafficking from ganglioside (GM1) to phosphatidylinositol 4,5-bisphosphate (PIP2) clusters in response to 70 mOsm stretch in N2a cells (coloring the same as in panel A). Cells were treated, fixed, and labeled with anti-PIP2 or PLD2 antibody or cholera toxin B (CTxB, GM1). Prior to stretch, PLD2 clustered with GM1 lipids and very little with PIP2 (gray lines). After stretch PLD2 clustered robustly with PIP2 but very little with GM1 lipids. Insets show the change in correlation at 5 nm, Student’s t-test (n = 5–9), *p<0.05, **p<0.01, ***p<0.001. (D) Summary figure for the proposed combined model of TREK-1 in a biological membrane by evoked PLD2-dependent currents and mechanical activation by direct force from lipid (FFL). TREK-1 in the open conformation (green ions), in complex with PLD2, is shown after stretch (large red arrows) associating (curved black arrow) with PIP2 clusters (blue shaded bars) in the thin liquid disordered (Ld) region of the membrane (light gray). A known gating helix (gray cylinder) is shown in the up (open channel) position with a PLD2 binding site immediately following the helix (green tube). The opening is a response to three factors that combine to raise the gating helix to the up position. (1) FFL (small red arrows) in TREK-1 favors an open (up) helix conformation. (2) The tip is brought into proximity of PLD2 in the open position and (3) PA (red sphere) is produced and maintains the up positioned by binding to charged residues (blue tube) pulling the helix toward the membrane.
Figure 6 with 1 supplement
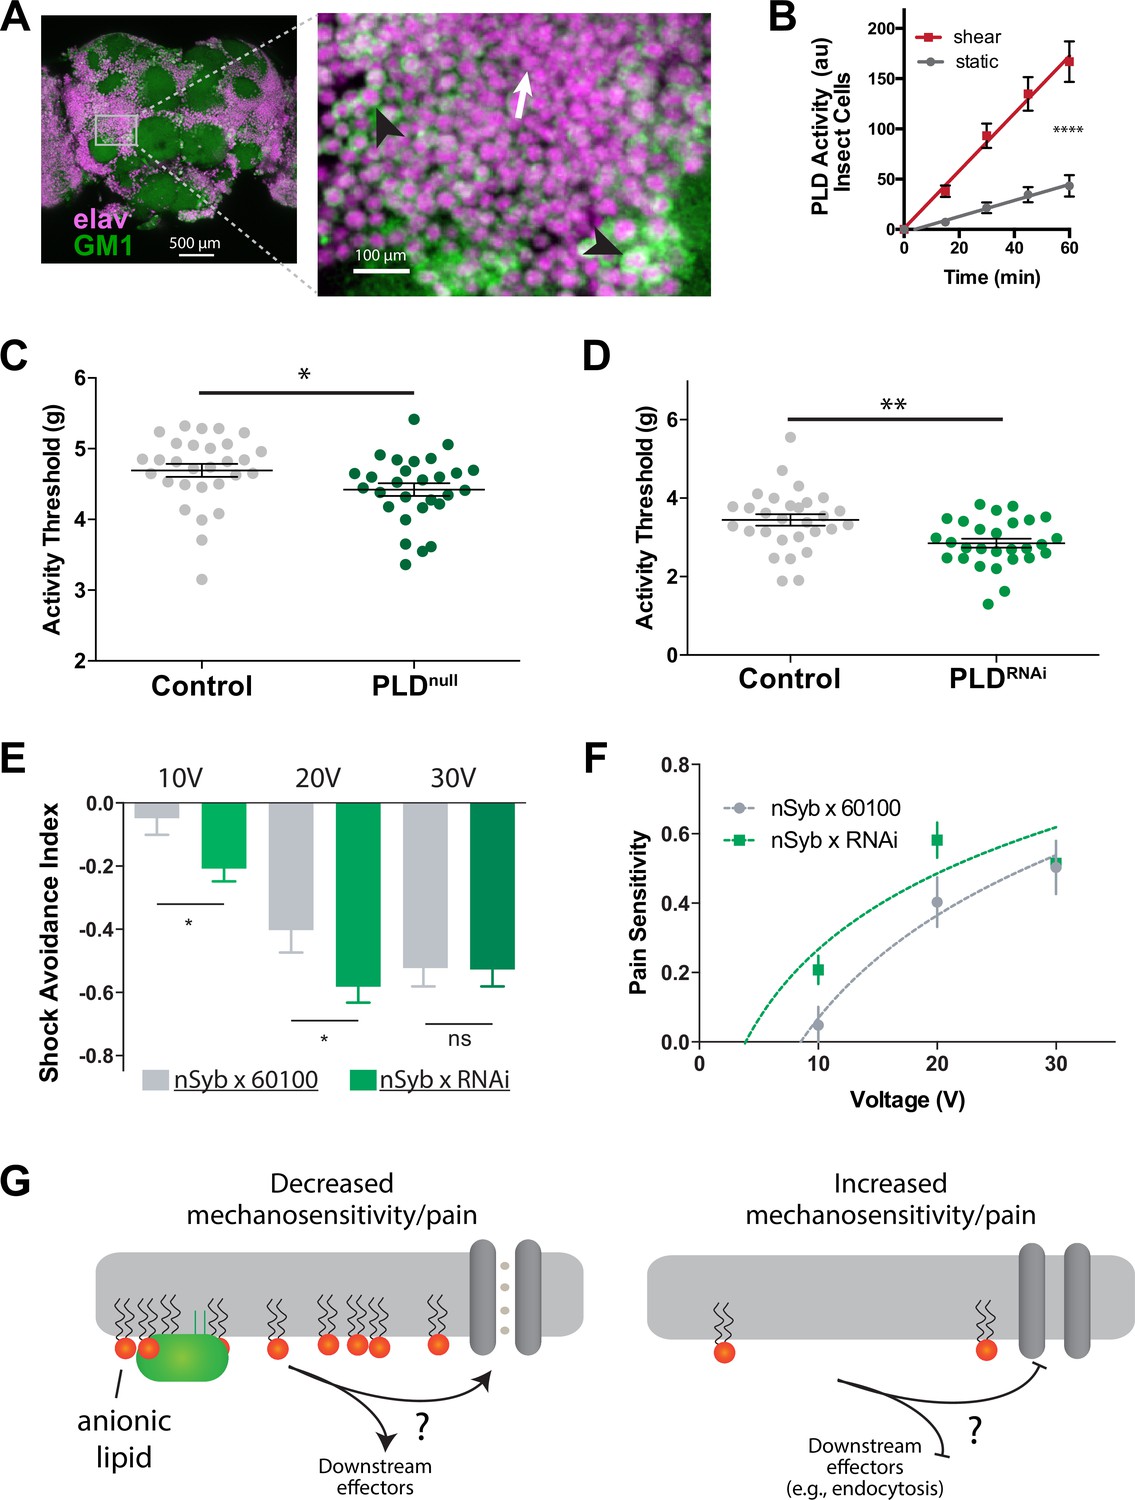
PLD modulates mechanosensitivity in Drosophila.
(A) Cholera toxin B (CTxB) robustly labels GM1 lipids (GM1, green) throughout the brain of Drosophila (left). The zoomed section (right) shows that most of the labeling is found on the membrane. There are notable variations in the amount of CTxB labeling, with some cells expressing GM1 over the entire membrane (black arrows) while others only have labeling in small puncta (white arrow). (B) Shear (3 dynes/cm2) robustly activates PLD2 in a live PLD assay with cultures neuronal insect cells. (C) Measurements of Drosophila mechanosensation in vivo. Animals with or without the pldnull gene were stimulated by increasing amounts of mechanical vibration (see Figure 6—figure supplement 1). Flies lacking PLD2 had a decreased threshold (i.e., more sensitivity to mechanical stimulation) compared to genetically matched controls (w1118) (p=0.02, n = 28–29), consistent with the prediction that PA decreases excitability of nerves. (D) The same result was observed in a PLDRNAi line which results in PLD knockdown only in the neurons of Drosophila (p=0.002, n = 28–29), Mann–Whitney test. (E, F) Flies were subjected to increasing voltages of electrical shock in a two-choice assay. PLD-KD flies showed an increased sensitivity to shock when compared with wild-type flies. PLDRNAi flies had a higher aversion to shock at 10 V (p=0.0213, n = 21) and 20 V (p=0.0492, n = 27–30), but not at 30 V (p=0.672, n = 12). (G) Proposed role of PLD2 in regulating mechanical thresholds. PA is a signaling lipid in the membrane that activates hyperpolarizing channels and transporters. When PA is low the membrane is less polarized, and cells are more sensitive to mechanical activation. The downstream targets are unknown (shown with a ‘?’). Flies lack a known mechanosensitive TREK-1 homolog.
Figure 6—figure supplement 1
Pan-neuronal knockdown of pld in Drosophila alters sensitivity to electrical shock.
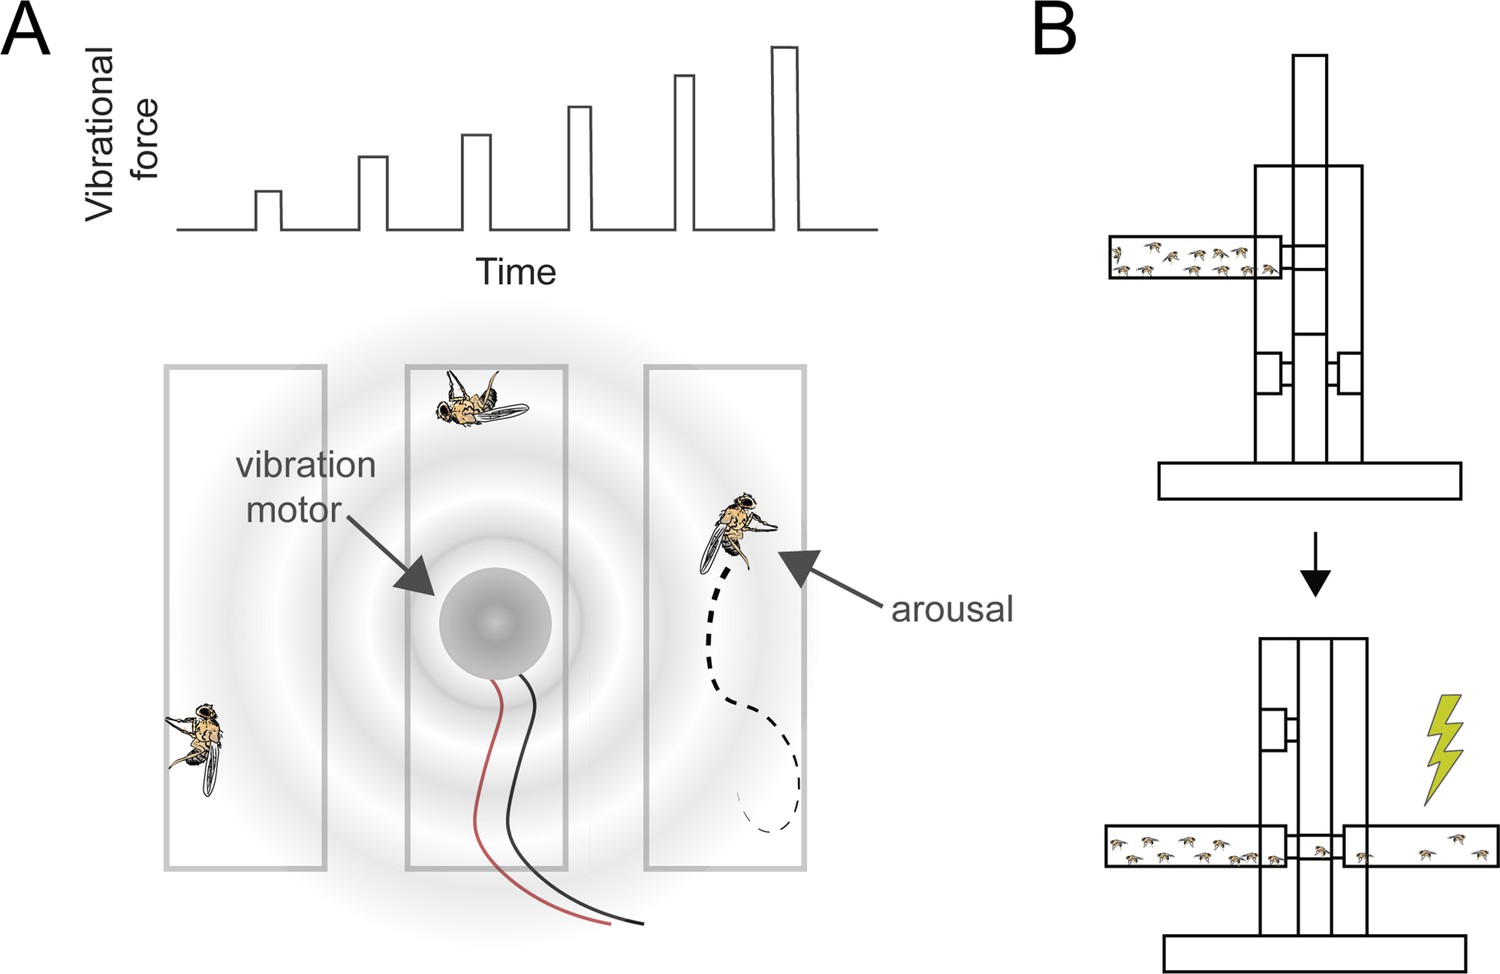
(A) Illustration of the experimental setup for applying mechanical stimulation to Drosophila flies. A series of six increasing vibrations (top) used to stimulate the flies. A vibration motor was attached to the back of the chamber containing the flies, and their responses were monitored using a web camera to assess stimulation-induced arousal (bottom). (B) Illustration of shock avoidance assay.
Author response image 1
Author response image 2
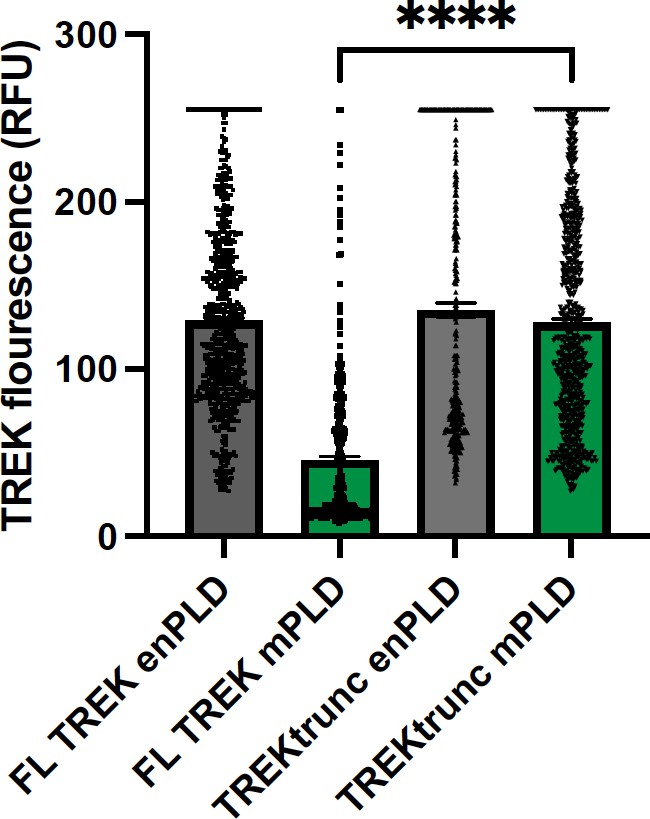
TREK expression at the plasma membrane.
TREK-1 Fluorescence was measured by GFP at points along the plasma membrane. Over expression of mouse PLD2 (mPLD) decrease the amount of full-length TREK-1 (FL TREK) on the surface more than 2-fold compared to endogenously expressed PLD (enPLD) or truncated TREK (TREKtrunc) which is missing the PLD binding site in the C-terminus. Over expression of mPLD had no effect on TREKtrunc.
Author response image 3
Tables
Key resources table
| Reagent type (species) or resource | Designation | Source or reference | Identifiers | Additional information |
|---|---|---|---|---|
| Cell line (Homo sapiens) | HEK293T | ATCC | HEK293T | Cat# CRL-3216; RRID:CVCL_0063 |
| Cell line (Mus musculus) | N2a | ATCC | N2a | Cat# CCL-131; RRID:CVCL_0470 |
| Cell line (M. musculus) | C2C12 | ATCC | C2C12 | Cat# CRL-1772 |
| Transfected construct (H. sapiens) | TREK-1 | PMID:18004376 | Dr. Steven Long (Sloan Kettering) | |
| Transfected construct (M. musculus) | mPLD2 | PMID:9867870 | Dr. Michael Frohman (Stony Brook) | |
| Transfected construct (M. musculus) | xPLD2 | PMID:9867870 | Dr. Michael Frohman (Stony Brook) | Catalytically dead PLD2 |
| Cell line (Drosophila melanogaster) | BG2-c2 | Drosophila Genomics Resource Center | DGRC Stock 53; https://dgrc.bio.indiana.edu//stock/53; RRID:CVCL_Z719 | |
| Strain, strain background (Drosophila melanogaster) | PLDnull | PMID:27848911 | ||
| strain, strain background (D. melanogaster) | PLD-KD | Vienna Drosophila Resource Center | Stock#: v106137 | |
| Biological sample (M. musculus) | SREBP2-KO | PMID:34385305 | Heather Ferris (University of Virginia) | Brain slices from SREBP2-KO animals |
| Antibody | Anti-TREK-1 (rabbit, polyclonal) | Santa Cruz | Cat# sc-50412; RRID:AB_2131048; | 1:100 dilution |
| Antibody | Anti-TREK-1 (mouse, monoclonal) | Santa Cruz | Cat# sc-398449 | 1:100 dilution |
| Antibody | Anti-PIP2 (mouse, monoclonal) | Echelon Biosciences | Cat# Z-P045, RRID:AB_427225 | 1:100 dilution |
| Antibody | Anti-rabbit Alexa 647 (goat, polyclonal) | Thermo Fisher Scientific | Cat# A-21244, RRID:AB_2535812 | 1:1000 dilution |
| Antibody | Anti-mouse Alexa 647 (goat, polyclonal) | Thermo Fisher Scientific | Cat# A-21235, RRID:AB_2535804 | 1:1000 dilution |
| Antibody | Anti-mouse cy3B (donkey, polyclonal) | PMID:27976674 | Cat# NC9812063 | 1:1000 dilution |
| Chemical compound, drug | CTxB | Thermo Fisher Scientific | Cat# C34778 | |
| Peptide, recombinant protein | ApoE3 | BioLegend, USA | Cat# 786802 | |
| Chemical compound, drug | Atto 647 | Sigma-Aldrich | 18373-1MG-F | |
| Chemical compound, drug | Cholesterol oxidase | Sigma-Aldrich | C8649-250UN | |
| Chemical compound, drug | Amplex red | Cayman Chemical | Cat# 10010469 | |
| Peptide, recombinant protein | Horseradish peroxidase | VWR | 516531-5KU | |
| Peptide, recombinant protein | Choline oxidase | VWR | Cat# 15349250 | |
| Chemical compound, drug | C8-PC | Avanti Lipids | Cat# 850315P | |
| Peptide, recombinant protein | Glucose oxidase | Sigma-Aldrich | Cat# G2133 | |
| Peptide, recombinant protein | Catalase | Sigma-Aldrich | Cat# C40 | |
| Chemical compound, drug | Maleimide cy3B | GE-Health | Cat# PA63131 |
Additional files
Download links
A two-part list of links to download the article, or parts of the article, in various formats.
Downloads (link to download the article as PDF)
Open citations (links to open the citations from this article in various online reference manager services)
Cite this article (links to download the citations from this article in formats compatible with various reference manager tools)
Mechanical activation of TWIK-related potassium channel by nanoscopic movement and rapid second messenger signaling
eLife 12:RP89465.
https://doi.org/10.7554/eLife.89465.3


