Conformational heterogeneity of the BTK PHTH domain drives multiple regulatory states
- Roy J. Carver Department of Biochemistry, Biophysics and Molecular Biology, Iowa State University, United States
- Cryo-EM Facility, Office of Biotechnology, Iowa State University, United States
- Department of Chemistry and Chemical Biology, Northeastern University, United States
Figures
Figure 1
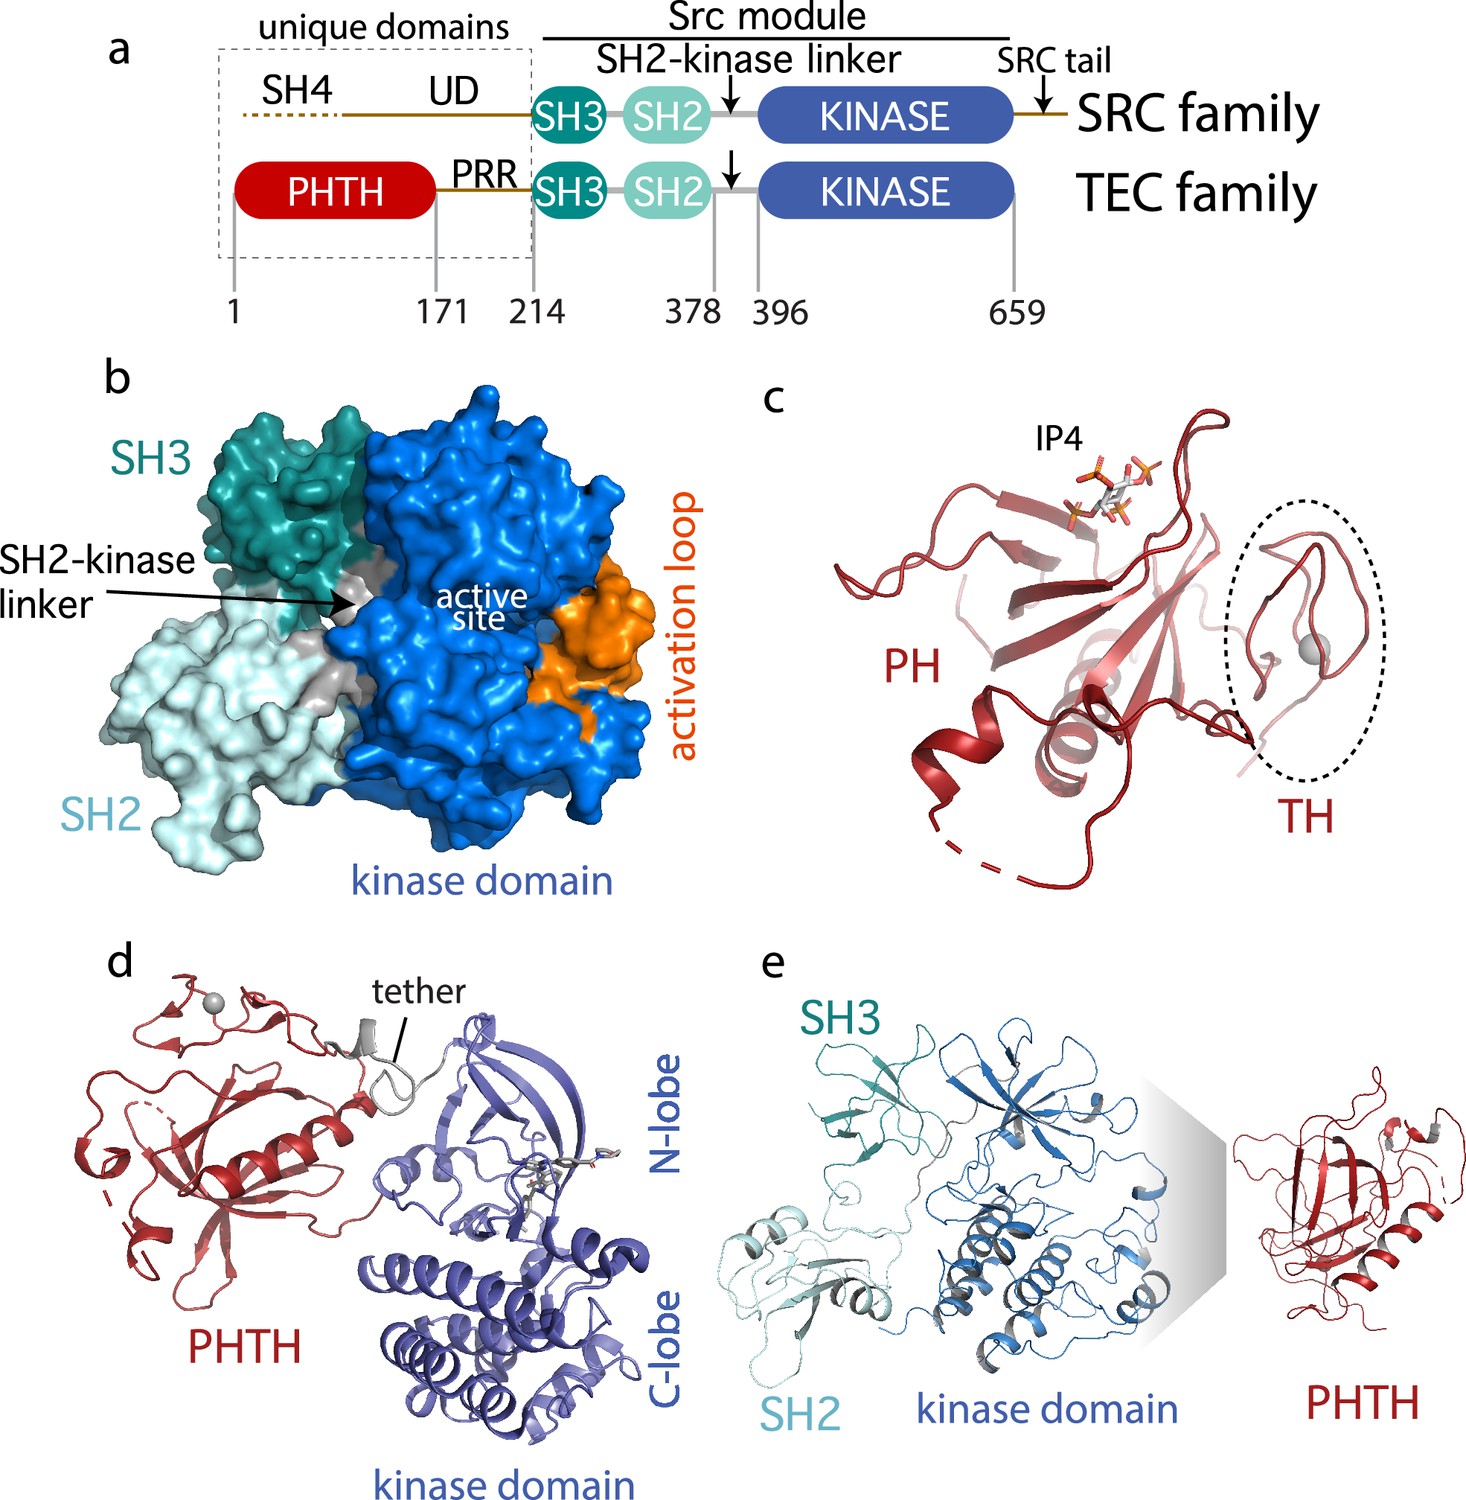
Current Bruton’s tyrosine kinase (BTK) structural data.
(a) Comparison of the SRC and TEC domain architectures. Linker regions and domains are labeled, residue numbering shows BTK domain boundaries. The ‘Src module’ is the SH3–SH2–kinase region shred by both families. (b) Autoinhibited BTK core (Src module). The compact structure of the SH3–SH2–kinase region of BTK is exacted from the domain swapped dimer structure (PDB: 4XI2) solved by Wang et al., 2015. The three domains (SH3, SH2, and kinase), the SH2–kinase linker, the activation loop and the active site are labeled. (c) Structure of the BTK Pleckstrin homology/Tec homology (PHTH) domain bound to inositol 1,3,4,5-tetrakisphosphate (IP4; PDB: 1B55) (Baraldi et al., 1999). The monomer is shown for clarity and the TH region bound to Zn2+ is circled. (d) Structure of the tethered PHTH–kinase construct (PDB: 4Y93). (e) Solution-based mapping of BTK PHTH interaction across the activation loop face of the kinase domain.
Figure 2 with 1 supplement
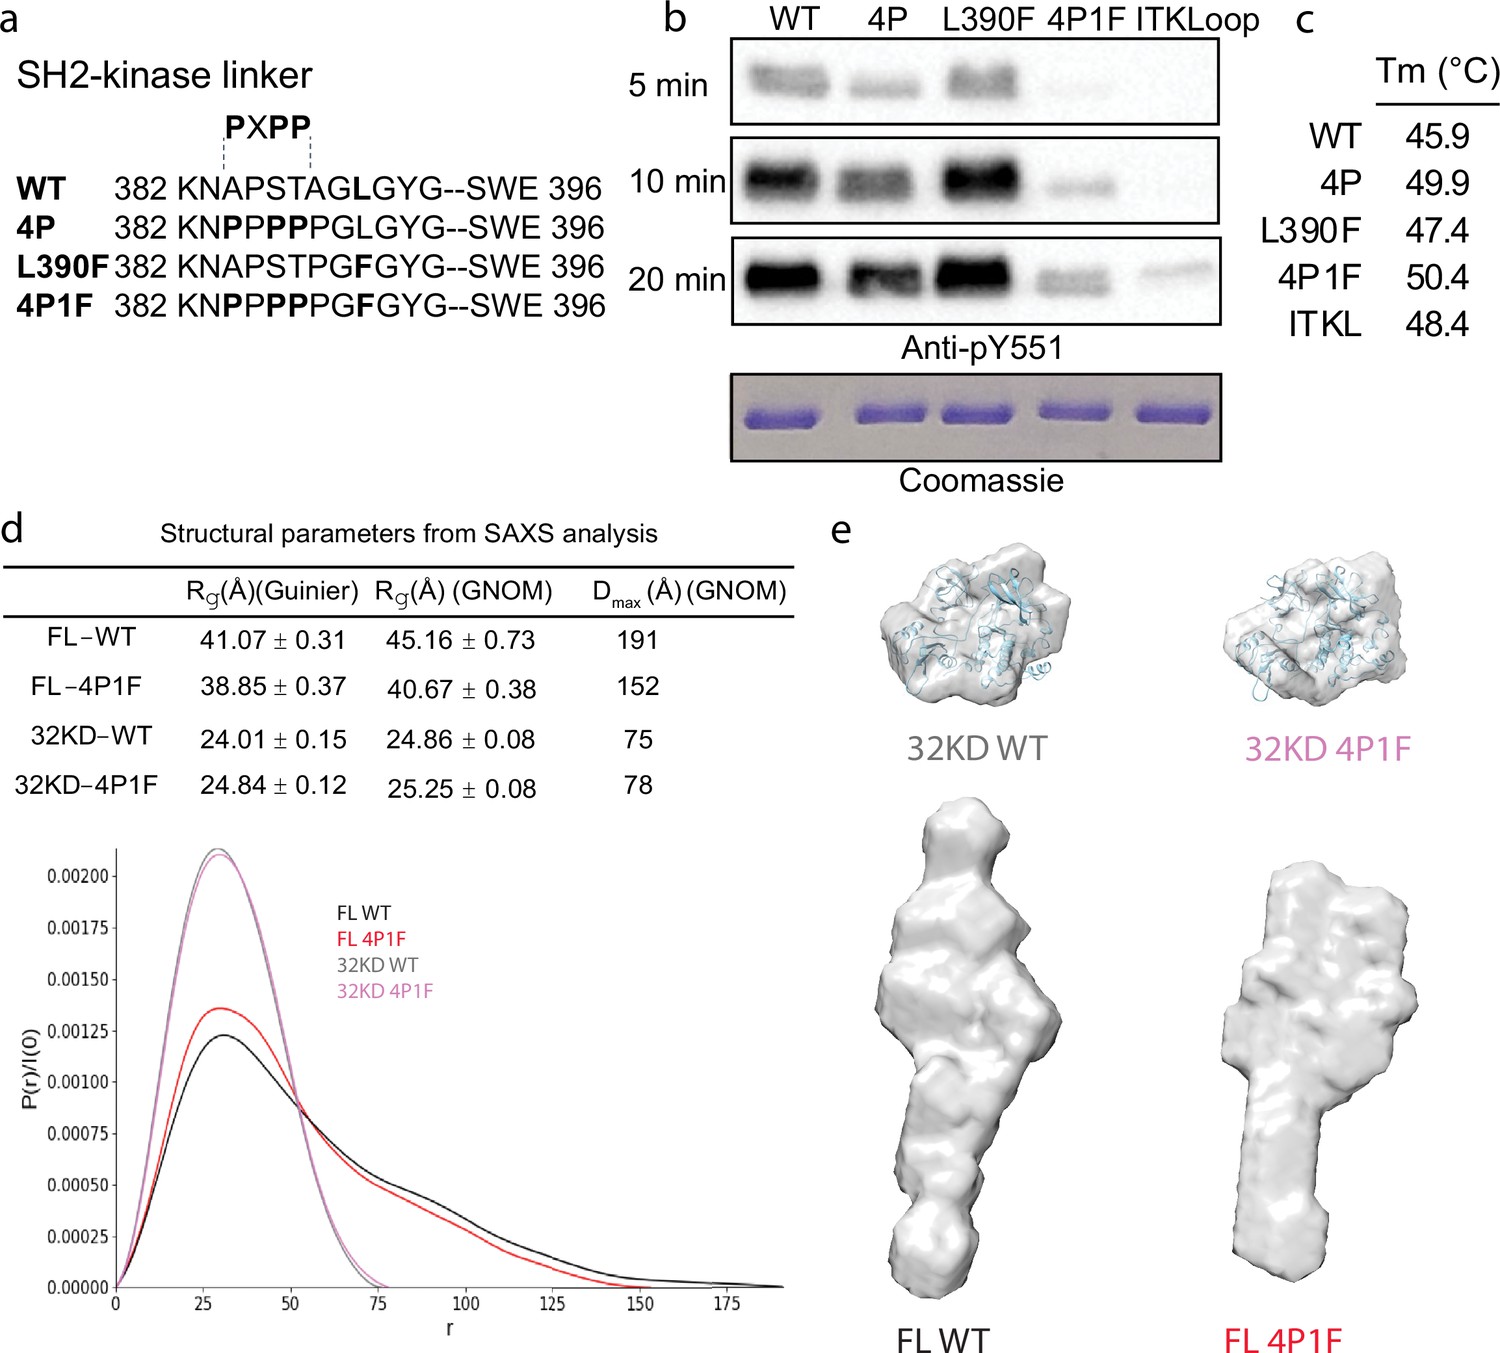
Stabilization of the Bruton’s tyrosine kinase (BTK) SH3–SH2–kinase core.
(a) Mutations introduced into the SH2–kinase linker region of BTK (residues 382–396). PXPP indicates the region that adopts the left-handed, type II polyproline helix in the autoinhibited structure of BTK SH3–SH2–kinase. (b) Western blot showing the kinase activity of wild-type (WT) BTK, 4P, L390F, 4P1F, and ITKLoop BTK variants. Autophosphorylation on BTK is monitored using an anti-pY551 antibody and total protein levels are monitored by Coomassie stain. (c) Melting temperatures of BTK WT and variants (see Figure 2—figure supplement 1). (d) Distance distribution functions and structural parameters (Rg and Dmax) comparing the SH3–SH2–kinase fragment and full-length BTK (wild-type and 4P1F). (e) Surface representation of ab initio envelope reconstructions obtained from small angle X-ray scattering (SAXS) superimposed on the crystal structures for the BTK SH3–SH2–kinase fragment (top). Elongated envelopes for both full-length wild-type (FL WT) BTK and the full-length 4P1F mutant of BTK are shown without structure superposition (bottom). Figure 2—figure supplement 1 provides Guinier and Kratky plots for all four BTK proteins. SASBDB accession codes are as follows: SASDRB9, SASDRC9, SASDRD9, and SASDRE9.
Figure 2—figure supplement 1
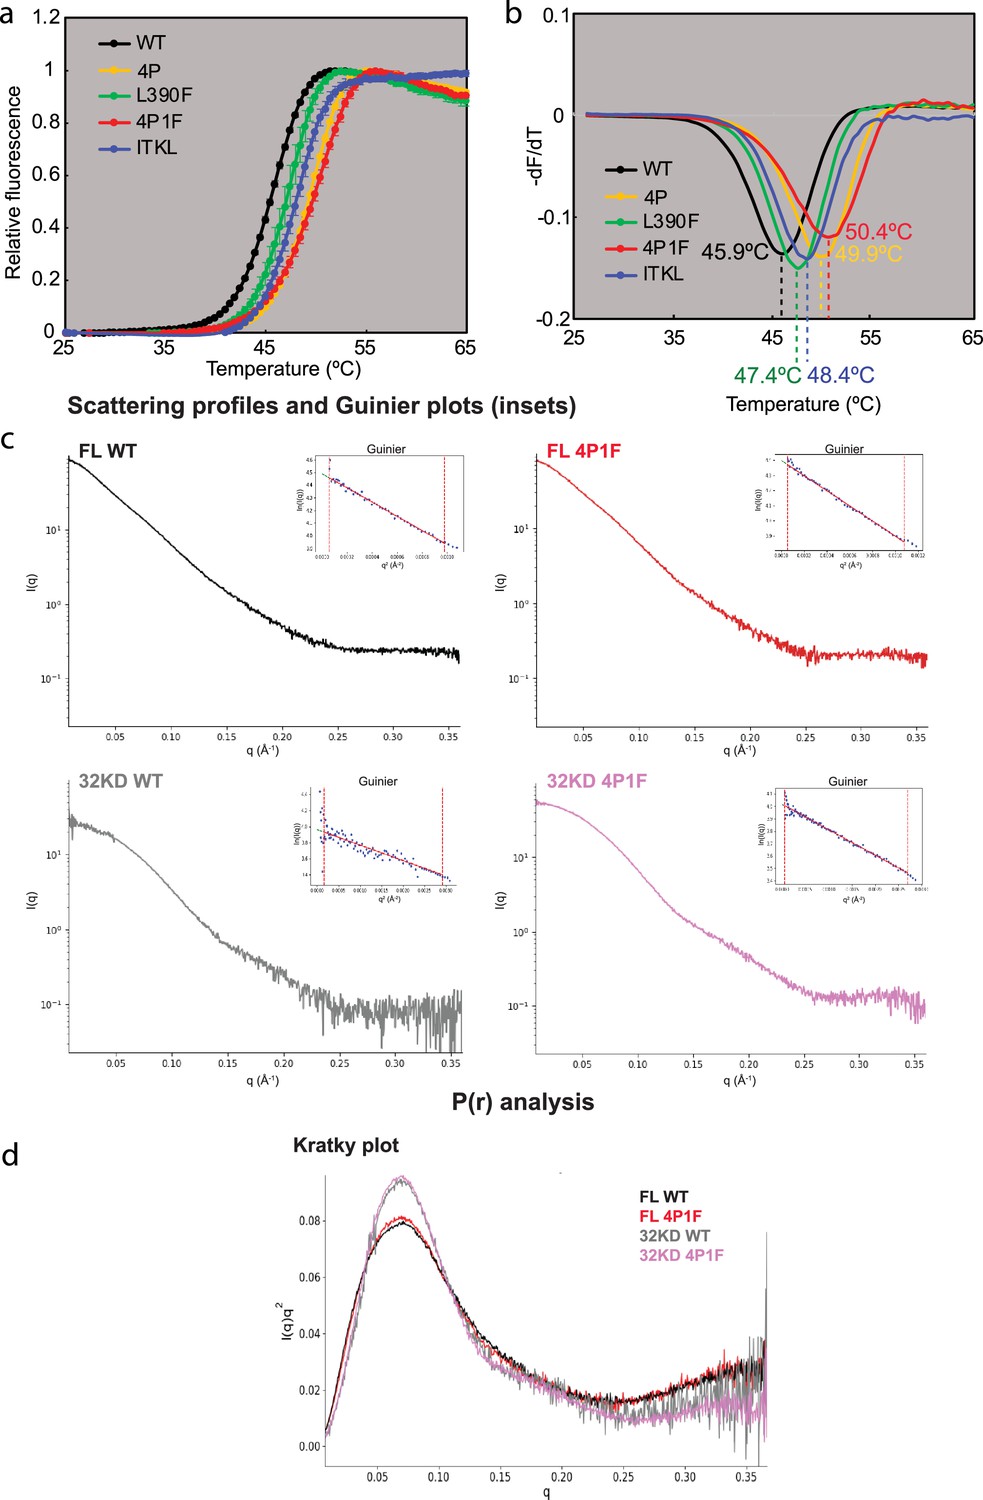
Tm and SAXS analyses.
(a) Tm curves and (b) first derivatives for panel of Bruton’s tyrosine kinase (BTK) variants (c) Guinier and (d) Kratky plots for BTK variants.
Figure 3
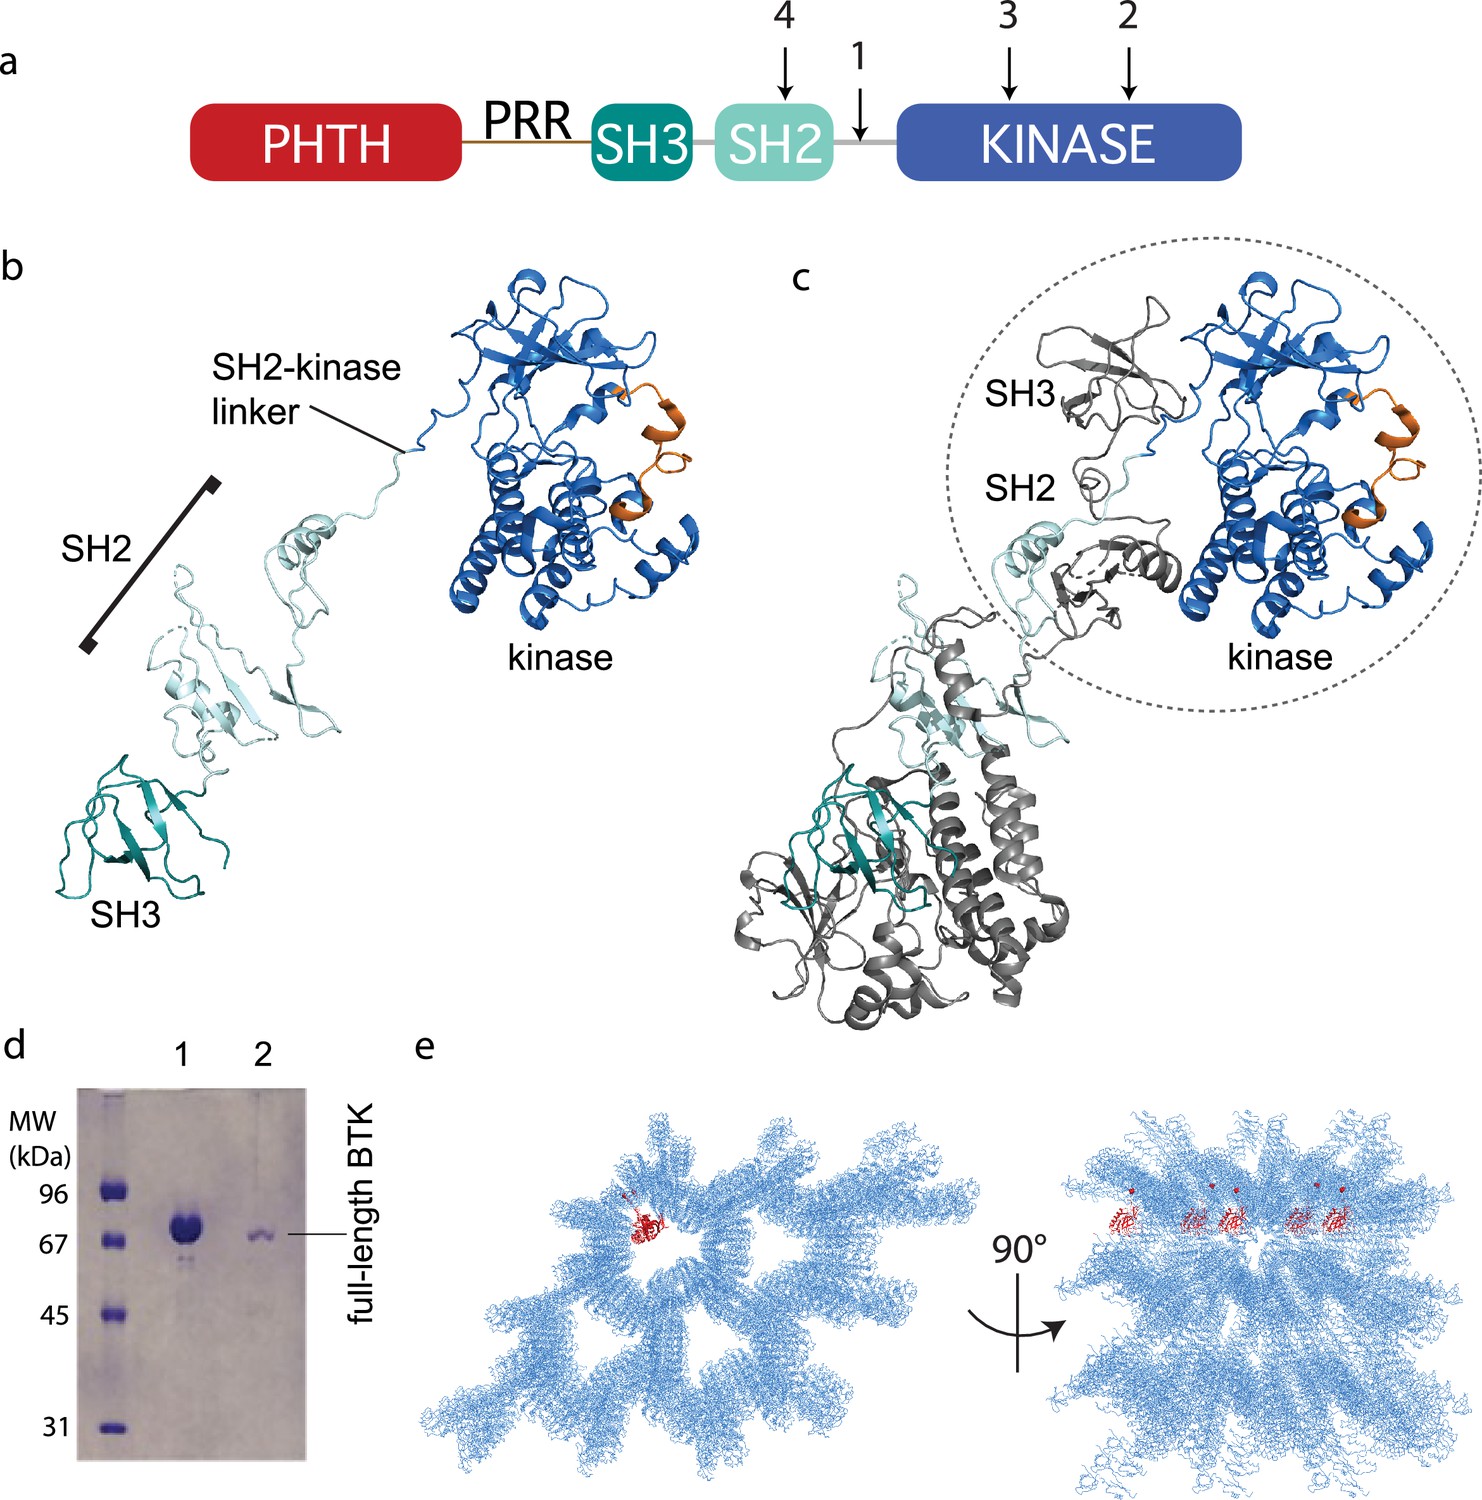
Crystallization of full-length Bruton’s tyrosine kinase (BTK).
(a) The crystallization target, full-length BTK with stabilized core (FL BTKsc), included (1) SH2–kinase linker mutations (4P1F: A384P, S386P, T387P, A388P, and L390F); (2) activation loop mutations (ITKLoop: L542M, S543T, V555T, R562K, S564A, and P565S); (3) catalytic residue mutation (K430R); and (4) surface entropy reduction mutations (E298A, K300A, and E301A). The N-terminal domains, Pleckstrin homology/Tec homology (PHTH)–proline-rich region (PRR)–SH3, are wild-type BTK sequence. (b, c) Structure of the BTK domain swapped dimer that results from crystallization of full-length BTK (PDB: 8GMB). PHTH–PRR region is missing from the electron density. One SH3–SH2–kinase monomer is shown in (b) and the autoinhibited SH3–SH2–kinase arrangement is circled in (c). Domain colors match those in (a) and the activation loop in the kinase domain is orange. (d) Sodium dodecyl sulfate–polyacrylamide gel electrophoresis (SDS–PAGE) showing full-length BTK protein from crystals. Lane 1 is a purified full-length BTK control and lane 2 is protein derived from harvested and washed crystals. (e) Two views of crystal packing with the PHTH domain (red) modeled into one of the solvent channels.
Figure 4 with 2 supplements
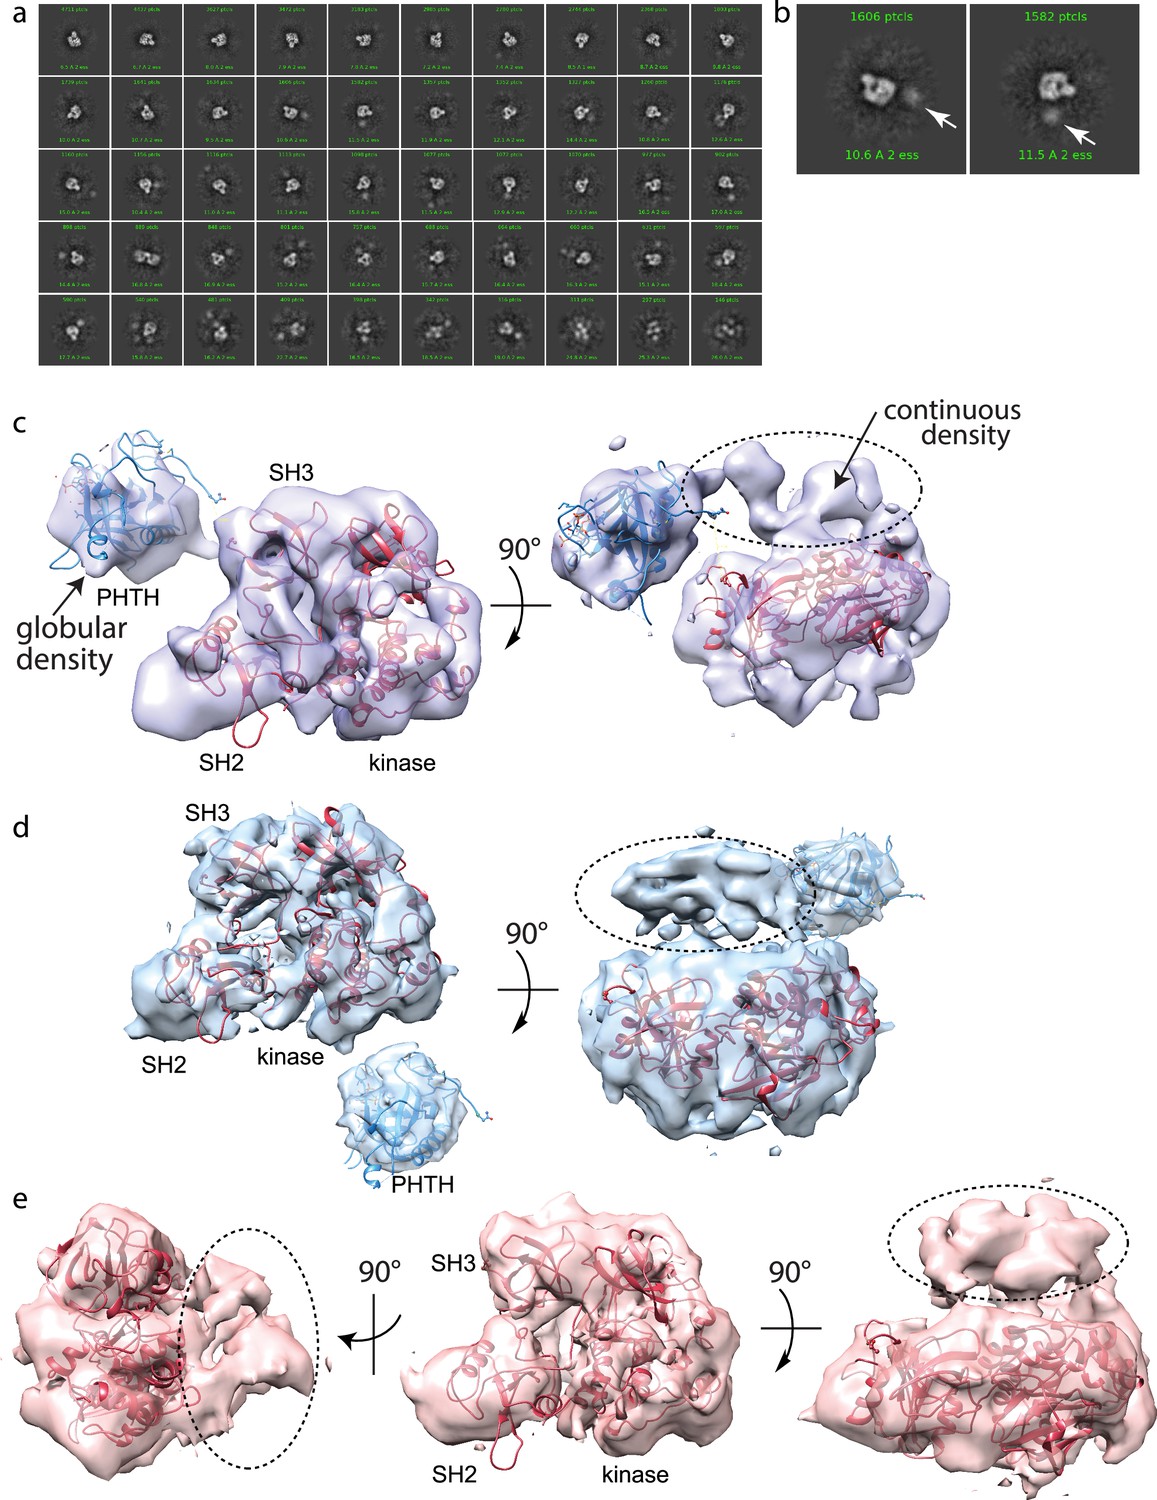
Full-length Bruton’s tyrosine kinase (BTK) cryo-electron microscopy (cryoEM) analysis.
(a) 2D class averages of full-length BTK. (b) Representative 2D class averages. White arrow indicates extra density adjacent to the BTK SH3–SH2–kinase core density. (c–e) Three final 3D reconstructions (see workflow in Figure 4—figure supplement 1). (c) Two views of the Class 0 map with the SH3–SH2–kinase fragment (PDB: 8GMB) fit into the larger density and monomeric Pleckstrin homology/Tec homology (PHTH) domain (PDB: 1B55) fit into the smaller globular density. Continuous density between the large and small density is indicated with a dashed circle. (d) Two views of the Class 1 map with globular density fit as described for (c). The smaller globular density is located in a distinct position with respect to the SH3–SH2–kinase core compared to that shown in (c). Additionally, unmodeled density is observed adjacent to the BTK SH3–SH2–kinase core (dashed circle); the position is similar to the continuous density observed in Class 0. (e) Three views of the Class 3 map with fitted BTK SH3–SH2–kinase core and unmodeled density that is in the same location as that in (d). EMDB accession codes are as follows: EMD-40585, EMD-40586, and EMD-40587. Map fitting without user input was also carried out using Situs (Wriggers, 2012). The result of that fitting is comparable to results obtained using Chimera.
Figure 4—figure supplement 1

Workflow showing cryo-electron microscopy (cryoEM) analysis of full-length Bruton’s tyrosine kinase (BTK).
Figure 4—figure supplement 2
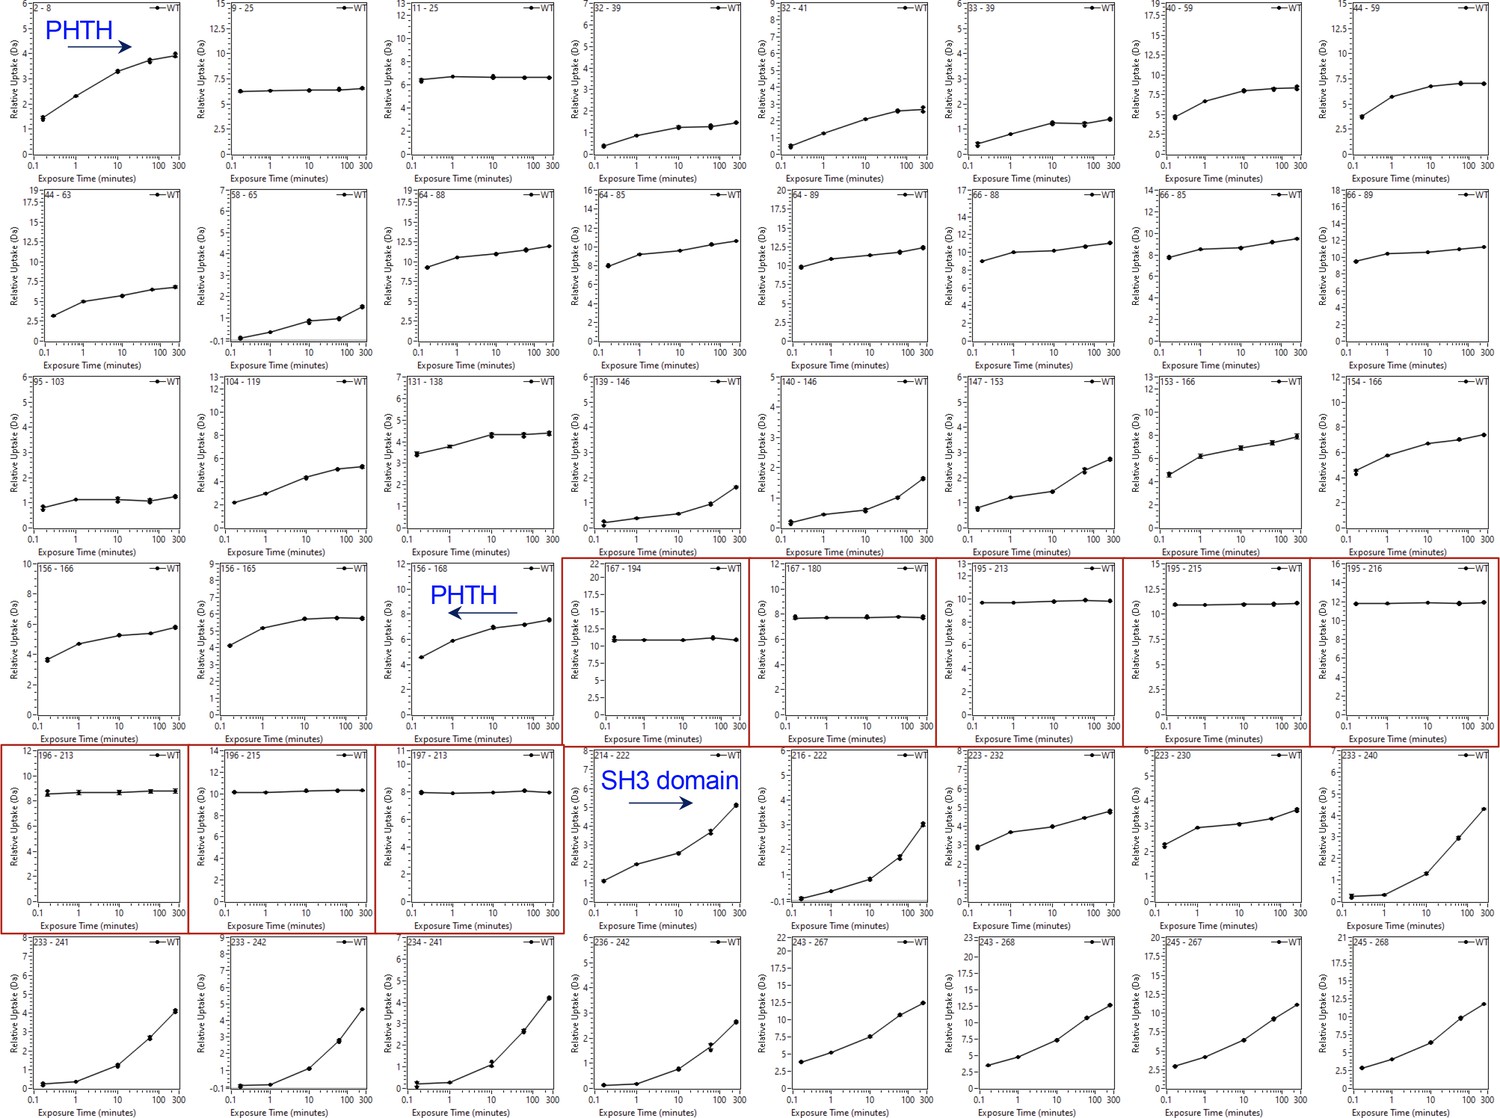
Deuterium uptake curves for the Pleckstrin homology/Tec homology (PHTH) through SH3 domain of Bruton’s tyrosine kinase (BTK).
Domain boundaries for the PHTH and the start of the SH3 domain are indicated. Uptake curves for peptides derived from the linker between PHTH and SH3 (residues 171–214) are boxed in red. The complete HDX dataset is provided in the supplemental data file.
Figure 5
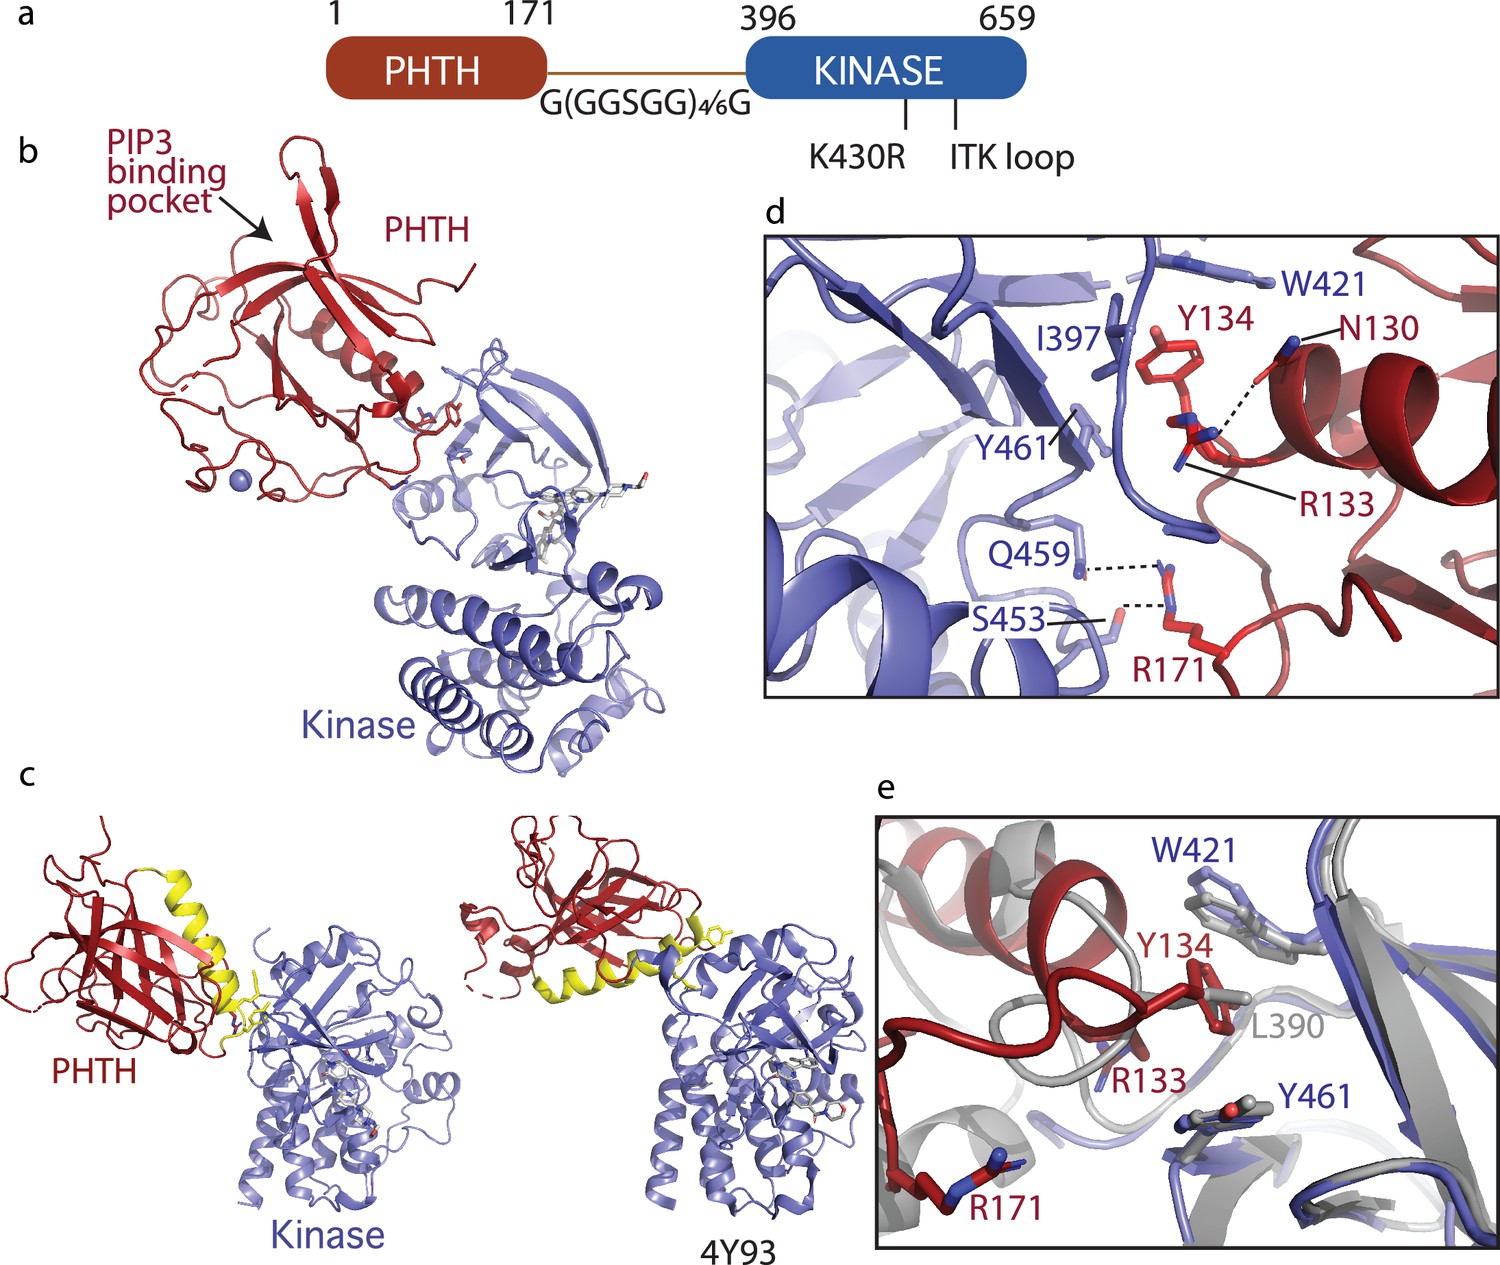
Crystallization of loosely tethered Pleckstrin homology/Tec homology (PHTH)–kinase.
(a) Architecture of the loosely tethered PHTH–kinase constructs used for crystallography. (b) Crystal structure of the PHTH–kinase protein (PDB: 8S93). The PHTH domain (red) docks onto the back of the kinase domain N-lobe (blue). The location of the phosphatidylinositol (3,4,5)-trisphosphate (PIP3)-binding pocket on PHTH is indicated. (c) Direct comparison of the loosely tethered PHTH–kinase structure solved here (left, PDB: 8S93) and the more tightly tethered PHTH–kinase structure solved previously (right, PDB: 4Y93, right). The PHTH domain helix is colored yellow and the kinase domains are in the same orientation to emphasize the difference between the PHTH domains in the two structures. (d) PHTH/kinase interface. PHTH side chains R133, Y134, and R171 (red) make contacts to the Bruton’s tyrosine kinase (BTK) domain (blue). Dotted lines indicate hydrogen bonds. (e) Close-up view of the hydrophobic stack (flanked by W421 and Y461) on the kinase domain N-lobe. The PHTH Y134 residue (red) inserts into the hydrophobic stack (blue) in the loosely tethered PHTH–kinase structure solved here while L390 from the SH2–kinase linker (gray) completes the hydrophobic stack in the previously solved PHTH–kinase structure (PDB: 4Y93).
Figure 6
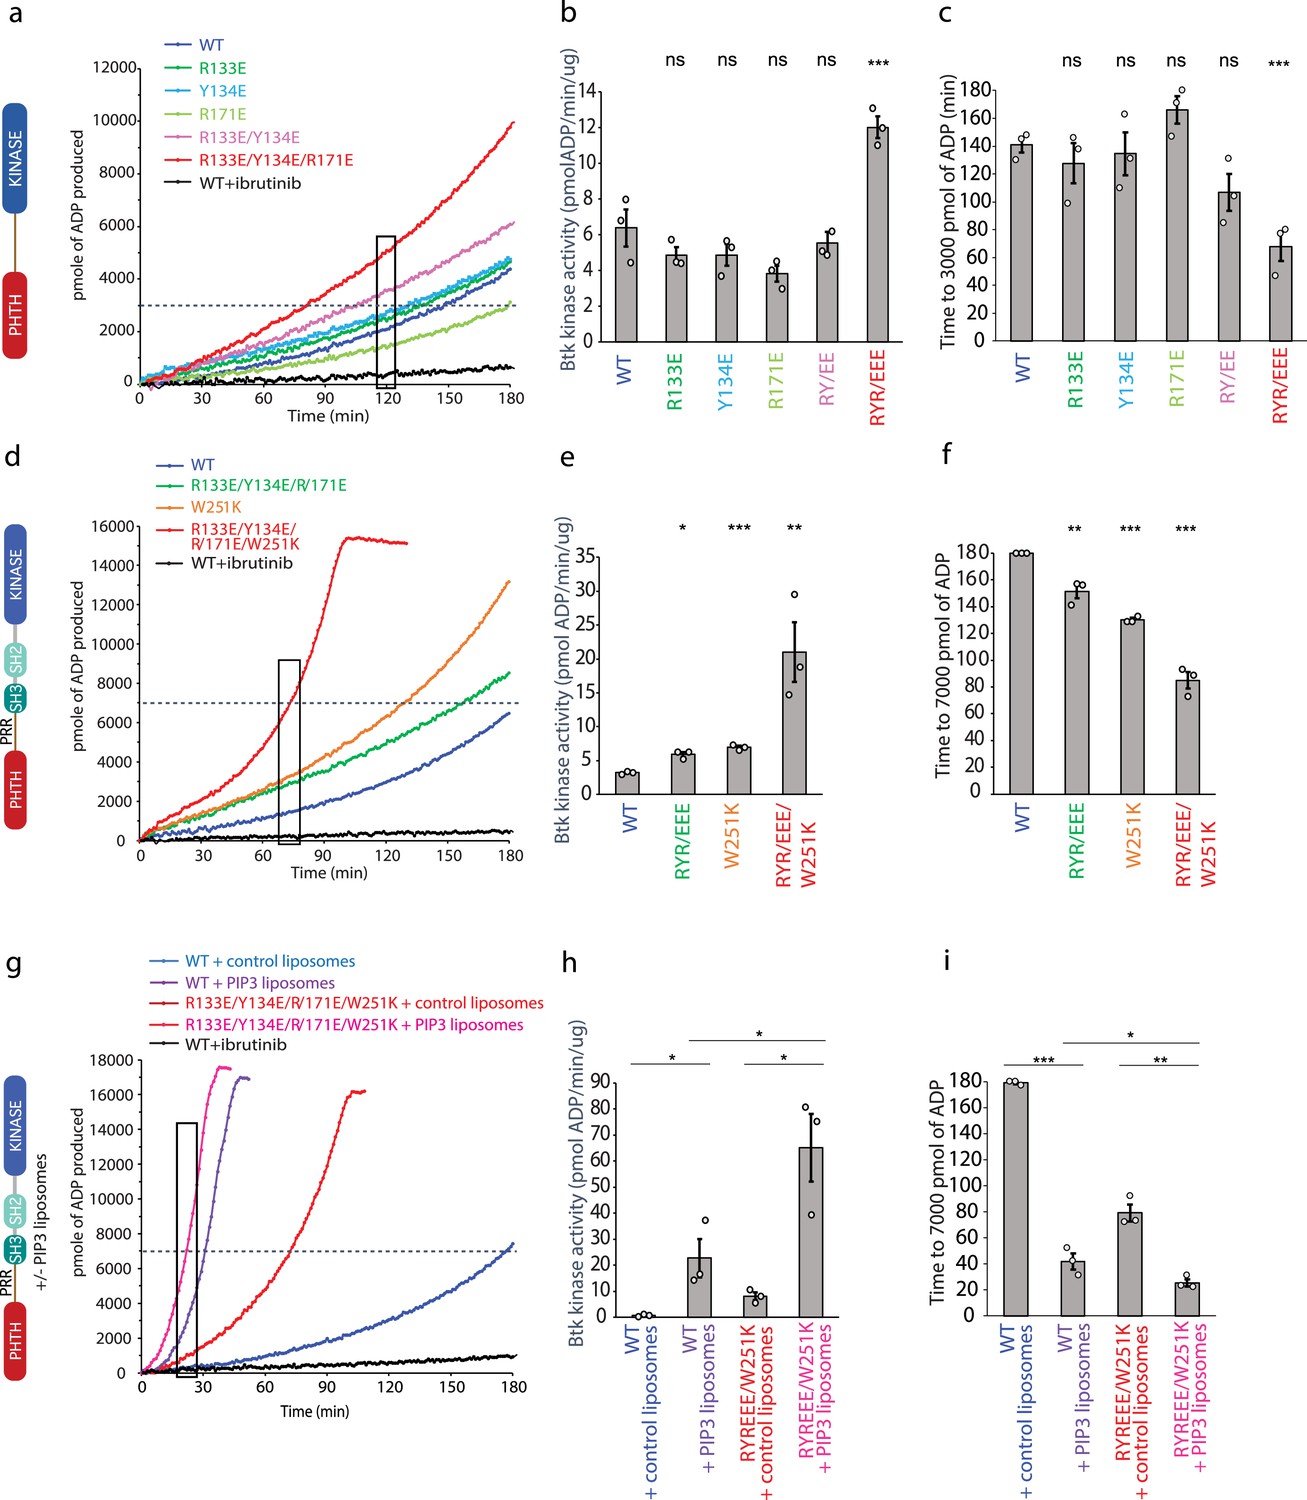
Bruton’s tyrosine kinase (BTK) activity assays.
(a–c) Representative progress curves, catalytic rate comparisons, and time to threshold ADP for the PH–KD construct. Wild-type BTK Pleckstrin homology/Tec homology (PHTH)–kinase protein is compared with single, double, and triple mutants to probe the PHTH/kinase interface. Ibrutinib inhibition leads to reduction of ADP production (black curve in all experiments). (d–f) Representative progress curves, catalytic rate comparisons, and time to threshold ADP for full-length BTK. Wild-type BTK is compared to the following full-length BTK mutants: R133E/Y134E/R171E, W251K, or W251K/R133E/Y134E/R171E. (g–i) Representative progress curves, catalytic rate comparisons, and time to threshold ADP for full-length WT BTK and R133E/Y134E/R171E mutant in the presence of either control or phosphatidylinositol (3,4,5)-trisphosphate (PIP3) liposomes. (a, d, g) Representative progress curves of ADP production by BTK are from one of the three independent experiments, and each data point is the average of at least two replicates. Bar graphs (b, e, h) represent the average kinase activity rate ± standard error calculated from the boxed region of the corresponding progress curves. Bar graphs (c, f, i) represent the average time to a threshold value of ADP, indicated by dashed line on progress curves. Open circles on all bar graphs represent specific values in each independent experiment. For reactions for which the threshold ADP value is not reached (WT BTK in panels f and i) the values are reported as 180 min. The effect of mutations compared with the wild-type BTK was evaluated by Student’s t-test (*p < 0.05; **p < 0.01; ***p < 0.001; ns, not significant).
Figure 7

Bruton’s tyrosine kinase (BTK) dimer.
(a) Crystal structure of the BTK kinase domain dimer (PDB: 8S9F). Monomers are shown in gray and blue with one represented in cartoon and the other surface rendered. The C-helix, β3 strand, G-helix, and bound dasatinib are labeled. The region containing the swapped activation loops is indicated with a dashed circle. The portion of the activation loop for which electron density is missing is indicated with a dashed blue line. (b, c) Side chain interactions mediating the N- and C-lobe dimer interfaces, respectively. (d) Close-up view of activation loop of one monomer extending into the active site of the other monomer. Electron density is absent between Y545 and K558 (indicated with blue spheres). Dashed line indicates possible path for the 13 missing residues that contain Y551. Superimposed on the BTK dimer structure are the PKC kinase domain structure bound to substrate (PDB: 4DC2, green) and insulin-like growth factor 1 receptor kinase bound to substrate (PDB: 1K3A, red); kinase domains are excluded for clarity. The serine and tyrosine phosphoacceptors on these substrates are positioned close to the putative location of BTK Y551 (white circle). (e) Unusual ‘DFG-up’ conformation. In the BTK kinase dimer, F540 inserts between K430 and E445 preventing formation of the salt bridge associated with active kinases. (f) Comparison of regulatory spine structures for active BTK kinase domain (PDB: 3K54), inactive BTK (PDB: 3GEN), and the ‘DFG-up’ structure solved here (PDB: 8S9F). F540 is orange and other R-spine residues are in blue. W395 is at the top of the R-spine in BTK; the ‘DFG-up’ configuration stabilizes the active rotamer of W395 (Joseph et al., 2010; Chopra et al., 2016).
Figure 8
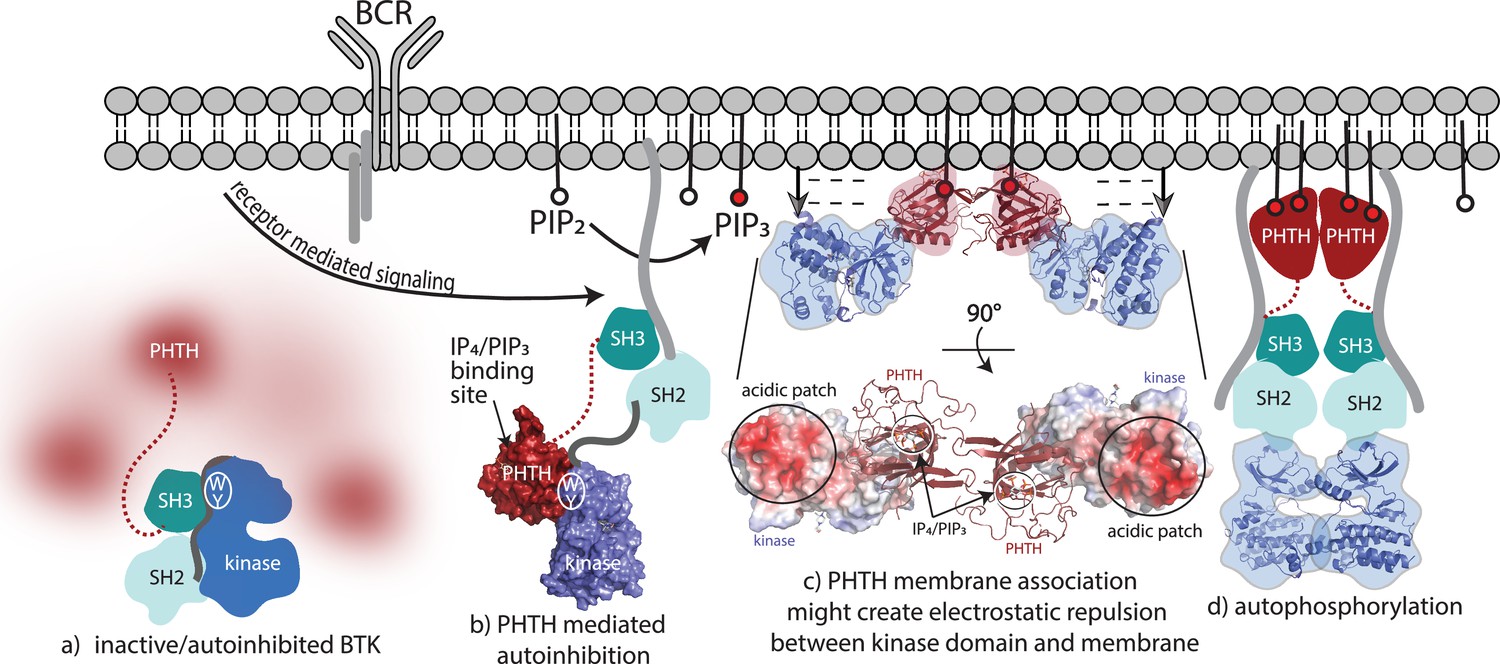
Bruton’s tyrosine kinase (BTK) activation model.
(a) Inactive, autoinhibited BTK, the conformational heterogeneity of the Pleckstrin homology/Tec homology (PHTH) domain is indicated in fuzzy red. The hydrophobic stack residues, W421 and Y461, are indicated on the kinase domain N-lobe as . (b) Engagement of the BTK SH3 and SH2 domains with exogenous ligands would allow for the PHTH domain to adopt its autoinhibitory pose. Surface rendering of structure solved here (PDB: 8S93) is included, accessibility of the inositol 1,3,4,5-tetrakisphosphate (IP4)/phosphatidylinositol (3,4,5)-trisphosphate (PIP3)-binding site is shown, and hydrophobic stack resides are indicated as in (a). (c) Two PHTH–kinase structures are superimposed on the Saraste PHTH dimer (PDB: 1B55). The top model indicates potential for electrostatic repulsion between membrane and BTK kinase domain in this arrangement (negative charges indicated by ----- and arrows suggest unfavorable interactions between negatively charged surfaces). A 90° rotation (bottom) shows the acidic patch on the kinase domain and the PIP3-binding sites on the PHTH domain (circled) are on the same surface of the structure. (d) Release of all autoinhibitory contacts and dimerization of the BTK kinase domain (PDB: 8S9F) lead to autophosphorylation on Y551 in the activation loop of each kinase domain.
Tables
Key resources table
| Reagent type (species) or resource | Designation | Source or reference | Identifiers | Additional information |
|---|---|---|---|---|
| Recombinant DNA reagent | FL BTK-C6H pET20 (plasmid) | DOI: 10.1016/j.str.2017.07.014 | Residues 1–659 wIth Y617P mutation, UniProt: P35991 | |
| Recombinant DNA reagent | FL BTK-C6H Q91A, I92A, I94A, and I95A pET20 (plasmid) | This paper | Residues 1–659 wIth Y617P mutation | |
| Recombinant DNA reagent | FL BTK-C6H A384P, S386P, T387P, and A388P pET20 (plasmid) | This paper | Residues 1–659 wIth Y617P mutation | |
| Recombinant DNA reagent | FL BTK-C6H A384P, S386P, T387P, A388P, and L390F pET20 (plasmid) | This paper | Residues 1–659 wIth Y617P mutation | |
| Recombinant DNA reagent | FL BTK-C6H L542M, S543T, V555T, R562K, S564A, and P565S pET20 (plasmid) | This paper | Residues 1–659 wIth Y617P mutation | |
| Recombinant DNA reagent | SH3-SH2-kinase BTK-C6H pET20 (plasmid) | This paper | Residues 214–659 wIth Y617P mutation | |
| Recombinant DNA reagent | SH3-SH2-kinase BTK-C6H A384P, S386P, T387P, A388P, and L390F pET20 (plasmid) | This paper | Residues 214–659 wIth Y617P mutation | |
| Recombinant DNA reagent | N6H-SUMO-FL BTK pET20 (plasmid) | This paper | Residues 1–659 wIth Y617P mutation | |
| Recombinant DNA reagent | N6H-SUMO-FL BTK W251K pET20 (plasmid) | This paper | Residues 1–659 wIth Y617P mutation | |
| Recombinant DNA reagent | N6H-SUMO-FL BTK R133E/Y134E/R171E pET20 (plasmid) | This paper | Residues 1–659 wIth Y617P mutation | |
| Recombinant DNA reagent | N6H-SUMO-FL BTK R133E/Y134E/R171E/W251K pET20 (plasmid) | This paper | Residues 1–659 wIth Y617P mutation | |
| Recombinant DNA reagent | N6H-SUMO-FL BTKsc pET20 (plasmid) | This paper | Residues 1–659 wIth Y617P mutation | |
| Recombinant DNA reagent | N6H-SUMO-FL BTKsc Δ185–194 pET20 (plasmid) | This paper | Residues 1–184, 195–659 wIth Y617P mutation | |
| Recombinant DNA reagent | N6H-SUMO-FL BTKsc Δ185–206 pET20 (plasmid) | This paper | Residues 1–184, 207–659 wIth Y617P mutation | |
| Recombinant DNA reagent | N6H-SUMO-FL BTKsc Δ181–206 pET20 (plasmid) | This paper | Residues 1–180, 207–659 wIth Y617P mutation | |
| Recombinant DNA reagent | N6H-SUMO-FL BTKsc Δ175–210 pET20 (plasmid) | This paper | Residues 1–174, 211–659 wIth Y617P mutation | |
| Recombinant DNA reagent | N6H-SUMO-FL BTKsc Δ173–215 pET20 (plasmid) | This paper | Residues 1–172, 216–659 wIth Y617P mutation | |
| Recombinant DNA reagent | N6H-SUMO-1PHTH171-G(GGSGG)4G-396kinase659 Q91A, I92A, I94A, I95A, K430R, L542M, S543T, V555T, R562K, S564A, and P565S pET28 (plasmid) | This paper | Residues 1–171, 396–659 wIth Y617P mutation | |
| Recombinant DNA reagent | N6H-SUMO-1PHTH171-G(GGSGG)6G-396kinase659 Q91A, I92A, I94A, I95A, K430R, L542M, S543T, V555T, R562K, S564A, and P565S pET28 (plasmid) | This paper | Residues 1–171, 396–659 wIth Y617P mutation | |
| Recombinant DNA reagent | N6H-SUMO-1PHTH176-G(GGSGG)4G-384kinase659 pET28 (plasmid) | This paper | Residues 1–176, 384–659 wIth Y617P mutation | |
| Recombinant DNA reagent | N6H-SUMO-1PHTH176-G(GGSGG)4G-384kinase659 R133E pET28 (plasmid) | This paper | Residues 1–176, 384–659 wIth Y617P mutation | |
| Recombinant DNA reagent | N6H-SUMO-1PHTH176-G(GGSGG)4G-384kinase659 Y134E pET28 (plasmid) | This paper | Residues 1–176, 384–659 wIth Y617P mutation | |
| Recombinant DNA reagent | N6H-SUMO-1PHTH176-G(GGSGG)4G-384kinase659 R133E/Y134E pET28 (plasmid) | This paper | Residues 1–176, 384–659 wIth Y617P mutation | |
| Recombinant DNA reagent | N6H-SUMO-1PHTH176-G(GGSGG)4G-384kinase659 R133E/Y134E/171E pET28 (plasmid) | This paper | Residues 1–176, 384–659 wIth Y617P mutation | |
| Recombinant DNA reagent | N6H-SUMO KD Y551E/L390G pET20 (plasmid) | This paper | Residues 382–659 wIth Y617P mutation | |
| Recombinant DNA reagent | pCDFDuet YopH | Thomas E. Smithgall | ||
| Strain, strain background (Escherichia coli) | BL21 (DE3) | Thermo Fisher Scientific | Cat#C600003 | https://www.thermofisher.com/order/catalog/product/C600003 |
| Other | 1,2-Dioleoyl-sn-glycero-3-phosphocholine (DOPC) | Avanti Polar Lipids | Cat#850375P | https://avantilipids.com/product/850375 |
| Other | 1,2-Dioleoyl-sn-glycero-3-phospho-L-serine (DOPS) | Avanti Polar Lipids | Cat#840035P | https://avantilipids.com/product/840035 |
| Other | 1,2-Dioleoyl-sn-glycero-3-phosphoinositol-3,4,5-trisphosphate (tetra-ammonium salt) (PIP3) | Avanti Polar Lipids | Cat#850156P | https://avantilipids.com/product/850156 |
| Other | Pyruvate Kinase/Lactic Dehydrogenase | MilliporeSigma | Cat#P0294 | https://www.sigmaaldrich.com/US/en/product/sigma/p0294?gclid=EAIaIQobChMIobDx8MqZgwMVyVdyCh1-egAIEAAYASAAEgLOzPD_BwE |
| Other | SYPRO Protein Gel Stains | Thermo Fisher Scientific | Cat#S6650 | https://www.thermofisher.com/order/catalog/product/S6650 |
| Other | Phusion Hot Start II DNA Polymerase | Thermo Fisher Scientific | Cat#F549L | https://www.thermofisher.com/order/catalog/product/F549L?SID=srch-srp-F549L |
| Antibody | BD Pharmingen Purified Mouse anti-Btk (pY551)/Itk (pY511) (mouse monoclonal) | BD Biosciences | Cat#558034 | WB (1:1000) |
| Software, algorithm | Coot | DOI: 10.1107/S0907444910007493 | v0.9.8.8 | https://www2.mrc-lmb.cam.ac.uk/personal/pemsley/coot/ |
| Software, algorithm | autoPROC | DOI: 10.1107/S0907444911007773 | v20211020 | https://www.globalphasing.com/autoproc/ |
| Software, algorithm | XDS | DOI: 10.1107/S0907444909047337 | v20220110 | https://xds.mr.mpg.de/ |
| Software, algorithm | STARANISO | DOI: 10.1107/S010876731809640X | v3.350 | https://staraniso.globalphasing.org/staraniso_about.html |
| Software, algorithm | CCP4i suite | DOI:10.1107/S2059798323003595 | v0.8 | https://www.ccp4.ac.uk/ |
| Software, algorithm | Phaser | DOI: 10.1107/S0021889807021206 | v2.8 | https://www.phaser.cimr.cam.ac.uk/index.php/Phaser_Crystallographic_Software |
| Software, algorithm | Phenix | DOI: 10.1107/S2059798319011471 | v1.20-4459 | https://phenix-online.org/ |
| Software, algorithm | CryoSparc | Structura Biotechnology Inc | v4.1.2 | https://cryosparc.com/ |
| Software, algorithm | PyMOL | Shrodinger LLC | v2.5.5 | https://www.pymol.org/ |
| Software, algorithm | DynamX | WATERS | v3.0 | https://www.waters.com/nextgen/us/en.html |
| Software, algorithm | PLGS | WATERS | v3.0 | https://www.waters.com/nextgen/us/en.html |
| Software, algorithm | FrameSlice | The SIBYLS Beamline | N/A | https://sibyls.als.lbl.gov/ran |
| Software, algorithm | BioXTAS RAW | DOI: 10.1107/S1600576717011438 | v2.1.4 | https://bioxtas-raw.readthedocs.io/en/latest/ |
| Software, algorithm | ATSAS: ALMERGE | EMBL Hamburg | v3.2.1 | https://www.embl-hamburg.de/biosaxs/manuals/almerge.html |
| Software, algorithm | Chimera | UCSF | v1.15 | https://www.cgl.ucsf.edu/chimera/ |
Table 1
Data collection and refinement statistics.
| FL Btk†,‡ | PHTH/KD complex*,‡ | KD with dasatinib†,‡ | |
|---|---|---|---|
| PDB codes | 8GMB | 8S93 | 8S9F |
| Data collection | |||
| Space group | P 31 2 1 | P 1 21 1 | P 1 21 1 |
| Cell dimensions | |||
| a, b, c (Å) | 125.72, 125.72, 110.09 | 38.38, 77.38, 82.32 | 55.24, 110.04, 61.14 |
| α, β, γ (°) | 90, 90, 120 | 90, 97.98, 90 | 90, 99.51, 90 |
| Resolution (Å)§ | 108.88–3.19 (3.53–3.19) | 81.53–2.00 (2.20–2.00) | 55.02–2.50 (2.79–2.50) |
| Spherical data completeness (%)§ | 67.7 (13.2) | 54.5 (13.6) | 69.7 (12.5) |
| Ellipsoidal data completeness (%)§ | 94.2 (70.4) | 84.1 (78.5) | 91.8 (52.0) |
| Rmerge§ | 0.27 (>1) | 0.13 (0.80) | 0.26 (>1) |
| Rmeas§ | 0.27 (>1) | 0.16 (0.95) | 0.396 (>1) |
| CC1/2§ | 0.998 (0.74) | 0.99 (0.54) | 0.99 (0.56) |
| Mean I /σ§ | 17.8 (2.0) | 7.1 (1.6) | 11.2 (1.4) |
| Multiplicity§ | 88.5 (82.2) | 3.7 (3.3) | 14.8 (14.9) |
| Refinement | |||
| Resolution (Å)§ | 19.58–3.40 (3.52–3.40) | 19.71–2.10 (2.18–2.10) | 19.96–2.60 (2.69–2.60) |
| Number of reflections§ | 11,205 (295) | 21,392 (572) | 17,286 (300) |
| Rwork / Rfree (%) | 27.63/28.93 | 19.95/24.86 | 24.34/28.95 |
| Number of non-hydrogen atoms | 3168 | 3759 | 4167 |
| Protein | 3119 | 3525 | 4034 |
| Ligand/ion | 93 | 108 | 118 |
| Water | 0 | 178 | 67 |
| Average B-factor | 157.69 | 39.89 | 78.30 |
| Protein | 158.15 | 40.15 | 78.73 |
| Ligand/ion | 128.60 | 36.73 | 74.73 |
| Water | 35.74 | 56.37 | |
| Ramachandran statistics | |||
| Favored (%) | 93.72 | 97.62 | 96.59 |
| Allowed (%) | 6.05 | 2.38 | 3.41 |
| Outliers (%) | 0.23 | 0.00 | 0.00 |
| Clashscore | 6.56 | 1.69 | 3.27 |
| R.m.s. deviations | |||
| Bond lengths (Å) | 0.002 | 0.002 | 0.002 |
| Bond angles (°) | 0.43 | 0.49 | 0.43 |
-
*
X-ray data from a single crystal.
-
†
X-ray data from multiple crystals.
-
‡
X-ray data anisotropically corrected with the STARANISO webserver (Global Phasing).
-
§
Statistics for the highest resolution shell are shown in parentheses.
Author response table 1
| Fit-in-map | Situs | |
|---|---|---|
| Class 0 | 0.7181 | 0.6144 |
| Class 1 | 0.7003 | 0.6277 |
| Class 3 | 0.6273 | 0.5798 |
Additional files
-
Supplementary file 1
Summary and list of experimental parameters for hydrogen deuterium exchange data acquisition.
- https://cdn.elifesciences.org/articles/89489/elife-89489-supp1-v1.xlsx
-
MDAR checklist
- https://cdn.elifesciences.org/articles/89489/elife-89489-mdarchecklist1-v1.docx
Download links
A two-part list of links to download the article, or parts of the article, in various formats.
Downloads (link to download the article as PDF)
Open citations (links to open the citations from this article in various online reference manager services)
Cite this article (links to download the citations from this article in formats compatible with various reference manager tools)
Conformational heterogeneity of the BTK PHTH domain drives multiple regulatory states
eLife 12:RP89489.
https://doi.org/10.7554/eLife.89489.3


