CLOCK evolved in cnidaria to synchronize internal rhythms with diel environmental cues
- Mina and Everard Goodman Faculty of Life Sciences, Bar-Ilan University, Israel
- The Multidisciplinary Brain Research Center, Bar-Ilan University, Israel
Figures
Figure 1 with 1 supplement
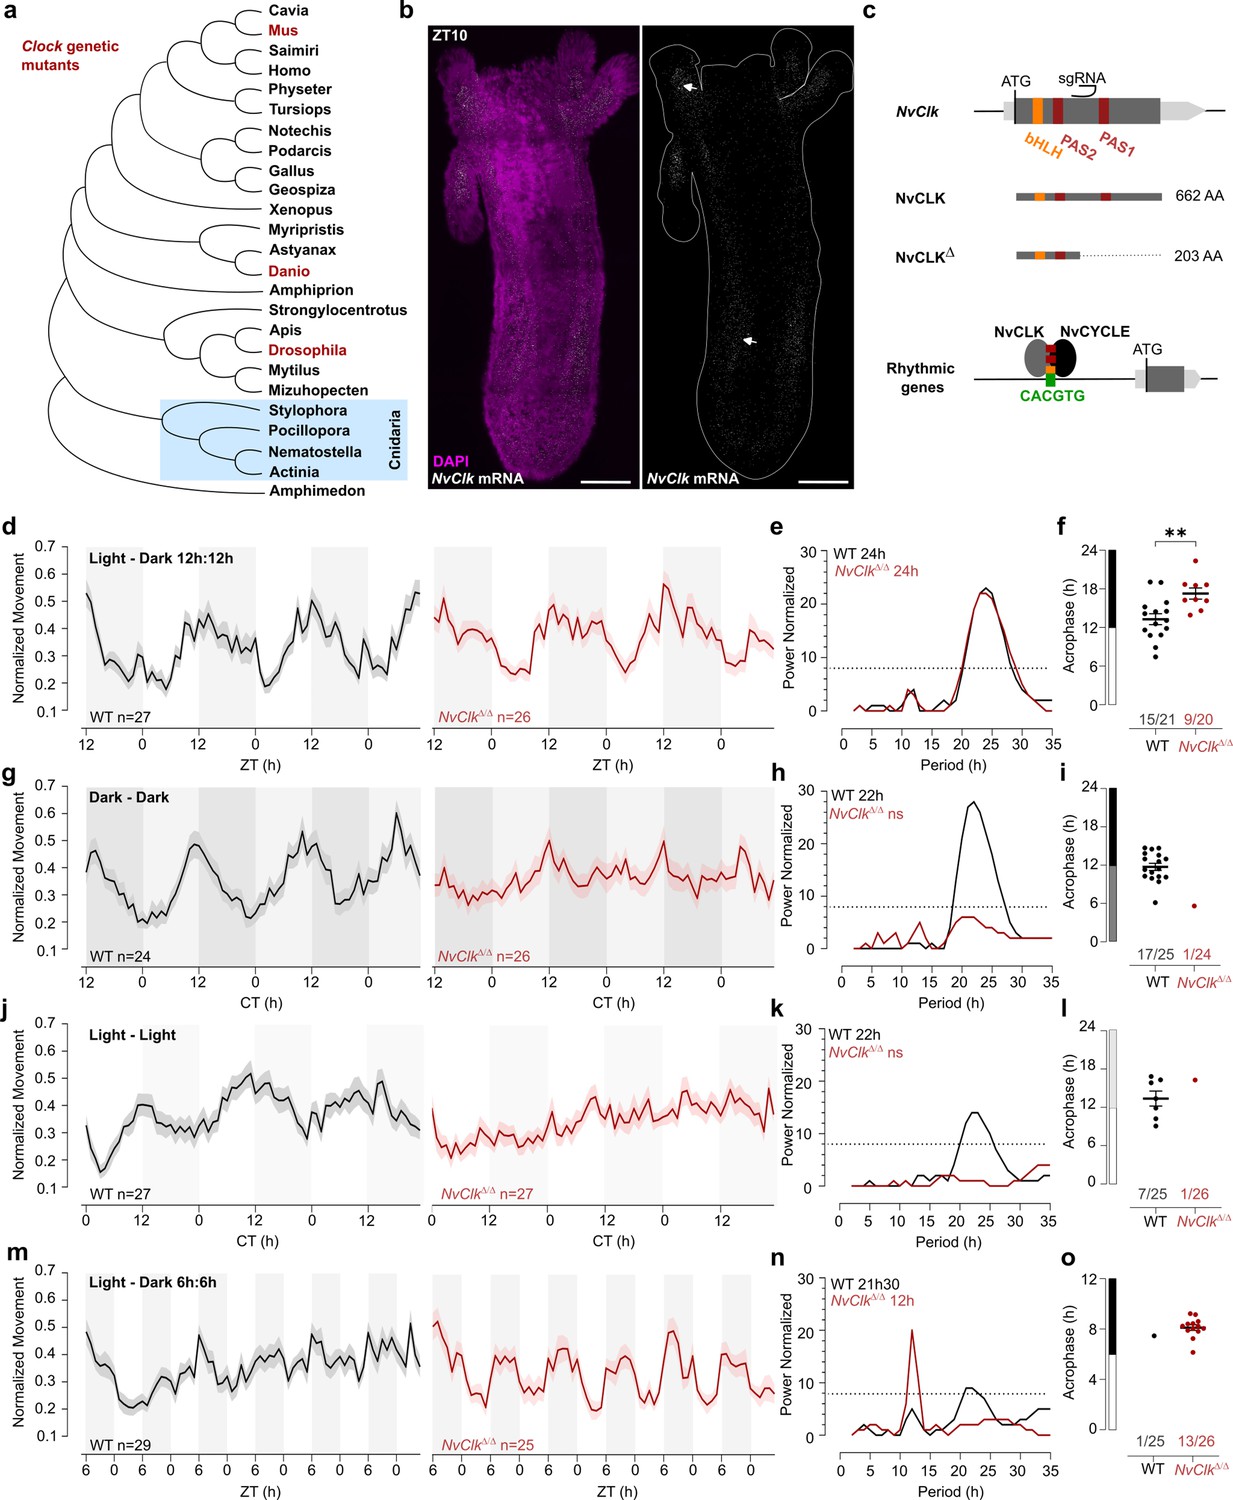
NvClkΔ/Δ cannot maintain circadian behavior in non-diel light conditions.
(a) Phylogenetic tree showing the evolutionary relationship of CLK orthologs across different animal species. (b) In situ hybridization of NvClk in the wild-type (WT) juvenile with scale bars representing 0.1 mm. (c) Schematic representation of the NvClk gene in gray, with the open reading frame (ORF) in dark gray and the conserved protein domains basic helix–loop–helix (bHLH) (yellow) and PAS1 and PAS2 (dark red). The CRISPR-generated NvClkΔ allele has a +20 nt insertion after the PAS1 domain, represented by a black arrowhead. NvCLK dimerizes via its three functional domains with NvCYCLE binding the CACGTG ebox to drive rhythmic transcription. (d, g, j, m). Normalized Movement (a.u), hourly binned over 72 hr, under different light conditions: 12 hr light:12 hr dark, continuous dark (Dark - Dark), continuous light (Light - Light), and 6 hr light:6 hr dark. The black line represents the WT, and the red line represents the NvClkΔ/Δ mutant. (e, h, k, n) Lomb-Scargle Periodograms for each corresponding light condition. The significant period value (p<0.01) is indicated for each genotype in the top left corner of each graph. (f, i, l, o) Phase detection (Cosinor) and genotype comparison of 24 hr rhythmic individuals. See the number rhythmic/total on the x-axis indicating the number of 24 hr-rhythmic animals over the total population for each genotype.
Figure 1—figure supplement 1
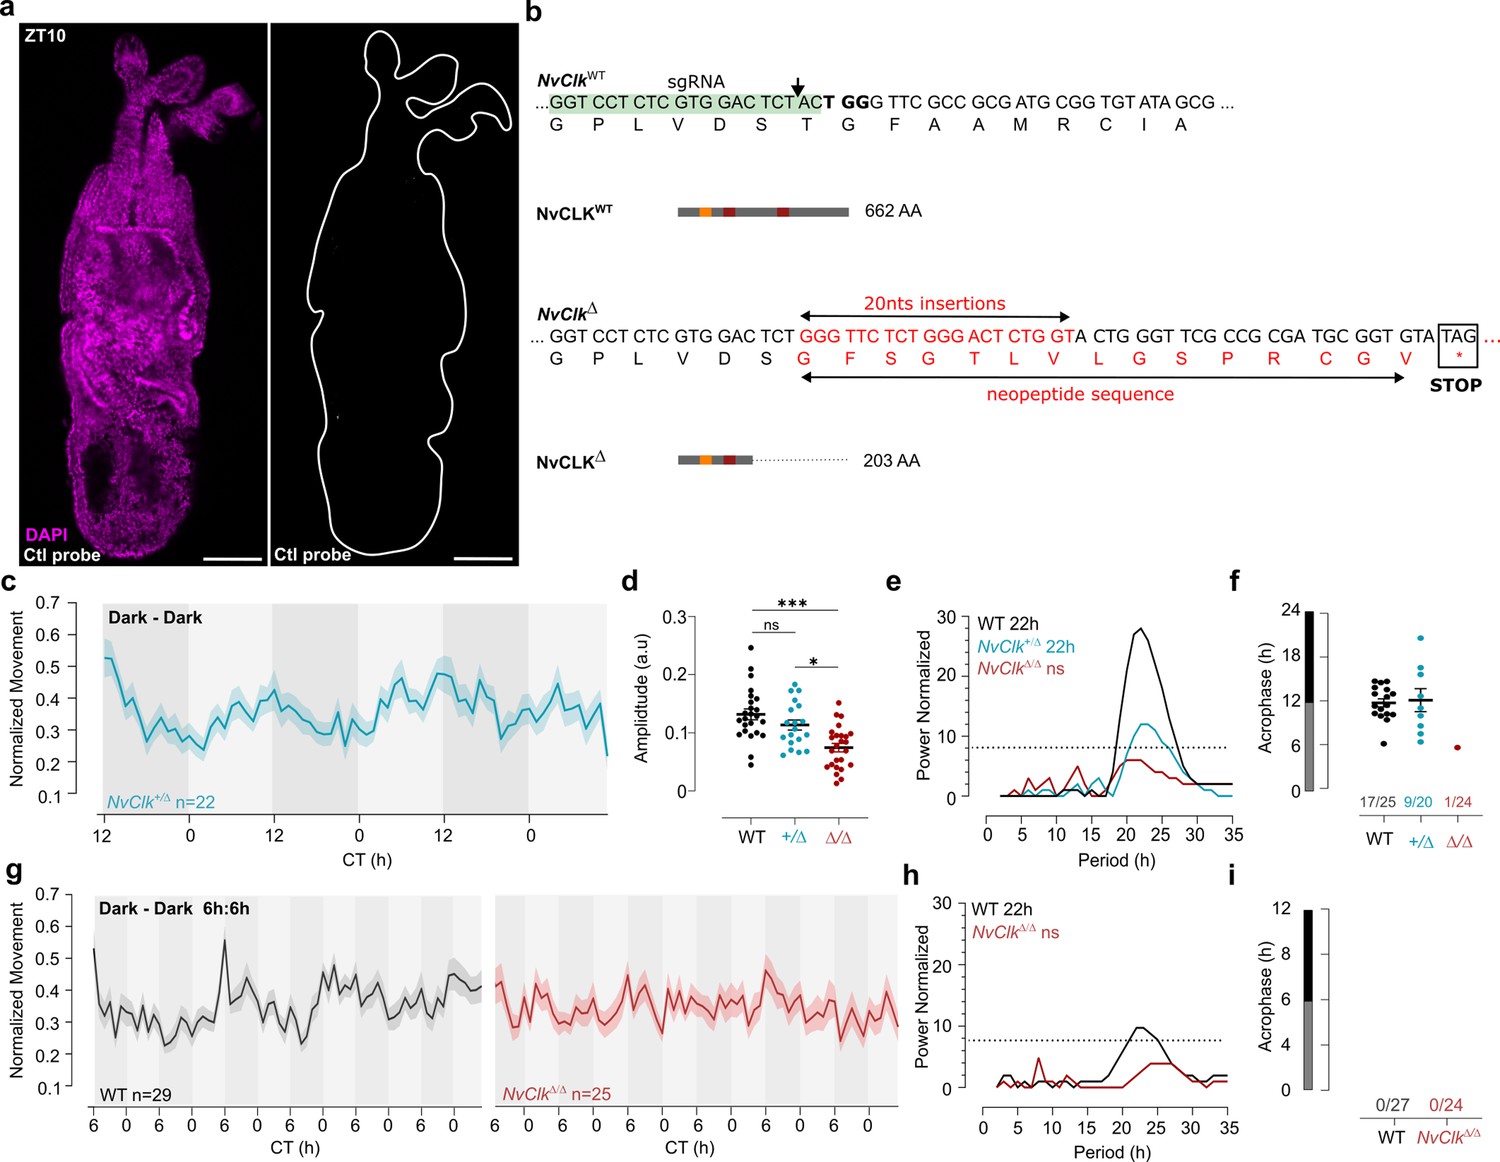
NvClkΔ/Δ cannot maintain circadian behavior in non-diel light conditions.
(a) In situ hybridization chain reaction (HCRv.3) of control probe (zebrafish transcripts) in the wild-type (WT) juvenile with scale bars representing 0.1 mm. (b) Nucleotide and translated amino acid sequences of wild-type and NvClkΔ alleles. sgRNA target site is boxed in green, PAM site is in bold, a black arrow indicates predicted site of editing. Predicted translation termination site is boxed in black. Insertion is labeled in red. Predicted immature peptide sequences in red. (c) Normalized Movement (a.u), hourly binned over 72 hr, under continuous dark (Dark - Dark), Blue line represents the NvClk +/Δ heterozygote. (d) Individual locomotor amplitude comparison between the three genotypes. Kruskal-wallis, multitest comparison *** is p<0.001; * is p<0.05. (e) Lomb-Scargle Periodograms for each corresponding genotypes in constant darkness. The significant period value (p<0.01) is indicated for each genotype in the top left corner. (f) Phase detection (Cosinor) and genotype comparison of 24 hr rhythmic individuals. See number nrhythmic/ntotal on the x-axis indicating for each genotype the number of 24 hr rhythmic animals over the total number analyzed. (g) Normalized Movement (a.u), hourly binned over 72 hr, under continuous dark (Dark - Dark) after 72 hr of LD 6 hr: 6 hr entrainment, Black line represents the WT and red line represents the NvClkΔ/Δ. (h) Lomb-Scargle Periodograms for each corresponding genotypes in constant darkness. The significant period value (p<0.01) is indicated for each genotype in the top left corner. (i) Phase detection (Cosinor) and genotype comparison of 24 hr rhythmic individuals. See number nrhythmic/ntotal on the x-axis indicating for each genotype the number of 24 hr rhythmic animals over the total number analyzed.
Figure 2 with 2 supplements
NvClkΔ/Δ shows rhythmic gene reduction in constant darkness with altered rhythmic features.
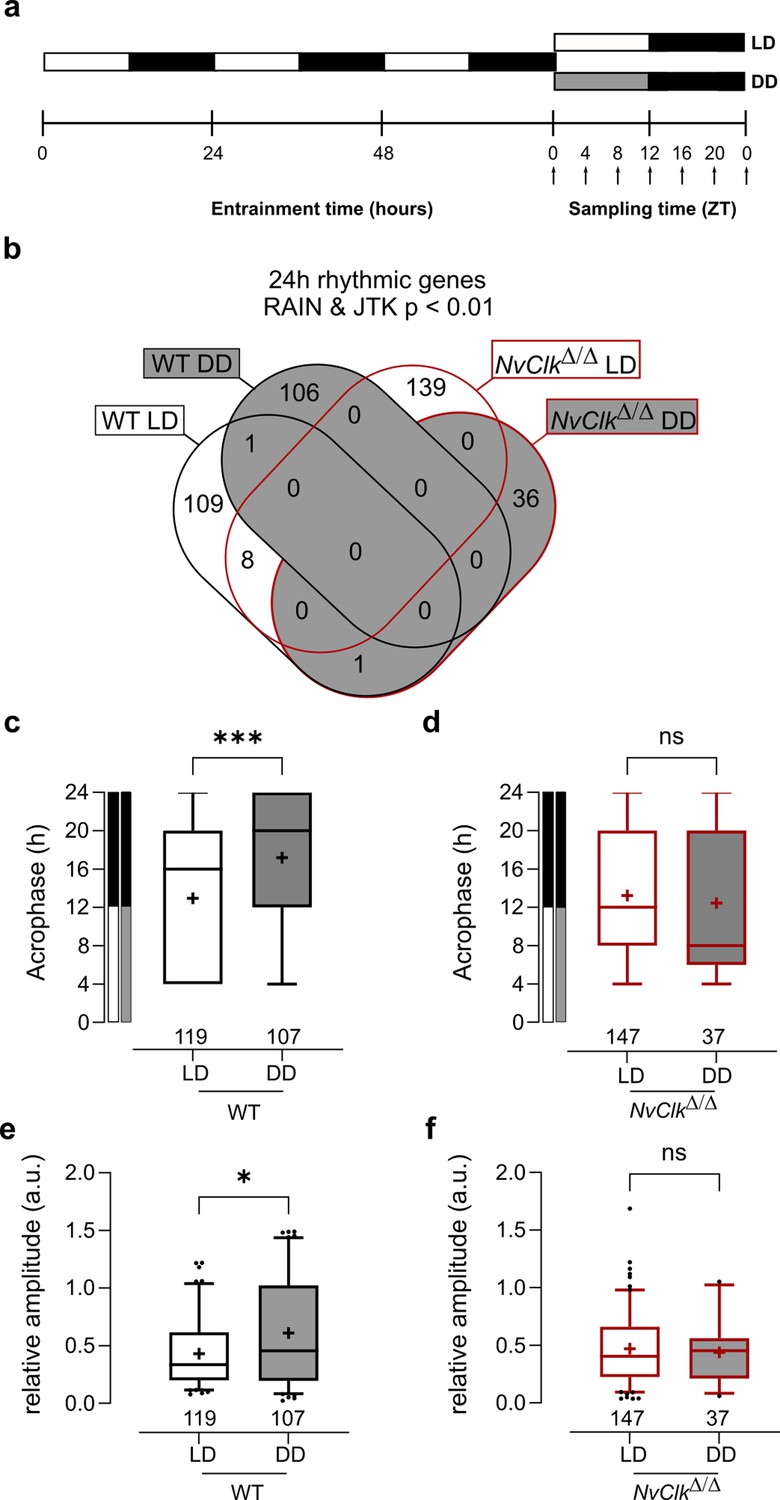
(a) Overview of the experimental design used to generate RNA-seq data. Polyps were entrained for 72 hr before sampling at 4 hr intervals over a 24 hr period (dark arrows) in both light-dark (LD) and constant dark (DD) cycles. (b) Venn diagram comparing the total number of 24 hr rhythmic genes identified in wild-type (WT) andNvClkΔ/Δ in LD and DD cycles with a p<0.01 with RAIN and JTK. (c) Average acrophase comparison between rhythmic genes in LD and DD in WT polyps. Mann-Whitney test, p<0.001. (d) Average acrophase comparison between rhythmic genes in LD and DD in NvClkΔ/Δpolyps. Mann-Whitney test, p>0.05. (e) Average relative amplitude comparison between rhythmic genes in LD and DD in WT polyps. Mann-Whitney test, p<0.05. (f) Average relative amplitude comparison between rhythmic genes in LD and DD in NvClkΔ/Δ polyps. Mann-Whitney test, p>0.05. (c–f) sample size (n) indicated below each boxplot.
Figure 2—figure supplement 1
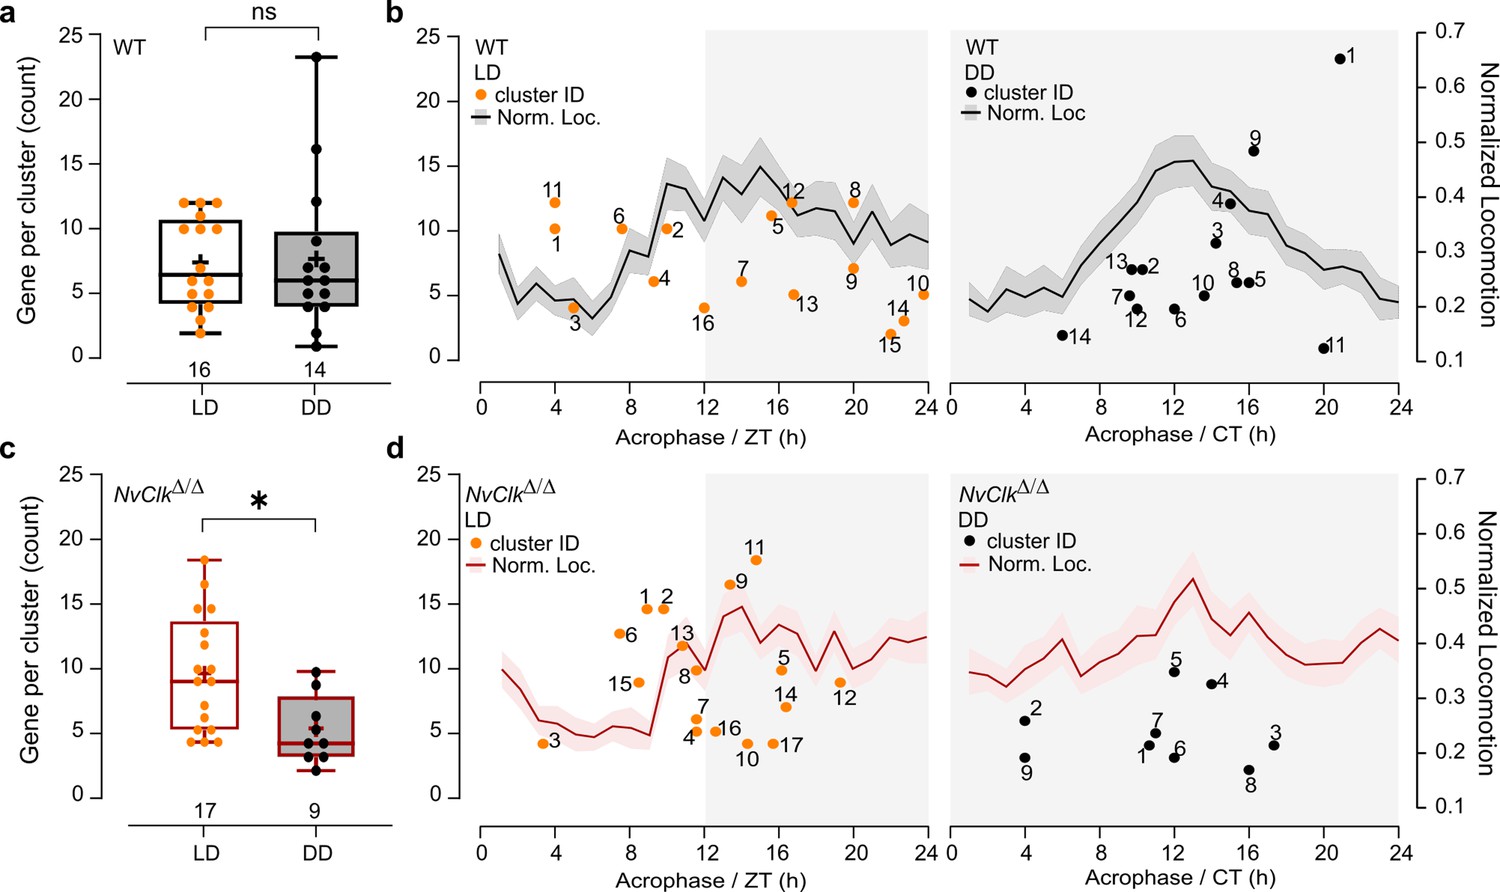
Organization of transcriptional time clusters by phase relative to behavioral activity.
(a) Gene per cluster counts comparison between light-dark (LD) and constant dark (DD) in wild-type (WT) polyps. The cluster number is indicated below each boxplot. Mann-Whitney, p>0.05. (b) On the left Y-axis, each dot represents the count of genes per cluster acrophase, with the number associated indicating its number ID in Supplementary file 4. On right Y-axis, the normalized behavior over time in LD and DD conditions. Data from both Y-axis are organized over 24 hr (c) Gene per cluster counts comparison between LD and DD conditions in NvClkΔ/Δ polyps. The cluster number is indicated below each boxplot. Mann-Whitney, p<0.05. (d) On the left Y-axis, each dot represents the count of genes per cluster acrophase, with the number associated indicating its number ID in Supplementary file 4. On right Y-axis, the normalized behavior over time in LD and DD conditions. Data from both Y-axis are organized over 24 hr.
Figure 2—figure supplement 2
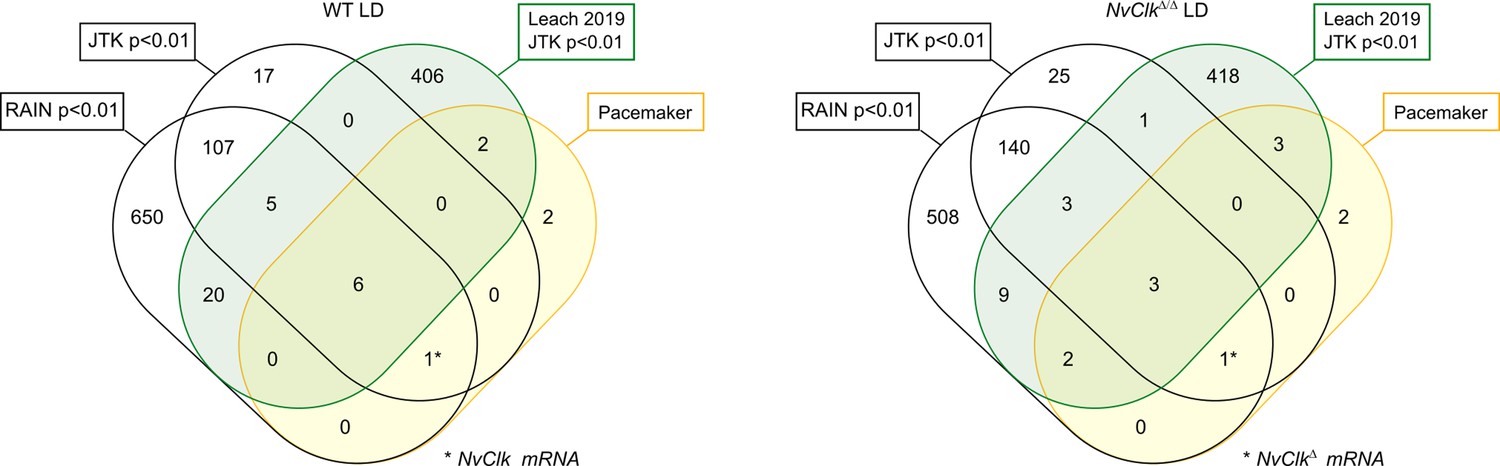
Venn diagram showing overlaps of rhythmic genes in light-dark (LD) (wild-type, WT on the left and NvClkΔ/Δ on the right) condition with rhythmic genes from Leach and Reitzel, 2019 and the candidate pacemaker genes (based on protein conservation).
Figure 3
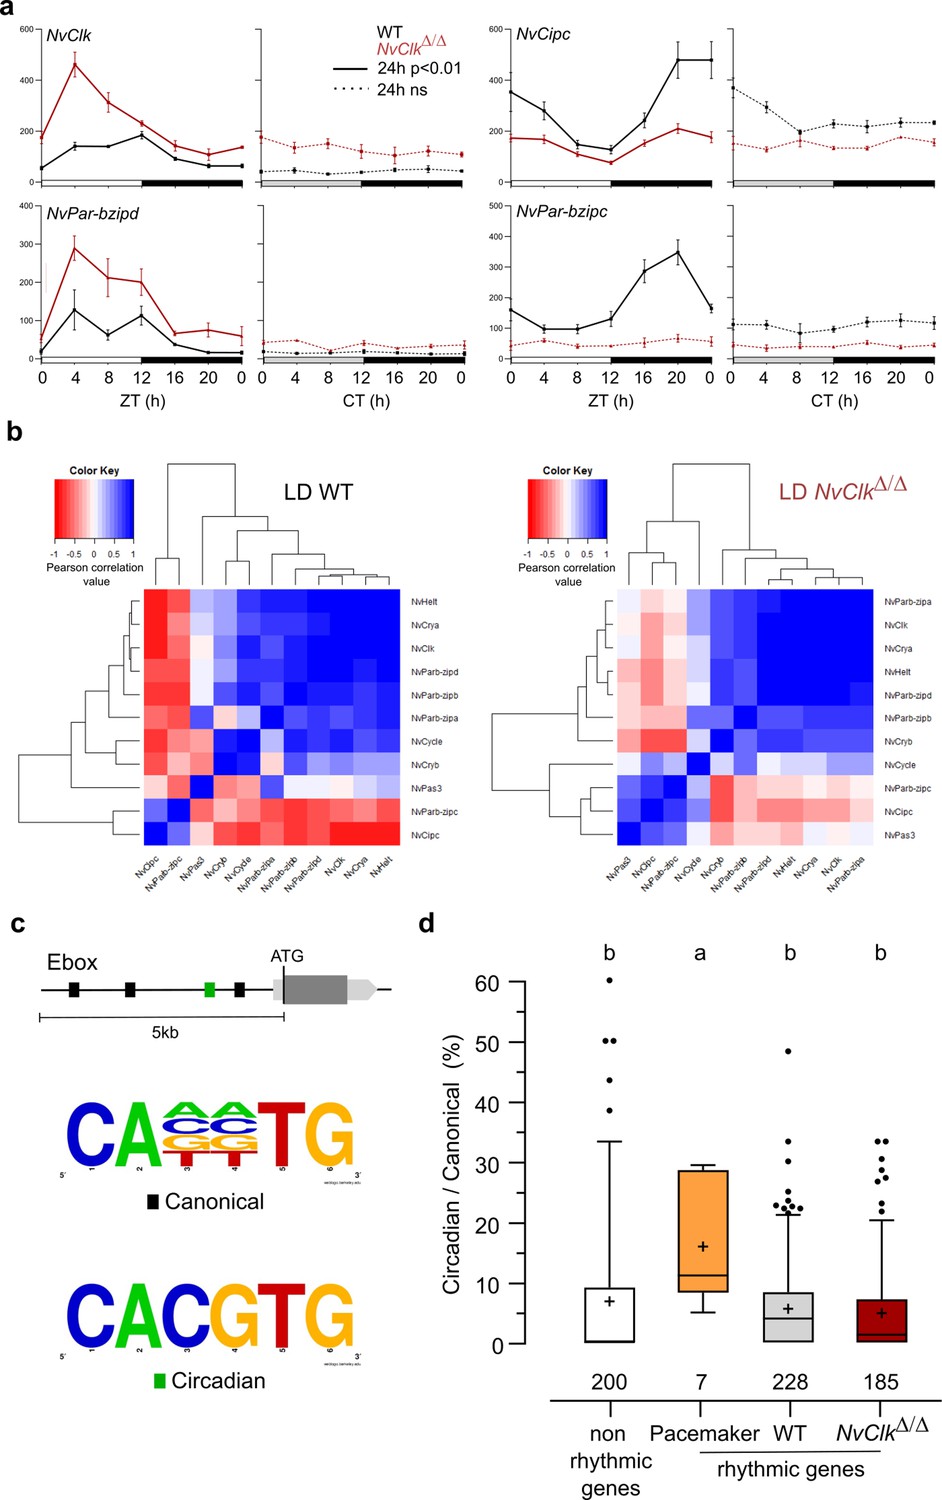
NvClkΔ/Δ alters temporal pacemaker gene expression.
(a) Four pacemaker genes are plotted, showing the read counts over 24 hr in light-dark (LD) and constant dark (DD) in wild-type (WT) (black) and NvClkΔ/Δ (red). The continuous line represents significant rhythmicity (RAIN & JTK p<0.01), while the dashed line indicates no rhythmicity. (b) Correlation matrix of candidate pacemaker genes expression in LD for WT on the left and NvClkΔ/Δ on the right. (c) Schematic representation of the promoter sequences analyses 5 kb upstream of the putative ATG. Black boxes represent canonical E-boxes, while circadian E-boxes are green. Below is the logo motif we used to identify canonical and circadian Ebox. (d) Circadian/Canonical ratio (in %) per condition. Kruskal-Wallis, multiple comparison, a vs b: p<0.05.
Figure 4
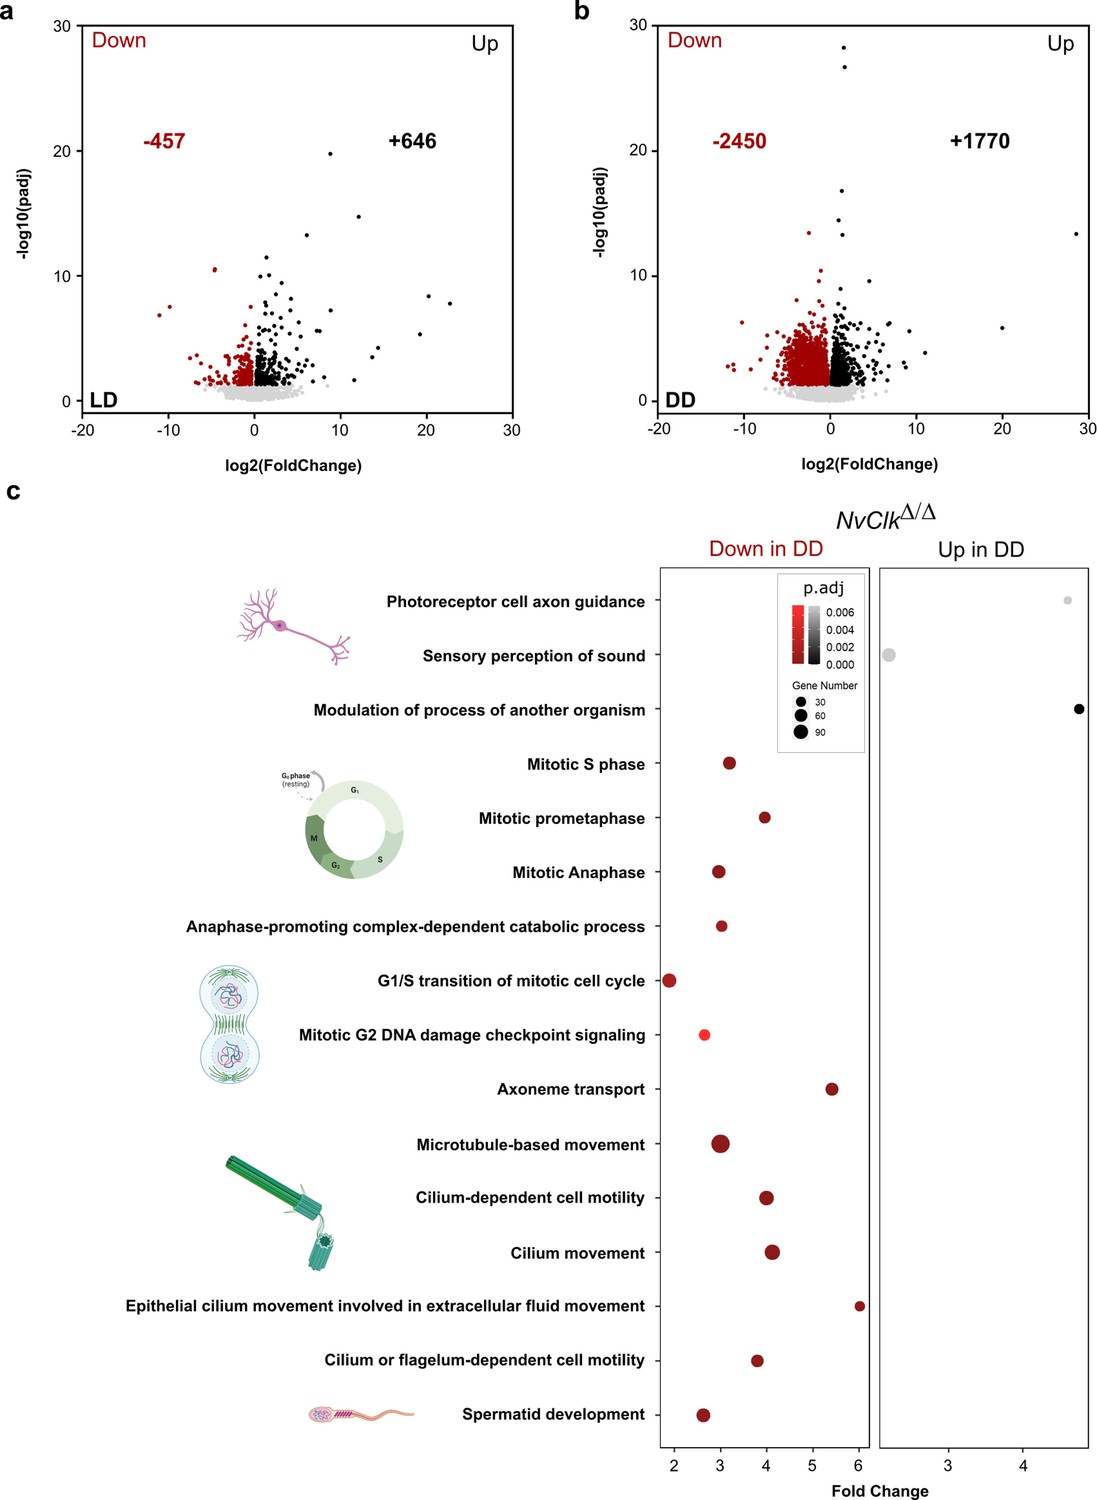
NvClkΔ/Δ disrupts cell-cycle and neuronal pathways in constant darkness.
(a, b) Volcano plot showing the differential expression of genes (DEG) between wild-type (WT) and NvClkΔ/Δ in light-dark (LD) (left) and constant dark (DD) (right). Dashed line indicates the threshold used to detect DEG (p.adj<0.01). Red dots indicate down regulated genes and black dots up-regulated genes in NvClkΔ/Δ compare to WT polyps. (c) Gene Ontology (GO) terms with with significant fold-enrichment (Bonferroni corrected p-value or p.adjusted<0.01) for the DEG analysis in DD. Down regulated genes in Red while Up regulated genes in Black.
Figure 5
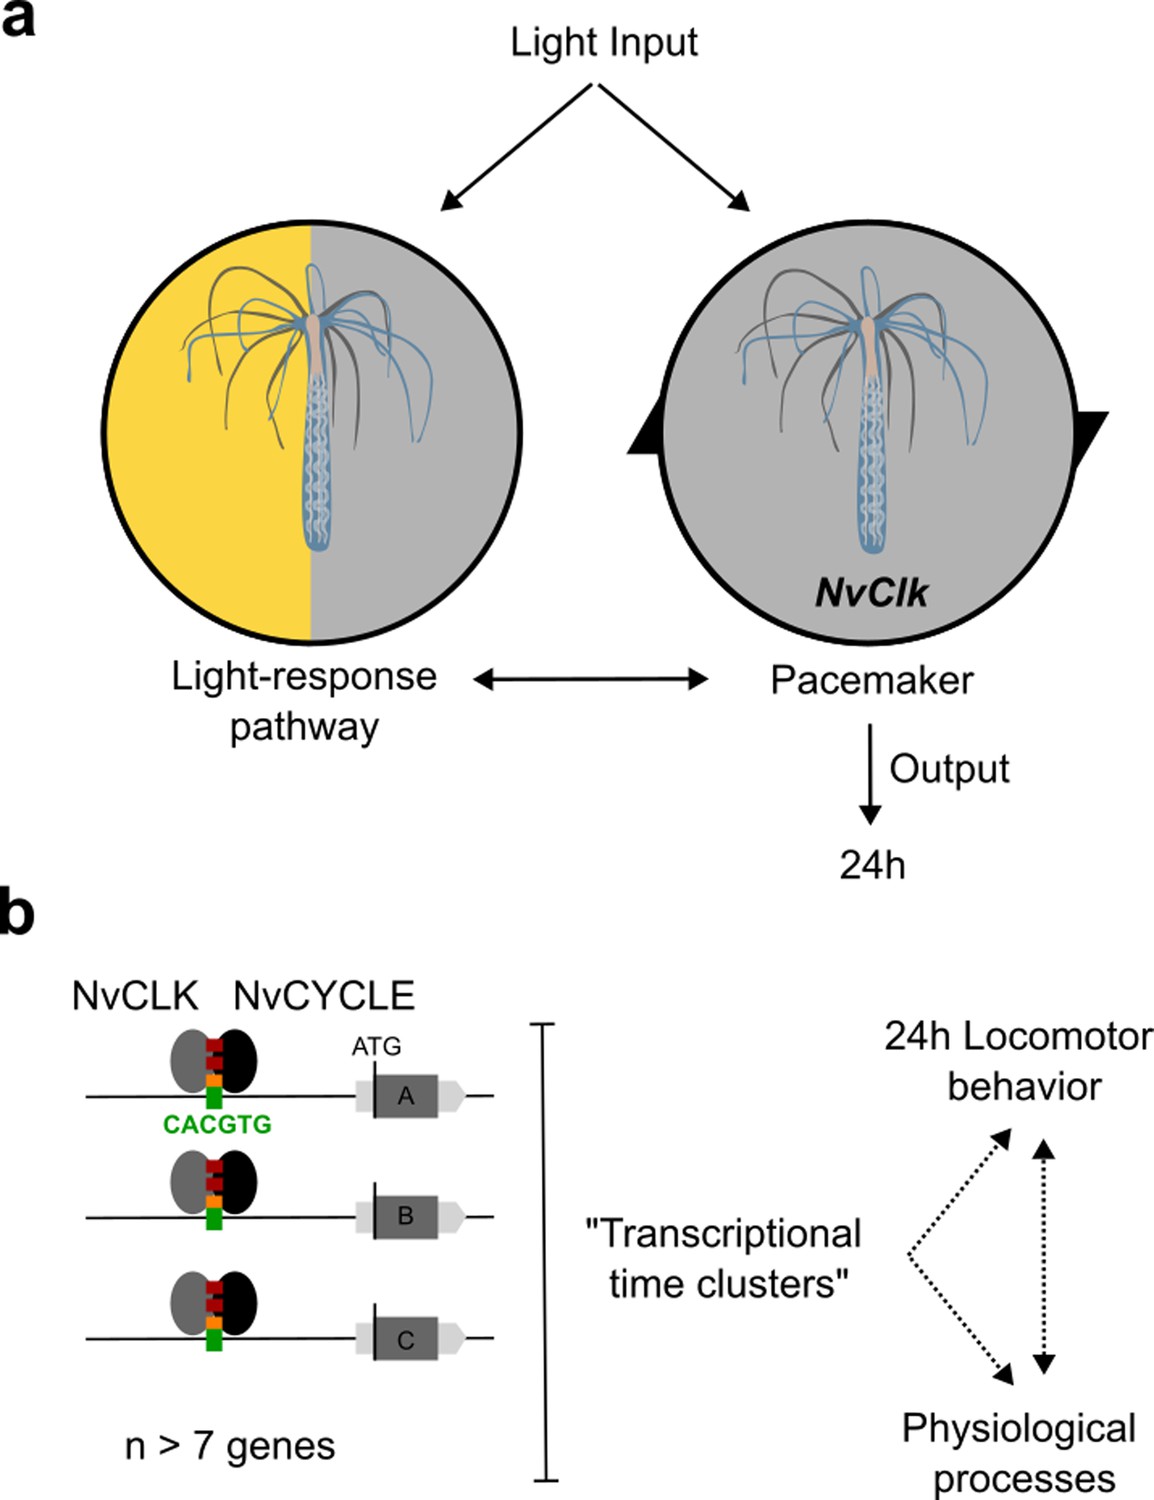
Summary of NvClk function in the regulation of Nematostella circadian rhythmicity.
(a) The rhythmicity is the result of two interacting components, the pacemaker led by the NvClk gene and the Light-response pathway. In the wild-type (WT), the circadian clock overrides the Light-response pathway and imposes a circadian rhythm. (b) Downstream of the pacemaker, rhythmic genes are recruited by a group of seven genes in average. They might underly the rhythmic behavior and physiology of the polyp.
Tables
Table 1
Summary of rhythmic analysis of individual behavior.
| Cosinor | 24 hr period | (p.adj <0.01) | |
|---|---|---|---|
| WT | NvClk+ /Δ | NvClkΔ/Δ | |
| LD | 15/21 | - | 9/20 |
| DD | 17/24 | 9/19 | 1/25 |
| LL | 7/25 | - | 1/26 |
| LD66 | 2/28 | - | 0/25 |
| DD66 | 1/27 | - | 0/24 |
| Cosinor | 12 hr period | (p.adj <0.01) | |
| WT | NvClk+ /Δ | NvClkΔ/Δ | |
| LD | 1/21 | - | 0/20 |
| DD | 0/24 | 0/19 | 0/25 |
| LL | 0/25 | - | 0/26 |
| LD66 | 1/28 | - | 13/25 |
| DD66 | 0/27 | - | 0/24 |
Additional files
-
MDAR checklist
- https://cdn.elifesciences.org/articles/89499/elife-89499-mdarchecklist1-v1.pdf
-
Supplementary file 1
This file contains the individual normalized locomotion behavior(normalizationon Min-Max values for each animals) for both genotypes in mutliple light condtions: WT, NvClkD/+ (Htz), and NvClkD/D under LD 12: 12hr, DD, LL, LD 6: 6hr, DD 6: 6hr.
Each experimental conditions were replicated independently three times.
- https://cdn.elifesciences.org/articles/89499/elife-89499-supp1-v1.xlsx
-
Supplementary file 2
This file contains the rhythmic analysis of individual polyp locomotor behavior of the different genotypes in different light conditions using https://mcarlucci.shinyapps.io/discorhythm/ using Supplementary file 1 as input dataset.
Only the Cosinor algorithm analysis is shown here. Animal with missing value were discarded by the software from the analysis which explain the discrepancy between total polyps tracks and individuals analyzed in some conditions.
- https://cdn.elifesciences.org/articles/89499/elife-89499-supp2-v1.xlsx
-
Supplementary file 3
This file contains the RNAseq rhythmic analysisbased on normalized read counts using the metar2 R package for rhythmic analysis for both genotypes under two light conditions: WT and NvClkD/D under LD 12: 12h and DD.
The file containsthe list of potential core pacemaker candidate genes as well and if they were found rhythmic or not in each condition (p<0.01 RAIN and JTK).
- https://cdn.elifesciences.org/articles/89499/elife-89499-supp3-v1.xlsx
-
Supplementary file 4
This file contains the result of the clustering analysis of the rhythmic genes.
Each cluster is identified by an ID number (from 1 to max), the associated ID NVE genes associated, their JGI annotation, and their acrophase.
- https://cdn.elifesciences.org/articles/89499/elife-89499-supp4-v1.xlsx
-
Supplementary file 5
This file contains the results of the Differential Expression analysis between WT and NvClkD/Din LD, and WT and NvClkD/Din DD.
For each sample name w = WT and m = NvClkD/D.
- https://cdn.elifesciences.org/articles/89499/elife-89499-supp5-v1.xlsx
-
Supplementary file 6
This file contains the results of GO term enrichment in the DEG identified in Supplementary file 4: WT and NvClkD/Din LD, and WT and NvClkD/Din DD.
Color code: Blue is p.adj<0.01; Green is p.adj<0.05; Red is p.adj>0.05.
- https://cdn.elifesciences.org/articles/89499/elife-89499-supp6-v1.xlsx
Download links
A two-part list of links to download the article, or parts of the article, in various formats.
Downloads (link to download the article as PDF)
Open citations (links to open the citations from this article in various online reference manager services)
Cite this article (links to download the citations from this article in formats compatible with various reference manager tools)
CLOCK evolved in cnidaria to synchronize internal rhythms with diel environmental cues
eLife 12:RP89499.
https://doi.org/10.7554/eLife.89499.4


