Combinatorial expression of γ-protocadherins regulates synaptic connectivity in the mouse neocortex
- Institute of Neuroscience and State Key Laboratory of Neuroscience, CAS Center for Excellence in Brain Science and Intelligence Technology, Chinese Academy of Sciences, China
- Lingang Laboratory, Shanghai Center for Brain Science and Brain-Inspired Intelligence Technology, China
- University of Chinese Academy of Sciences, China
Figures
Figure 1 with 7 supplements
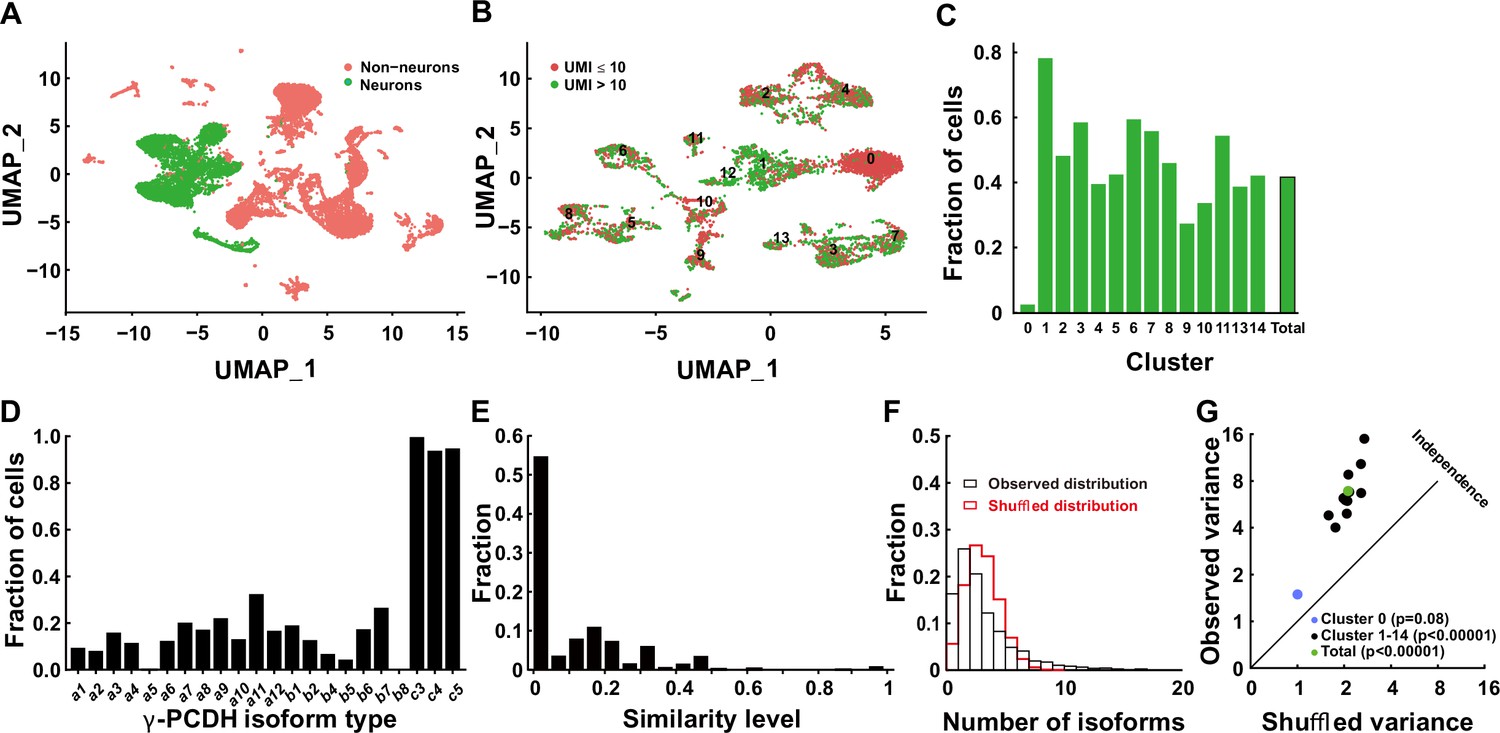
Diversified expression of Pcdhg isoforms in neocortical neurons.
(A) Uniform Manifold Approximation and Projection (UMAP) analysis displaying 17,438 cells obtained through 5' end single-cell sequencing after data cleanup and doublet removal. Neurons are depicted as green dots, while non-neuronal cells are marked in red. (B) UMAP clusters of all neurons categorized by the unique molecular identifier (UMI) cutoff. Red dots denote cells with fewer than 10 total UMIs of Pcdhg (n = 3671), and green dots denote cells with more than 10 UMIs (n = 2834). (C) Fractions of neurons with more than 10 UMIs in different clusters. (D) Distribution of neurons expressing different Pcdhg isoforms in the neocortex. (E) Fraction distribution illustrating similarity levels in the combinatorial expression of Pcdhg variable isoforms among neurons. Similarity levels were calculated as . (F) Observed distribution (black) of the fraction of cells expressing varying numbers of isoforms across all neurons. The red curve represents the shuffled distribution generated under the hypothesis of stochastic isoform expression. (G) The variance difference between the observed and shuffled fraction distribution of cells from all clusters. Source data is available on Dryad (https://doi.org/10.5061/dryad.931zcrjm7) and in Figure 1—source data 1.
-
Figure 1—source data 1
Raw files of Cell Ranger output.
- https://cdn.elifesciences.org/articles/89532/elife-89532-fig1-data1-v1.zip
-
Figure 1—source code 1
Source codes for data processing.
- https://cdn.elifesciences.org/articles/89532/elife-89532-fig1-code1-v1.zip
Figure 1—figure supplement 1
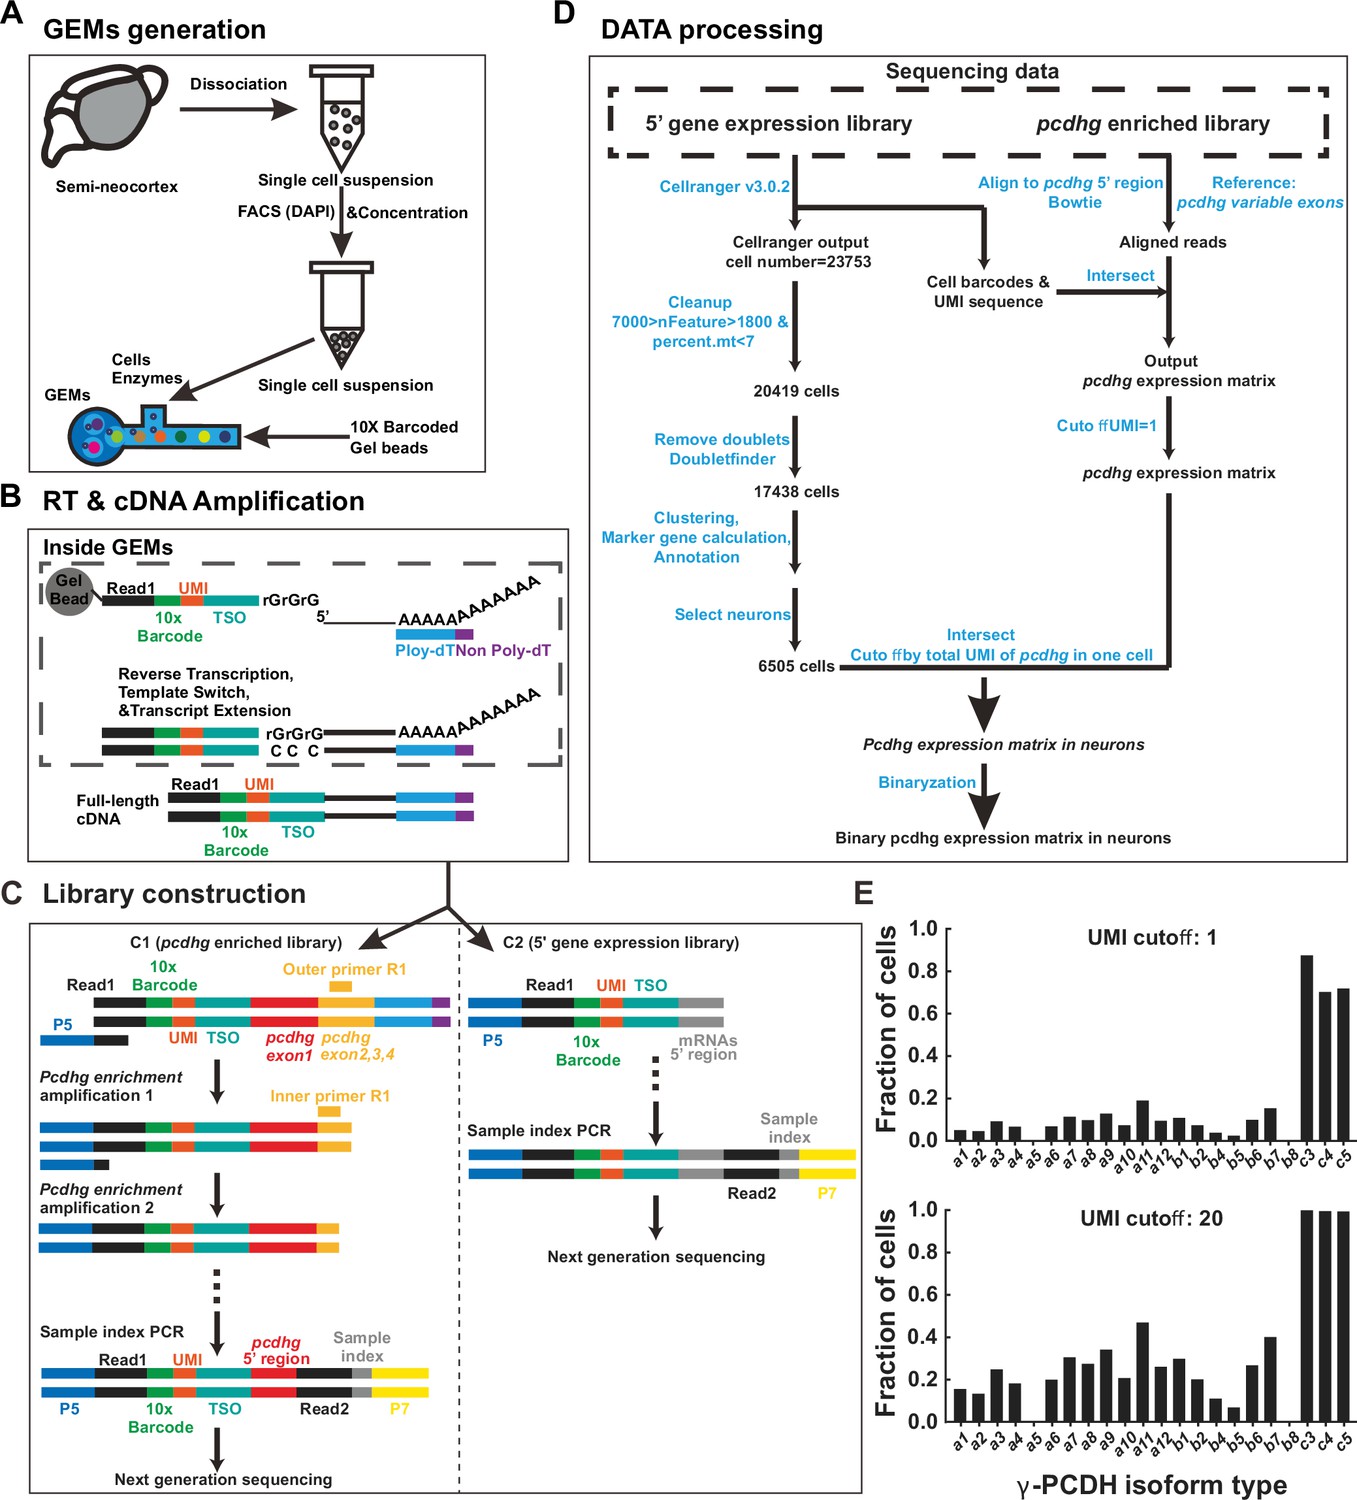
Overview of the 5’ end single-cell sequencing procedure for pcdhg isoforms.
(A–D) Schematic representation of the 5’ end single-cell sequencing protocol. For more detailed information, please refer to the ‘Materials and methods’ section. Key components in (C) and (D) are outlined in the legend below. P5/P7: Illumina sequencing priming sites; Read1: Illumina R1 sequence; 10x Barcode: a 16-nucleotides (nt) cell barcode; UMI: a 10-nt unique molecular identifier; TSO: a 13-nt template switch oligo; Read2: an Illumina R2 sequence; Sample index: an 8-nt sequence for sample identification. (E) The proportion of neocortical neurons expressing different Pcdhg isoforms, analyzed under varying UMI cutoff 1 (top) or 20 (bottom).
Figure 1—figure supplement 2
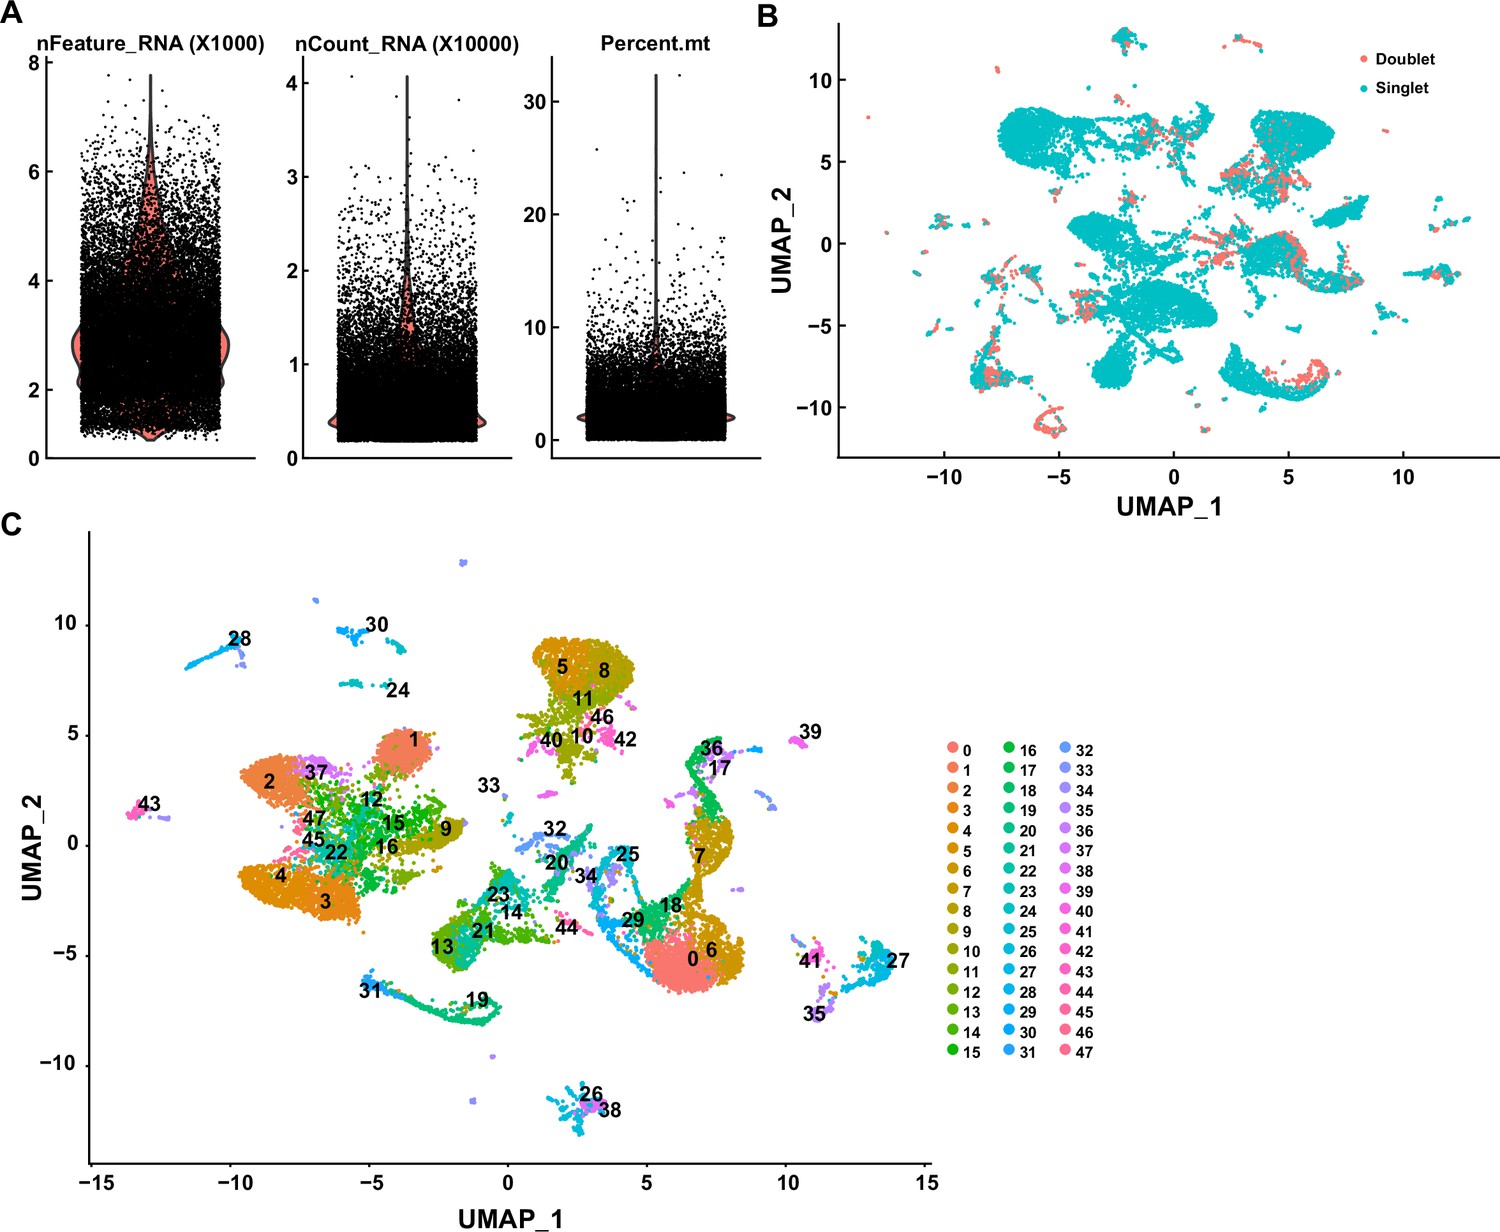
Single-cell RNA sequencing data profiling.
(A) Quality control for sequenced cells. Cells were selected for analysis by the range of 7000>nFeature_RNA >1800, and mitochondrial RNA < 7%. nFeature_RNA: total feature (gene) counts per cell; nCount_RNA: total counts number per cell; percent.mt: the percentage of mitochondrial RNA per cell. (B) Uniform Manifold Approximation and Projection (UMAP) analysis of the entire cell dataset (n = 20,419); red dots: potential doublets (n = 2981); green dots: singlet (n = 17,438). (C) UMAP analysis of singlets (n = 17,438).
Figure 1—figure supplement 3
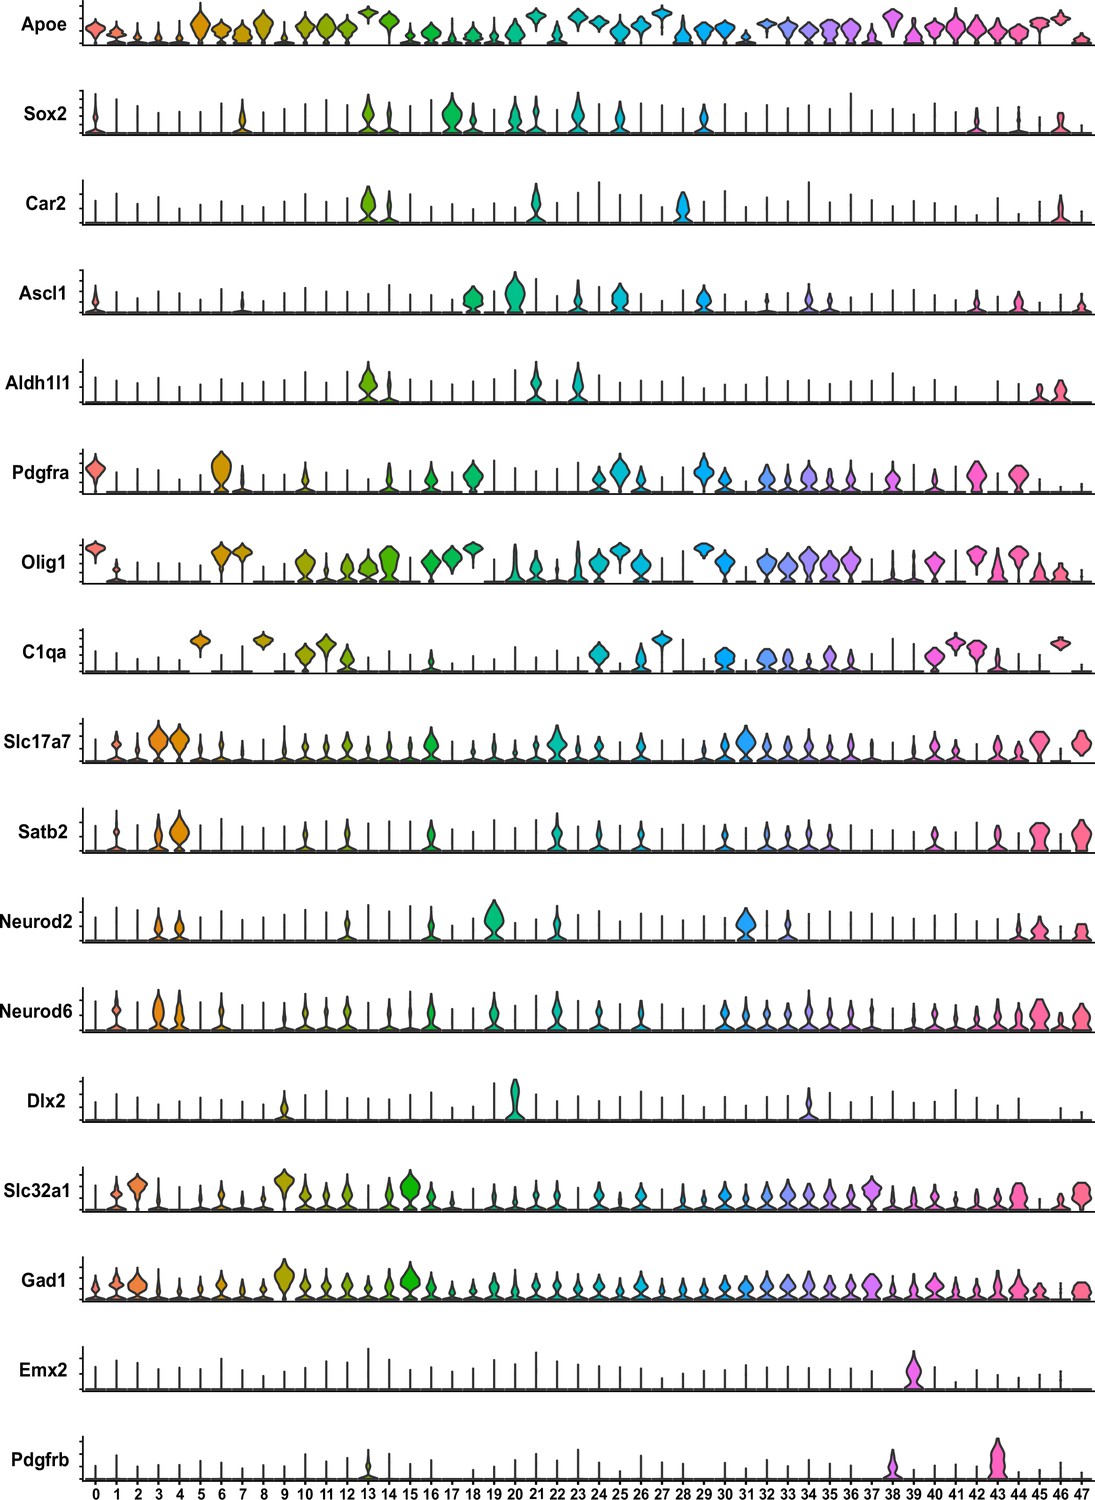
Neuron selection.
Violin plots illustrating specific gene expression in various clusters. Clusters 1, 2, 3, 4, 9, 12, 15, 16, 19, 22, 31, 37, 45, and 47 were categorized as neurons.
Figure 1—figure supplement 4
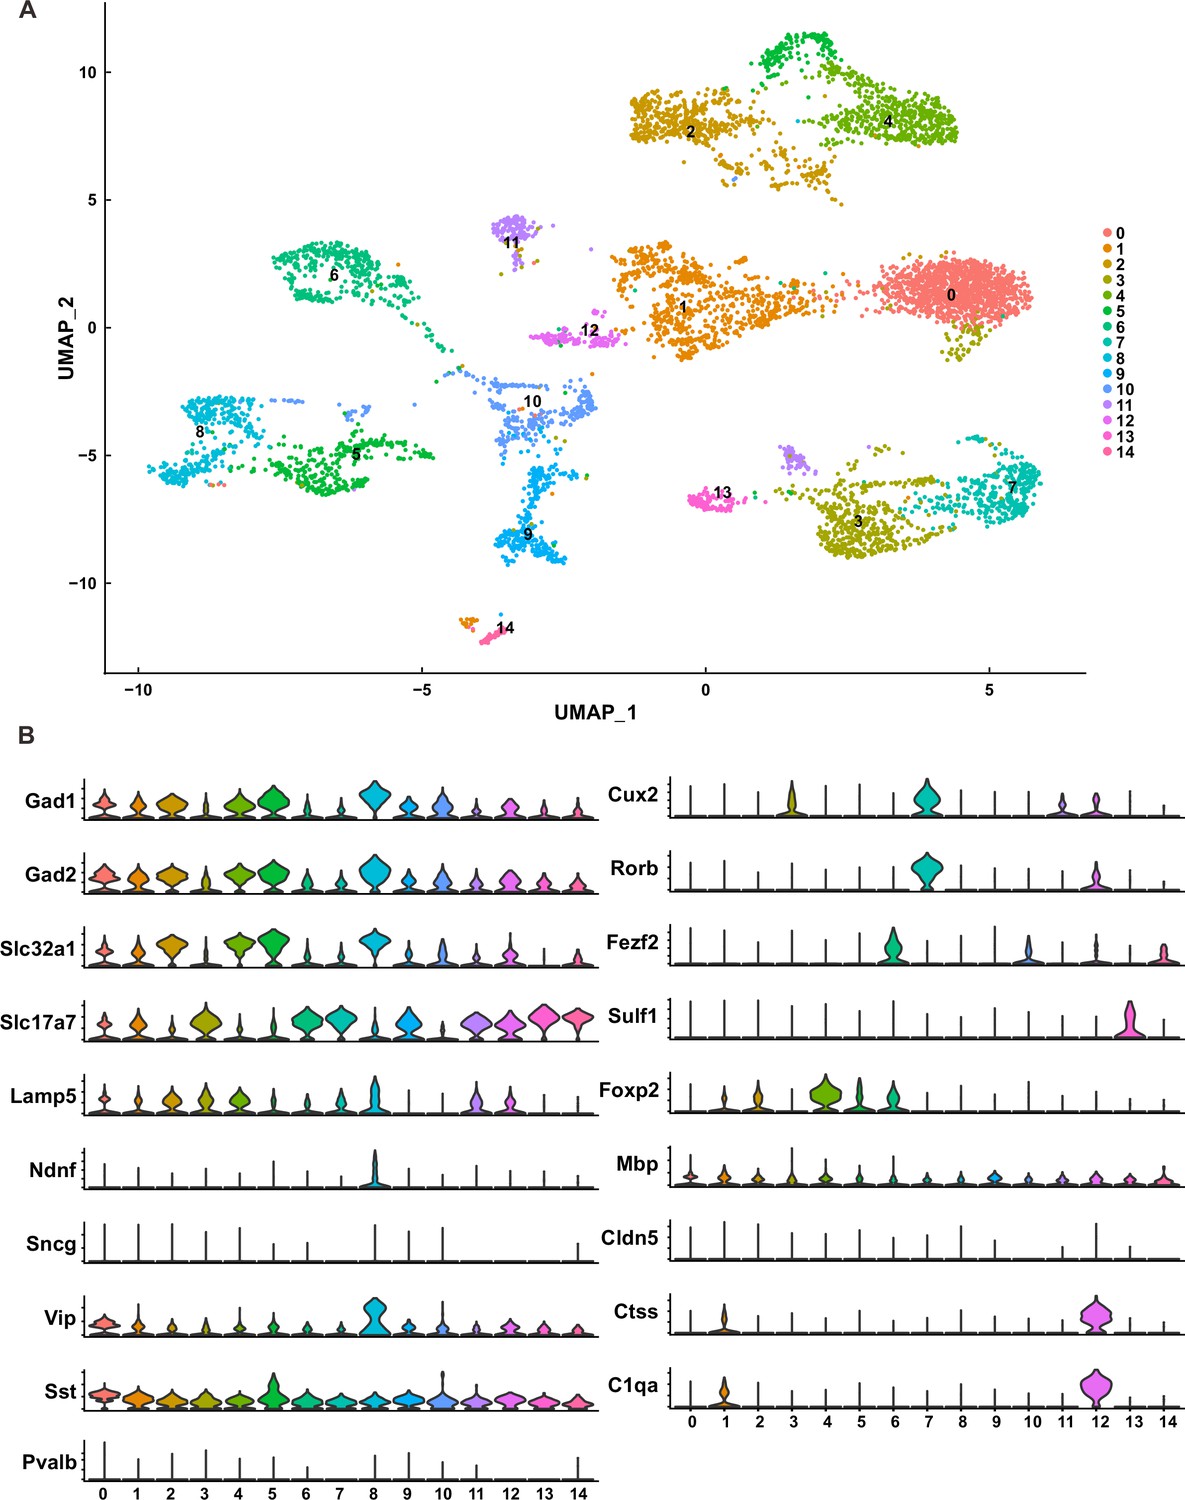
Neuron clusters.
(A) Uniform Manifold Approximation and Projection (UMAP) analysis of neurons (n = 6505). (B) Violin plot displaying specific gene expression in various neuron clusters. Clusters 0, 1, 2, 4, 5, 8, and 10 were identified as inhibitory neurons; clusters 3, 7, and 11 were categorized as upper layer excitatory neurons; clusters 6, 13, and 14 were classified as deep layer excitatory neurons; cluster 9 was labeled as unidentified excitatory neurons; and cluster 12 did not exhibit typical neuron characteristics.
Figure 1—figure supplement 5
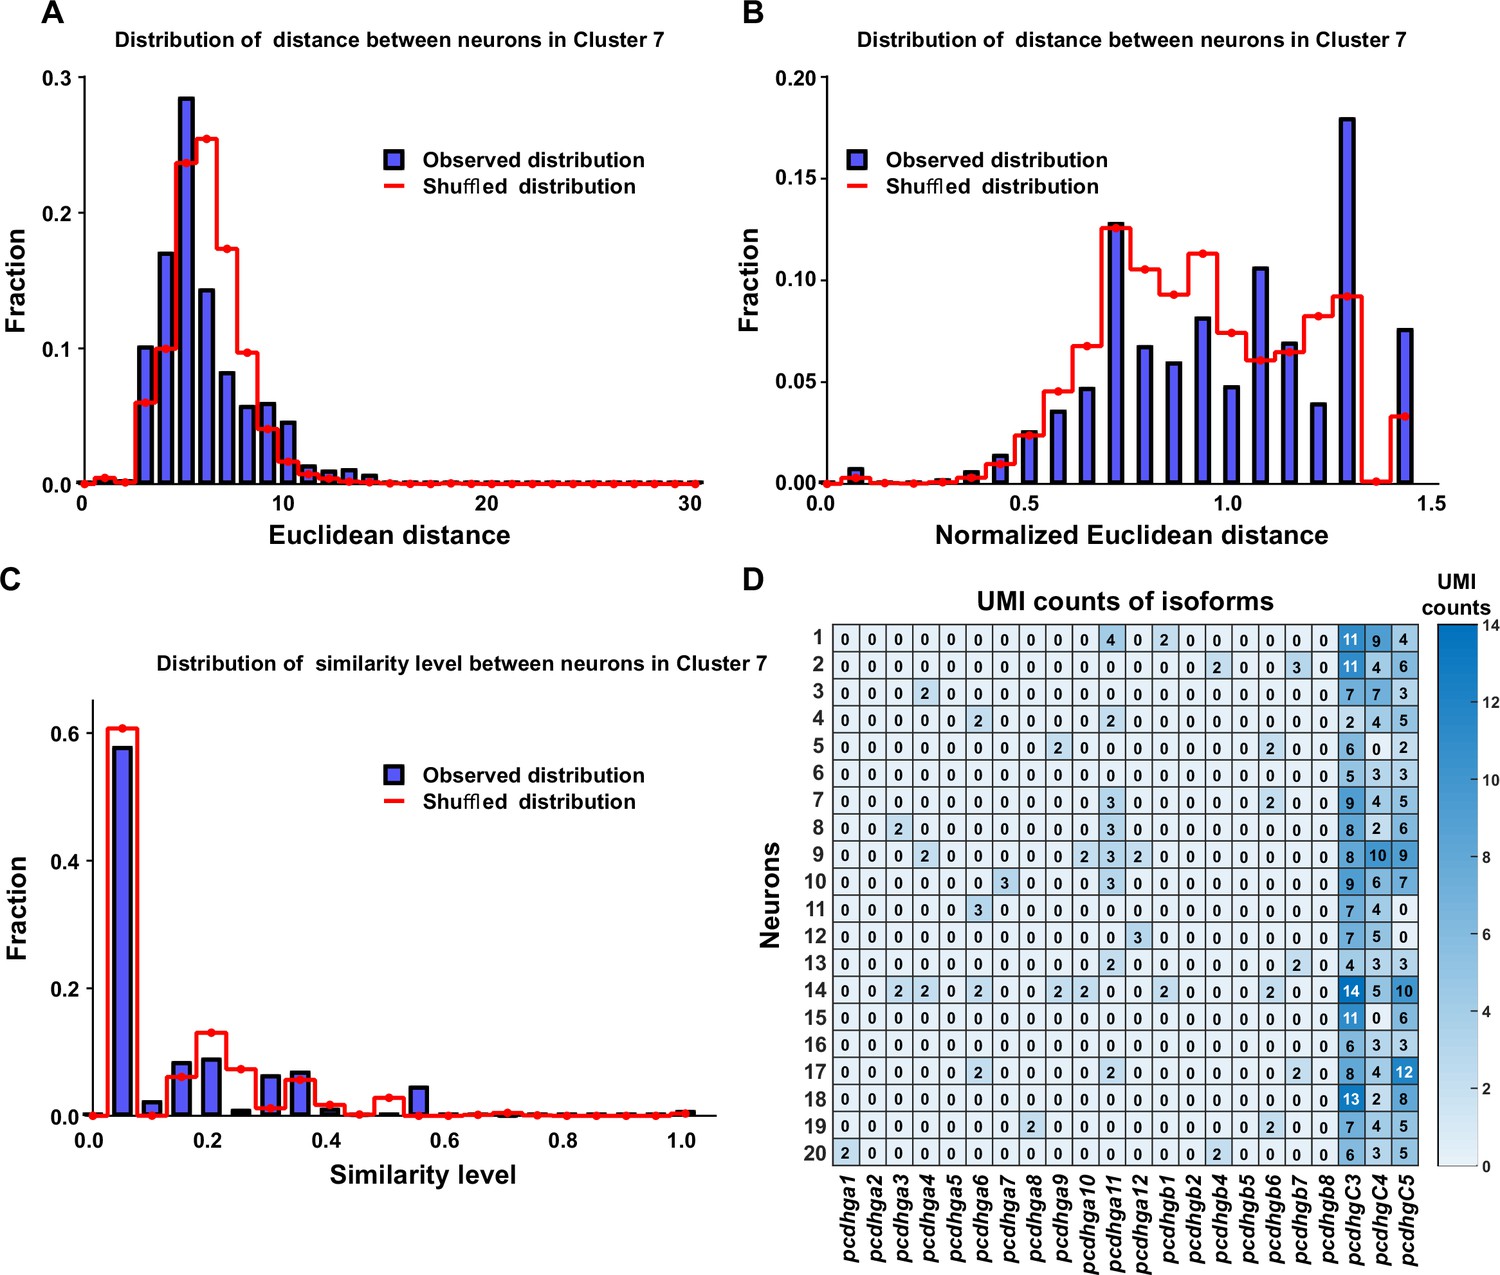
Diversely combinatorial expression of γ-PCDH in L2/3 neurons of cluster 7.
(A) Observed distribution (blue) of Euclidean distance between neurons from cluster 7 in comparison to the distance from shuffled data (red). (B) Observed distribution (blue) of normalized Euclidean distance between neurons from cluster 7 in comparison to the distance from shuffled data (red). (C) The similarity level between cells in cluster 7 under both observed (blue) and shuffled (red) conditions. (D) The detailed expression for randomly selected 20 neurons in cluster 7. Each row represents one neuron, and each column denotes one isoform. The numbers in the box, as well as the colors, show the RNA counts measured by unique molecular identifier (UMI).
Figure 1—figure supplement 6
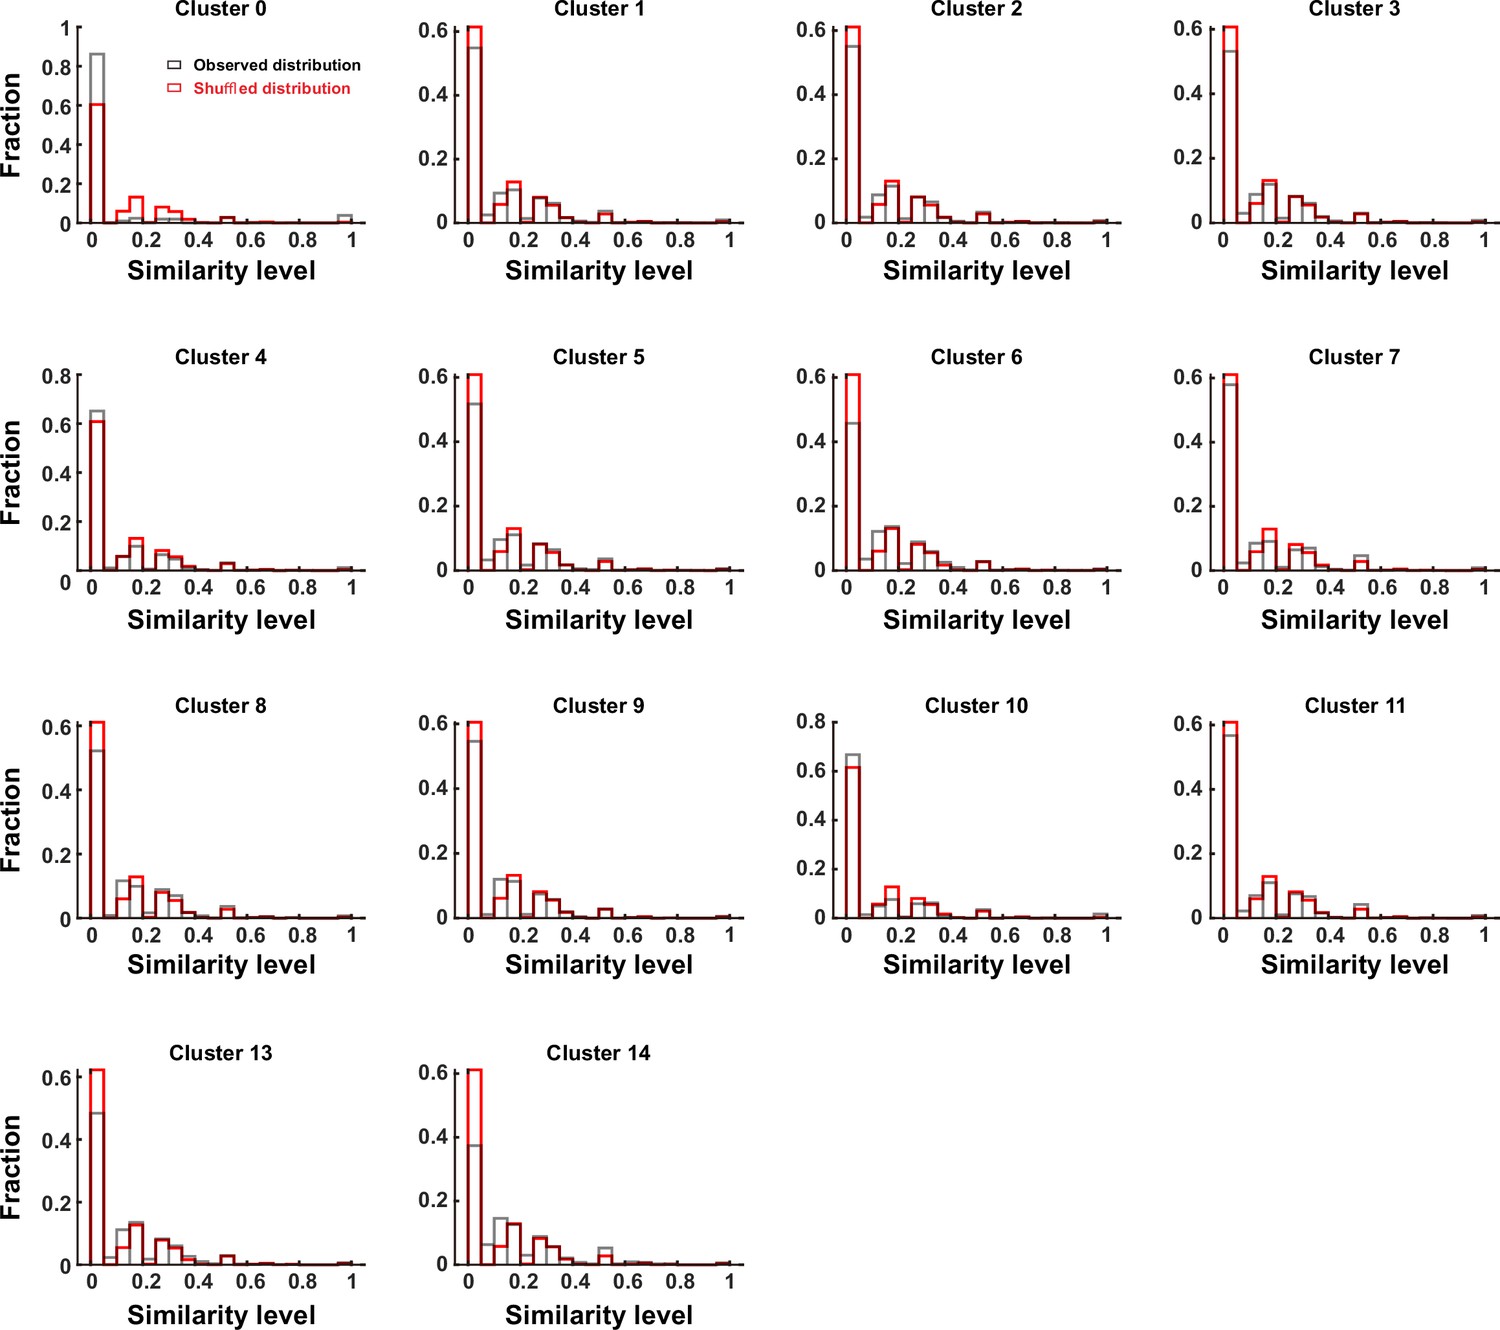
Distribution of similarity levels among cell pairs across different clusters.
Gray and red bars indicate observed and shuffled data. The panel ‘Cluster 7’ showed the same dataset with Figure 1—figure supplement 5C for the consistency.
Figure 1—figure supplement 7
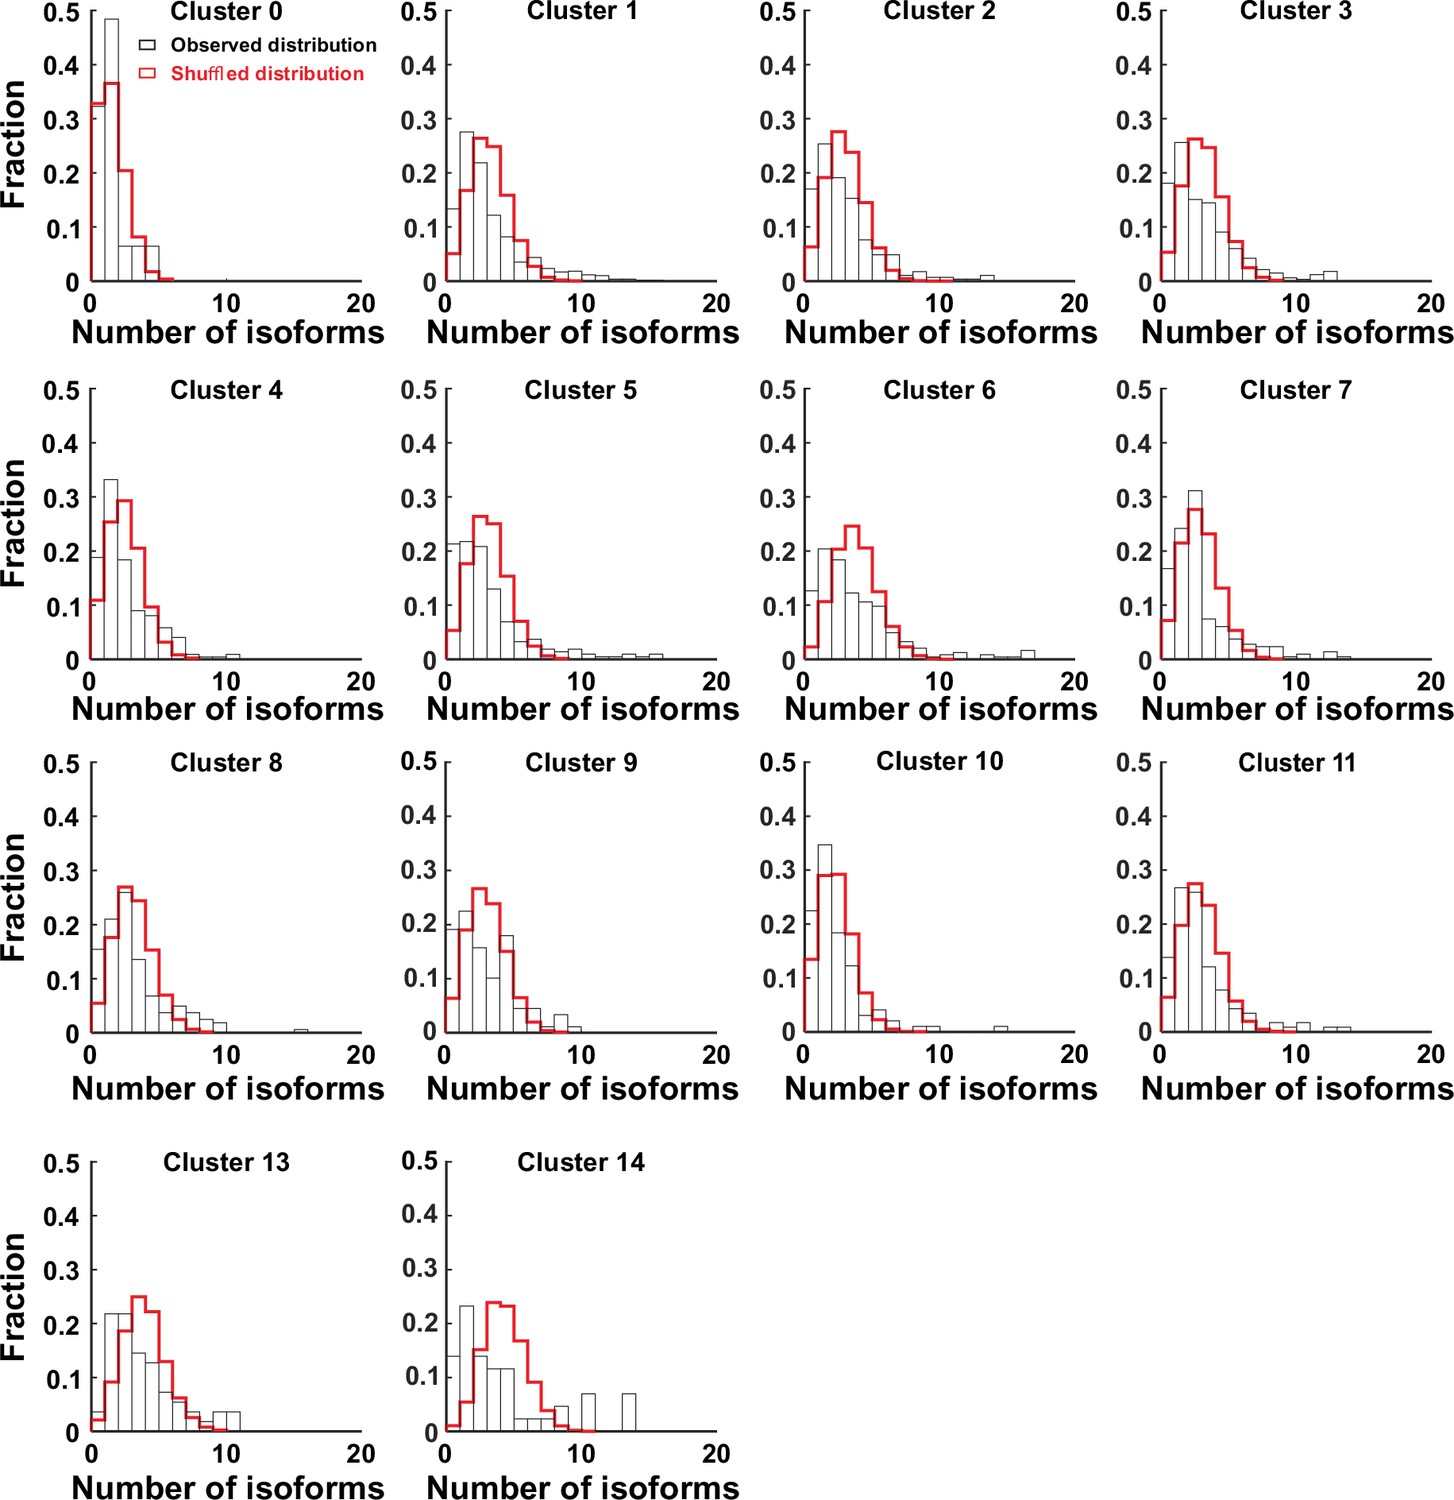
A weak but significant co-occurrence of γ-PCDH variable isoforms in most of neocortical neurons (except neurons in cluster 0).
Fraction distribution of the number of the expressed isoforms per cell in different clusters.
Figure 2 with 4 supplements
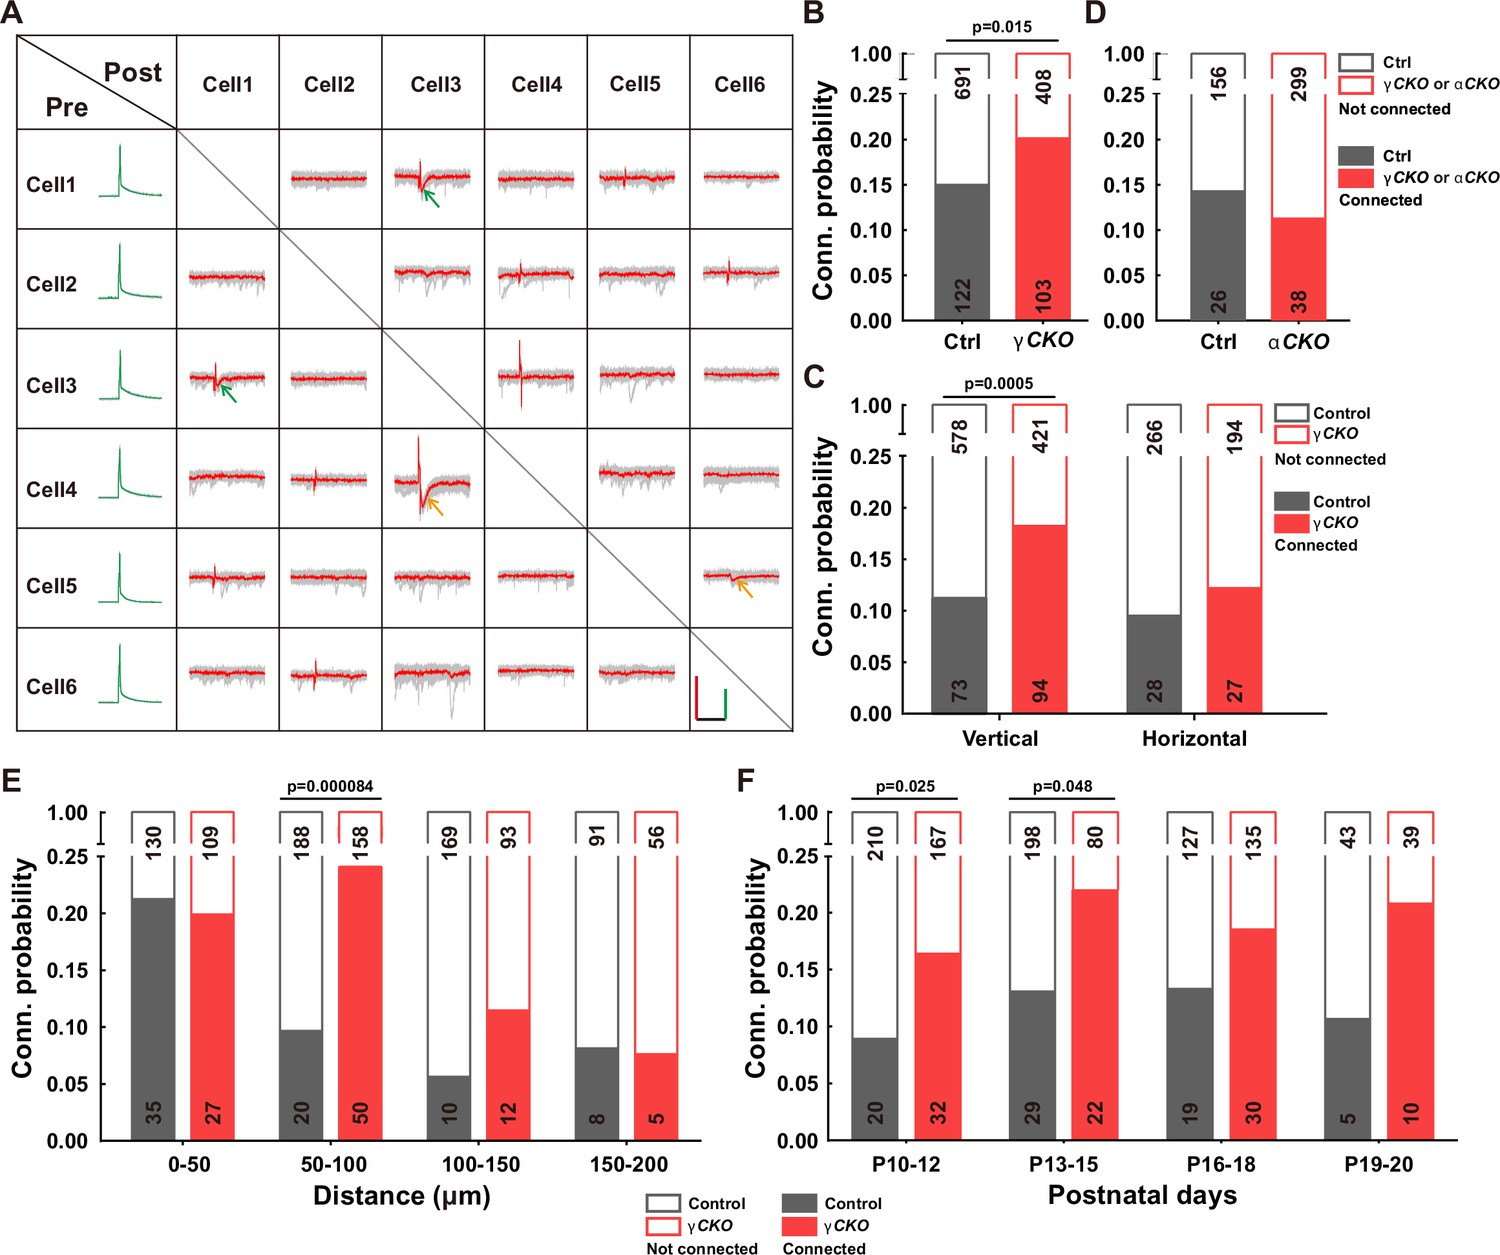
Increased synaptic connectivity in the absence of γ-PCDH.
(A) Representative traces (red/green) from multiple electrode whole-cell patch-clamp recordings conducted on six neurons in layer 2/3 of the barrel cortex. Average traces are shown in red and green, with 10 original traces in gray. Positive evoked postsynaptic responses are indicated by arrows. Orange and green arrows denote unidirectional and bidirectional synaptic connections, respectively. Scale bars: 100 mV (green), 50 pA (red), and 50 ms (black). (B, D) Connectivity probability among nearby pyramidal cells in layer 2/3 of the barrel cortex in Pcdhg conditional knockout (cKO) (B), Pcdha cKO mice (D), and their littermate WT controls. γCKO: Pcdhg fcon3/fcon3:: Neurod6-cre mice; αCKO: Pcdhaflox/flox:: Neurod6-cre mice; Ctrl: Pcdhg+/+:: Neurod6-cre or Pcdha+/+:: Neurod6-cre mice. (C) Connectivity probability among vertically or horizontally aligned neurons in layer 2/3 of the barrel cortex in Pcdhg cKO mice and their littermate WT controls. (E) Connectivity probability among vertically aligned pyramidal cells as a function of the distance between recorded pairs in Pcdhg cKO mice and WT mice. (F) Developmental profiling of connectivity probability among vertically aligned neurons in Pcdhg cKO mice and WT mice. Chi-square tests were used in (B–F) to calculate statistical differences.
-
Figure 2—source data 1
Electrophysiological recording data for measuring synaptic connectivites between neurons in Figure 2.
- https://cdn.elifesciences.org/articles/89532/elife-89532-fig2-data1-v1.xlsx
Figure 2—figure supplement 1
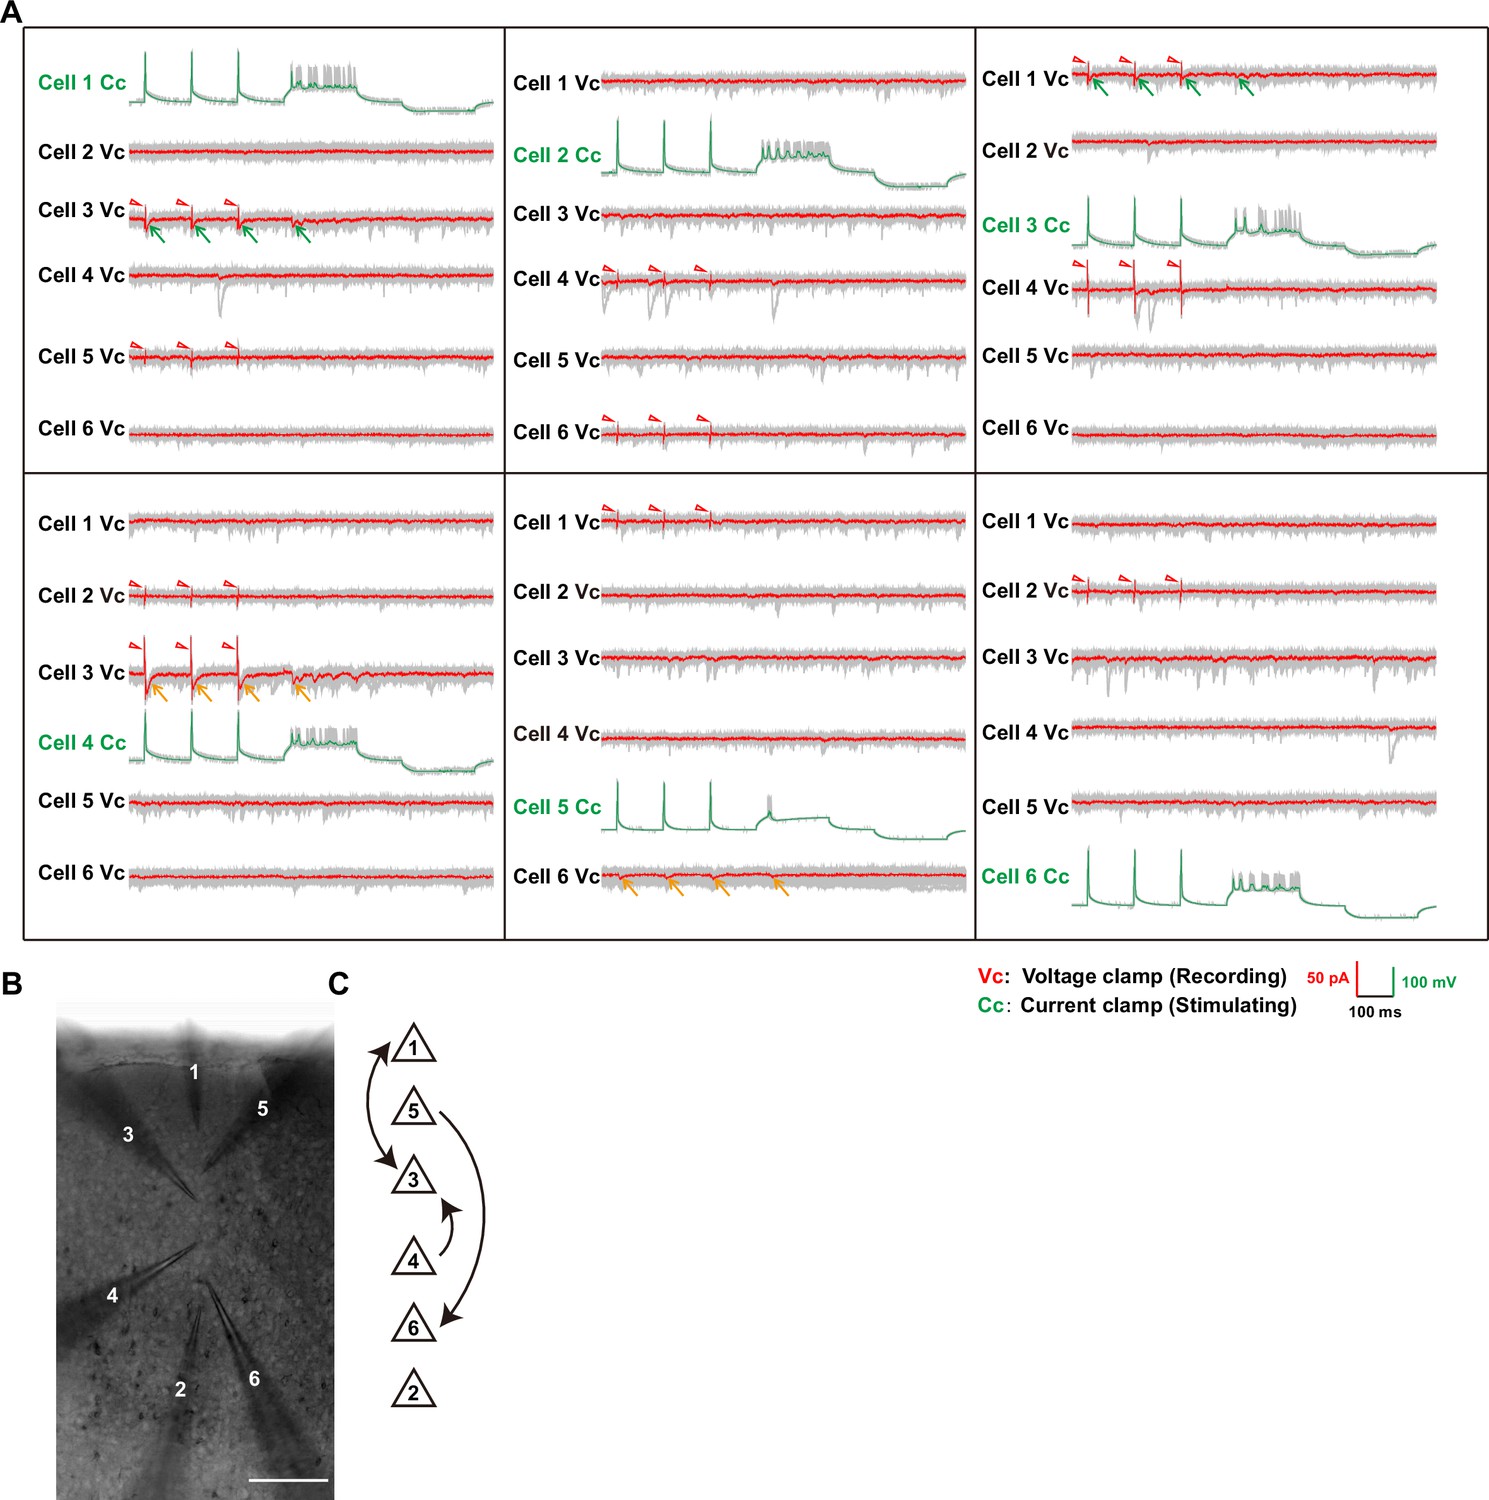
Multi-electrode whole-cell patch-clamp recording.
(A) Full sample traces of electrophysiological recording shown in Figure 2A. Individual traces are shown in gray and the averages from 10 trials are shown in red. Positive evoked postsynaptic responses are indicated by arrows. Orange/green arrows: unidirectional/ bidirectional connections. Stimulus artifacts are pointed out by red triangles. VC: cell was recorded under the voltage clamp; CC: cell was recorded under the current clamp. (B) Images taken by the differential interference microscope for the recorded six neurons and their corresponding electrodes in (A). (C) Schematic of the synaptic connectivity among these six neurons shownin (A) and (B).
Figure 2—figure supplement 2
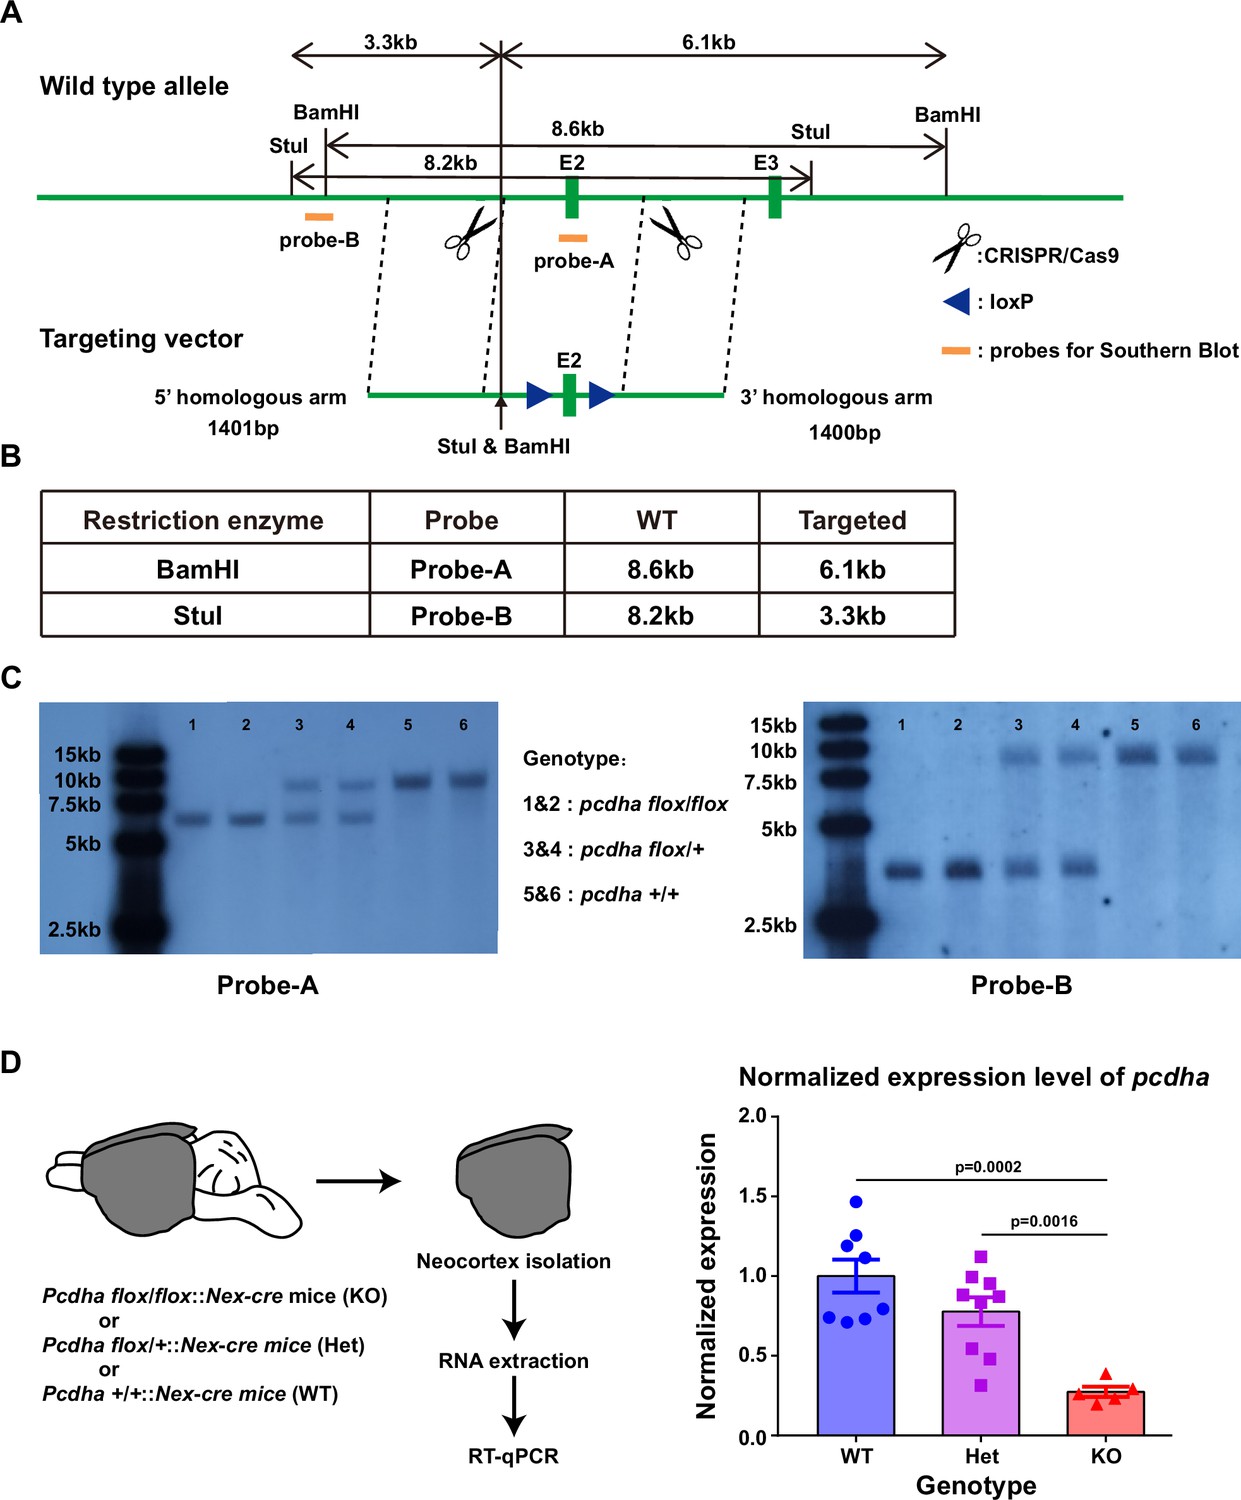
Generation and characterization of Pcdhaflox/flox mice.
(A) Strategy of introducing loxP sites at both sides of the second exon of Pcdha using CRISPR/Cas9. The orange bars indicate the sites for the Southern blot assay. The left cutting site is caused by sgRNA_1, the right site is caused by sgRNA_2. The exon 2 (first constant exon) of Pcdha would be deleted in the presence of Cre combinase. All Pcdha isoforms will be affected due to the loss of this exon. (B) The theoretical lengths in the Southern blot assay for both probes. (C) Results of Southern blot for both probe A (left) and probe B (right) from six mice. (D) The reduction of Pcdha expression in Pcdha conditional knockout (cKO) mice as revealed by quantitative reverse transcription PCR (qRT-PCR). Left: experiment design. The entire neocortex was dissected for RNA extraction. Notably, the neocortex was isolated from mice where the Neurod6-cre gene was expressed specifically in excitatory neurons within the neocortex. Right: qRT-PCR quantification of Pcdha expression in Pcdha KO mice cortex (n=8 mice for WT, 9 for Het, and 5 for KO). Student’s t-test was used for statistical analysis.
-
Figure 2—figure supplement 2—source data 1
Southern Blot gel images for pcdha knock in mice and expression level of pcdha from different genotypes of mice.
- https://cdn.elifesciences.org/articles/89532/elife-89532-fig2-figsupp2-data1-v1.zip
Figure 2—figure supplement 3

Top 10 off-target sequences of sgRNA_1.
Sanger sequencing results of top 10 off-target regions. WT: pcdha+/+ mice. Homo: pcdhaflox/flox mice. Het: pcdha+/flox mice. The mice used were littermates. The red bars (target_seq) show the predicted off-target regions in the mouse genome.
-
Figure 2—figure supplement 3—source data 1
Original sequencing data for top 10 off-target sequences of sgRNA_1 in Figure 2—figure supplement 3 and sgRNA_2 in Figure 2—figure supplement 4.
- https://cdn.elifesciences.org/articles/89532/elife-89532-fig2-figsupp3-data1-v1.zip
Figure 2—figure supplement 4
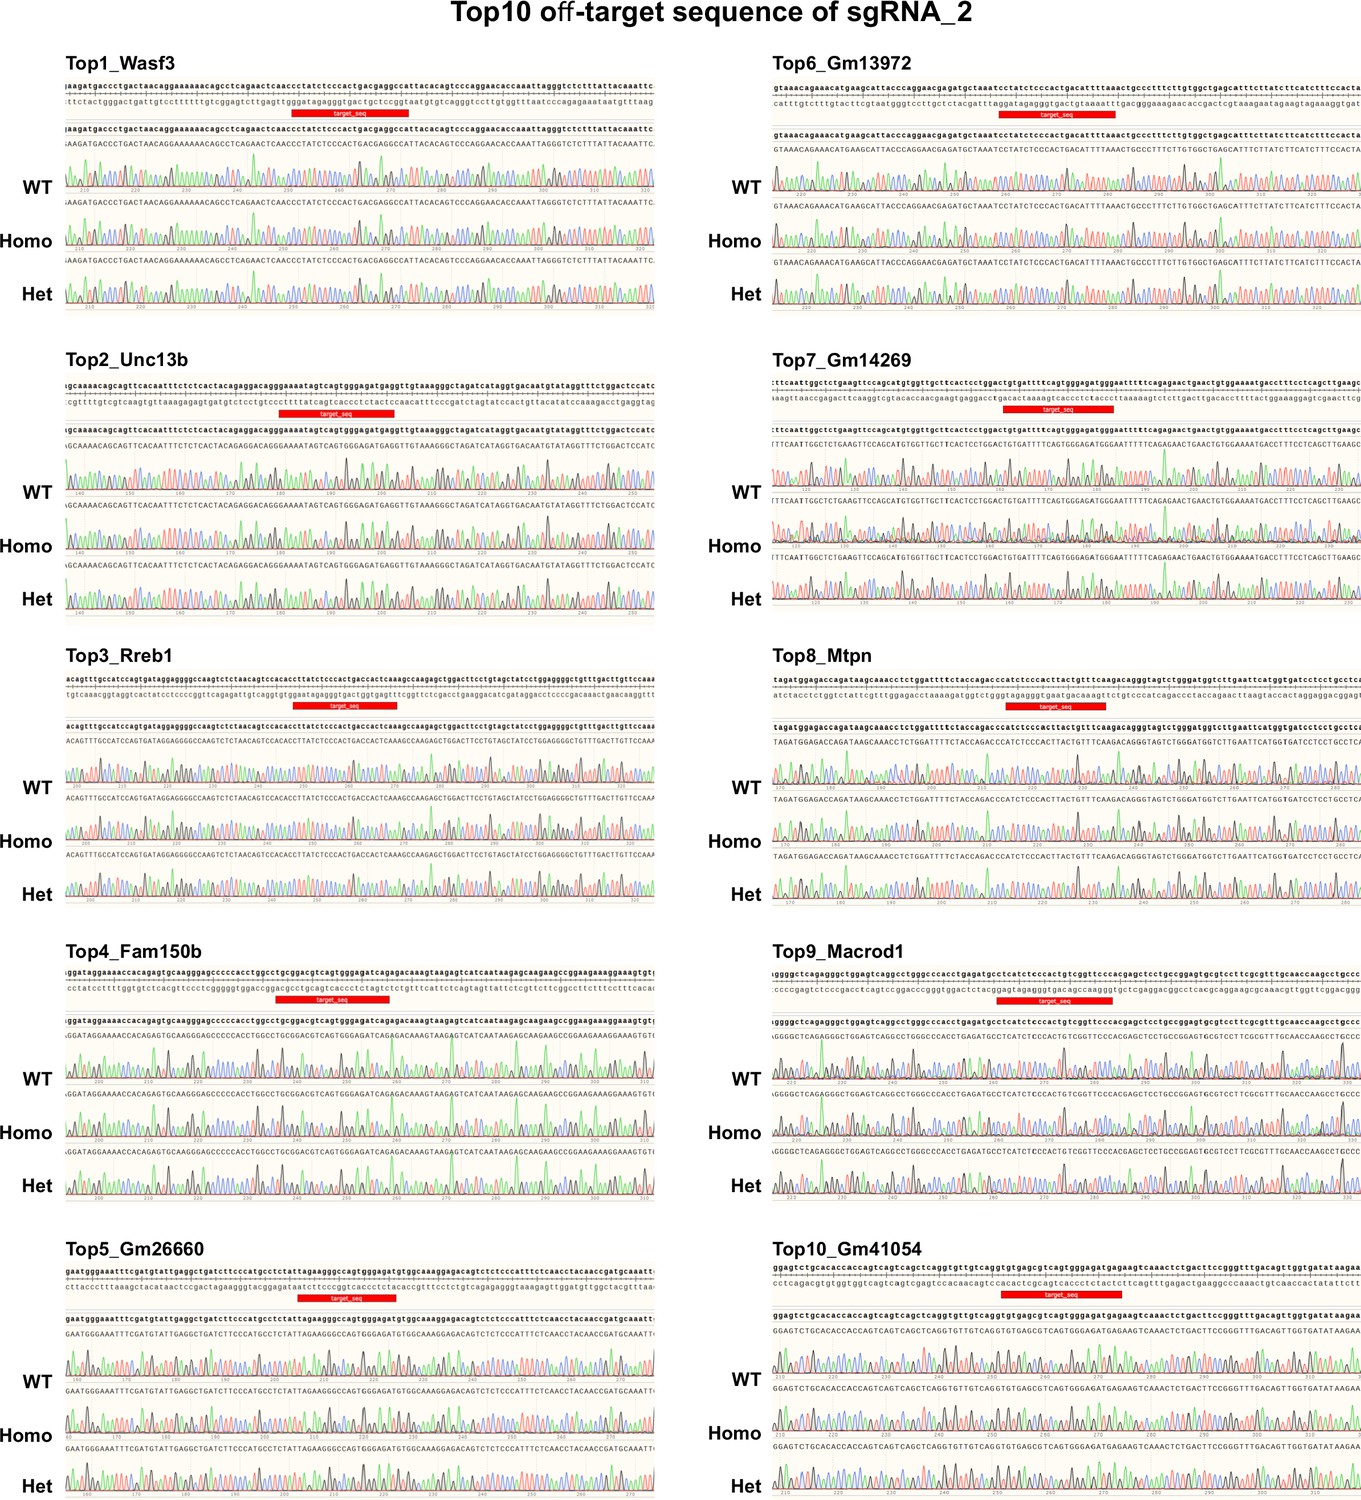
Top 10 off-target sequences of sgRNA_2.
Sanger sequencing results of top 10 off-target regions. WT: pcdha+/+ mice. Homo: pcdhaflox/flox mice. Het: pcdha+/flox mice. The mice used were littermates. The red bars (target_seq) show the predicted off-target regions in the mouse genome.
Figure 3 with 1 supplement
Overexpressing identical variables, but not C4, γ-PCDHs in neurons decreased their synaptic connectivity.
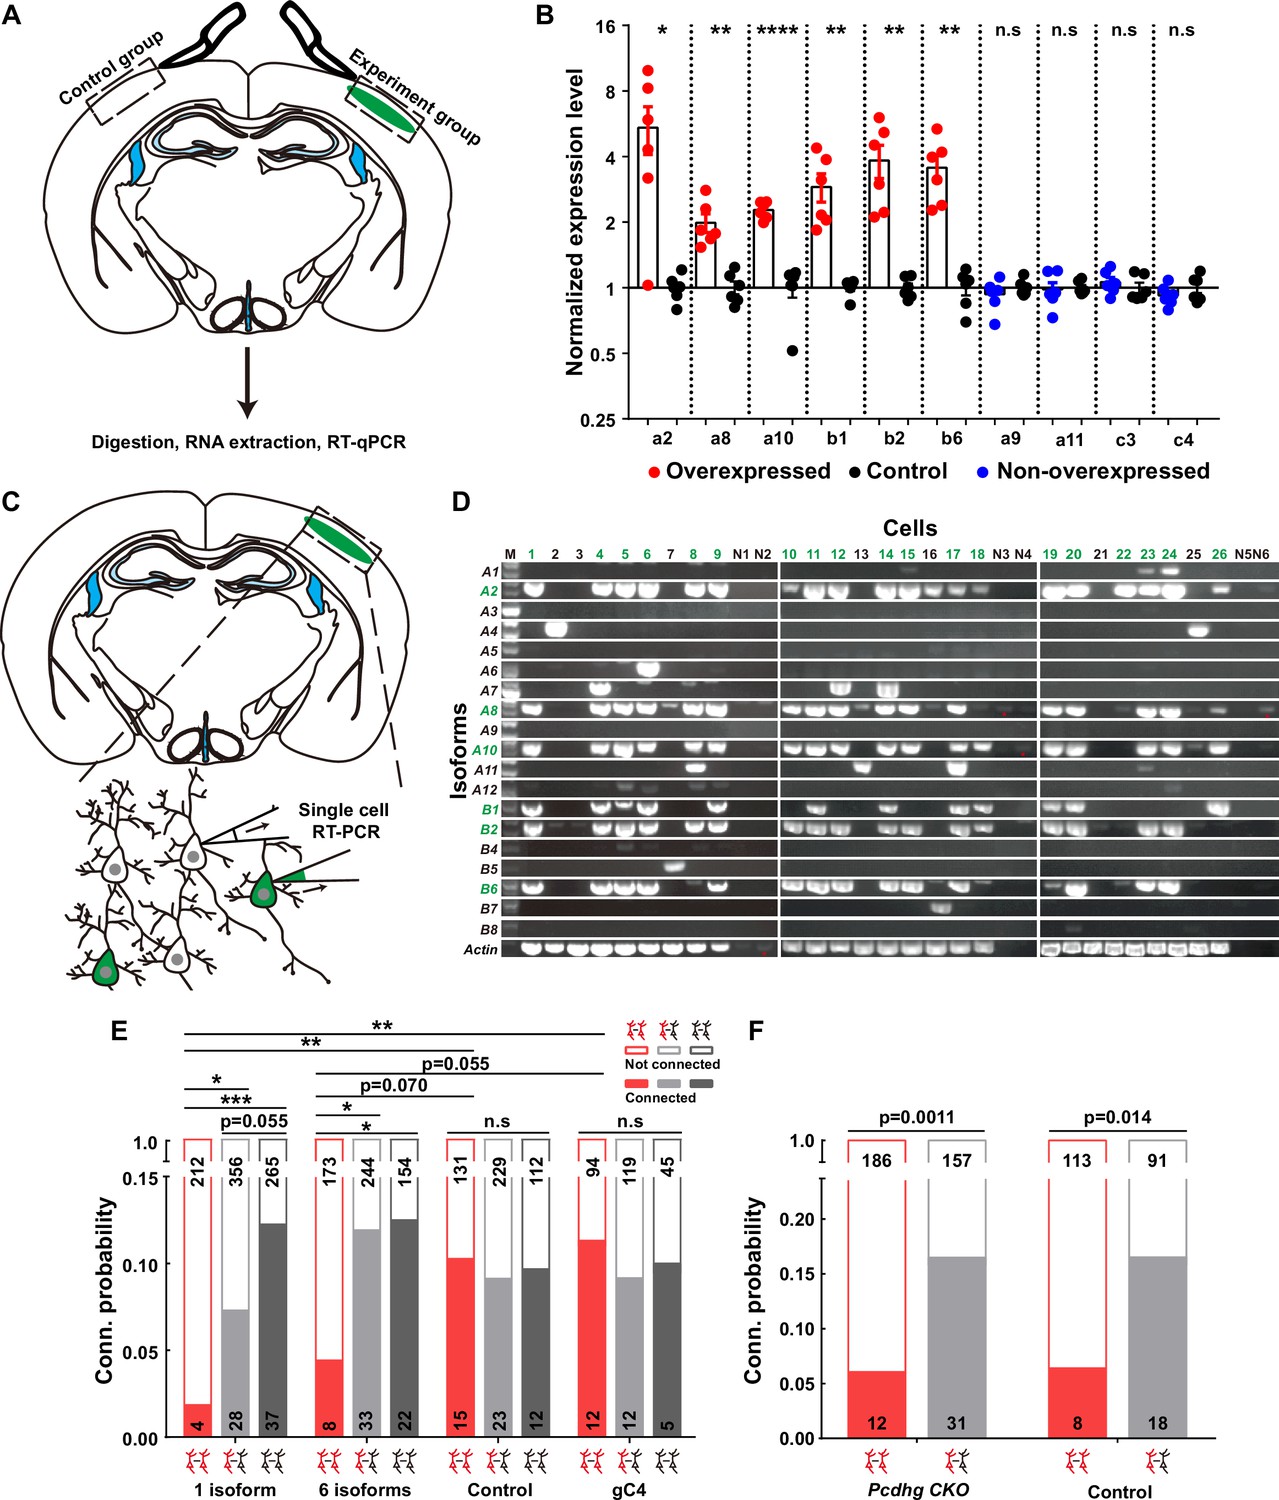
(A) Schematic illustrating the brain regions selected for quantitative reverse transcription PCR (qRT-PCR) in both experimental and control groups. (B) qRT-PCR results showing overexpression levels in electroporated regions. Electroporated isoforms are indicated in red, control isoforms in blue, and contralateral sides used as controls are in black. Statistical analysis was conducted using Student’s t-test, where *p<0.05, **p<0.01, ***p<0.001, and ****p<0.0001. (C) Diagram illustrating the process of cell extraction for single-cell RT-PCR assays. (D) Results of single-cell RT-PCR for γ-PCDH isoforms after electroporation. Neurons with fluorescence are highlighted in green, while nearby neurons without fluorescence are in black. Negative controls are labeled as N1–N6. Electroporated isoforms are shown in green, with red stars indicating faint signals in negative controls. (E) Impact of overexpressing one or six γ-PCDH isoforms on synaptic connectivity in WT mice. ‘1 isoform’ represents Pcdhga2, and ‘6 isoforms’ denote Pcdhga2, Pcdhga8, Pcdhga10, Pcdhgb1, Pcdhgb2, and Pcdhgb6. ‘gC4’ stands for PcdhgC4, and ‘Control’ indicates plasmid vector without Pcdhg insertion. (F) The influence of overexpressing six γ-PCDH isoforms on synaptic connectivity in Pcdhg conditional knockout (cKO) mice. The same six isoforms used as in (E) were employed. Pcdhg cKO: Pcdhg conditional knockout mice; Control: WT littermates. Statistical differences between groups in (E) and (F) were determined using the chi-square test and false discovery rate (FDR, Benjamini–Hochberg method) correction.
-
Figure 3—source data 1
RT-qPCR for testing overexpression level of different pcdhg isoforms in Figure 3B.
- https://cdn.elifesciences.org/articles/89532/elife-89532-fig3-data1-v1.zip
-
Figure 3—source data 2
Gel images for the expressions of different pcdhg isoforms in Figure 3D.
- https://cdn.elifesciences.org/articles/89532/elife-89532-fig3-data2-v1.zip
-
Figure 3—source data 3
Electrophysiological recording data for measuring synaptic connectivites between neurons in Figure 3.
- https://cdn.elifesciences.org/articles/89532/elife-89532-fig3-data3-v1.xlsx
Figure 3—figure supplement 1
Characterizing the overexpression effect after electroporation.
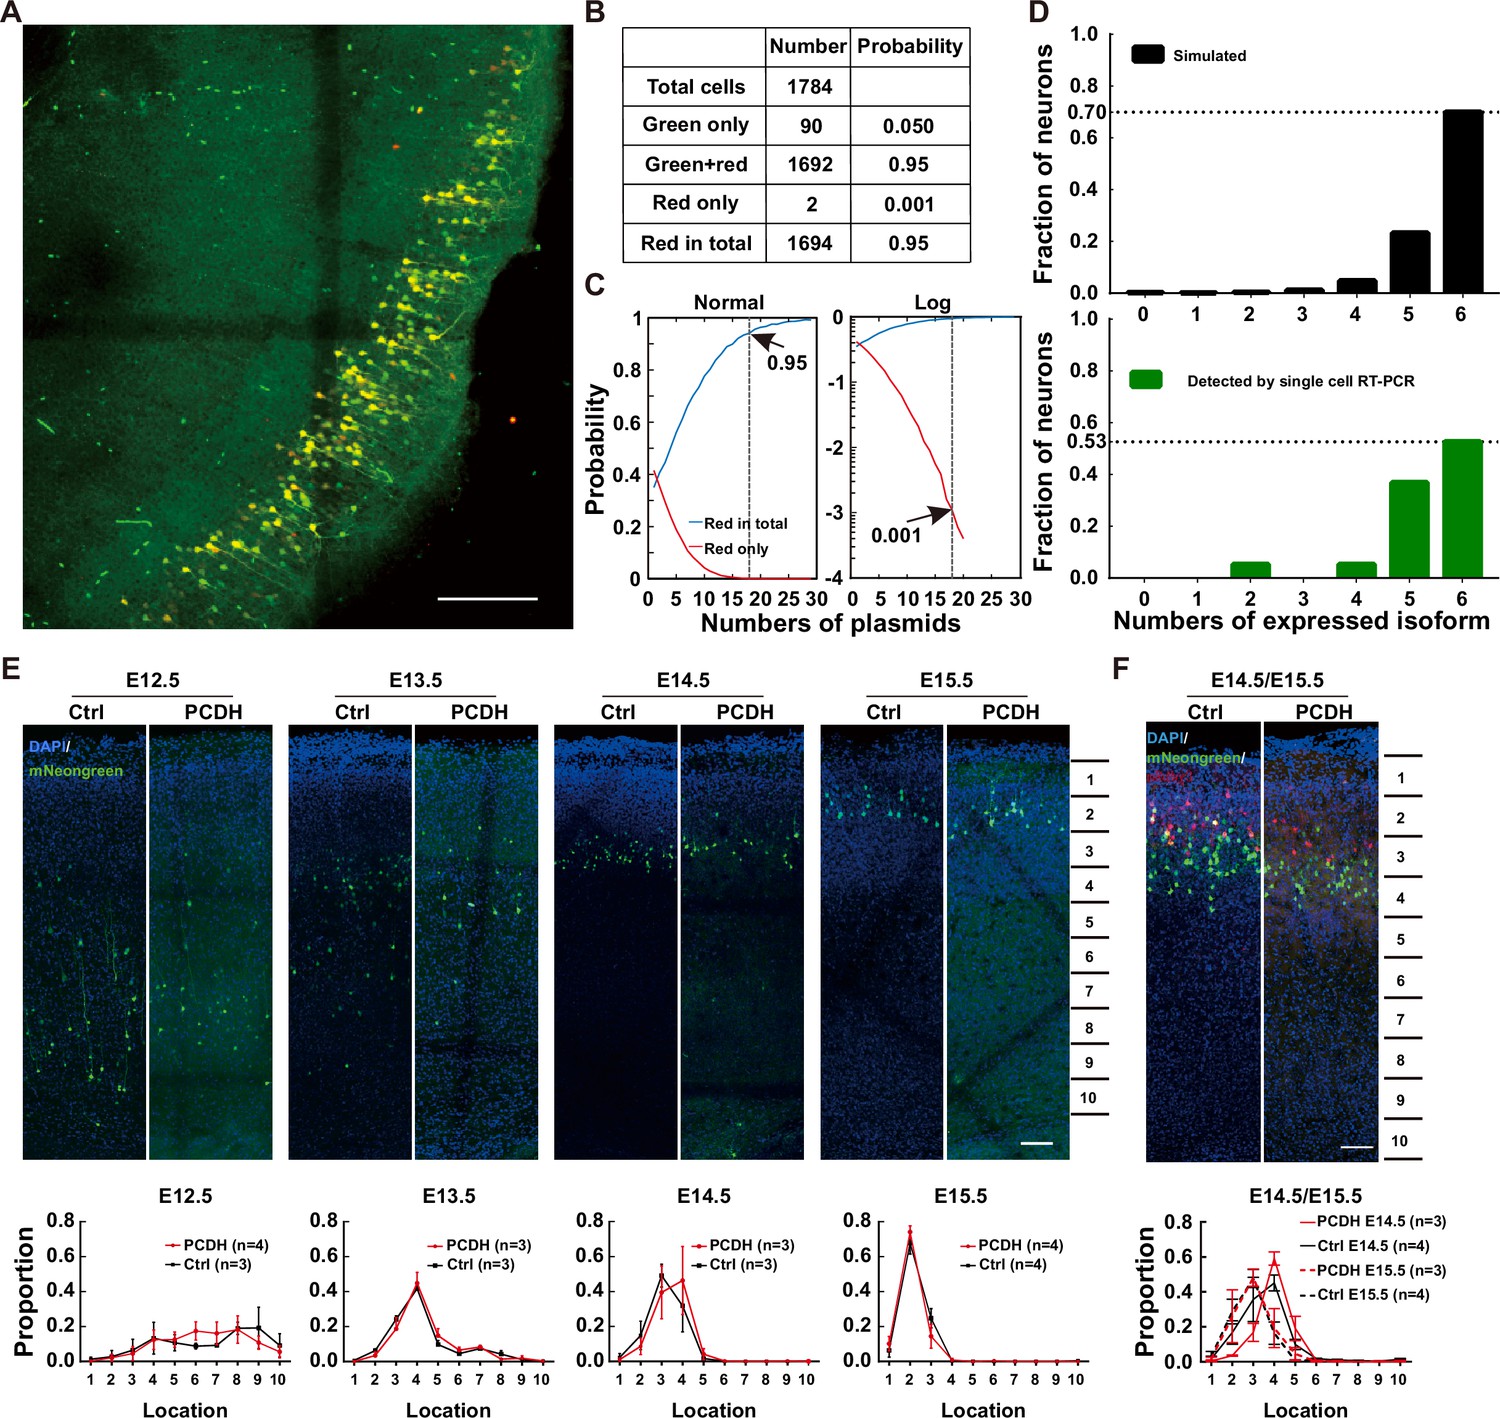
(A) A sample confocal image of electroporated neurons with five different isoforms tagged with mNeongreen and the sixth with mCherry. Scale bar = 100 μm. (B) The numbers of cells and corresponding probabilities in total population after an electroporation containing five different isoforms with green and the sixth with mCherry. (C) The normal (top) and logarithmic (bottom) probability distribution of plasmid numbers in electroporated neurons after the simulation of 10,000 cells. The top panel shows the correlation between the plasmid number and the probability of ‘red in total’ (blue line), while the bottom panel shows the correlation between the plasmid number and the likelihood of ‘red only’ (red line). (D) Distribution of the expressed isoform numbers from the stimulation (upper panel) or from the single-cell RT-PCR (lower panel). (E) Overexpressing γ-PCDH in neurons did not affect their layer distributions in the neocortex. Sample confocal images for the distribution of neurons overexpressing γ-PCDH A2 through electroporation at different embryonic stages. The lower panels demonstrate the numbers of neurons in different evenly distributed zones of the neocortex along the pial surface to the edge of white matter. Scale bar: 100 μm. (F) The distribution of neurons after a sequential-electroporation with four plasmids γ-PCDH A4, A9, A11, or B6 tagged by mNeongreen at E14.5 and other four γ-PCDH A2, A6, A8, or B1 tagged by mRuby3 at E15.5. The lower panel shows the distribution of cell numbers in different zones (zone 1 starts on the top of the pial surface and zone 10 ends at the border with the white matter). Scale bar: 100 μm. Two-way ANOVA was used for statistical analysis in (E) and (F).
-
Figure 3—figure supplement 1—source data 1
Raw images and simulation code for Figure 3—figure supplement 1.
- https://cdn.elifesciences.org/articles/89532/elife-89532-fig3-figsupp1-data1-v1.zip
Figure 4 with 1 supplement
Diversified γ-PCDHs are critical for synapse formation in cortical neurons.
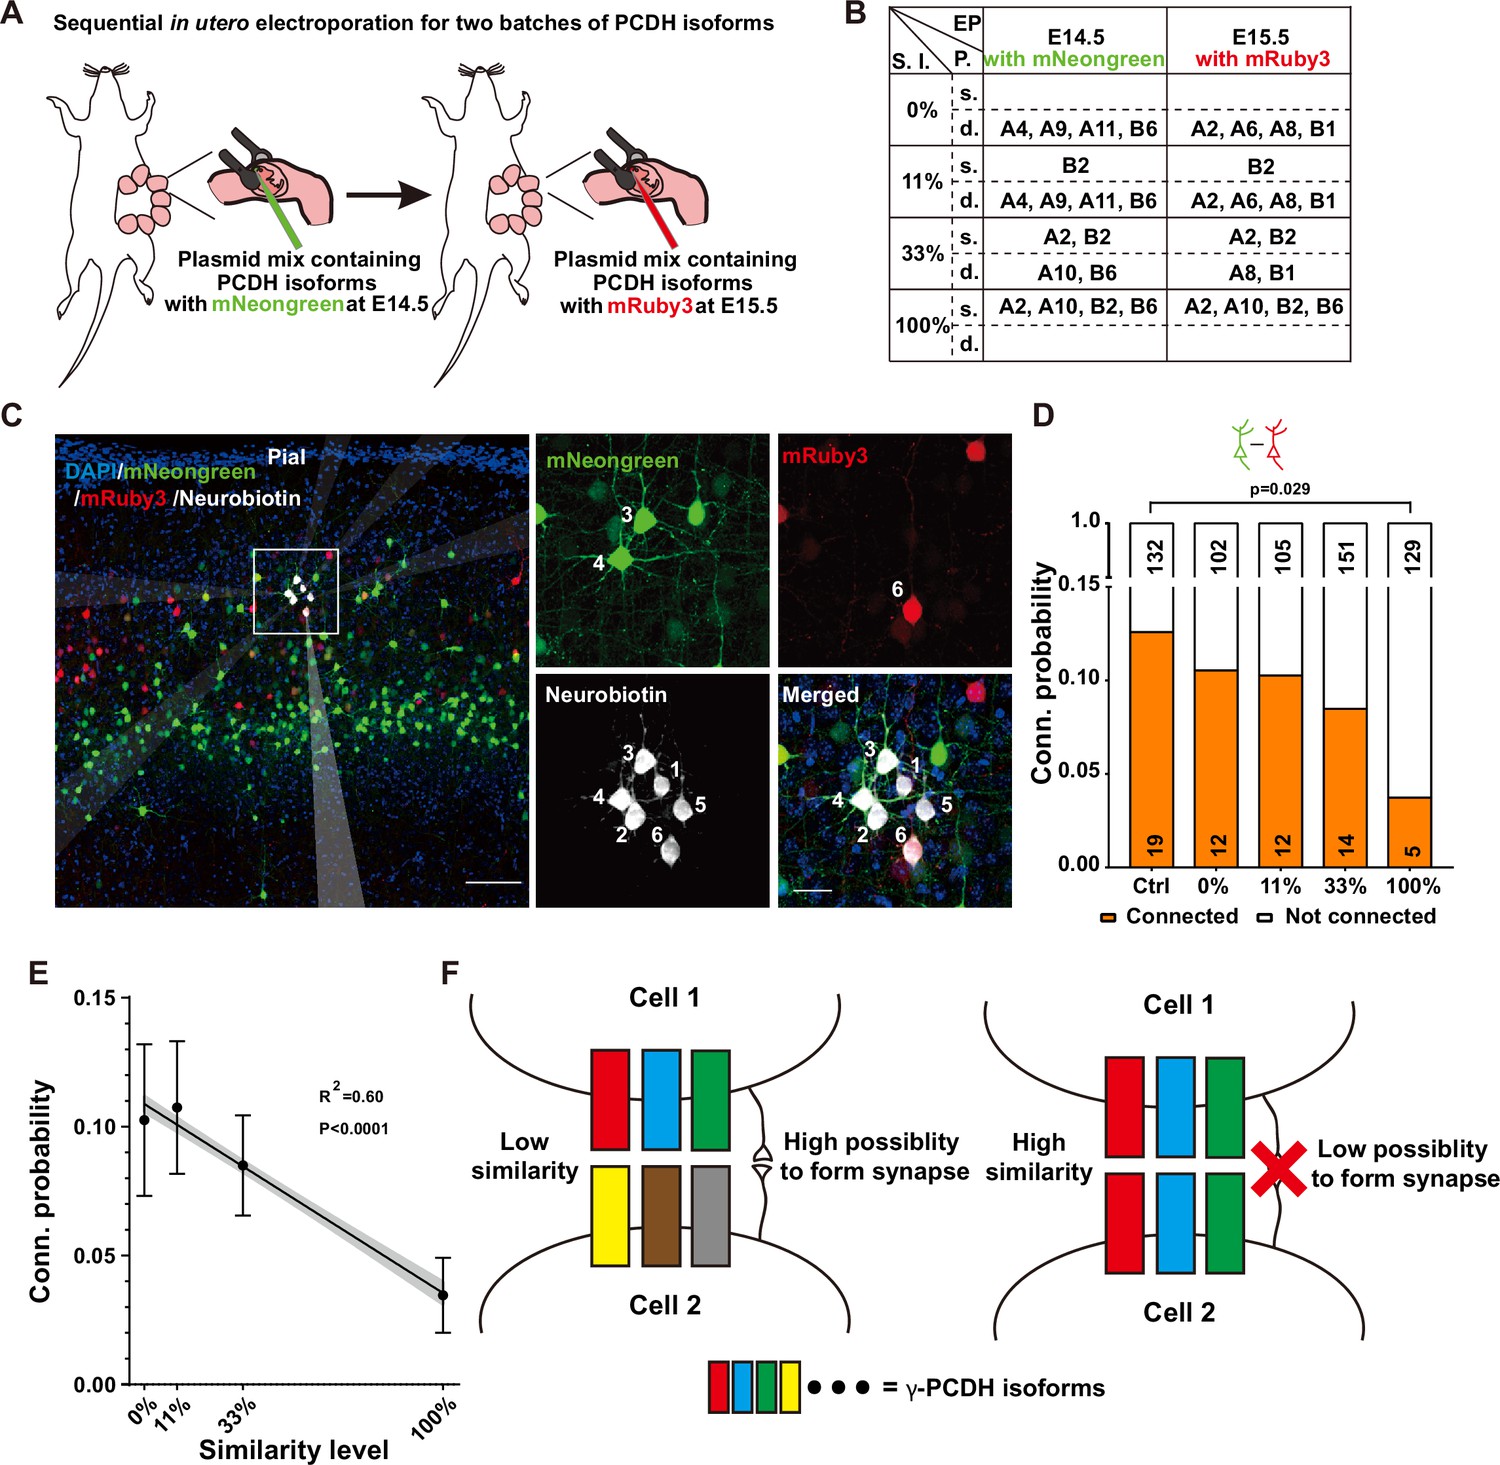
(A) Diagram illustrating the sequential in utero electroporation process at E14.5 and E15.5. (B) Overview of the overexpressed γ-PCDH isoforms in different experiments, resulting in varying similarity levels between neurons. S.l.: similarity level; EP: electroporation; P.: plasmids mixture; s./d., same or different isoforms in two electroporations. (C) Sample image of recorded neurons after two rounds of electroporation at E14.5 (mNeongreen) and E15.5 (mRuby3). Neurons labeled as positive for mNeongreen (cells 3 and 4), mRuby3 (cell 6), and negative without fluorescence (cells 1, 2, and 5). Neurobiotin was used in the internal solution to label recorded neurons. The translucent arrows show the positions of the electrodes. Scale bar, left: 100 μm, right: 25 μm. (D) Connectivity probability for neuron pairs overexpressing different sets of γ-PCDH isoforms (labeled with different fluorescence) following sequential in utero electroporation. Statistical differences were determined using the chi-square test with false discovery rate (FDR) (Benjamini–Hochberg method) correction. (E) Correlation between the similarity level of overexpressed γ-PCDH combinations and the probability of synaptic connections. Each data point corresponds to the outcome of 100 bootstrapped samples derived from the source data presented in panel (D). Error bars indicate the standard deviation (SD) for each data point. The gray shaded area represents the 95% confidence interval of the curve fitting. (F) Graph summarizing the effect of γ-PCDHs on synapse formation.
-
Figure 4—source data 1
Electrophysiological recording data for measuring synaptic connectivites between neurons in Figure 4D and Figure 4—figure supplement 1.
- https://cdn.elifesciences.org/articles/89532/elife-89532-fig4-data1-v1.zip
Figure 4—figure supplement 1
The effect of overexpressing γ-PCDHs on synaptic connectivity.
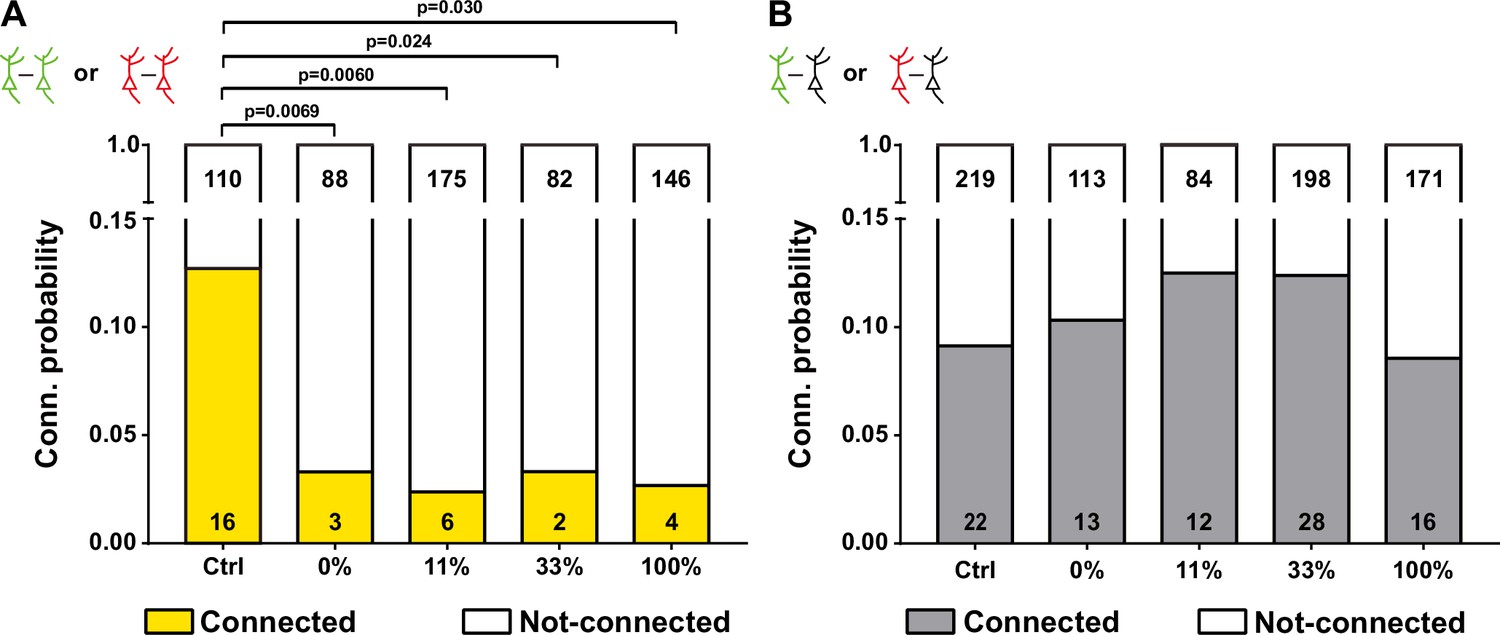
(A) The connectivity probability for neuron pairs overexpressed same γ-PCDHs combinations (labeled with the same fluorescence). The statistical difference was compared between each group and the control group. (B) The connectivity probability for neuron pairs contained one overexpressed cell and one adjacent cell without fluorescence. Chi-square test and false discovery rate (FDR) correction were used to determine the statistical difference in (A) and (B).
Tables
Key resources table
| Reagent type (species) or resource | Designation | Source or reference | Identifiers | Additional information |
|---|---|---|---|---|
| Strain, strain background (C57BL/6 Mus musculus) | Pcdhgfcon3/fcon3 | CAS Center for Excellence in Brain Science and Intelligence Technology | From Dr.Yifeng Zhang Jax: 012644; DOI:10.1242/dev.027912 | |
| Strain, strain background (C57BL/6 M. musculus) | Neurod6-cre (also known as Nex-cre) | CAS Center for Excellence in Brain Science and Intelligence Technology | From Dr.Zilong Qiu; DOI:10.1002/dvg.20256 | |
| Strain, strain background (C57BL/6 M. musculus) | Pcdhaflox/flox | Biocytogen Pharmaceuticals (Beijing) (Figure 2D and Figure 2—figure supplements 2–4) | Established in this study | |
| Strain, strain background (C57BL/6N M. musculus) | C57 | Vital River Laboratories | 213 | |
| Strain, strain background (CD-1(ICR) M. musculus) | ICR WT | Vital River Laboratories | 201 | |
| Antibody | Anti-RFP (rabbit polyclonal) | Rockland | 600-401-379 | IHC (1:1000) |
| Recombinant DNA reagent | CAG-pcdhga2-mNeongreen (plasmid) | This paper (Figures 3B and 4B) | P80 | These plasmids made in this paper: The genes were cloned from WT C57BL/6N cDNA (whole brain) and inserted to the CAGGS plasmid backbone (AscI/NotI site), respectively |
| Recombinant DNA reagent | CAG-pcdhga10-mNeongreen (plasmid) | This paper (Figures 3B and 4B) | P81 | |
| Recombinant DNA reagent | CAG-pcdhgb2-mNeongreen (plasmid) | This paper (Figures 3B and 4B) | P82 | |
| Recombinant DNA reagent | CAG-pcdhgb6-mNeongreen (plasmid) | This paper (Figures 3B and 4B) | P83 | |
| Recombinant DNA reagent | CAG-pcdhga6-mNeongreen (plasmid) | This paper (Figures 3B and 4B) | P115 | |
| Recombinant DNA reagent | CAG-pcdhga8-mNeongreen (plasmid) | This paper (Figures 3B and 4B) | P116 | |
| Recombinant DNA reagent | CAG-pcdhgb1-mNeongreen (plasmid) | This paper (Figures 3B and 4B) | P117 | |
| Recombinant DNA reagent | CAG-pcdhgC4-mNeongreen (plasmid) | This paper (Figure 3E) | P269 | |
| Recombinant DNA reagent | CAG-pcdhga2-mRuby3 (plasmid) | This paper (Figure 4B) | P84 | |
| Recombinant DNA reagent | CAG-pcdhga10-mRuby3 (plasmid) | This paper (Figure 4B) | P85 | |
| Recombinant DNA reagent | CAG-pcdhgb2-mRuby3 (plasmid) | This paper (Figure 4B) | P86 | |
| Recombinant DNA reagent | CAG-pcdhgb6-mRuby3 (plasmid) | This paper (Figure 4B) | P87 | |
| Recombinant DNA reagent | CAG-pcdhga4-mRuby3 (plasmid) | This paper (Figure 4B) | P206 | |
| Recombinant DNA reagent | CAG-pcdhga7-mRuby3 (plasmid) | This paper (Figure 4B) | P207 | |
| Recombinant DNA reagent | CAG-pcdhga9-mRuby3 (plasmid) | This paper (Figure 4B) | P208 | |
| Recombinant DNA reagent | CAG-pcdhga11-mRuby3 (plasmid) | This paper (Figure 4B) | P209 | |
| Recombinant DNA reagent | CAG-pcdhga6-mCherry (plasmid) | This paper ( Figure 3—figure supplement 1A) | P132 | |
| Commercial assay or kit | PrimeScript RT Master Mix | Takara | RR036A | |
| Commercial assay or kit | SYBR Green Real-time PCR Master Mix | Toyobo | QPK-201 | |
| Commercial assay or kit | Mouse T Cell Chromium Single Cell V(D)J Enrichment Kit | 10X Genomics | PN-1000071 | |
| Software, algorithm | MATLAB R2018b | MathWorks |
Additional files
-
Supplementary file 1
Primers list.
(1) Primers for ‘library construction for 5' end single-cell sequencing’. (2) Primers for confirming the generation of pcdha cKO mice. (3) Primers for qRT-PCR. (4) Primers for single-cell RT-PCR.
- https://cdn.elifesciences.org/articles/89532/elife-89532-supp1-v1.xlsx
-
MDAR checklist
- https://cdn.elifesciences.org/articles/89532/elife-89532-mdarchecklist1-v1.docx
Download links
A two-part list of links to download the article, or parts of the article, in various formats.
Downloads (link to download the article as PDF)
Open citations (links to open the citations from this article in various online reference manager services)
Cite this article (links to download the citations from this article in formats compatible with various reference manager tools)
Combinatorial expression of γ-protocadherins regulates synaptic connectivity in the mouse neocortex
eLife 12:RP89532.
https://doi.org/10.7554/eLife.89532.3


