Identification of ERAD-dependent degrons for the endoplasmic reticulum lumen
- Department of Biological Chemistry, University of Michigan Medical School, United States
- Cellular and Molecular Biology Program, University of Michigan Medical School, United States
Figures
Figure 1 with 1 supplement
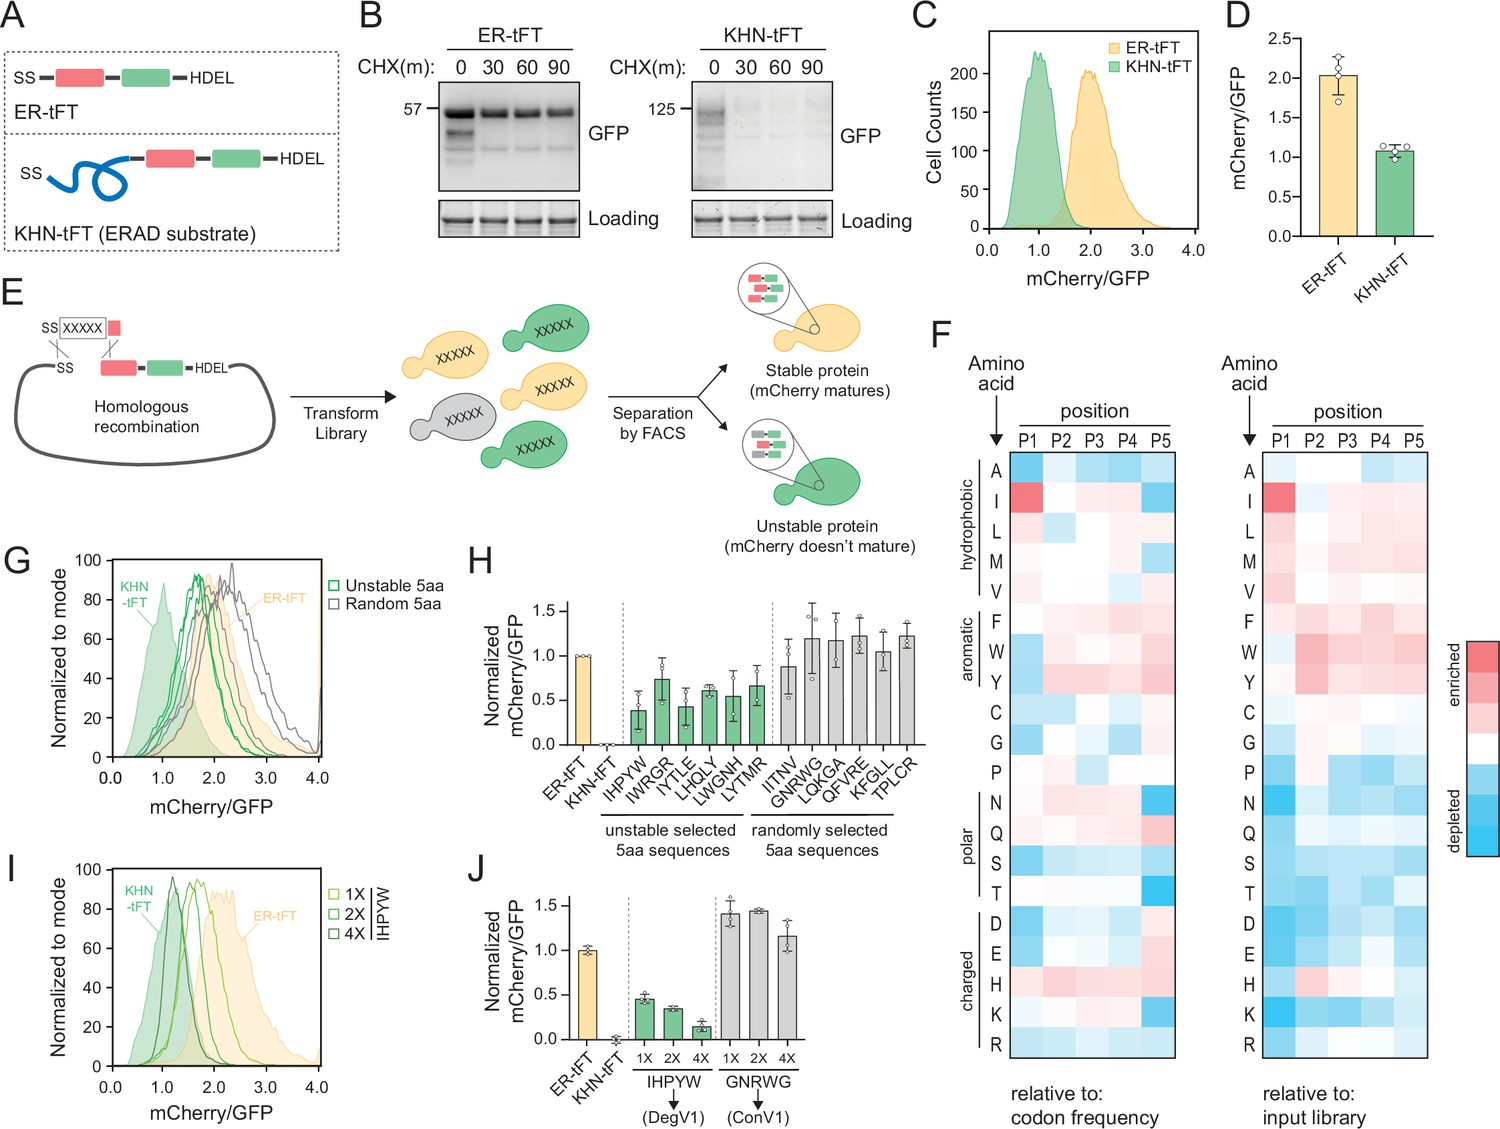
Identification of endoplasmic reticulum (ER)-localized degrons.
(A) Schematic depicting the ER-tandem fluorescent protein timer (tFT) and KHN-tFT constructs, which contain an ER-targeting signal sequence (SS), mCherry (red), superfastGFP (green), and the HDEL ER retention sequence. KHN-tFT functions as a quickly degraded ER associated degradation (ERAD) substrate (a positive control for degradation). (B) Wild-type yeast expressing the constructs described in (A) were treated with cycloheximide (CHX) for 0, 30, 60, or 90 min, harvested, and protein levels were assessed by immunoblotting using anti-GFP antibodies. Total protein was visualized in gel using stain-free technology (Loading). (C) Flow cytometry of yeast expressing the constructs in (A) treated with CHX for 2 hr. The mCherry/GFP fluorescence intensity ratio of each cell was calculated and plotted. (D) Quantification of the mean mCherry/GFP ratio of four biological replicates as in (C). (E) Overview of the pentapeptide library generation and isolation of unstable variants using fluorescence-activated cell sorting (FACS). A DNA fragment containing the pentapeptide-ER-tFT library was electroporated with linearized ER-tFT plasmid. The resulting yeast library contains a mixture of variants that are separated by FACS, with less stable variants having decreased mCherry/GFP fluorescence intensity compared to stable variants. (F) Heatmap of amino acid enrichments at each position within the unstable pentapeptide library. Values are displayed relative to either codon usage (left) or relative to the input library (right). (G) As in (C) with strains expressing either ER-tFT (yellow fill), KHN-tFT (green fill), individual FACS isolates from the ‘unstable’ pentapeptide sequences (green lines), or randomly selected pentapeptide-ER-tFT sequences from the input library (gray lines). (H) Quantification of at least two biological replicates conducted as in (G). The unstable groups (green) and random groups (gray) were significantly different from each other using a one-way ANOVA and Tukey’s multiple comparisons tests. (I) As in (C) with strains expressing either ER-tFT (yellow fill), KHN-tFT (green fill), a single IHPYW (1X), 2X repeat of IHPYW (2X), or 4X repeat of IHPYW at the N-terminus of ER-tFT. (J) Quantification of two to three biological replicates of (I).
-
Figure 1—source data 1
Uncropped and labeled gels for Figure 1.
- https://cdn.elifesciences.org/articles/89606/elife-89606-fig1-data1-v1.zip
-
Figure 1—source data 2
Raw unedited gels for Figure 1.
- https://cdn.elifesciences.org/articles/89606/elife-89606-fig1-data2-v1.zip
-
Figure 1—source data 3
Numerical source data for plots displayed in Figure 1.
- https://cdn.elifesciences.org/articles/89606/elife-89606-fig1-data3-v1.xlsx
Figure 1—figure supplement 1
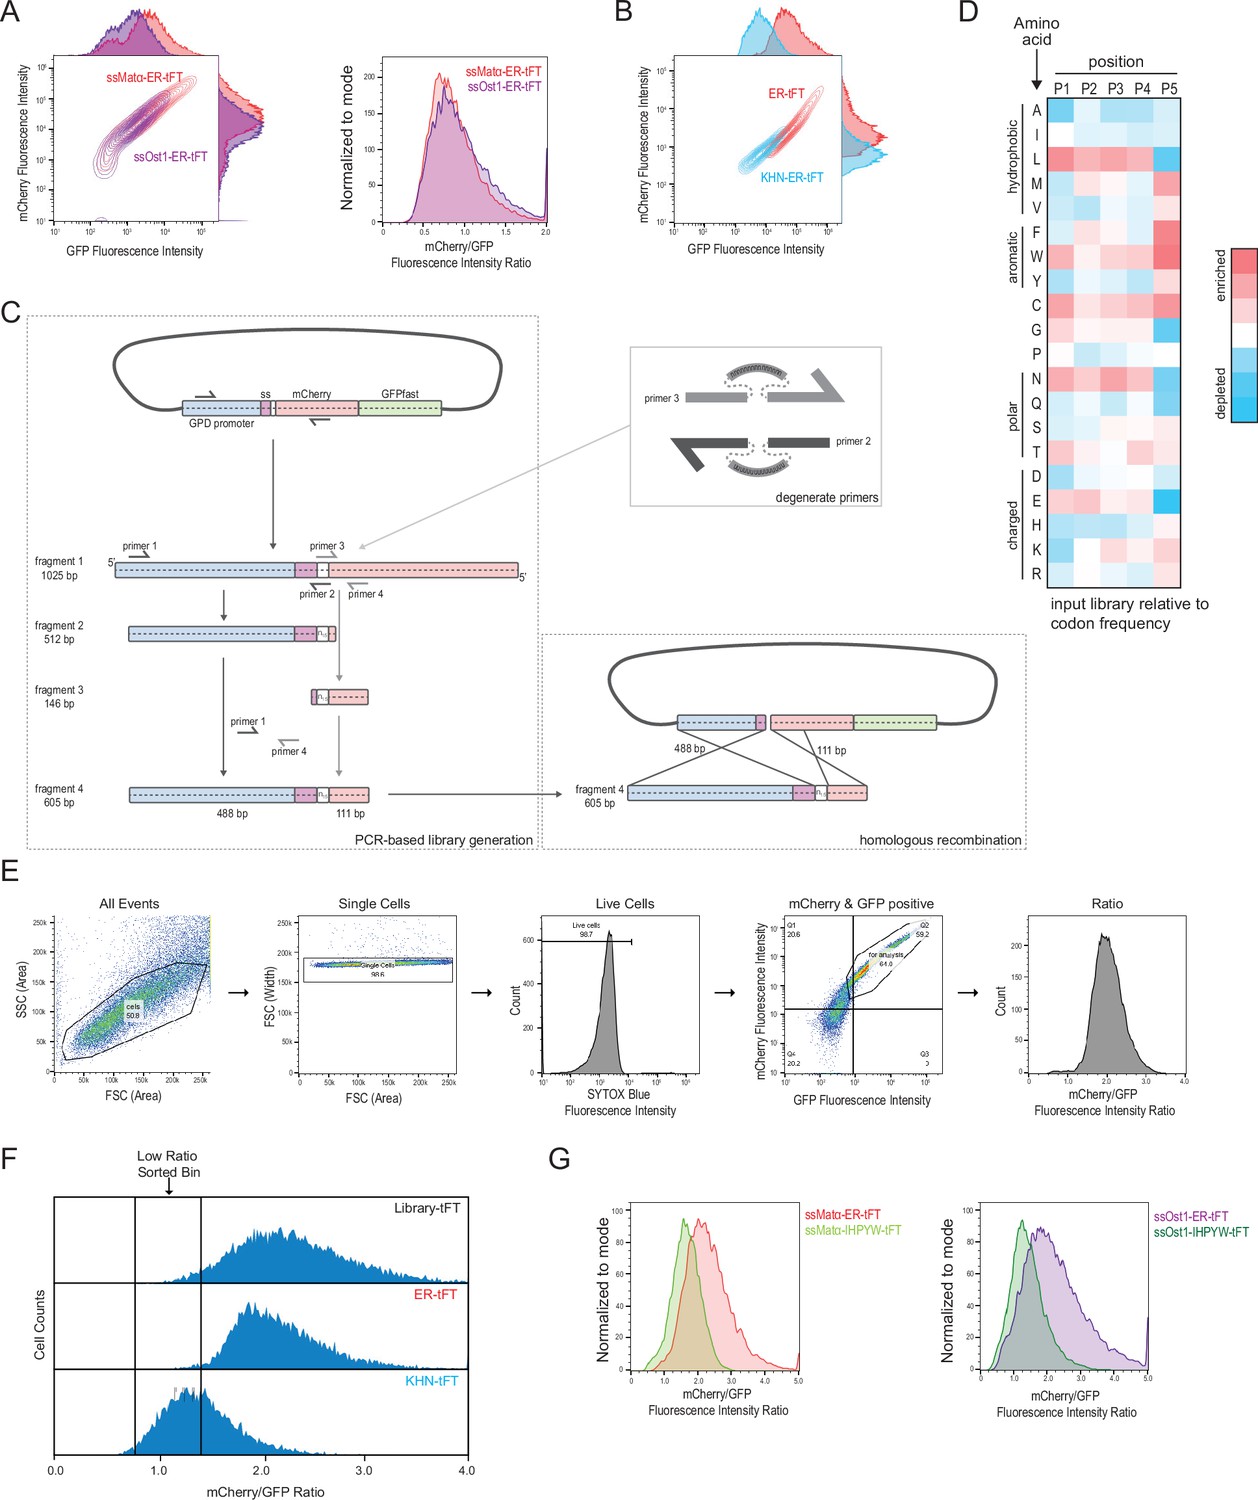
Optimization of the experimental design.
(A) The tandem fluorescent protein timer (tFT) was targeted to the endoplasmic reticulum (ER) with two different signal peptides, either that of mating factor alpha (Matα) or of Ost1. The GFP and mCherry fluorescence were displayed as a contour plot (left panel). The mCherry/GFP fluorescence intensity ratio of each cell was calculated displayed as a histogram (right panel). Based on the superior brightness of cells expressing the mating factor alpha signal sequence, we selected this signal peptide for further experimentation. (B) Flow cytometry of yeast strains expressing an ER-tFT and endoplasmic reticulum associated degradation (ERAD)-substrate KHN-tFT treated with cycloheximide for 2 hr. (C) Schematic of the PCR-mediated library generation (left) using degenerate primers (upper right) and homologous recombination in yeast (lower right). (D) Heatmap of input library amino acid enrichments at each position displayed relative to codon frequency. (E) Gating strategy for analyzing single cells by flow cytometry. (F) Sorting bins defined relative to ER-tFT and KHN-tFT. (G) Comparison of mCherry/GFP ratios for alternate signal sequences on ER-tFT and IHPYW-tFT.
Figure 2 with 2 supplements
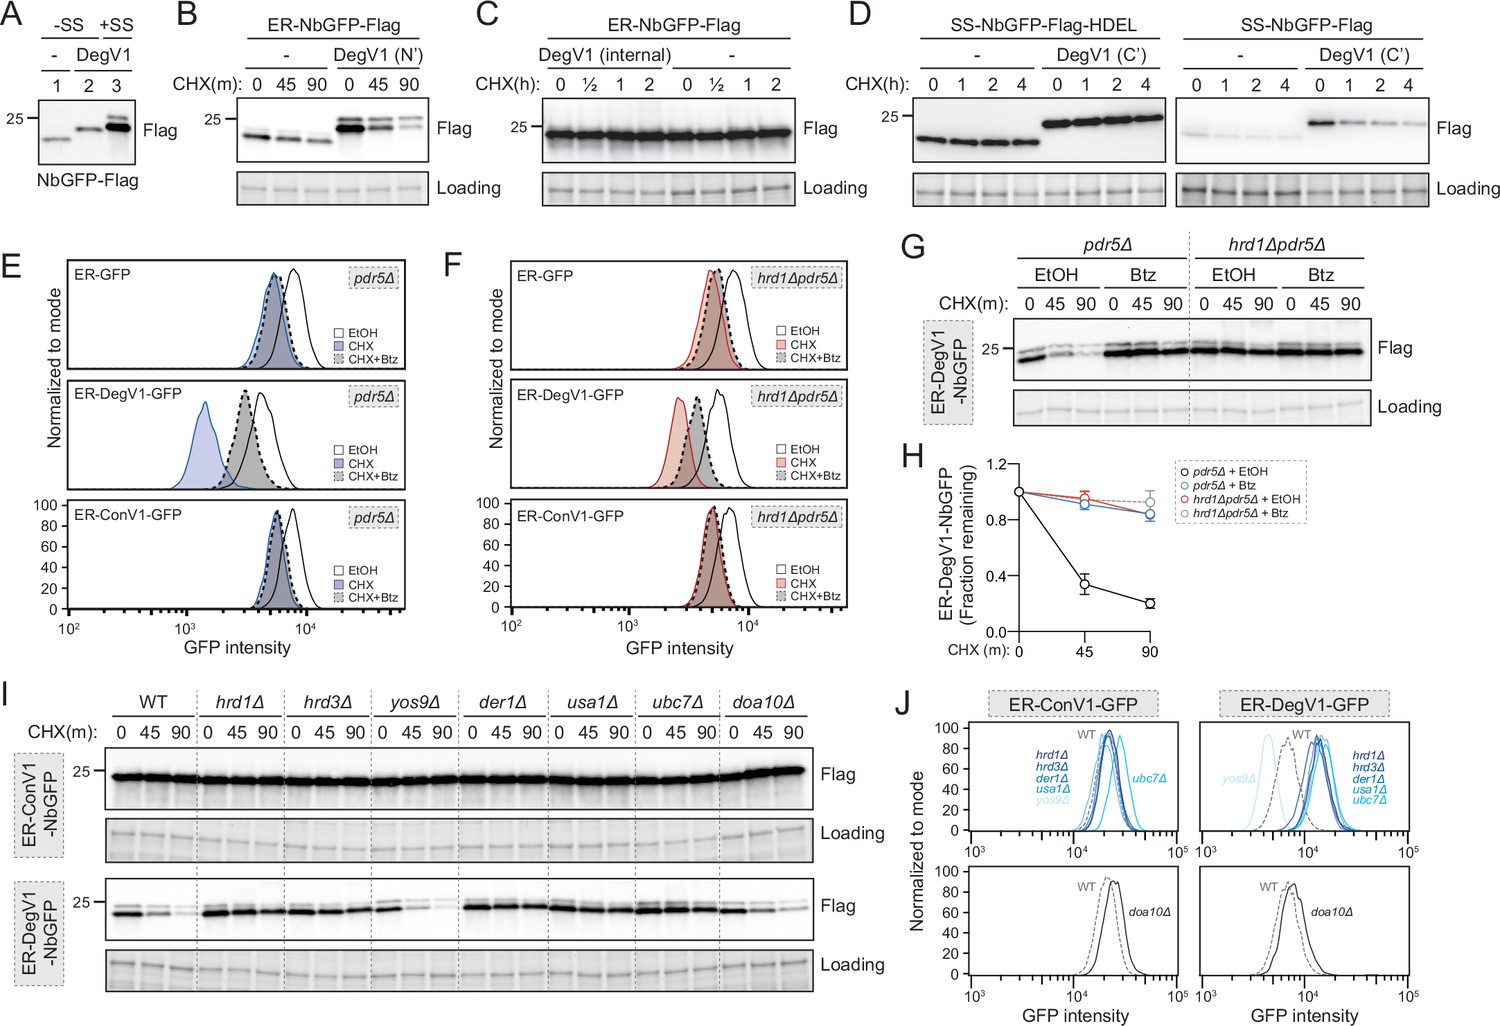
DegV1 is an endoplasmic reticulum associated degradation (ERAD)-dependent degron degraded by the proteasome.
(A) The apparent molecular weight of anti-GFP nanobodies were assessed (NbGFP-Flag) either with or without signal sequence, in the presence or absence of DegV1, were assessed by SDS-PAGE electrophoresis followed by immunoblotting with anti-Flag antibody. This panel is representative of two biological replicates. (B) The degradation of ER-targeted anti-GFP nanobodies (ER-NbGFP-Flag) either with, or without, DegV1 were monitored following addition of cycloheximide (CHX), using SDS-PAGE and immunoblotting. Loading controls were visualized by stain-free technology. (C) The degradation of ER-NbGFP-Flag with DegV1 replacing the CDR3 region was analyzed as in (B). (D) The degradation of a nanobody with DegV1 located either directly preceding the C-terminal HDEL ER retention signal (left) or directly at the C-terminus of the nanobody (right) was analyzed as in (B). (E) Degradation of the ER-targeted proteins ER-GFP (top panel), ER-DegV1-GFP (middle panel), or ER-ConV1-GFP (bottom) were analyzed in a pdr5Δ strain by flow cytometry following either ethanol (EtOH) or CHX treatment for 2 hr. Where indicated, cells were pretreated with bortezomib (Btz) for 2 hr. (F) As in (E), but in a hrd1Δpdr5Δ strain. (G) Degradation of ER-DegV1-NbGFP was followed in pdr5Δ or hrd1Δpdr5Δ strain as in (B). Where indicated, cells were pretreated with Btz for 2 hr. (H) Quantification of (G) with error bars representing the standard deviation. (I) Degradation of ER-ConV1-NbGFP (top panel) or ER-DegV1-NbGFP (bottom panel) was followed in of ERAD component deletion strains as in (B). This panel is representative of two independent biological replicates. (J) The degradation of ER-ConV-GFP (left), or ER-DegV-GFP (right), were analyzed in the indicated ERAD component deletion strains by flow cytometry following cycloheximide treatment for 2 hr. All panels in this figure are representative of at least three independent biological replicates, unless otherwise indicated.
-
Figure 2—source data 1
Uncropped and labeled gels for Figure 2.
- https://cdn.elifesciences.org/articles/89606/elife-89606-fig2-data1-v1.zip
-
Figure 2—source data 2
Raw unedited gels for Figure 2.
- https://cdn.elifesciences.org/articles/89606/elife-89606-fig2-data2-v1.zip
-
Figure 2—source data 3
Numerical source data for plots displayed in Figure 2.
- https://cdn.elifesciences.org/articles/89606/elife-89606-fig2-data3-v1.xlsx
Figure 2—figure supplement 1
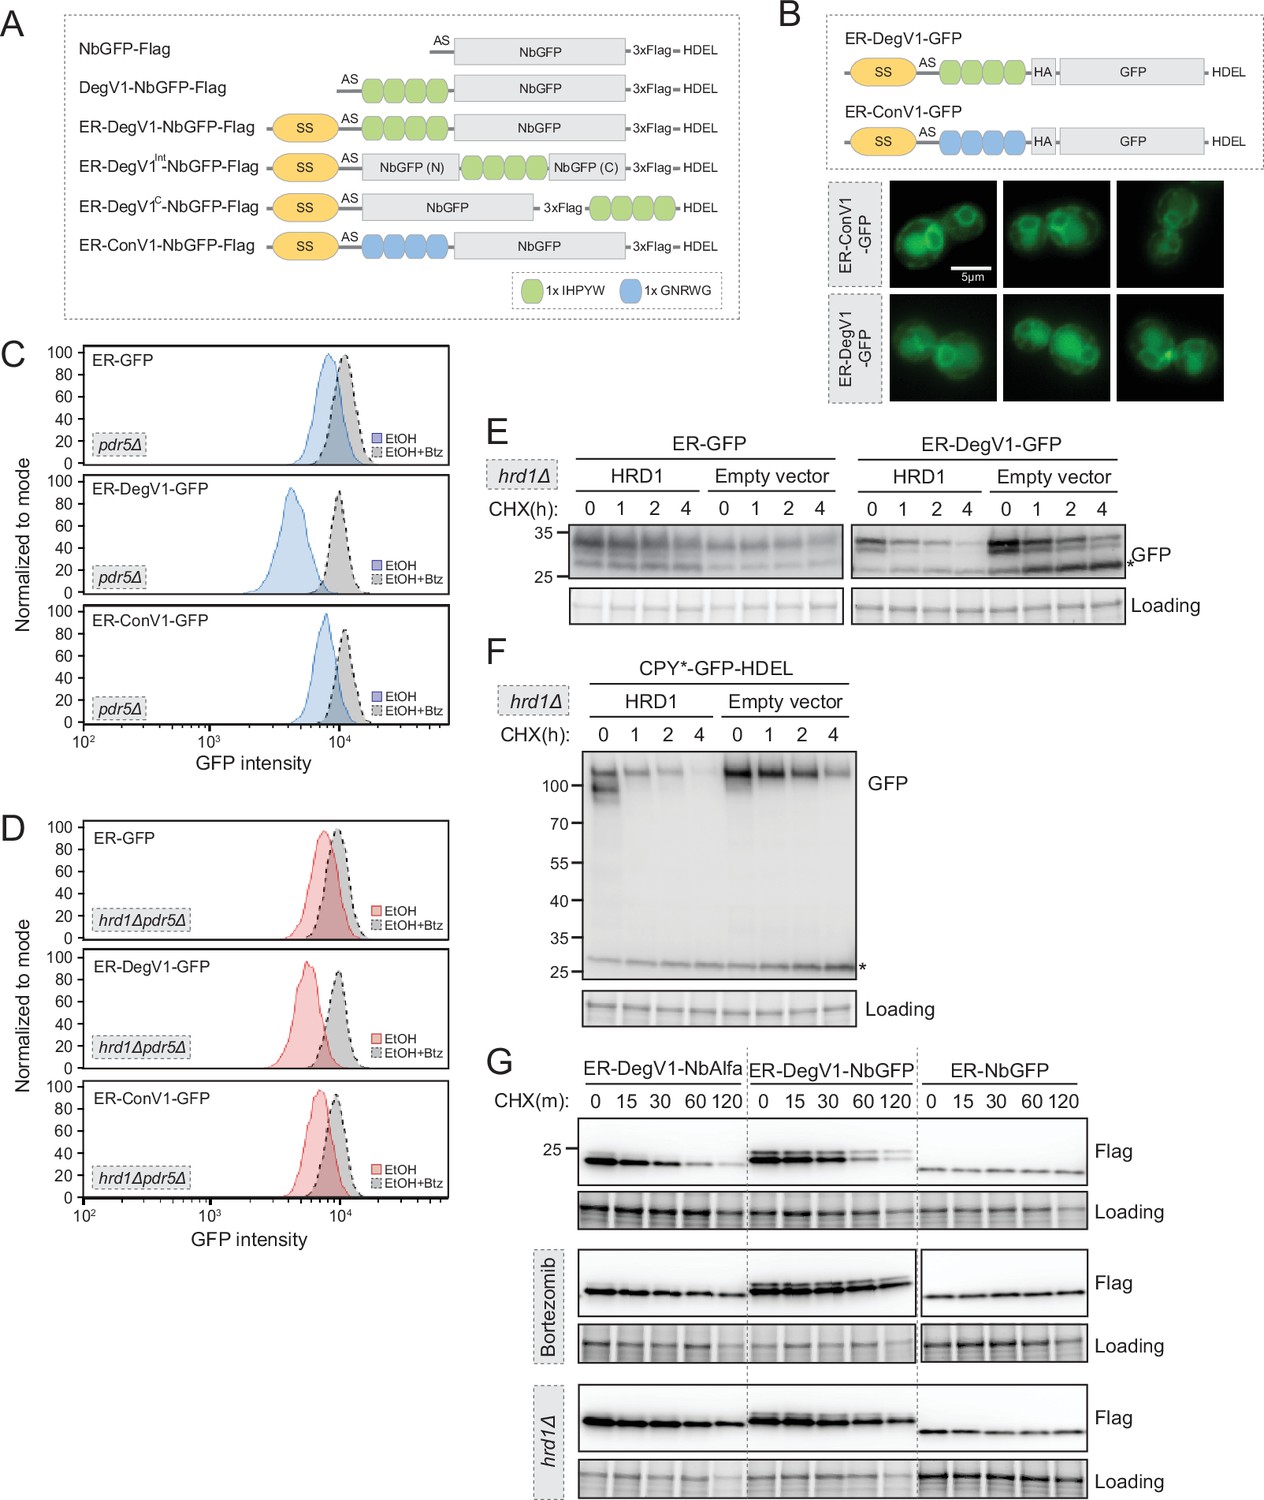
Construct layout and degradation experiments.
(A) Linear diagram of degradation constructs used in this work. SS, mating factor alpha signal sequence; AS, alanine and serine dipeptide linker; NbGFP, LaG16 anti-GFP nanobody; HDEL, endoplasmic reticulum (ER) retention signal. (B) Localization of ER-targeted GFP proteins (ER-ConV1-GFP and ER-DegV1-GFP) in wild-type yeast cells. Proteins were observed in both the ER and vacuolar localization. The scale bar is 5 µm. (C) The degradation of ER-targeted GFP proteins (ER-GFP (top), ER-DegV1-GFP (middle), or ER-ConV1-GFP (bottom)) were analyzed by flow cytometry following either ethanol (EtOH) or with bortezomib (Btz) for 2 hr. (D) As in (C), but in a hrd1Δpdr5Δ strain. (E) Degradation of ER-targeted GFP with an ER retention signal (HDEL) with, or without, DegV1 was followed in a hrd1Δ strain complemented with either an empty vector or with Hrd1 on a centromeric plasmid. Using a cycloheximide chase and immunoblotting, we found in the absence of Hrd1, we observe transport of the proteins to the vacuole, where free GFP accumulates. The asterisk indicates the vacuolar-localized GFP fragment. (F) As in (E), except with CPY*-GFP-HDEL. The asterisk indicates the vacuolar-localized GFP fragment. (G) Degradation of ER-DegV1-NbAlfa, ER-DegV1-NbGFP, or ER-NbGFP was followed using a cycloheximide chase in the presence or absence of Btz in a pdr5Δ or hrd1Δpdr5Δ strain. All panels in this figure are representative of at least three independent biological replicates.
-
Figure 2—figure supplement 1—source data 1
Uncropped and labeled gels for Figure 2—figure supplement 1.
- https://cdn.elifesciences.org/articles/89606/elife-89606-fig2-figsupp1-data1-v1.zip
-
Figure 2—figure supplement 1—source data 2
Raw unedited gels for Figure 2—figure supplement 1.
- https://cdn.elifesciences.org/articles/89606/elife-89606-fig2-figsupp1-data2-v1.zip
Figure 2—figure supplement 2
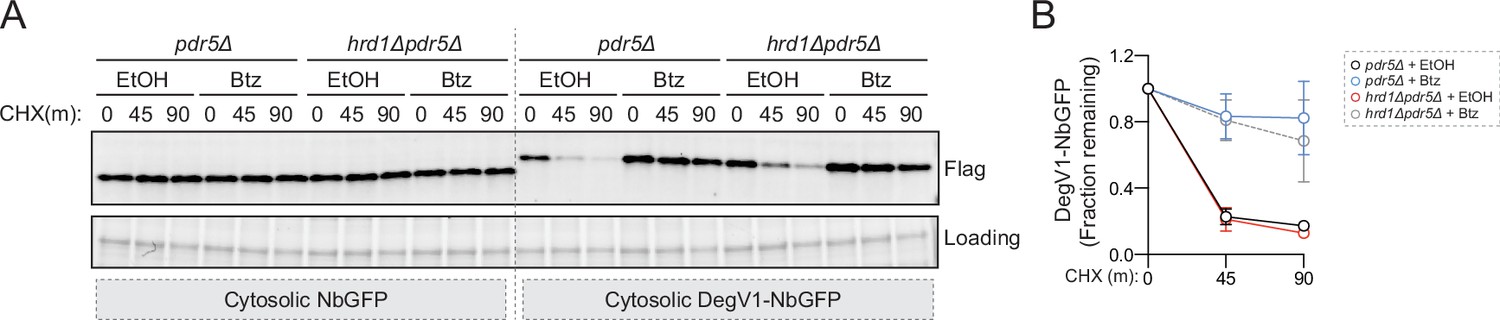
DegV1 is degraded in the cytoplasm.
(A) Degradation of a cytosolically localized anti-GFP nanobody (cytosolic NbGFP) or with DegV1 (cytosolic DegV1-NbGFP) was followed in pdr5Δ or hrd1Δpdr5Δ strains with, or without, bortezomib (Btz) using a cycloheximide (CHX) chase. Note that Hrd1 is not required for the degradation of cytosolic DegV1-NbGFP. (B) Quantification of three independent biological replicates from (A). Error bars represent the standard deviation.
-
Figure 2—figure supplement 2—source data 1
Uncropped and labeled gels for Figure 2—figure supplement 2.
- https://cdn.elifesciences.org/articles/89606/elife-89606-fig2-figsupp2-data1-v1.zip
-
Figure 2—figure supplement 2—source data 2
Raw unedited gels for Figure 2—figure supplement 2.
- https://cdn.elifesciences.org/articles/89606/elife-89606-fig2-figsupp2-data2-v1.zip
-
Figure 2—figure supplement 2—source data 3
Numerical source data for plots displayed in Figure 2—figure supplement 2.
- https://cdn.elifesciences.org/articles/89606/elife-89606-fig2-figsupp2-data3-v1.xlsx
Figure 3
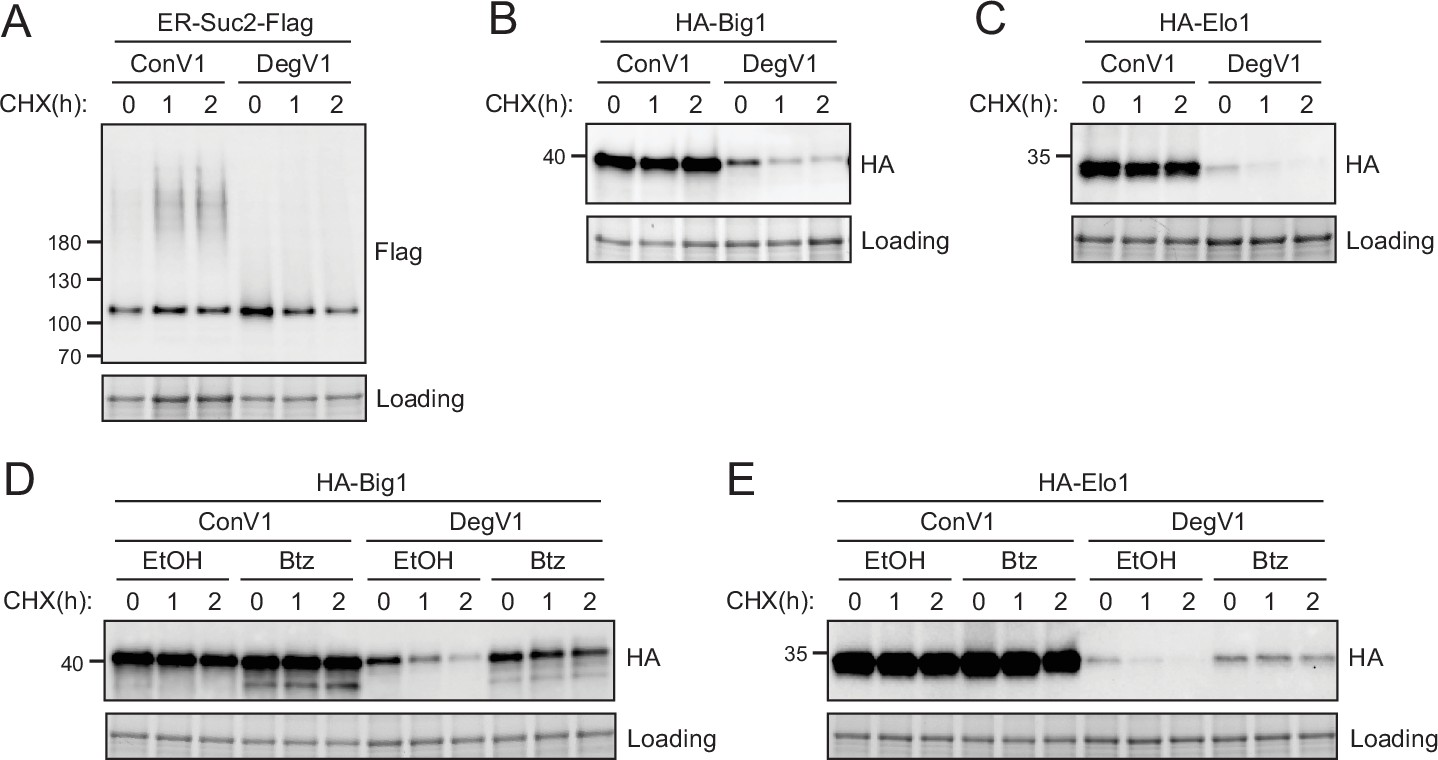
DegV1 targets endogenous endoplasmic reticulum (ER) proteins for degradation.
(A) The degradation of an endogenous secretory protein with a C-terminal Flag (ER-Suc2-Flag) containing either DegV1 or ConV1 was monitored following addition of cycloheximide (CHX), using SDS-PAGE and immunoblotting. Loading controls were visualized by stain-free technology. (B) The degradation of a single transmembrane segment ER resident protein (Big1) with the N-terminus in the ER lumen, appended with either DegV1 or ConV1, was followed as in (A). (C) The degradation of polytopic integral membrane ER resident protein (Elo1) with the N-terminus in the ER lumen, appended with either DegV1 or ConV1, was followed as in (A). (D) The degradation of Big1 with DegV1 or ConV1 was followed as in (A) but following a 2 hr pretreatment with either ethanol (EtOH) or bortezomib (Btz) in a pdr5Δ strain. (E) The degradation of Elo1 with DegV1 or ConV1 was followed as in (D). All panels in this figure are representative of at least three independent biological replicates.
-
Figure 3—source data 1
Uncropped and labeled gels for Figure 3.
- https://cdn.elifesciences.org/articles/89606/elife-89606-fig3-data1-v1.zip
-
Figure 3—source data 2
Raw unedited gels for Figure 3.
- https://cdn.elifesciences.org/articles/89606/elife-89606-fig3-data2-v1.zip
Figure 4
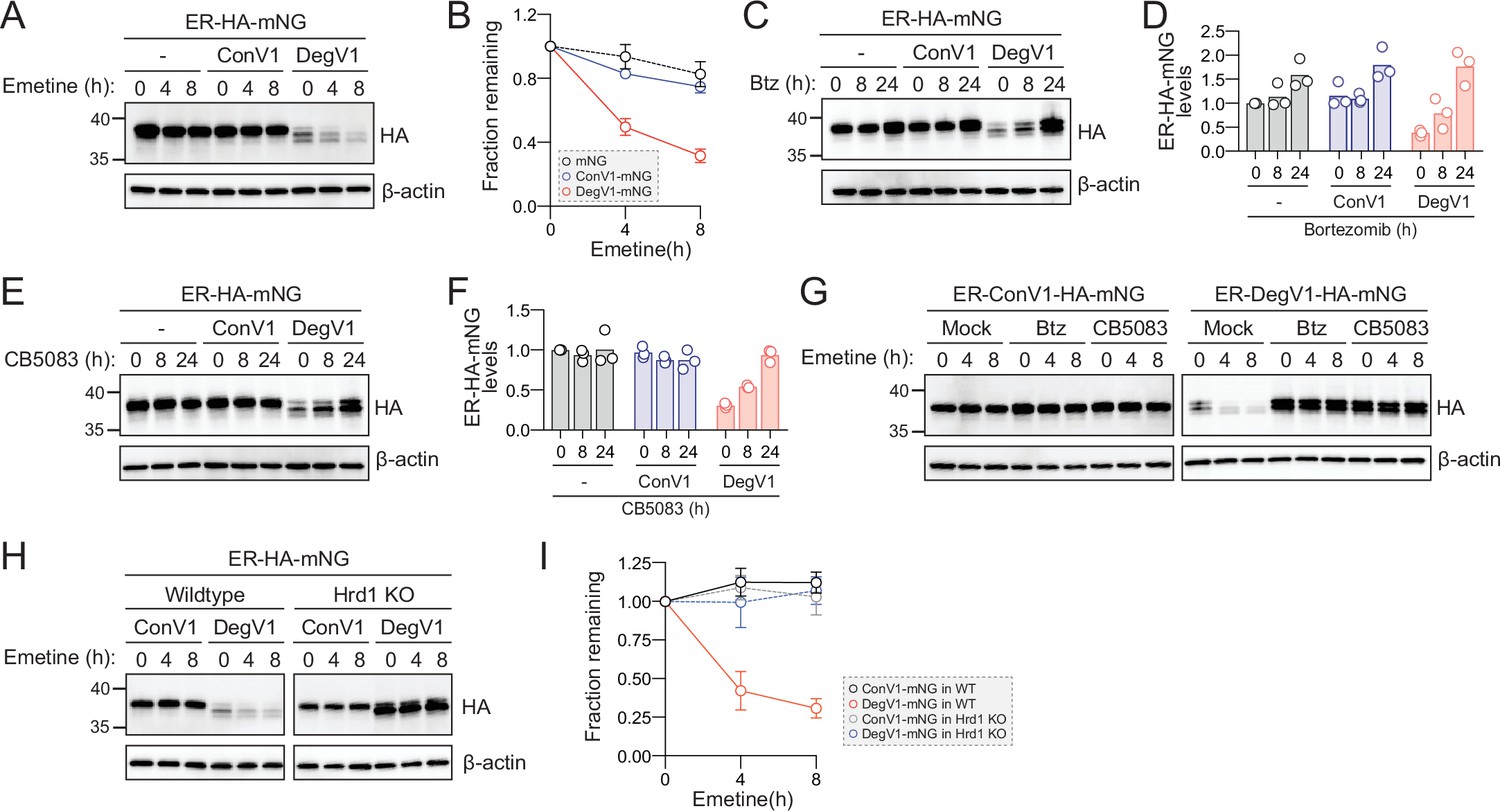
DegV1 functions as a degron in mammalian cells.
(A) Endoplasmic reticulum (ER)-targeted mNeonGreen (ER-HA-mNG) was expressed alone (-), with ConV1, or DegV1 in U-2 OS cells by transient transfection. The degradation of ER-mNG was followed by immunoblotting with anti-HA antibody after treatment with 50 μM emetine. β-Actin was used as a loading control. (B) Anti-HA band intensities from (A) were quantified and normalized to the corresponding β-actin level. (C) As in (A) but after treatment with 50 nM bortezomib (Btz) for the indicated times. (D) Quantification of (C) normalized to the control protein (ER-HA-mNG). (E) As in (A) but after treatment with 1 µM CB5083, a p97 inhibitor, for the indicated times. (F) Quantification of (E) normalized to the control protein (ER-HA-mNG). (G) ER-HA-mNG with either ConV1 (left panel) or DegV1 (right panel) were expressed in U-2 OS pretreated with either 50 nM Btz or 1 µM CB5083 for 16 hr prior to an emetine chase. (H) The degradation of ER-HA-mNG with either ConV1 or DegV1 was followed in HEK293T cells or HRD1-/- cells using an emetine chase. (I) Quantification of (H). All panels in this figure are representative of at least three independent biological replicates and the quantification is presented as the mean ± standard deviation.
-
Figure 4—source data 1
Uncropped and labeled gels for Figure 4.
- https://cdn.elifesciences.org/articles/89606/elife-89606-fig4-data1-v1.zip
-
Figure 4—source data 2
Raw unedited gels for Figure 4.
- https://cdn.elifesciences.org/articles/89606/elife-89606-fig4-data2-v1.zip
-
Figure 4—source data 3
Numerical source data for plots displayed in Figure 4.
- https://cdn.elifesciences.org/articles/89606/elife-89606-fig4-data3-v1.xlsx
Author response image 1

Tables
Key resources table
| Reagent type (species) or resource | Designation | Source or reference | Identifiers | Additional information |
|---|---|---|---|---|
| Gene (S. cerevisiae) | HRD1 | Saccharomyces Genome Database (SGD) (Wong et al., 2023) | YOL013C | |
| Gene (S. cerevisiae) | HRD3 | Saccharomyces Genome Database (SGD) (Wong et al., 2023) | YLR207W | |
| Gene (S. cerevisiae) | USA1 | Saccharomyces Genome Database (SGD) (Wong et al., 2023) | YML029W | |
| Gene (S. cerevisiae) | DER1 | Saccharomyces Genome Database (SGD) (Wong et al., 2023) | YBR201W | |
| Gene (S. cerevisiae) | YOS9 | Saccharomyces Genome Database (SGD) (Wong et al., 2023) | YDR057W | |
| Gene (S. cerevisiae) | UBC7 | Saccharomyces Genome Database (SGD) (Wong et al., 2023) | YMR022W | |
| Gene (S. cerevisiae) | DOA10 | Saccharomyces Genome Database (SGD) (Wong et al., 2023) | YIL030C | |
| Gene (S. cerevisiae) | PDR5 | Saccharomyces Genome Database (SGD) (Wong et al., 2023) | YOR153W | |
| Gene (S. cerevisiae) | SUC2 | Saccharomyces Genome Database (SGD) (Wong et al., 2023) | YIL162W | |
| Gene (S. cerevisiae) | BIG1 | Saccharomyces Genome Database (SGD) (Wong et al., 2023) | YHR101C | |
| Gene (S. cerevisiae) | ELO1 | Saccharomyces Genome Database (SGD) (Wong et al., 2023) | YJL196C | |
| Strain, strain background (S. cerevisiae) | For strains, see Supplementary file 1 | This study | NA | For strains, see Supplementary file 1 |
| Cell line (H. sapiens) | HEK293 | Shi et al., 2017 | NA | Ling Qi lab (University of Virginia) |
| Cell line (H. sapiens) | HEK293 Hrd1 Knockout | Shi et al., 2017 | NA | Ling Qi lab (University of Virginia) |
| Cell line (H. sapiens) | U-2 OS | ATCC | ATCC HTB-96 | |
| Transfected constructs (H. sapiens) | For plasmids, see Supplementary file 2 | This study | NA | For plasmids, see Supplementary file 2 |
| Transfected constructs (S. cerevisiae) | For plasmids, see Supplementary file 2 | This study | NA | For plasmids, see Supplementary file 2 |
| Recombinant DNA reagent | For plasmids, see Supplementary file 2 | This study | NA | For plasmids, see Supplementary file 2 |
| Sequence-based reagent | For primers, see Supplementary file 3 | This study | NA | For primers, see Supplementary file 3 |
| Antibody | THE DYKDDDDK Tag Antibody, mAb (mouse monoclonal) | GenScript | A00187; RRID:AB_1720813 | Used at 1:2000 dilution |
| Antibody | Anti-GFP (rabbit polyclonal) | GenScript | A01704; RRID:AB_2622199 | Used at 1:2000 dilution |
| Antibody | Anti-HA High Affinity antibody (clone 3F10) (rat monoclonal) | Roche | 11867423001; RRID:AB_390918 | Used at 1:2500 dilution |
| Antibody | THE V5 Tag Antibody, mAb, (mouse monoclonal) | GenScript | A01724; RRID:AB_2622216 | Used at 1:2500 dilution |
| Antibody | Amersham ECL Rat IgG, HRP-linked whole antibody (from goat) (polyclonal secondary) | Cytiva | NA935; RRID:AB_772207 | Used at 1:4000 dilution |
| Antibody | Amersham ECL Rabbit IgG, HRP-linked whole Ab (from donkey) (polyclonal secondary) | Cytiva | NA934; RRID:AB_772206 | Used at 1:4000 dilution |
| Antibody | Amersham ECL Mouse IgG, HRP-linked whole Ab (from sheep) (polyclonal secondary) | Cytiva | NA931; RRID:AB_772210 | Used at 1:4000 dilution |
| Antibody | Goat anti-Mouse IgG (H+L) Highly Cross-Adsorbed Secondary Antibody, Alexa Fluor Plus 800 (polyclonal secondary) | Invitrogen | A32730; RRID:AB_2633279 | Used at 1:4000 dilution |
| Antibody | Anti-β-actin | Cell Signaling | NA | |
| Peptide, recombinant protein | Phusion High-Fidelity DNA Polymerase | New England Biolabs | M0530S | |
| Peptide, recombinant protein | Zymolyase 100T | AMSBIO | 120493-1 | |
| Commercial assay, kit | ECL Select Western Blotting Detection Reagent | Cytiva | RPN2235 | |
| Commercial assay, kit | BCA assay | Thermo Fisher Scientific | 23225 | |
| Commercial assay, kit | NEBuilder HiFi DNA Assembly Master Mix | New England Biolabs | E2621 | |
| Commercial assay, kit | QIAquick PCR Purification Kit | QIAGEN | 28104 | |
| Commercial assay, kit | Invitrogen dsDNA HS assay | Invitrogen | Q32854 | |
| Chemical compound, drug | Cycloheximide | Sigma-Aldrich | 239763 | |
| Chemical Compound, drug | Emetine | Calbiochem | 324693 | |
| Chemical compound, drug | CB-5083 | Cayman Chemicals | 19311 | |
| Chemical compound, drug | Bortezomib | APExBIO | A2614 | |
| Chemical compound, drug | SYTOX Blue Nucleic Acid Stain - 5 mM Solution in DMSO | Invitrogen | S11348 | |
| Chemical compound, drug | Invitrogen UltraPure Salmon Sperm DNA Solution | Thermo Fisher Scientific | 15061 | |
| Chemical compound, drug | Fetal Bovine Serum, Regular, USDA Approved Origin | Corning | 35-010-CV | |
| Chemical compound, drug | DMEM (Dulbecco’s Modified Eagle’s Medium) | Corning | 10-013-CV | |
| Chemical compound, drug | Lipofectamine 2000 Transfection Reagent | Invitrogen | 11668019 | |
| Chemical compound, drug | DMSO | Sigma-Aldrich | D2650 | |
| Software, algorithm | ImageJ | Schneider et al., 2012 | RRID:SCR_003070 | |
| Software, algorithm | ImageLab version 6.1 | Bio-Rad | https://www.bio-rad.com/en-us/product/image-lab-software?ID=KRE6P5E8Z | |
| Software, algorithm | FlowJo version 10.7.1 | Becton, Dickinson and Company | https://www.flowjo.com/solutions/flowjo | |
| Software, algorithm | GraphPad Prism | Dotmatics | https://www.graphpad.com/ | |
| Software, algorithm | Illustrator | Adobe | https://www.adobe.com/products/illustrator.html |
Additional files
-
Supplementary file 1
Yeast strains used in this study.
- https://cdn.elifesciences.org/articles/89606/elife-89606-supp1-v1.xlsx
-
Supplementary file 2
Plasmids used in this study.
- https://cdn.elifesciences.org/articles/89606/elife-89606-supp2-v1.xlsx
-
Supplementary file 3
Primers used in this study.
- https://cdn.elifesciences.org/articles/89606/elife-89606-supp3-v1.xlsx
-
MDAR checklist
- https://cdn.elifesciences.org/articles/89606/elife-89606-mdarchecklist1-v1.docx
-
Source data 1
Sequencing reads and translations.
Illumina sequencing reads were trimmed, translated into amino acids, and analyzed as described in the Methods section.
- https://cdn.elifesciences.org/articles/89606/elife-89606-data1-v1.xlsx
Download links
A two-part list of links to download the article, or parts of the article, in various formats.
Downloads (link to download the article as PDF)
Open citations (links to open the citations from this article in various online reference manager services)
Cite this article (links to download the citations from this article in formats compatible with various reference manager tools)
Identification of ERAD-dependent degrons for the endoplasmic reticulum lumen
eLife 12:RP89606.
https://doi.org/10.7554/eLife.89606.3


