Mechanically stimulated osteocytes maintain tumor dormancy in bone metastasis of non-small cell lung cancer by releasing small extracellular vesicles
- General Practice Centre, The Seventh Affiliated Hospital, Southern Medical University, China
- Guangdong Provincial Key Laboratory of Bone and Joint Degeneration Diseases, Department of Cell Biology, School of Basic Medical Sciences, Southern Medical University, China
- Academy of Orthopedics, Guangdong Province, Guangdong Provincial Key Laboratory of Bone and Joint Degeneration Diseases, The Third Affiliated Hospital of Southern Medical University, China
- Department of Neurosurgery, Institute of Brain Diseases, Nanfang Hospital of Southern Medical University, China
Figures
Figure 1 with 1 supplement

Osteocytes inhibited the proliferation of non-small cell lung cancer (NSCLC) cells.
(a) Representative immunohistochemical staining and quantification of Ki-67 in bone metastasis site of patients with NSCLC. The dashed line indicates the boundary between bone and tumor. Scale bar: 50 µm. Blue arrows, low expression or negative of Ki-67. Red arrows, high expression of Ki-67. Tumor cells ≤50 μm from bone tissue were defined as adjacent cells, and those >50 μm from bone tissue were defined as surrounding cells. n=6; Student’s two-sided unpaired t test. (b) An intraosseous model of bone metastasis was used via direct implantation of NSCLC cells A549 into tibia of nude mice. Three weeks after implantation, mice were sacrificed. Representative immunohistochemical staining and quantification of Ki-67 in tibia of tumor-bearing nude mice. The dashed line indicates the boundary between bone and tumor. Scale bar: 50 µm. Blue arrows, low expression or negative of Ki-67. Red arrows, high expression of Ki-67. Tumor cells ≤50 μm from bone tissue were defined as adjacent cells, and those >50 μm from bone tissue were defined as surrounding cells. n=6; Student’s two-sided unpaired t test. (c) Schematic diagram of co-culture. (d) Cell Counting Kit-8 (CCK-8) assays were performed to evaluate the effects of MLO-Y4 cells, MC3T3-E1 or NCM460 cells on the proliferation of A549 cells in the co-culture system. n=6; one-way analysis of variance with Turkey’s multiple comparisons test. (e) EdU flow cytometry were performed to evaluate the effect of MLO-Y4 cells on the proliferation of A549 cells in the co-culture system. (f) CCK-8 assays were performed to evaluate the effect of MLO-Y4 cells on the proliferation of MC3T3-E1 cells in the co-culture system. n=6; Student’s two-sided unpaired t test. Error bars represent Mean ± SD. No significance (ns) p>0.05, *p<0.05, **p<0.01, ***p<0.001, ****p<0.0001.
-
Figure 1—source data 1
Original table sources for quantification of Figure 1 plots.
- https://cdn.elifesciences.org/articles/89613/elife-89613-fig1-data1-v1.zip
Figure 1—figure supplement 1
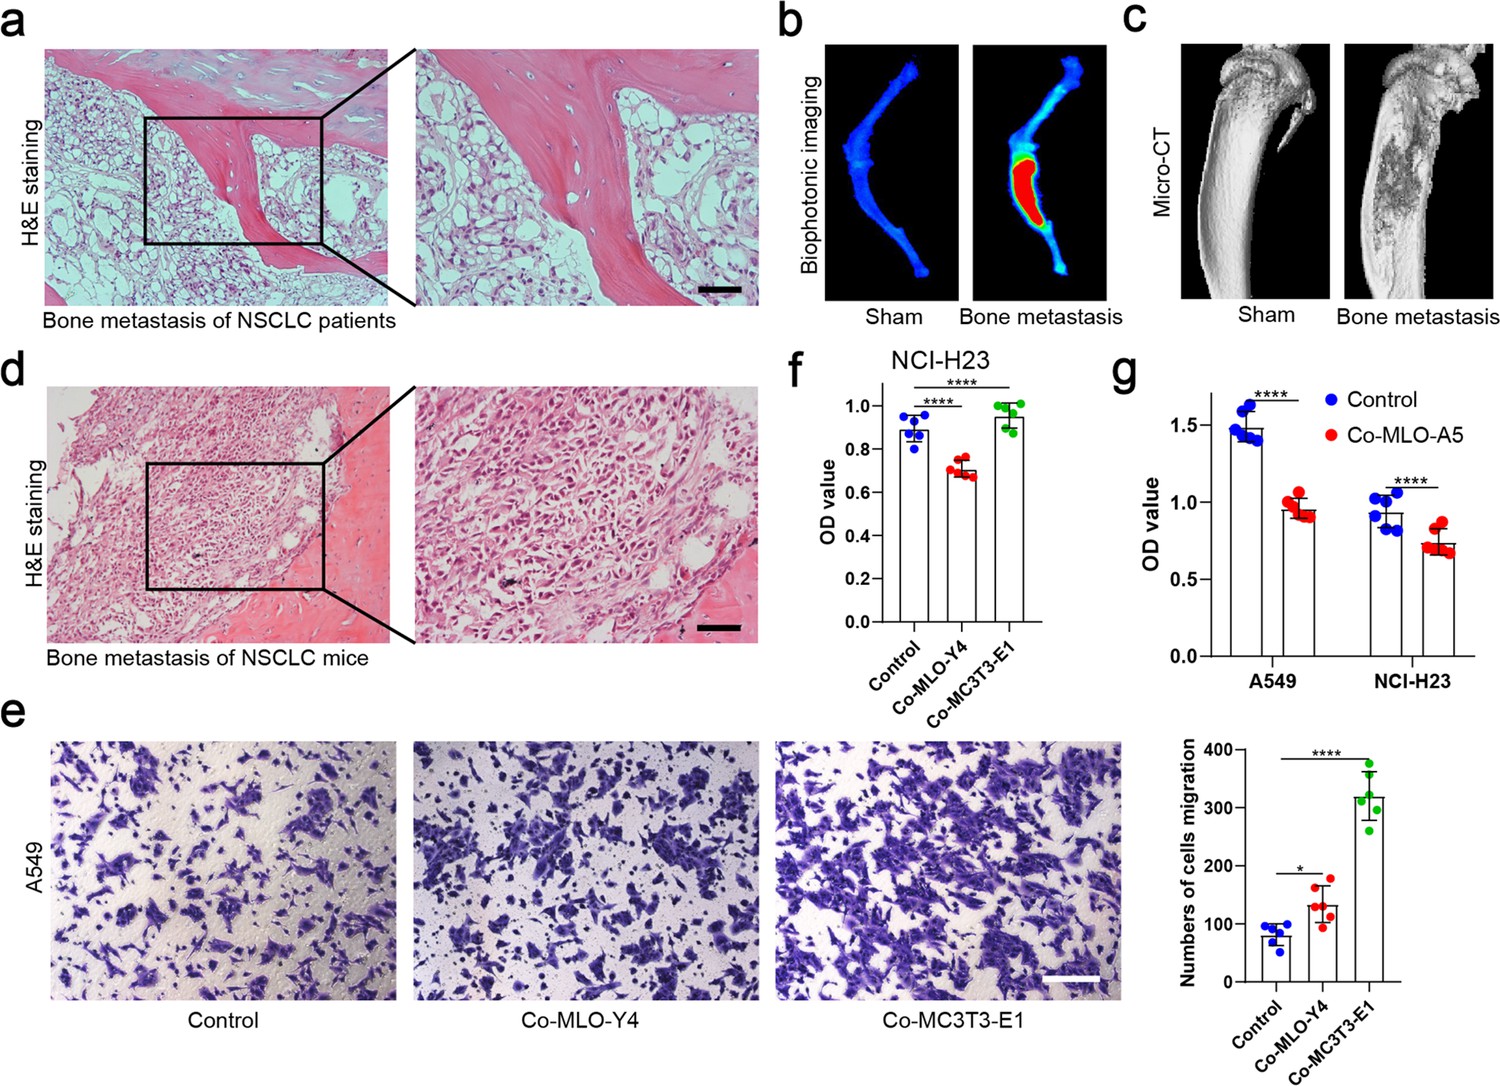
Histological identification of patients and mice with bone metastases and effects of MLO-Y4 and MC3T3-E1 on proliferation and migration of non-small cell lung cancer (NSCLC) cells.
(a) The representative images of hematoxylin and eosin (H&E) staining in bone metastatic sites of patients with NSCLC. Scale bar: 50 µm. (b) An intraosseous model of bone metastasis was used via direct implantation of A549 cells expressing green fluorescent protein (GFP) into tibia of mouse. Representative biophotonic images of NSCLC cells in hindlimb bones of mice. (c) Representative micro-computed tomography (micro-CT) imaging of the tibia in mice with or without bone metastasis. (d) The representative images of H&E staining of bone metastasis in tibia of mice. Scale bar: 50 µm. (e) Transwell assays were performed to evaluate the effects of MLO-Y4 cells or MC3T3-E1 cells on the migration of A549 cells in the co-culture system. Scale bar: 100 µm. n=6, one-way analysis of variance with Turkey’s multiple comparisons test. (f) Cell Counting Kit-8 (CCK-8) assays were performed to evaluate the effects of MLO-Y4 cells or MC3T3-E1 cells on the proliferation of NCI-H23 cells in the co-culture system. n=6, one-way analysis of variance with Turkey’s multiple comparisons test. (g) CCK-8 assays were performed to evaluate the effects of MLO-A5 cells on the proliferation of A549 and NCI-H23 cells in the co-culture system. n=6, Student’s two-sided unpaired t test. Error bars represent Mean ± SD. No significance (ns) p>0.05, *p<0.05, **p<0.01, ***p<0.001, ****p<0.0001.
-
Figure 1—figure supplement 1—source data 1
Original table sources for quantification of Figure 1—figure supplement 1 plots.
- https://cdn.elifesciences.org/articles/89613/elife-89613-fig1-figsupp1-data1-v1.zip
Figure 2 with 1 supplement
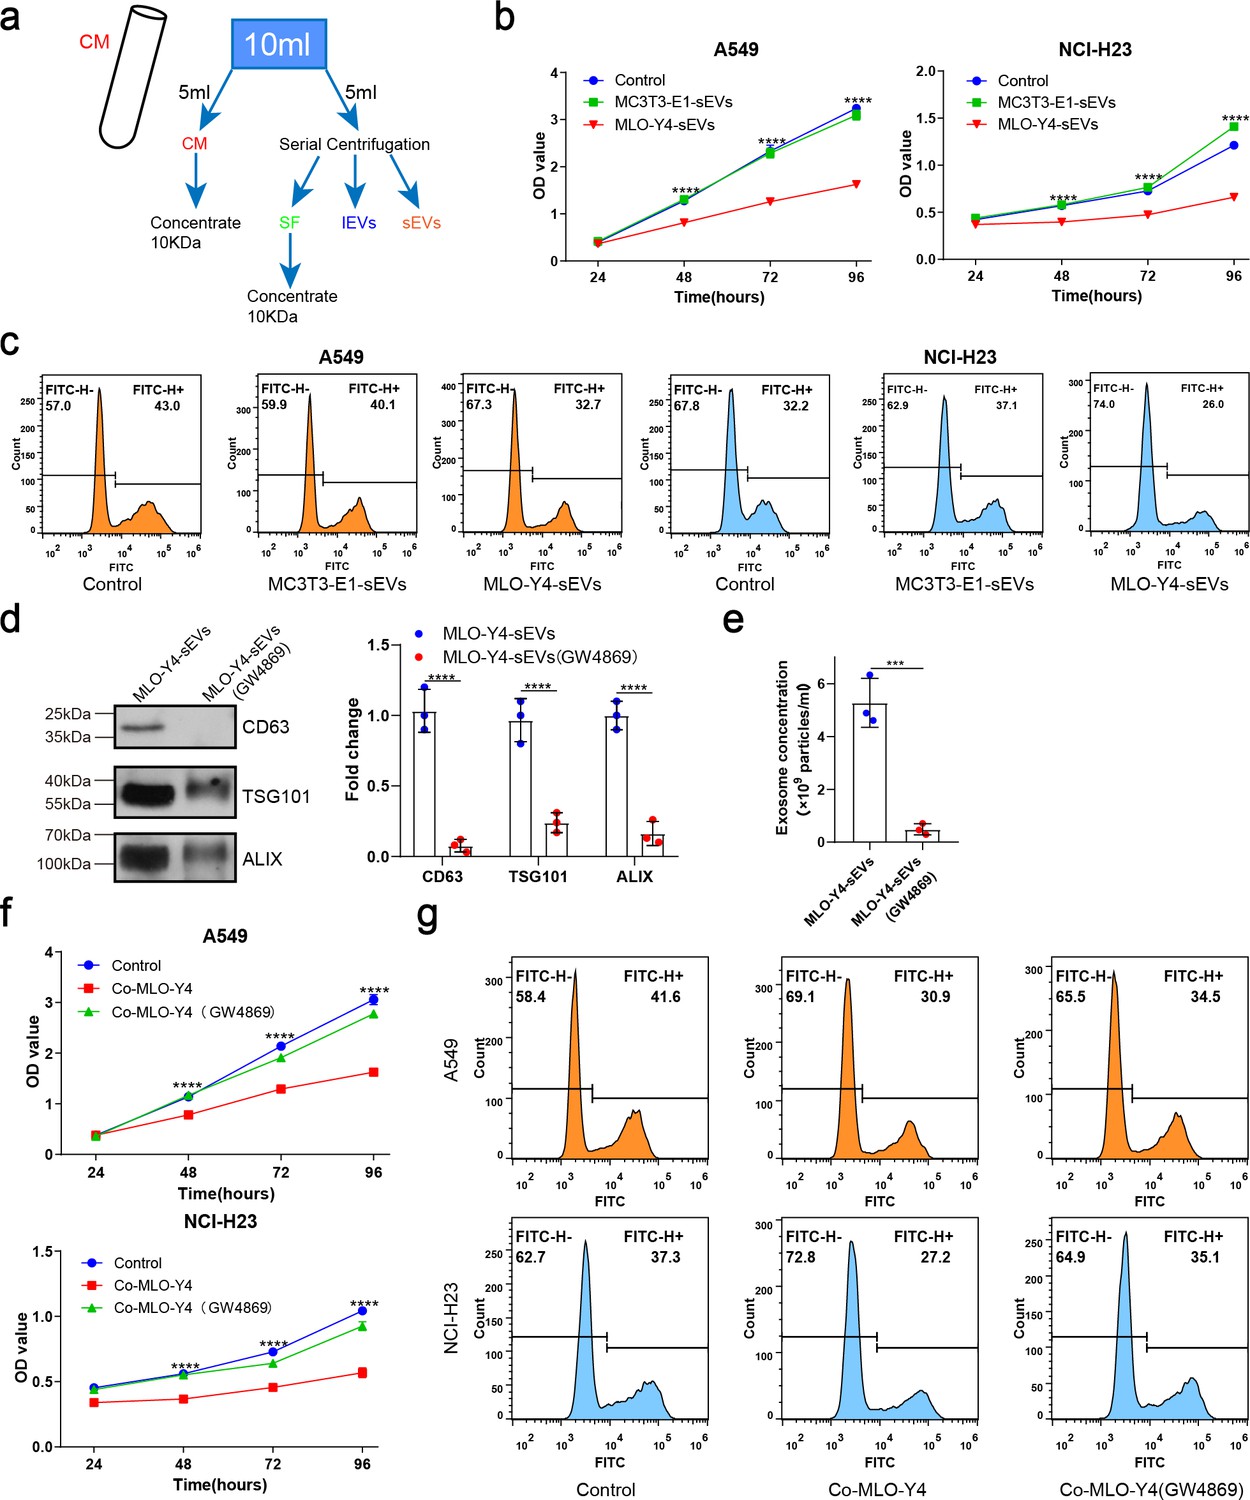
Osteocyte small extracellular vesicles (sEVs) inhibited the proliferation of non-small cell lung cancer (NSCLC) cells.
(a) Schematic diagram of serial centrifugation and concentration of culture medium. Conditioned medium (CM) was separated into soluble factor (SF), large extracellular vesicles (lEVs), and sEVs fractions, by serial ultracentrifugation and ultrafiltration. (b) Cell Counting Kit-8 (CCK-8) assays were performed to evaluate the effect of sEVs on the proliferation of NSCLC cells. n=4, two-way analysis of variance with Sidak’s multiple comparisons test. (c) EdU flow cytometry were performed to evaluate the effect of sEVs on the proliferation of NSCLC cells. (d) Western blot analysis of the typical sEVs markers CD63, TSG101, and Alix. n=3; Student’s two-sided unpaired t test. (e) The concentration of the sEVs were detected by NanoSight analysis. n=3; Student’s two-sided unpaired t test. (f) CCK-8 assays were performed to evaluate the rescue effect of GW4869 on the proliferation of NSCLC cells co-cultured with MLO-Y4 cells. n=4, two-way analysis of variance with Sidak’s multiple comparisons test. (g) EdU flow cytometry were performed to evaluate the rescue effect of GW4869 on the proliferation of NSCLC cells co-cultured with MLO-Y4 cells. Error bars represent Mean ± SD. No significance (ns) p>0.05, *p<0.05, **p<0.01, ***p<0.001, ****p<0.0001.
-
Figure 2—source data 1
Original table sources for quantification of Figure 2 plots.
- https://cdn.elifesciences.org/articles/89613/elife-89613-fig2-data1-v1.zip
-
Figure 2—source data 2
Original western blot images for Figure 2d.
- https://cdn.elifesciences.org/articles/89613/elife-89613-fig2-data2-v1.zip
-
Figure 2—source data 3
Original western blot images for Figure 2d with highlighted bands and sample labels.
- https://cdn.elifesciences.org/articles/89613/elife-89613-fig2-data3-v1.zip
Figure 2—figure supplement 1
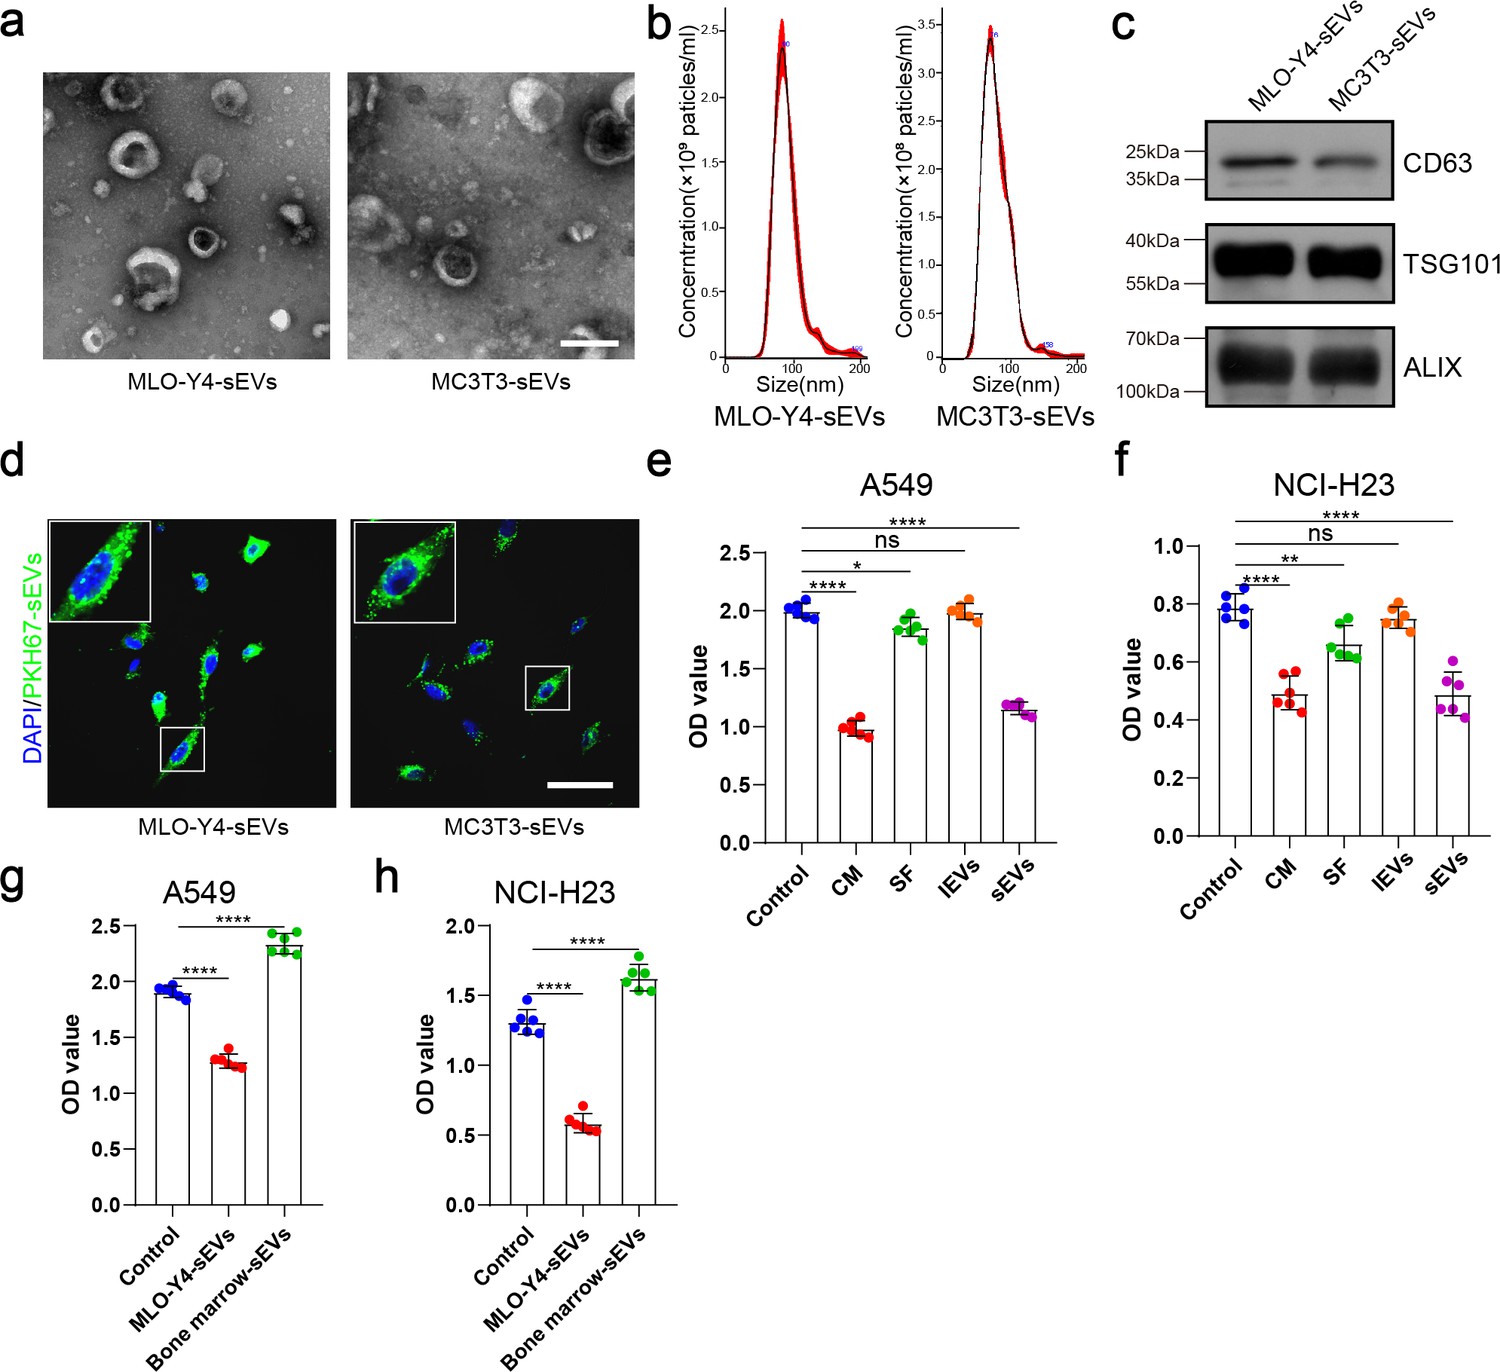
Identification of MLO-Y4-sEVs and MC3T3-E1-sEVs and their effects on the proliferation ability of non-small cell lung cancer (NSCLC) cells.
(a) Representative transmission electron microscopy (TEM) images of small extracellular vesicles (sEVs) extracted from conditioned medium. Scale bar: 100 nm. (b) NanoSight particle analysis displays the size distribution of the sEVs. (c) Western blot analysis of the typical sEVs markers (CD9, Alix, and TSG101) of the sEVs isolated from the culture medium. (d) A549 cells were incubated with PKH67-labeled sEVs and subjected to immunofluorescence of PKH-67-labeled sEVs (green) and 4',6-diamidino-2-phenylindole (DAPI) (blue) for nuclei. Scale bar: 50 µm. (e, f) Cell Counting Kit-8 (CCK-8) assays were performed to evaluate the effects of the components of the MLO-Y4 cells culture medium on the proliferation of NSCLC cells. n=6, one-way analysis of variance with Turkey’s multiple comparisons test. (g, h) CCK-8 assays were performed to evaluate the effect of MLO-Y4-sEVs or bone marrow sEVs on the proliferation of NSCLC cells. n=6, one-way analysis of variance with Turkey’s multiple comparisons test. Error bars represent Mean ± SD. No significance (ns) p>0.05, *p<0.05, **p<0.01, ***p<0.001, ****p<0.0001.
-
Figure 2—figure supplement 1—source data 1
Original table sources for quantification of Figure 2—figure supplement 1 plots.
- https://cdn.elifesciences.org/articles/89613/elife-89613-fig2-figsupp1-data1-v1.zip
-
Figure 2—figure supplement 1—source data 2
Original western blot images for Figure 2—figure supplement 1c.
- https://cdn.elifesciences.org/articles/89613/elife-89613-fig2-figsupp1-data2-v1.zip
-
Figure 2—figure supplement 1—source data 3
Original western blot images for Figure 2—figure supplement 1c with highlighted bands and sample labels.
- https://cdn.elifesciences.org/articles/89613/elife-89613-fig2-figsupp1-data3-v1.zip
Figure 3 with 1 supplement
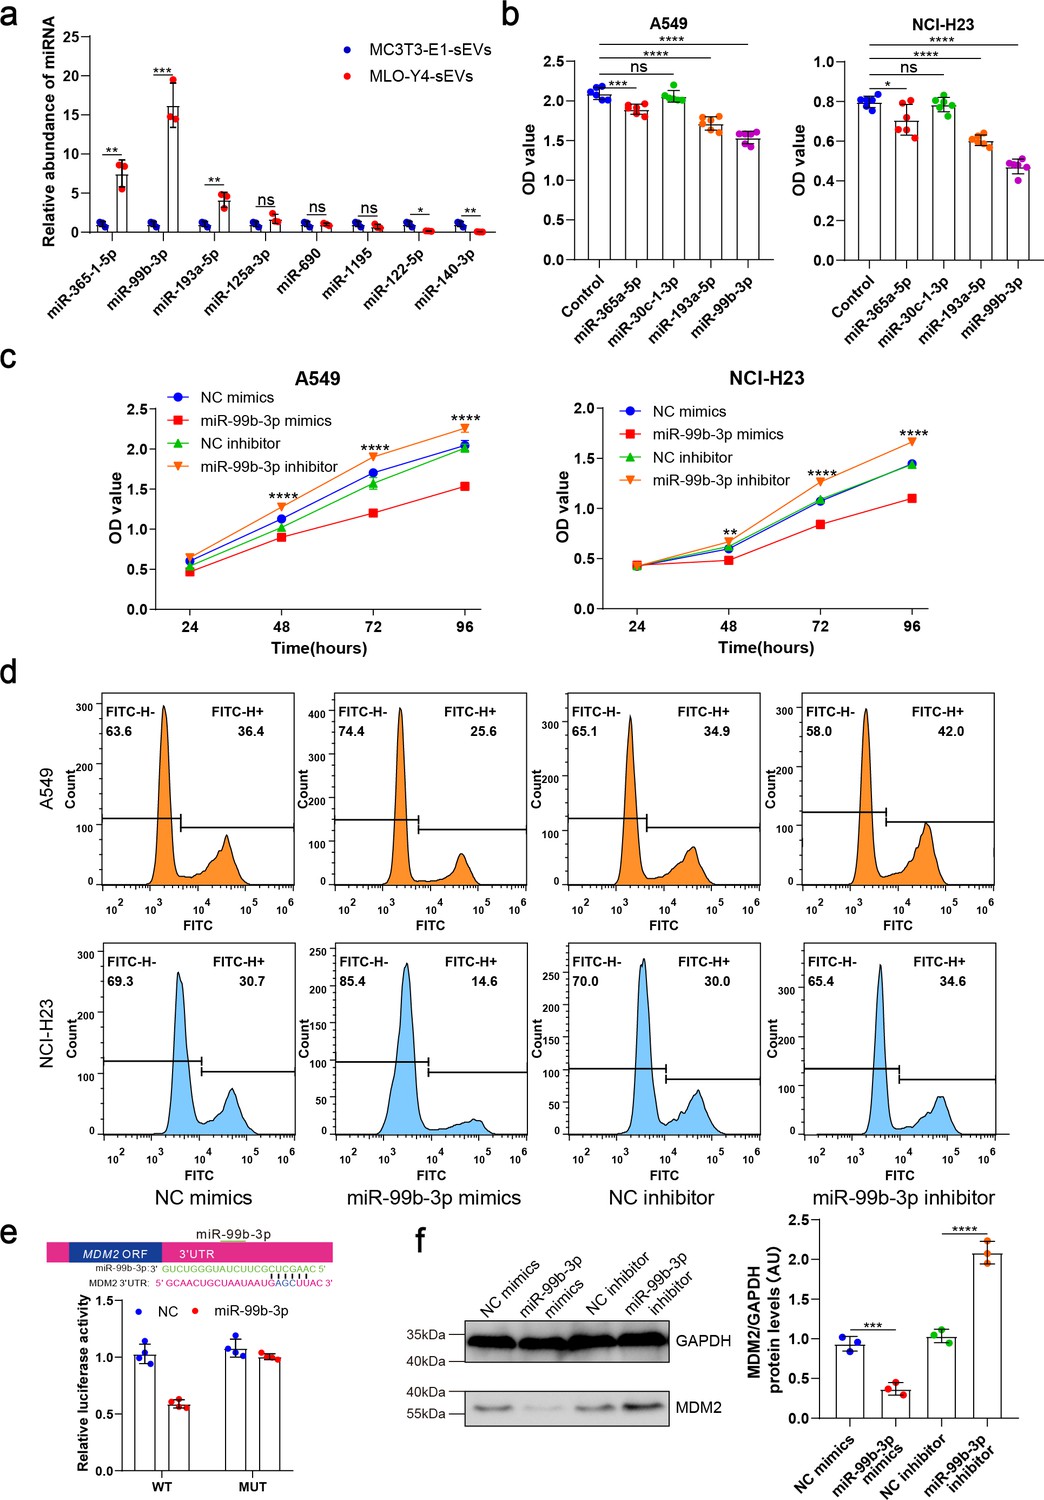
Osteocyte small extracellular vesicles (sEVs) miR-99b-3p inhibited the proliferation of non-small cell lung cancer (NSCLC) cells by directly targeting murine double minute 2 (MDM2).
(a) Comparison of relative miR-365-1-5p, miR-99b-3p, miR-193a-5p, miR-125a-3p, miR-690, miR-1195, miR-122-5p, miR-140-3p content between MLO-Y4-sEVs and MC3T3-E1-sEVs by real-time quantitative polymerase chain reaction (qRT-PCR). n=3, Student’s two-sided unpaired t test. (b) NSCLC cells were transfected with miR-365a-5p, miR-30c-1-3p, miR-193a-5p, miR-99b-3p mimics, or NC (negative control) in Dulbecco’s modified eagle medium (DMEM). 48 hr later, Cell Counting Kit-8 (CCK-8) assays were performed. n=6, one-way analysis of variance with Turkey’s multiple comparisons test. (c, d) NSCLC cells were transfected with miR-99b-3p mimics, NC mimics, miR-99b-3p inhibitor, and NC inhibitor. 48 hr later, EdU flow cytometry were performed. CCK-8 assays were performed at different points in time after transfection. n=6, two-way analysis of variance with Sidak’s multiple comparisons test. (e) Schematic diagram of putative miR-99b-3p binding sites in the MDM2 3′-UTR. Green letters denote mutation sites. Relative luciferase activities of wild-type (WT) or mutant (MUT) MDM2 3′-UTRs were determined in A549 cells, which were co-transfected with the miR-99b-3p mimics or negative control. Luciferase activity was normalized using Renilla. n=4, Student’s two-sided unpaired t test. (f) MDM2 protein in A549 cells was analyzed by western blot 72 hr after transfection. n=3; one-way analysis of variance with Turkey’s multiple comparisons test. Error bars represent Mean ± SD. No significance (ns) p>0.05, *p<0.05, **p<0.01, ***p<0.001, ****p<0.0001.
-
Figure 3—source data 1
Original table sources for quantification of Figure 3 plots.
- https://cdn.elifesciences.org/articles/89613/elife-89613-fig3-data1-v1.zip
-
Figure 3—source data 2
Original western blot images for Figure 3f.
- https://cdn.elifesciences.org/articles/89613/elife-89613-fig3-data2-v1.zip
-
Figure 3—source data 3
Original western blot images for Figure 3f with highlighted bands and sample labels.
- https://cdn.elifesciences.org/articles/89613/elife-89613-fig3-data3-v1.zip
Figure 3—figure supplement 1
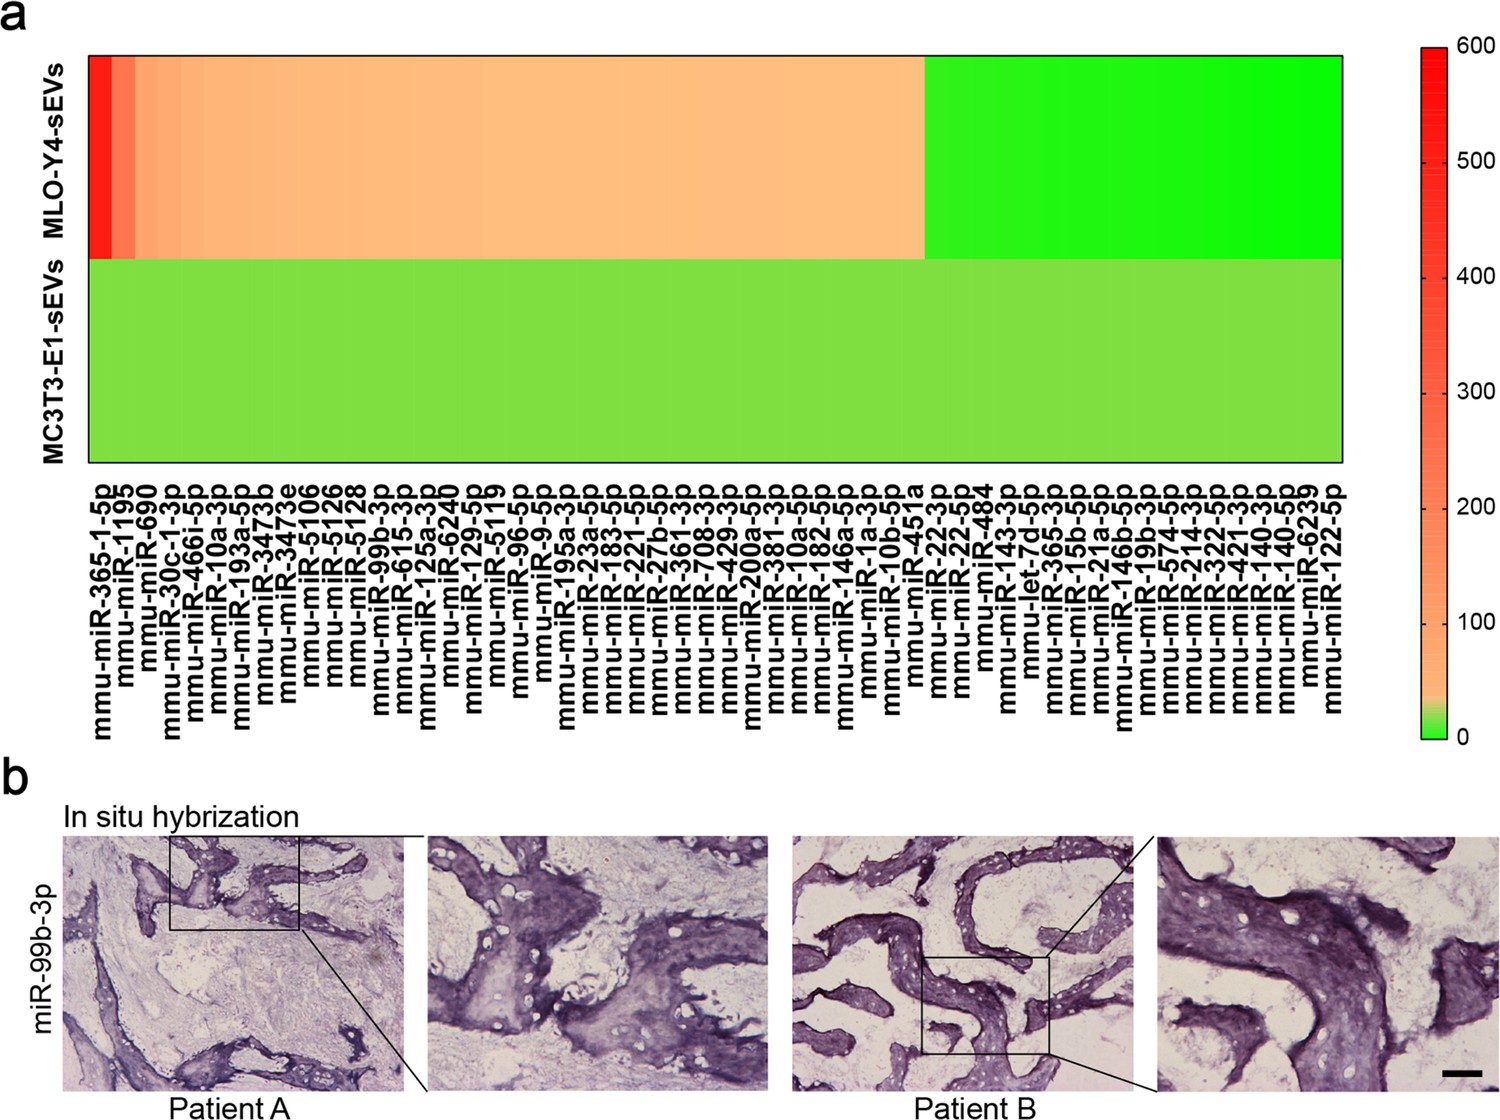
The micro-RNA (miRNA) profiles of MLO-Y4-sEVs and MC3T3-E1-sEVs and distribution of miR-99b-3p in bone metastatic tissues of non-small cell lung cancer (NSCLC) patients.
(a) The heatmap shows differentially expressed miRNAs in small extracellular vesicles (sEVs) at least 1.5-fold difference between MLO-Y4-sEVs and MC3T3-E1-sEVs identified by microarray. (b) Representative in situ hybridization images showing the expression of miR-99b-3p in bone metastatic sites of patients with NSCLC. Scale bar: 50 µm.
-
Figure 3—figure supplement 1—source data 1
Original table sources for quantification of Figure 3—figure supplement 1 plots.
- https://cdn.elifesciences.org/articles/89613/elife-89613-fig3-figsupp1-data1-v1.zip
Figure 4 with 1 supplement
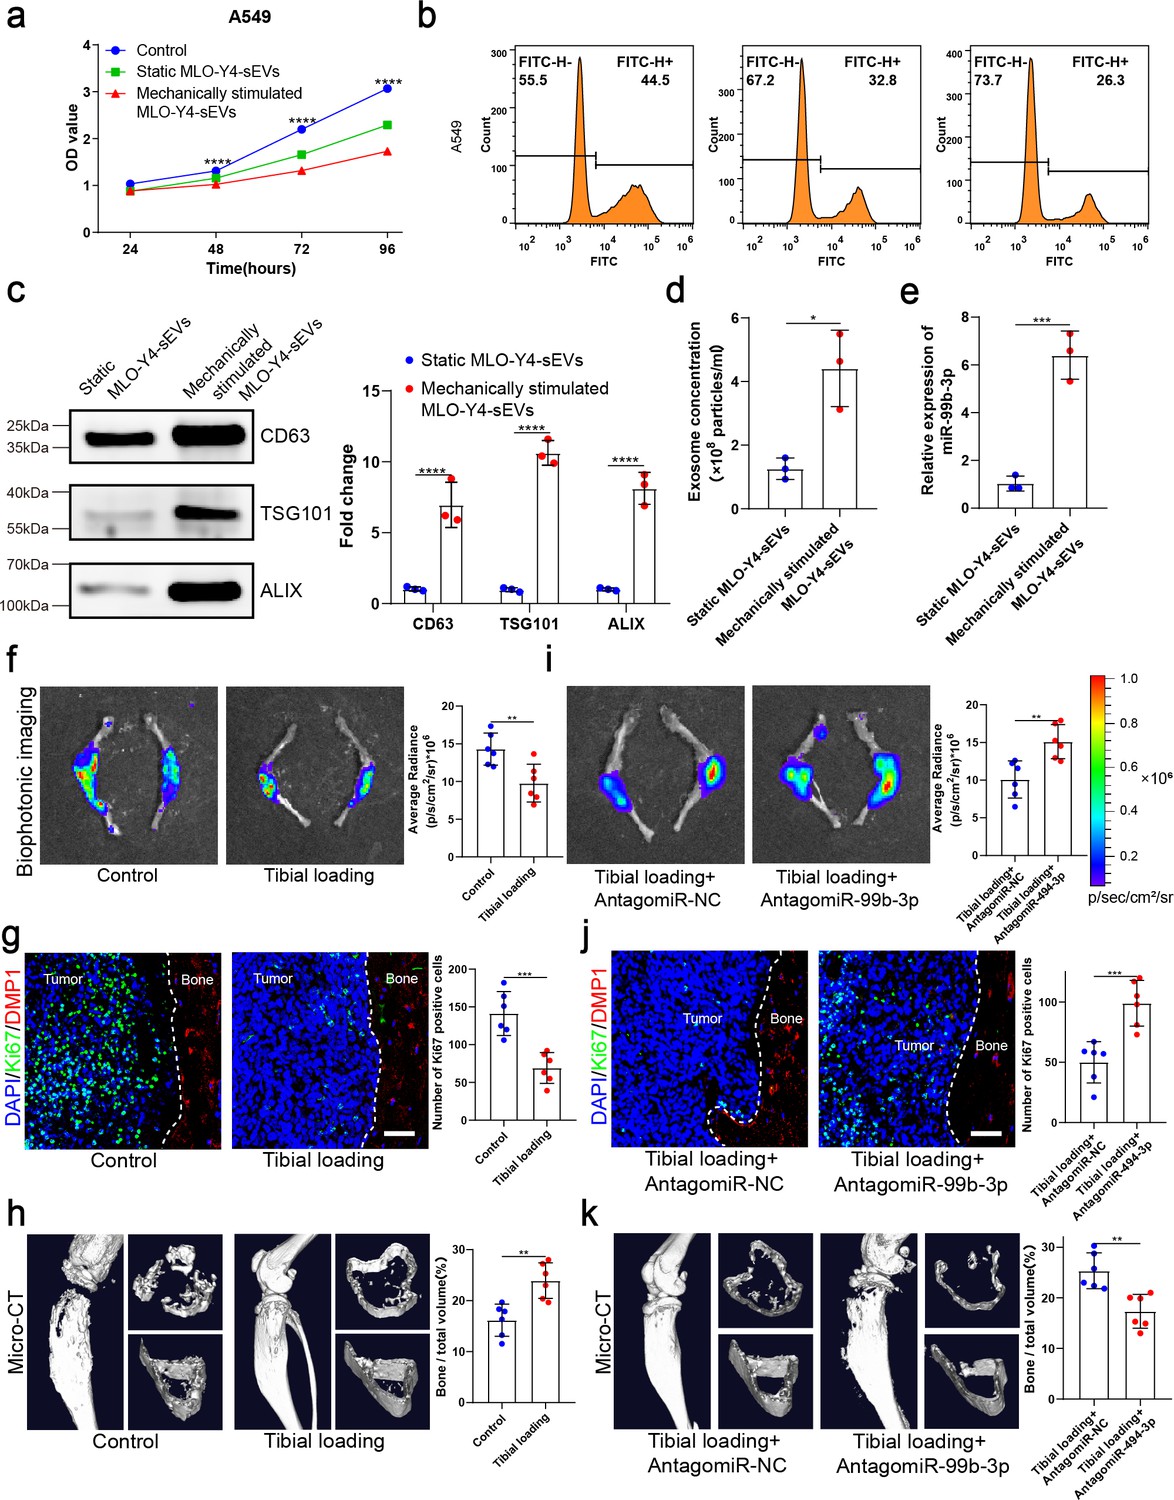
Mechanical stimulation increased the release of small extracellular vesicles (sEVs) from osteocytes and enhanced inhibitory effect of osteocytes on the proliferation of non-small cell lung cancer (NSCLC) cells.
(a) MLO-Y4 cells were mechanically stimulated by stretching at 12% strain at a 1.25 Hz frequency for 12 hr, and sEVs were extracted from the conditioned medium. Cell Counting Kit-8 (CCK-8) assays were performed to evaluate the effect of sEVs on the proliferation of A549 cells. n=4, two-way analysis of variance with Sidak’s multiple comparisons test. (b) EdU flow cytometry were performed to evaluate the effect of sEVs on the proliferation of A549 cells. (c) Western blot analysis of the typical sEV markers CD63, TSG101, and Alix. n=3, Student’s two-sided unpaired t test. (d) Concentration of sEVs was detected by NanoSight analysis. n=3, Student’s two-sided unpaired t test. (e) Mechanical loading was applied to the tibiae with bone metastasis via direct implantation of GFP-LLC into tibia of mouse. Real-time quantitative polymerase chain reaction (qRT-PCR) identification of miR-99b-3p in sEVs. n=3, Student’s two-sided unpaired t test. An intraosseous model of bone metastasis was used via direct implantation of murine Lewis lung carcinoma (LLC) cells expressing green fluorescent protein (GFP) into tibia of mouse. Mice were subsequently randomized into tumor-bearing only (control), tibial loading, tibial loading+AntagomiR-NC, and tibial loading+AntagomiR-99b-3p groups. Four weeks later, mice were sacrificed. (f, i) Representative biophotonic images and quantification of fluorescence signal in hindlimb bones of mice. n=6, Student’s two-sided unpaired t test. (g, j) Representative immunofluorescence staining images of Ki-67 (green), DMP1 (red), and 4',6-diamidino-2-phenylindole (DAPI) (blue) in the tibia of mice with bone metastases and quantification of the number of Ki-67-positive cells in the images. The dashed line indicates the boundary between bone and tumor. Scale bars: 50 µm. n=6, Student’s two-sided unpaired t test. (h, k) Representative micro-computed tomography (micro-CT) imaging and quantitation of the tibia (bone/total volume) in mice. n=6, Student’s two-sided unpaired t test. Error bars represent Mean ± SD. No significance (ns) p>0.05, *p<0.05, **p<0.01, ***p<0.001, ****p<0.0001.
-
Figure 4—source data 1
Original table sources for quantification of Figure 4 plots.
- https://cdn.elifesciences.org/articles/89613/elife-89613-fig4-data1-v1.zip
-
Figure 4—source data 2
Original western blot images for Figure 4c.
- https://cdn.elifesciences.org/articles/89613/elife-89613-fig4-data2-v1.zip
-
Figure 4—source data 3
Original western blot images for Figure 4c with highlighted bands and sample labels.
- https://cdn.elifesciences.org/articles/89613/elife-89613-fig4-data3-v1.zip
Figure 4—figure supplement 1
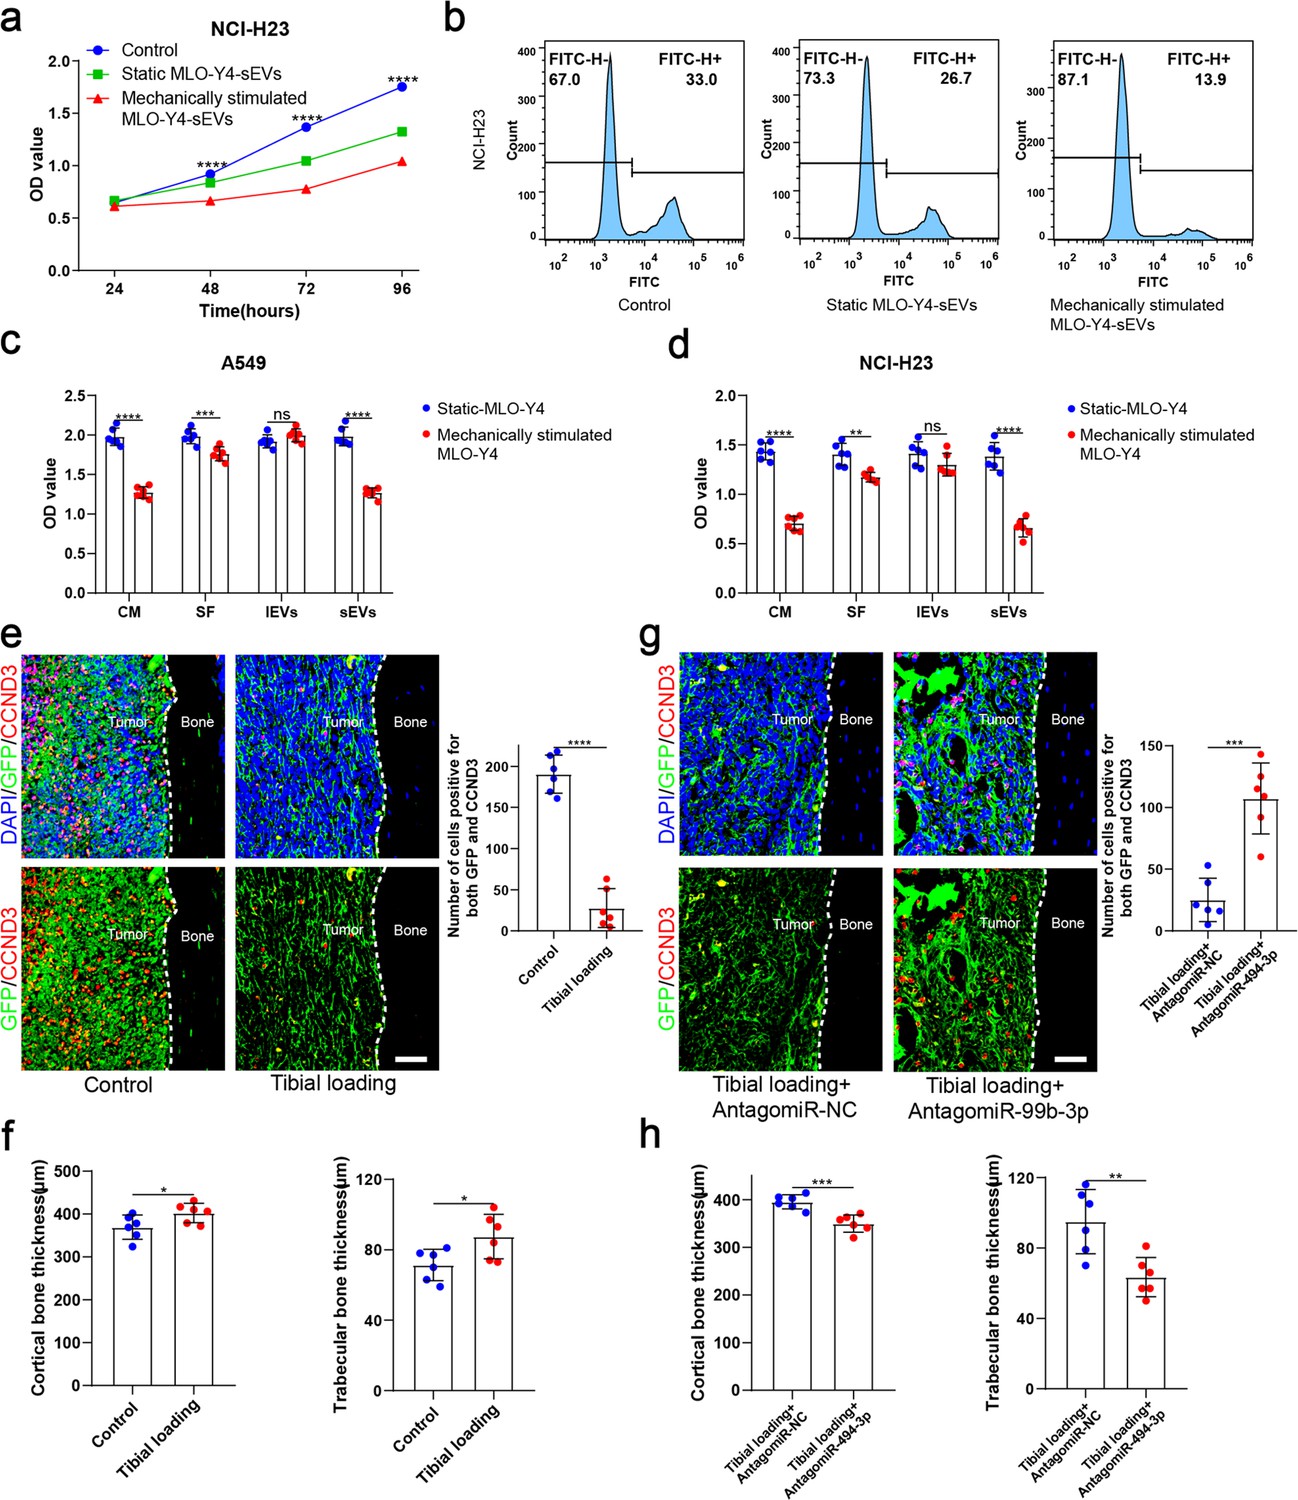
Mechanical loading increased the release of small extracellular vesicles (sEVs) from osteocytes and enhanced inhibitory effect of osteocytes on the proliferation of non-small cell lung cancer (NSCLC) cells.
(a) MLO-Y4 cells were mechanically stimulated by stretching at 12% strain at a 1.25 Hz frequency for 12 hr, and sEVs were extracted from the conditioned medium. Cell Counting Kit-8 (CCK-8) assays were performed to evaluate the effect of sEVs on the proliferation of NCI-H23 cells. n=4, two-way analysis of variance with multiple comparisons test. (b) EdU flow cytometry were performed to evaluate the effect of sEVs on the proliferation of NCI-H23 cells. (c, d) CCK-8 assays were performed to evaluate the effects of the components of the static or mechanically stimulated MLO-Y4 cells culture medium on the proliferation of NSCLC cells. n=6; Student’s two-sided unpaired t test. (e, g) Representative immunofluorescence staining images of GFP (green), CCND3 (red), and 4',6-diamidino-2-phenylindole (DAPI) (blue) in the tibia of mice with bone metastases and quantification of the GFP and CCND3-positive cells. The dashed line indicates the boundary between bone and tumor. Scale bars: 50 µm. n=6, Student’s two-sided unpaired t test. (f, h) Representative micro-computed tomography (micro-CT) imaging and quantitation of the tibia (cortical bone thickness, trabecular bone thickness) in mice. n=6, Student’s two-sided unpaired t test. Error bars represent Mean ± SD. No significance (ns) p>0.05, *p<0.05, **p<0.01, ***p<0.001, ****p<0.0001.
-
Figure 4—figure supplement 1—source data 1
Original table sources for quantification of Figure 4—figure supplement 1 plots.
- https://cdn.elifesciences.org/articles/89613/elife-89613-fig4-figsupp1-data1-v1.zip
Figure 5 with 1 supplement
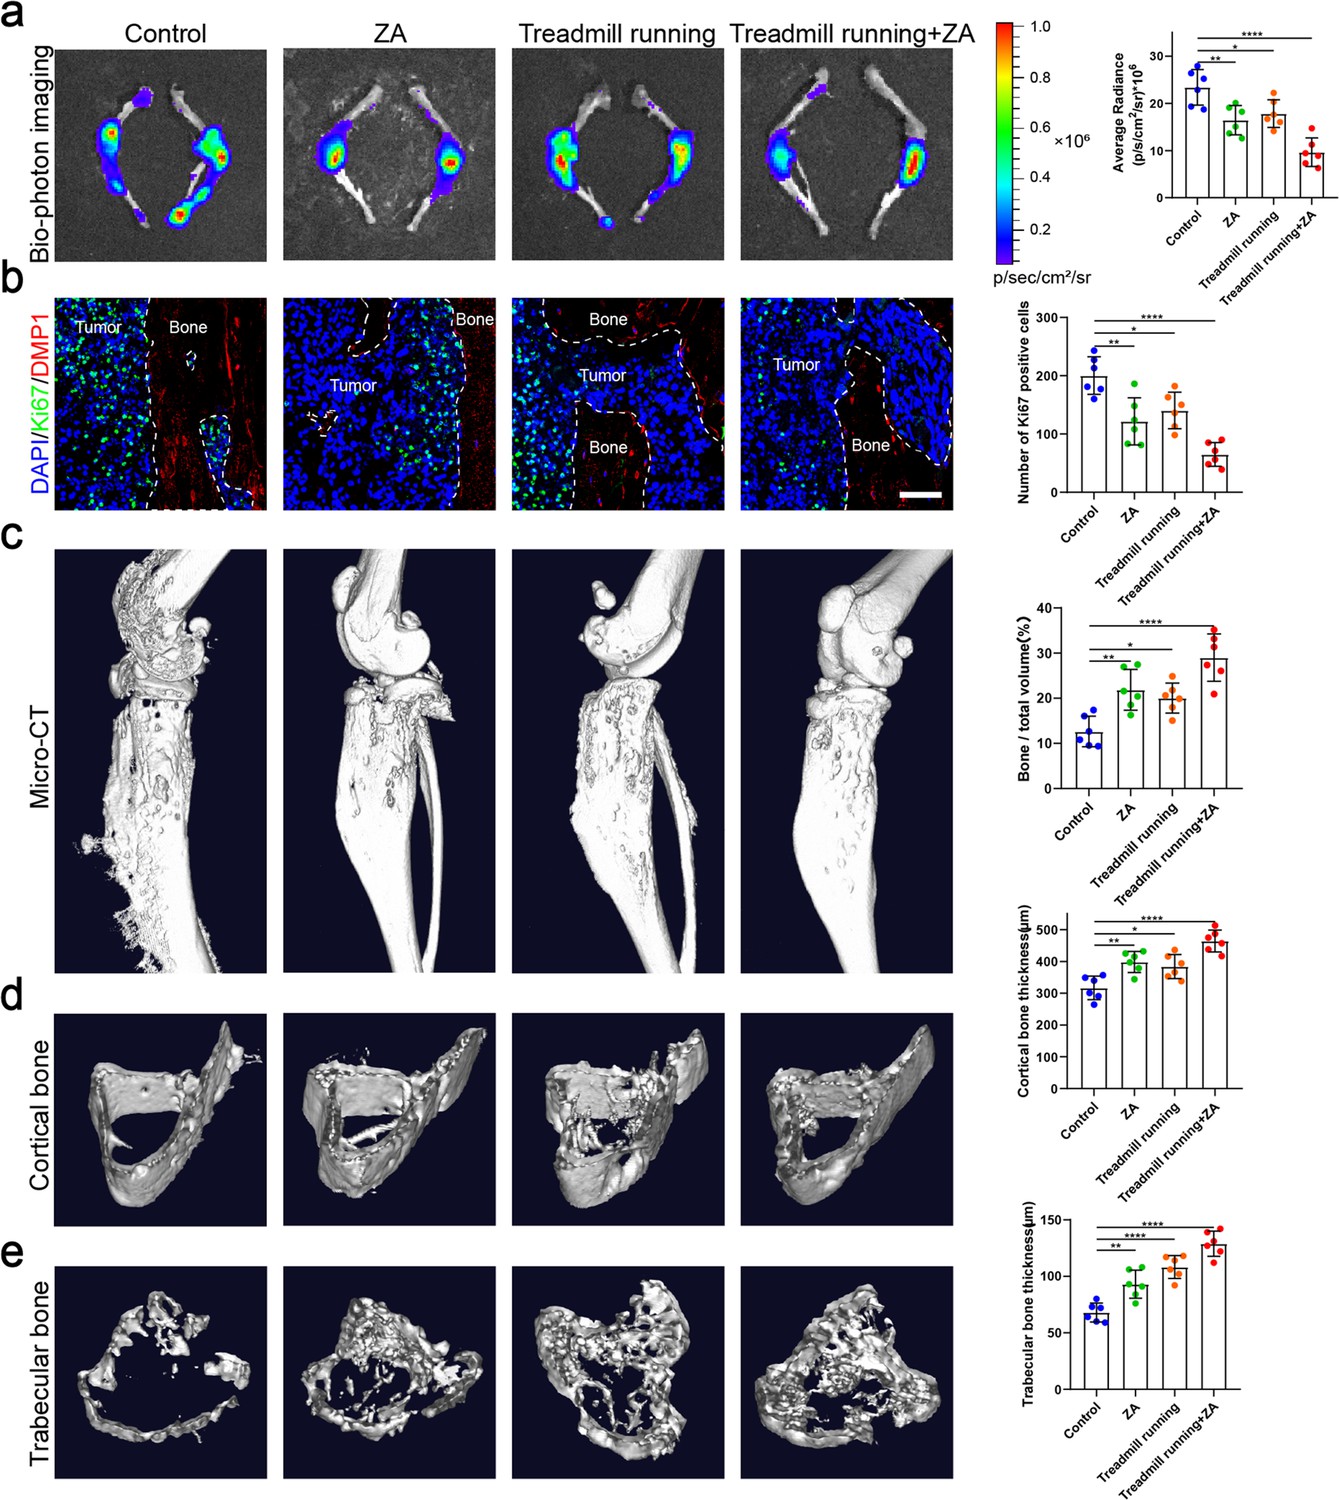
Moderate exercise combined with zoledronic acid (ZA) effectively suppressed the progression of bone metastasis of non-small cell lung cancer (NSCLC).
An intraosseous model of bone metastasis was used via direct implantation of murine Lewis lung carcinoma (LLC) cells expressing green fluorescent protein (GFP) into tibia of mouse. Mice were subsequently randomized into tumor-bearing only (control), ZA, treadmill running, and treadmill running combined ZA (treadmill running+ZA) groups. Four weeks later, mice were sacrificed. (a) Representative biophotonic images and quantification of fluorescence signal in hindlimb bones of mice. n=6, one-way analysis of variance with Turkey’s multiple comparisons test. (b) Representative immunofluorescence staining images of Ki-67 (green), DMP1 (red), and 4',6-diamidino-2-phenylindole (DAPI) (blue) in the tibia of mice with bone metastases and quantification of the number of Ki-67-positive cells in the images. The dashed line indicates the boundary between bone and tumor. Scale bar: 50 µm. n=6, one-way analysis of variance with Turkey’s multiple comparisons test. (c–e) Representative micro-computed tomography (micro-CT) imaging and quantitation of the tibia (bone/total volume, cortical bone thickness, trabecular bone thickness) in mice. n=6, one-way analysis of variance with Turkey’s multiple comparisons test. Error bars represent Mean ± SD. No significance (ns) p>0.05, *p<0.05, **p<0.01, ***p<0.001, ****p<0.0001.
-
Figure 5—source data 1
Original table sources for quantification of Figure 5 plots.
- https://cdn.elifesciences.org/articles/89613/elife-89613-fig5-data1-v1.zip
Figure 5—figure supplement 1
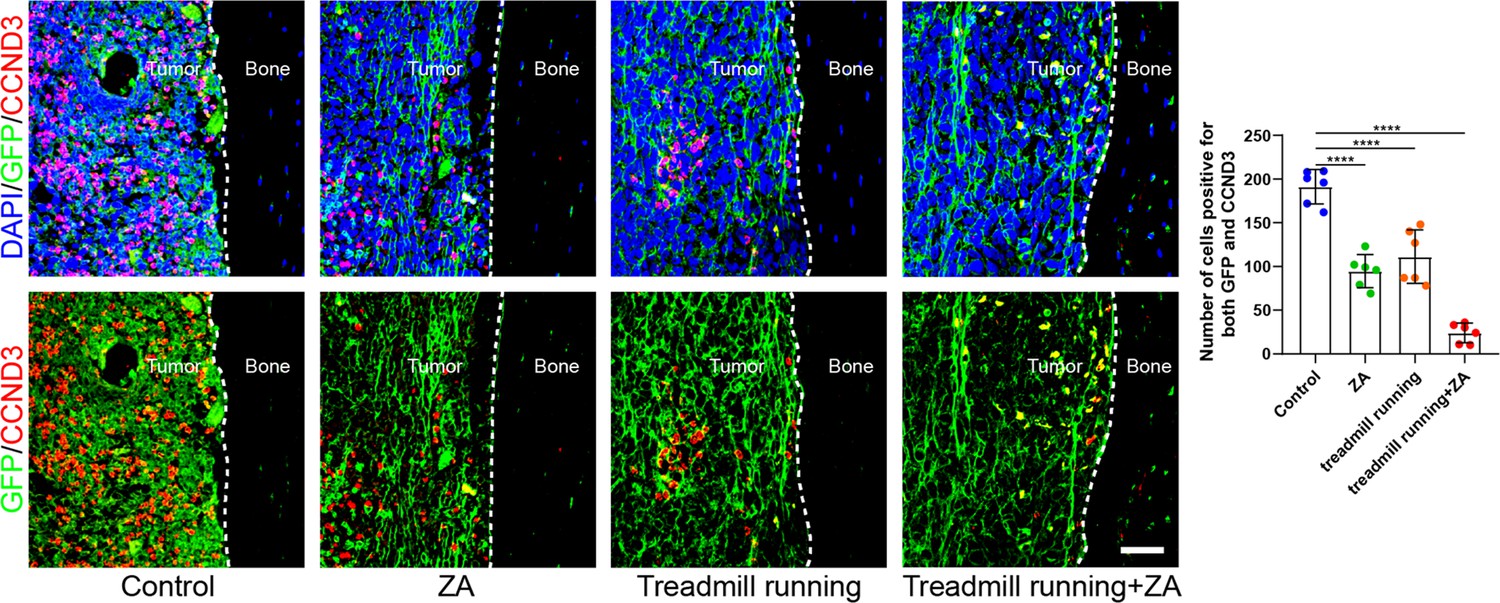
Moderate exercise combined with zoledronic acid effectively suppressed the progression of bone metastasis of non-small cell lung cancer (NSCLC).
Representative immunofluorescence staining images of green fluorescent protein (GFP) (green), CCND3 (red), and 4',6-diamidino-2-phenylindole (DAPI) (blue) in the tibia of mice with bone metastases and quantification of the GFP and CCND3-positive cells. The dashed line indicates the boundary between bone and tumor. Scale bar: 50 µm. n=6, one-way analysis of variance with Turkey’s multiple comparisons test. Error bars represent Mean ± SD. No significance (ns) p>0.05, *p<0.05, **p<0.01, ***p<0.001, ****p<0.0001.
-
Figure 5—figure supplement 1—source data 1
Original table sources for quantification of Figure 5—figure supplement 1 plots.
- https://cdn.elifesciences.org/articles/89613/elife-89613-fig5-figsupp1-data1-v1.zip
Figure 6 with 1 supplement
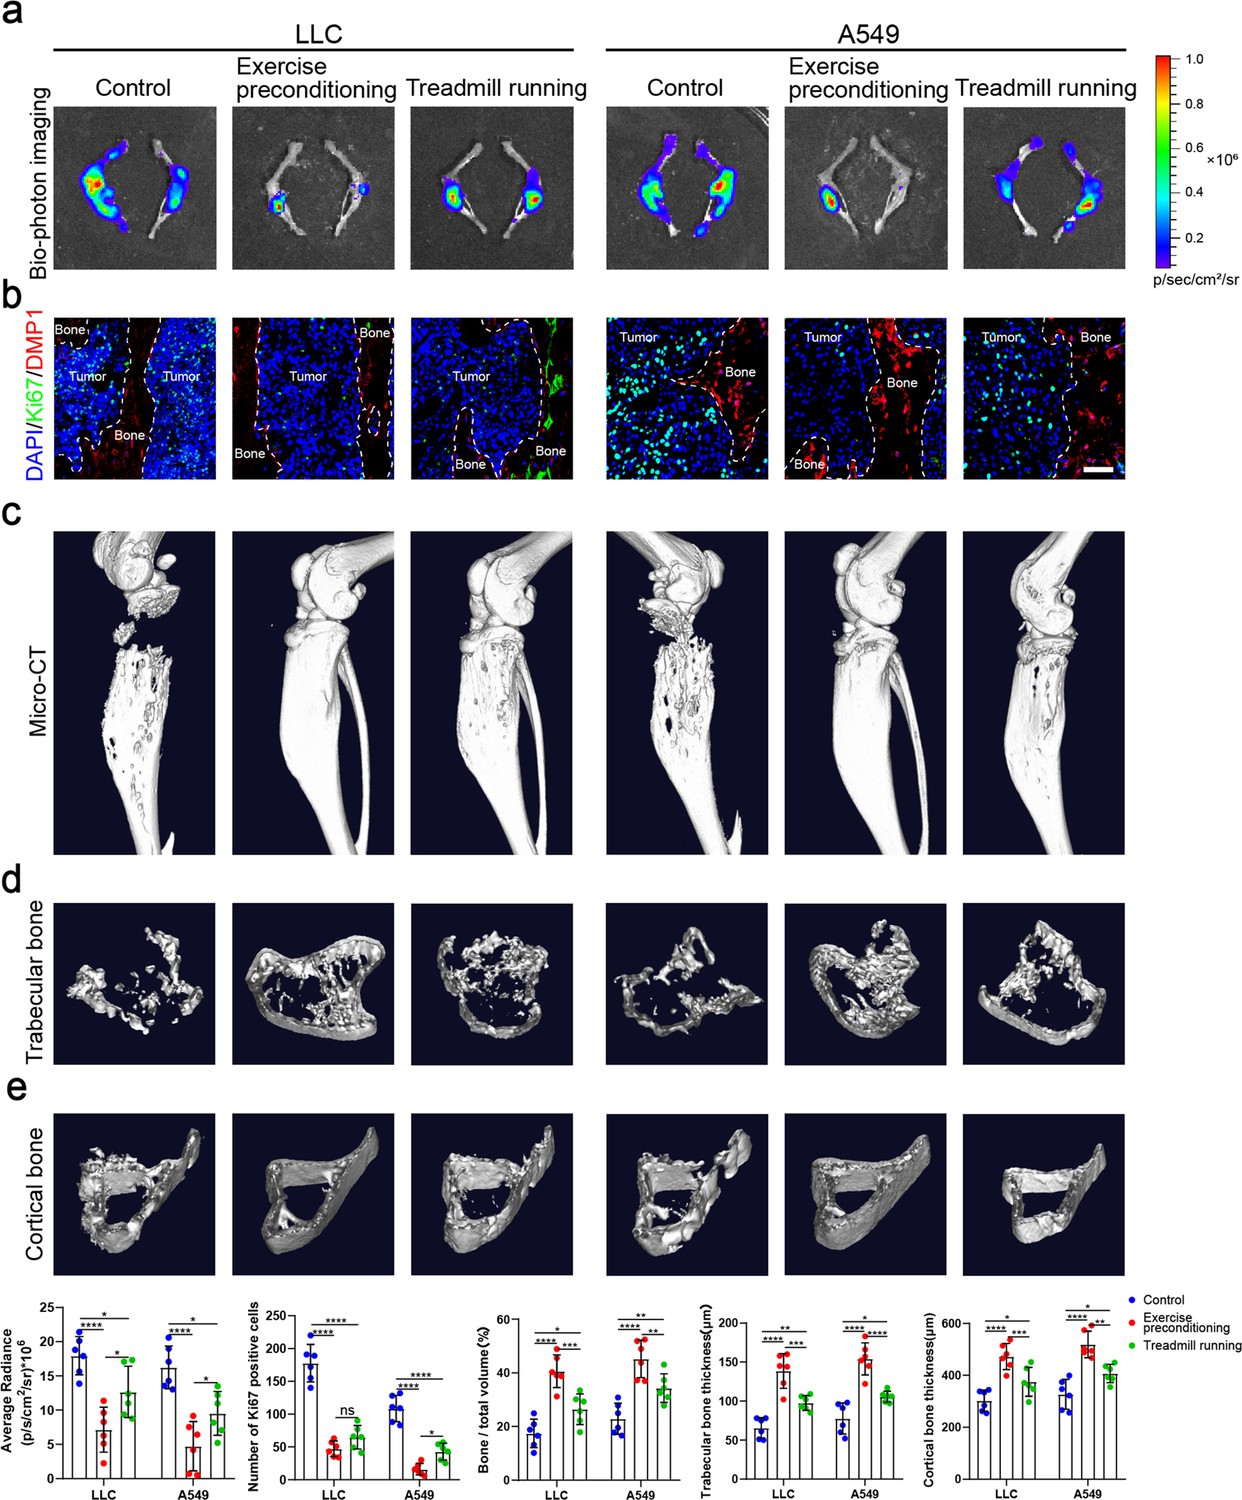
Exercise preconditioning effectively suppressed the progression of bone metastasis of non-small cell lung cancer (NSCLC).
An intraosseous model of bone metastasis was used via direct implantation of NSCLC cells (Lewis lung carcinoma [LLC] and A549) into tibia of mouse. Mice were subsequently randomized into tumor-bearing only (control), treadmill running before and after implantation of NSCLC cells into tibia (exercise preconditioning), and treadmill running after implantation of NSCLC cells into tibia (treadmill running) groups. For exercise preconditioning group, mice were subjected to 4 weeks of treadmill exercise before implantation of NSCLC cells into tibia of mouse. Four weeks after implantation, mice were sacrificed. (a) Representative biophotonic images and quantification of fluorescence signal in hindlimb bones of mice. n=6, one-way analysis of variance with Turkey’s multiple comparisons test. (b) Representative immunofluorescence staining images of Ki-67 (green), DMP1 (red), and 4',6-diamidino-2-phenylindole (DAPI) (blue) in the tibia of mice with bone metastases and quantification of the number of Ki-67-positive cells in the images. The dashed line indicates the boundary between bone and tumor. Scale bar: 50 µm. n=6, one-way analysis of variance with Turkey’s multiple comparisons test. (c–e) Representative micro-computed tomography (micro-CT) imaging and quantitation of the tibia (bone/total volume, cortical bone thickness, trabecular bone thickness) in mice. n=6, one-way analysis of variance with Turkey’s multiple comparisons test. Error bars represent Mean ± SD. No significance (ns) p>0.05, *p<0.05, **p<0.01, ***p<0.001, ****p<0.0001.
-
Figure 6—source data 1
Original table sources for quantification of Figure 6 plots.
- https://cdn.elifesciences.org/articles/89613/elife-89613-fig6-data1-v1.zip
Figure 6—figure supplement 1
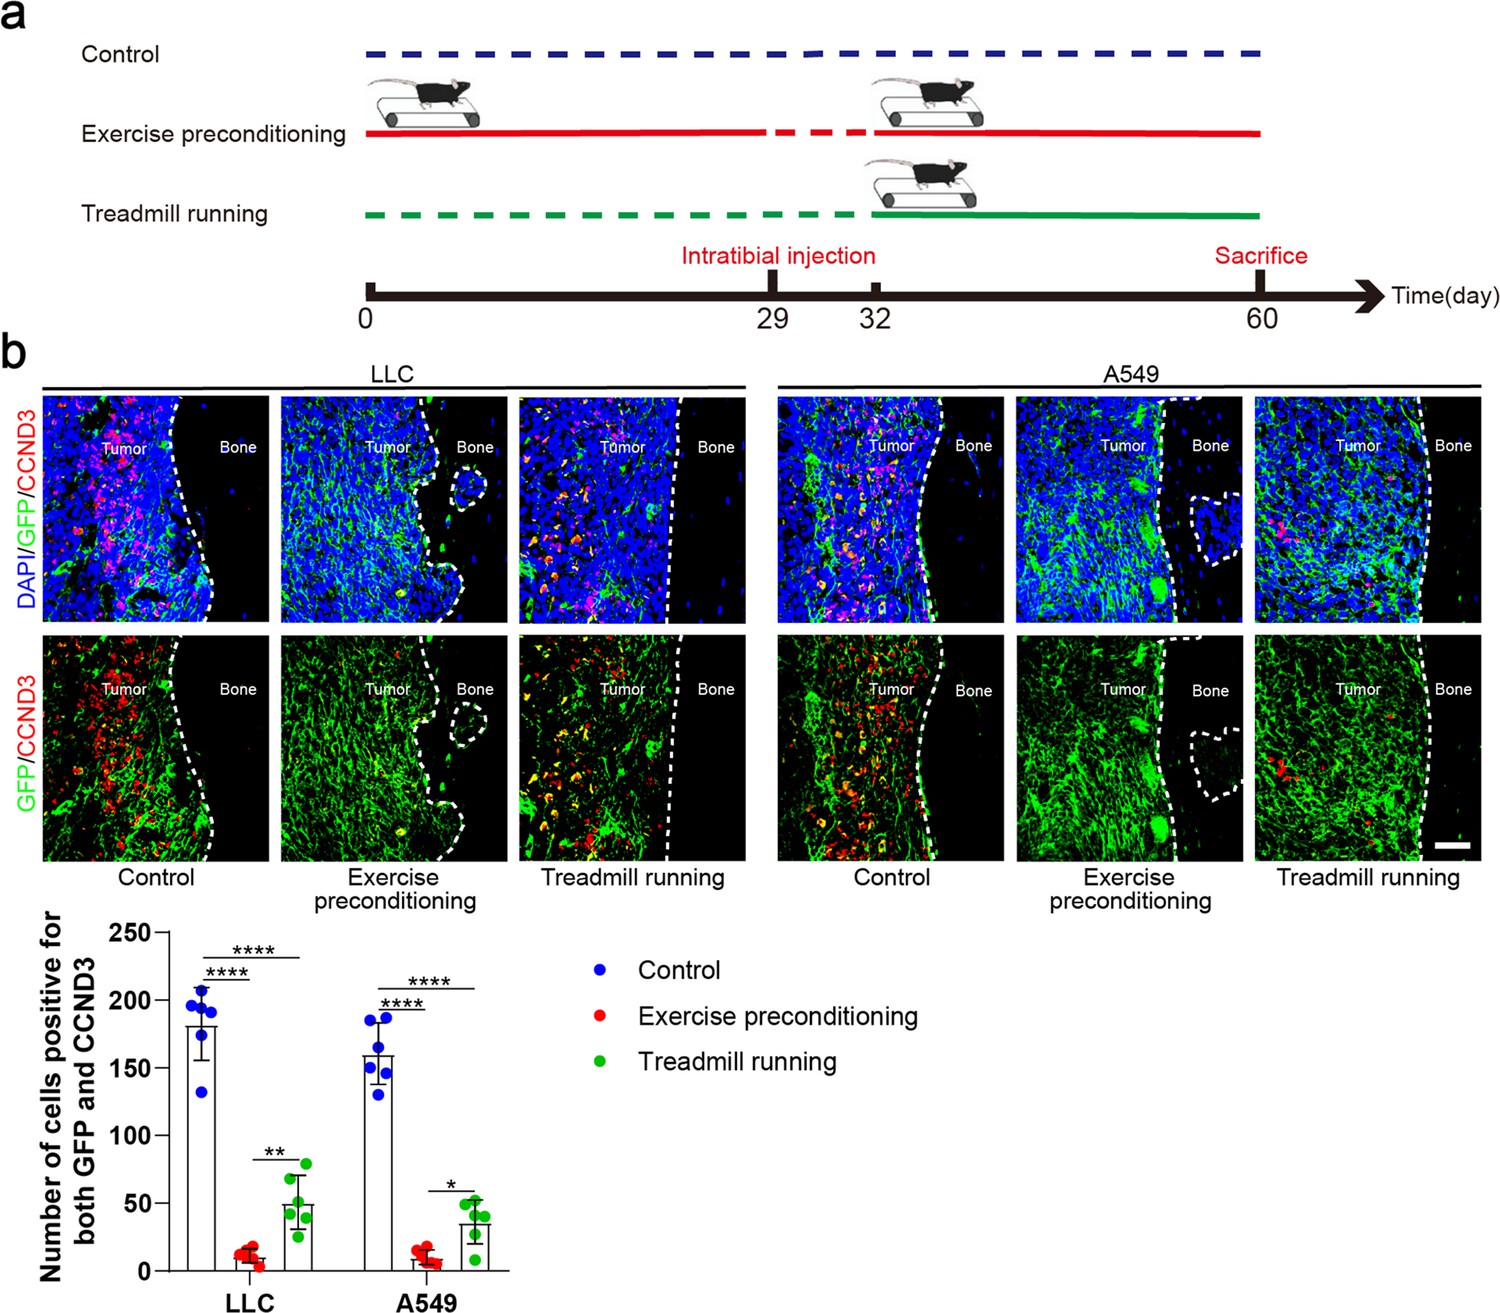
Exercise preconditioning effectively suppressed the progression of bone metastasis of non-small cell lung cancer (NSCLC).
(a) An intraosseous model of bone metastasis was used via direct implantation of NSCLC cells (Lewis lung carcinoma [LLC] and A549) into tibia of mouse. Mice were subsequently randomized into tumor-bearing only (control), treadmill running before and after implantation of NSCLC cells into tibia (exercise preconditioning), and treadmill running after implantation of NSCLC cells into tibia (treadmill running) groups. For exercise preconditioning group, mice were subjected to 4 weeks of treadmill exercise before implantation of NSCLC cells into tibia of mouse. Four weeks after implantation, mice were sacrificed. (b) Representative immunofluorescence staining images of green fluorescent protein (GFP) (green), CCND3 (red), and 4',6-diamidino-2-phenylindole (DAPI) (blue) in the tibia of mice with bone metastases and quantification of the GFP and CCND3-positive cells. The dashed line indicates the boundary between bone and tumor. Scale bar: 50 µm. n=6, one-way analysis of variance with Turkey’s multiple comparisons test. Error bars represent Mean ± SD. No significance (ns) p>0.05, *p<0.05, **p<0.01, ***p<0.001, ****p<0.0001.
-
Figure 6—figure supplement 1—source data 1
Original table sources for quantification of Figure 6—figure supplement 1 plots.
- https://cdn.elifesciences.org/articles/89613/elife-89613-fig6-figsupp1-data1-v1.zip
Figure 7
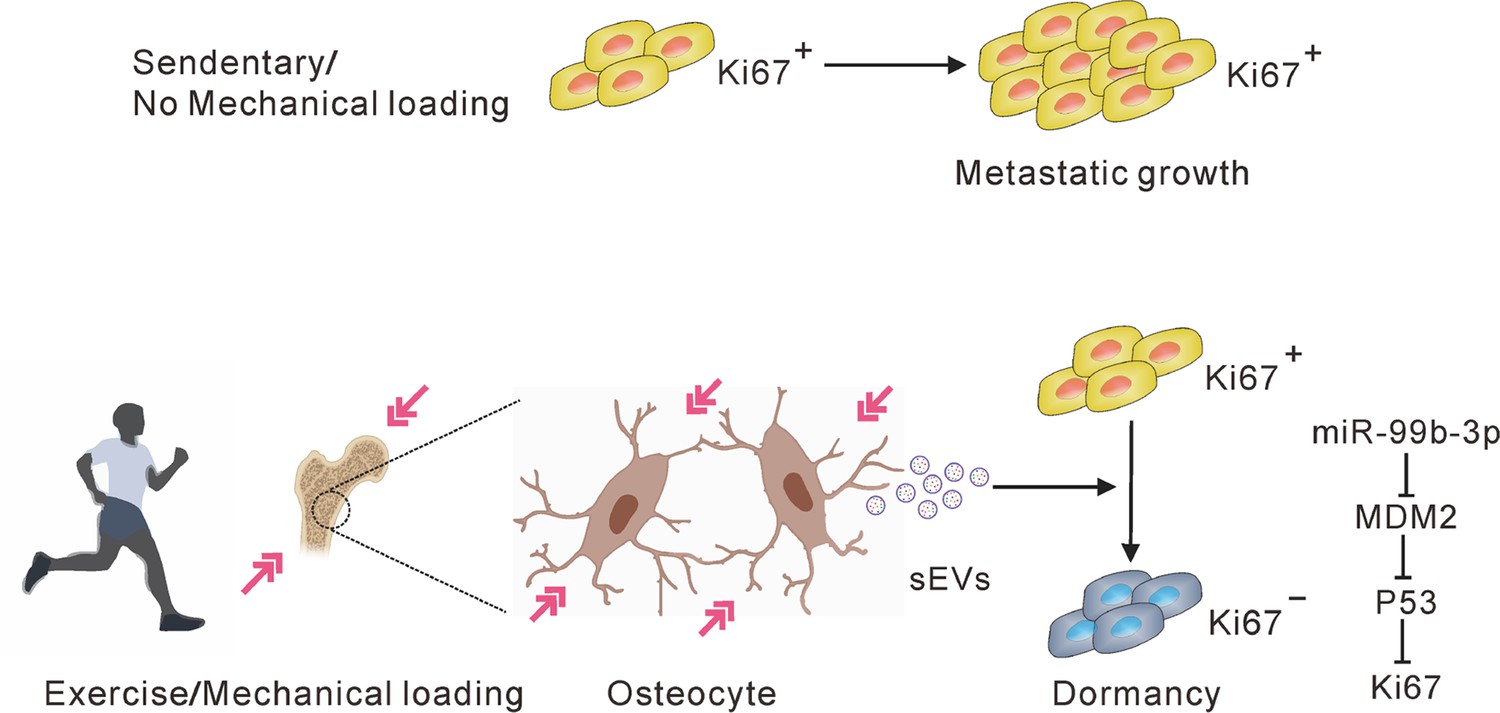
A hypothetical model depicting osteocytes induces and maintains tumor dormancy in bone metastasis of non-small cell lung cancer (NSCLC).
Osteocytes, sensing mechanical stimulation generated by exercise or mechanical loading, inhibit the proliferation and sustain the dormancy of NSCLC cells by releasing small extracellular vesicles (sEVs) with tumor suppressor micro-RNAs (miRNAs), such as miR-99b-3p, which inhibits the proliferation of NSCLC cells by directly targeting murine double minute 2 (MDM2).
Tables
Key resources table
| Reagent type (species) or resource | Designation | Source or reference | Identifiers | Additional information |
|---|---|---|---|---|
| Cell line (Homo sapiens) | A549 | ATCC | CVCL_0023 | |
| Cell line (H. sapiens) | NCI-H23 | ATCC | CVCL_1547 | |
| Cell line (Mus musculus) | MLO-Y4 | ATCC | CVCL_M098 | |
| Cell line (M. musculus) | MLO-A5 | ATCC | CVCL_0P24 | |
| Cell line (M. musculus) | MC3T3-E1 | ATCC | CVCL_0409 | |
| Cell line (M. musculus) | LLC | ATCC | CVCL_4358 | |
| Cell line (H. sapiens) | NCM460 | ATCC | CVCL_0460 | |
| Antibody | Anti-CD63 (Mouse monoclonal) | Abcam | ab193349 | 1:1000 |
| Antibody | Anti-TSG101 (Mouse monoclonal) | Abcam | ab83 | 1:1000 |
| Antibody | Anti-ALIX (Rabbit polyclonal) | Abcam | ab76608 | 1:1000 |
| Antibody | β-Actin (Rabbit monoclonal) | Cell Signaling Technology | 4970S | 1:4000 |
| Antibody | GAPDH (Rabbit monoclonal) | Cell Signaling Technology | 2118 | 1:5000 |
| Antibody | MDM2 (Rabbit polyclonal) | Proteintech | 66511-1-IG | 1:1000 |
| Antibody | Ki-67 (Rabbit monoclonal) | Cell Signaling Technology | 9129 | 1:200 |
| Antibody | DMP1 (Sheep polyclonal) | R&D Systems | AF4386 | 1:100 |
| Antibody | GFP (Mouse monoclonal) | ABclonal | AE012 | 1:100 |
| Antibody | CCND3 (Rabbit polyclonal) | Bioss | bs-0660R | 1:100 |
| Sequence-based reagent | Cel-miR-39-3p_F | Vazyme | qRT-PCR Forward primer | 5'-GCGTCACCGGGTGTAAATC-3' |
| Sequence-based reagent | mmu-miR-365-1-5p_F | Vazyme | qRT-PCR Forward primer | 5'-AGGGACTTTTGGGGGCA-3' |
| Sequence-based reagent | mmu-miR-99b-3p_F | Vazyme | qRT-PCR Forward primer | 5'-GCGCAAGCTCGTGTCTGTG-3' |
| Sequence-based reagent | mmu-miR-193a-5p_F | Vazyme | qRT-PCR Forward primer | 5'-TGGGTCTTTGCGGGCA-3' |
| Sequence-based reagent | mmu-miR-125a-3p_F | Vazyme | qRT-PCR Forward primer | 5'-CGCGACAGGTGAGGTTCTTG-3' |
| Sequence-based reagent | mmu-miR-690_F | Vazyme | qRT-PCR Forward primer | 5'-GCGAAAGGCTAGGCTCACA-3' |
| Sequence-based reagent | mmu-miR-1195_F | Vazyme | qRT-PCR Forward primer | 5'-GTGAGTTCGAGGCCAGCC-3' |
| Sequence-based reagent | mmu-miR-122-5p_F | Vazyme | qRT-PCR Forward primer | 5'-CGCGTGGAGTGTGACAATGG-3' |
| Sequence-based reagent | mmu-miR-140-3p_F | Vazyme | qRT-PCR Forward primer | 5'-GCGCGTACCACAGGGTAGAA-3' |
| Sequence-based reagent | Reverse primer of all miRNAs | Vazyme | qRT-PCR Reverse primer | 5'-AGTGCAGGGTCCGAGGTATT-3' |
| Commercial assay or kit | PKH67 Green Fluorescent Cell Linker Kit | Sigma-Aldrich | PKH67GL | |
| Commercial assay or kit | Cell-Light EdU Apollo488 In Vitro Kit | Ribobio | C10310-3 | |
| Commercial assay or kit | miRCURY LNA miRNA Detection Kit | Exiqon | 339115 | |
| Chemical compound, drug | GW4869 | Sigma-Aldrich | D1692 | |
| Software, algorithm | GraphPad Prism | GraphPad Software | Version 6.0 RRID:SCR_002798 |
Additional files
Download links
A two-part list of links to download the article, or parts of the article, in various formats.
Downloads (link to download the article as PDF)
Open citations (links to open the citations from this article in various online reference manager services)
Cite this article (links to download the citations from this article in formats compatible with various reference manager tools)
Mechanically stimulated osteocytes maintain tumor dormancy in bone metastasis of non-small cell lung cancer by releasing small extracellular vesicles
eLife 12:RP89613.
https://doi.org/10.7554/eLife.89613.3


