Evolution of the gene regulatory network of body axis by enhancer hijacking in amphioxus
- State Key Laboratory of Cellular Stress Biology, School of Life Sciences, Xiamen University, China
Figures
Figure 1 with 5 supplements
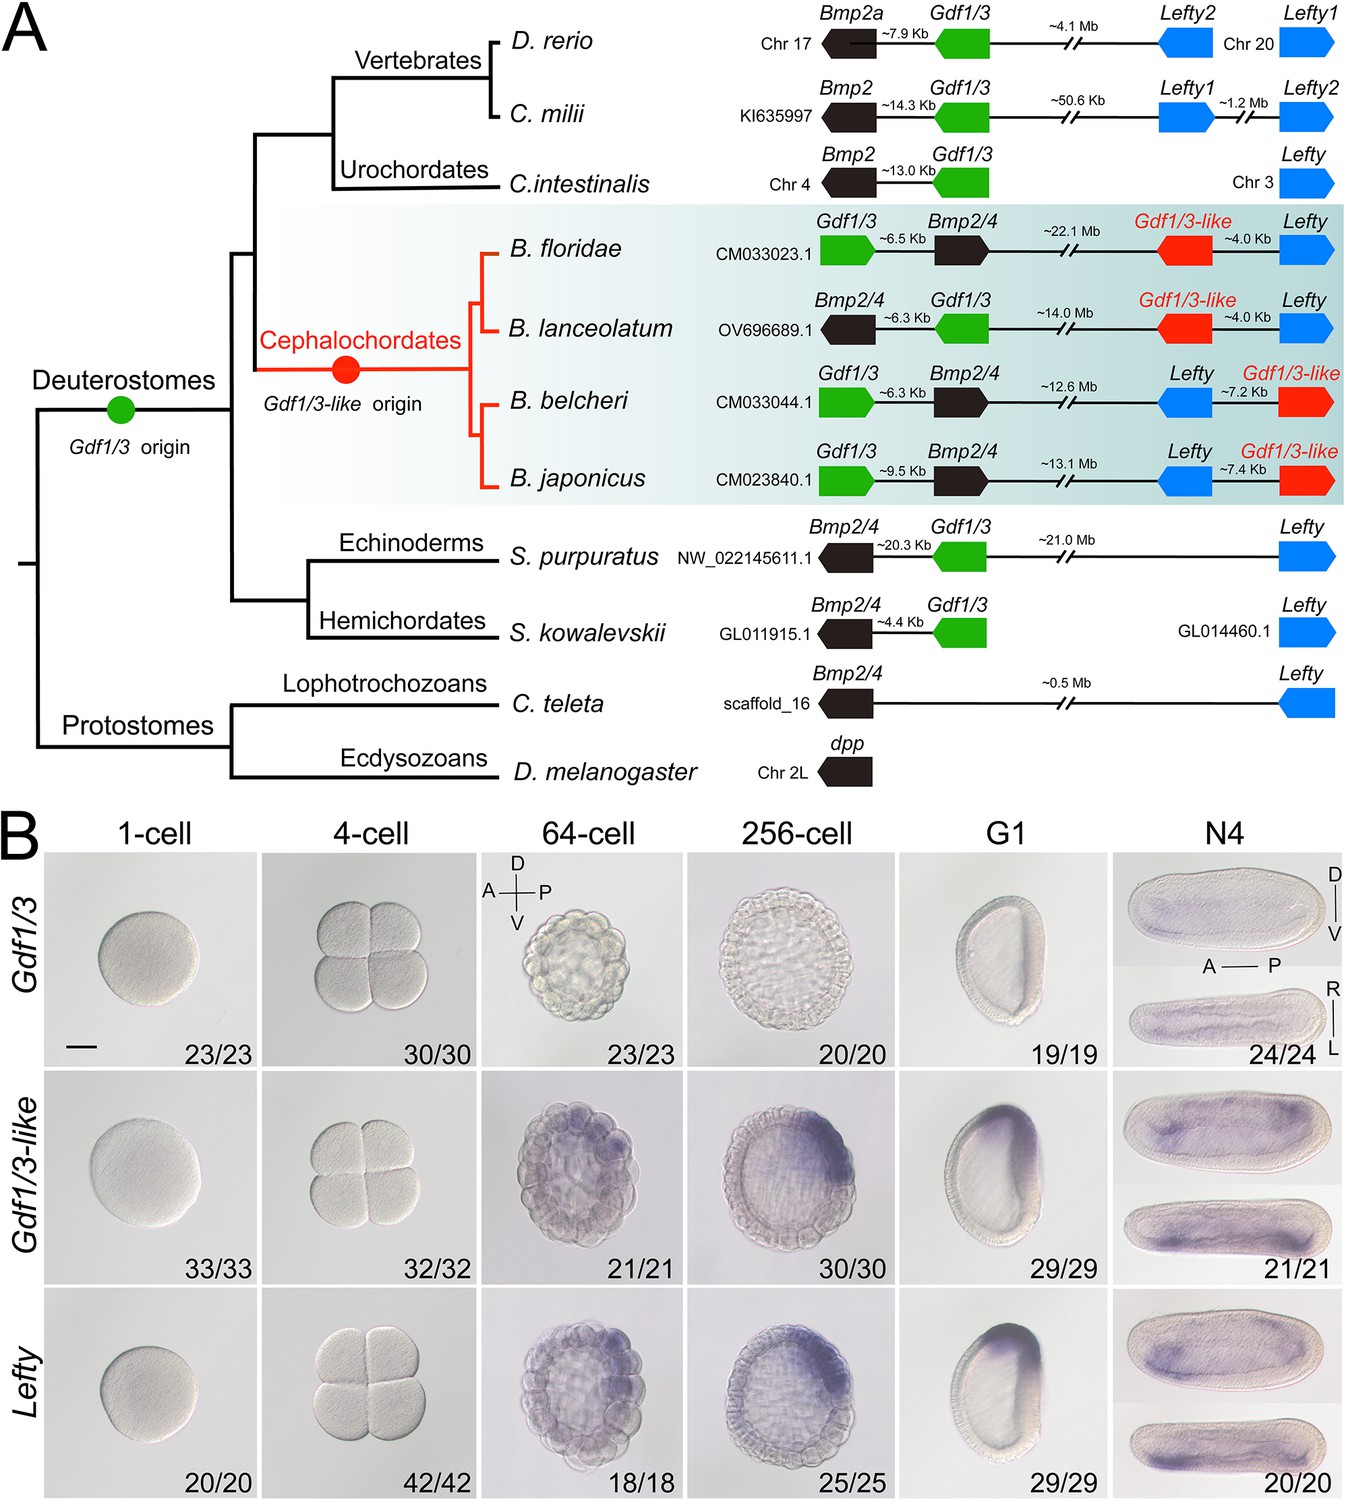
Synteny and expression pattern of amphioxus Gdf1/3 and Gdf1/3-like gene.
(A) Arrangement of Gdf1/3, Bmp2/4, Gdf1/3-like, and Lefty genes in representative bilaterian genomes. Black lines represent the genes (boxes) at both ends are tightly linked and fractured lines represent the genes are close together on a same chromosome or scafford indicated. zebrafish (Danio rerio), elephant shark (Callorhinchus milii), vase tunicate (Ciona intestinalis), Florida amphioxus (B. floridae), European amphioxus (B. lanceolatum), Asia amphioxus (B. belcheri and B. japonicum), sea urchin (Strongylocentrotus purpuratus), acorn worm (Saccoglossus kowalevskii), polychaete worm (Capitella teleta), and fruit fly (Drosophila melanogaster). (B) The spatiotemporal expression pattern of Gdf1/3, Gdf1/3-like, and Lefty at different stages of B. floridae embryos. Embryos at 64-cell to G1 stage were viewed from the left side with anterior to the left (the anterior-posterior [A–P] and D–V axes are labeled), and those at N4 stage were viewed from either the left site (upper panels) or dorsal side (lower panels) with anterior to the left (the A–P, D–V, and L–R axes are all labeled). Numbers in the panels indicate the number of times the expression pattern shown was identified, out of the total number of embryos identified. Scale bar, 50 μm.
Figure 1—figure supplement 1
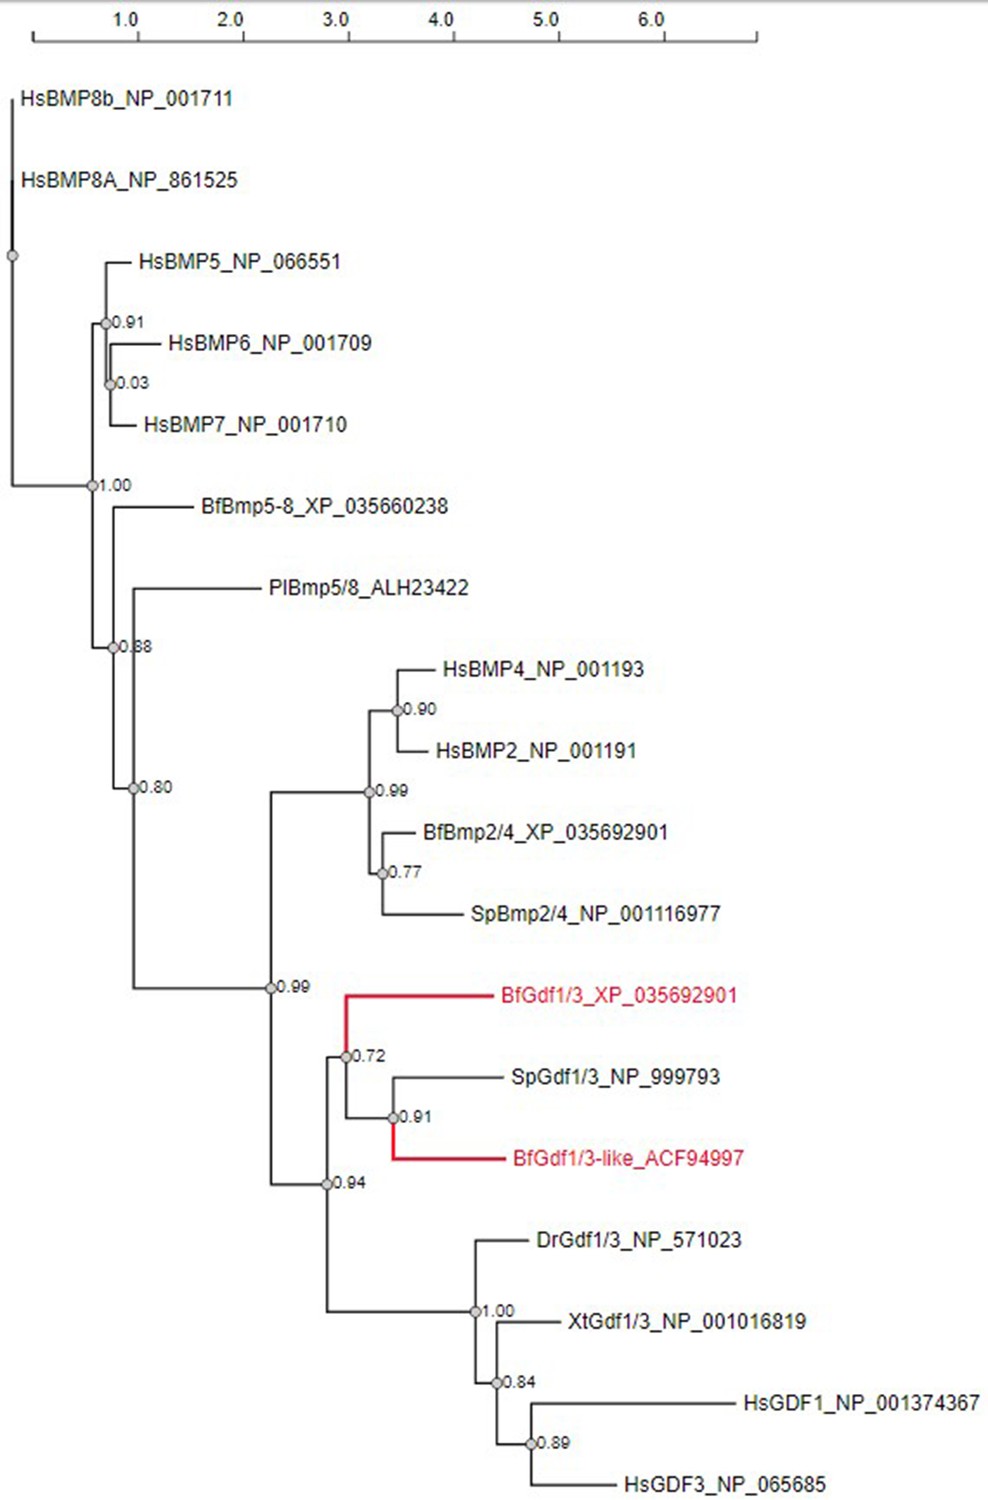
Phylogenetic tree of Gdf1/3-related genes.
Abbreviations: Hs, Homo sapiens; Pl, Paracentrotus lividus; Sp, Strongylocentrotus purpuratus; Dr, Danio rerio; Xt, Xenopus tropicalis; Bf, Branchiostoma floridae. The accession numbers of each gene are indicated.
Figure 1—figure supplement 2
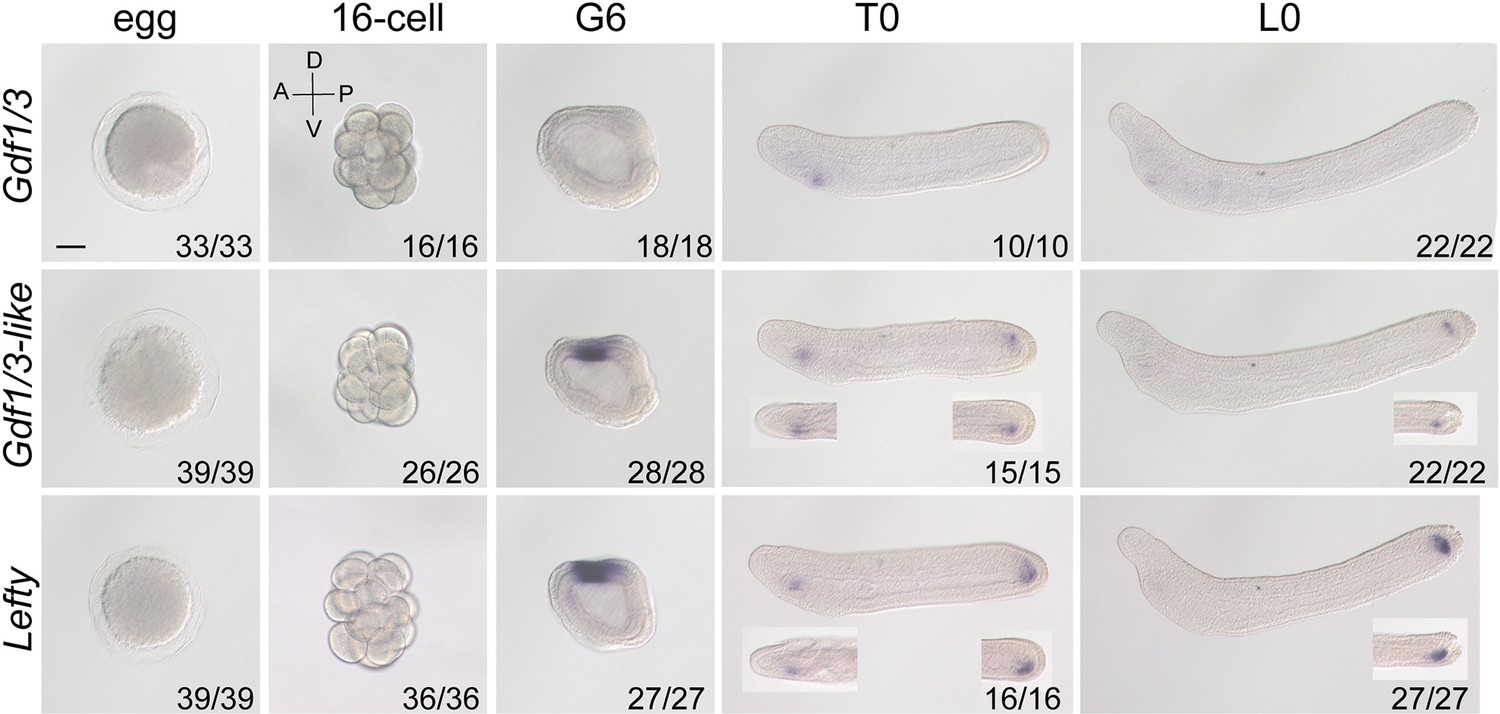
Analysis of Gdf1/3, Gdf1/3-like, and Lefty expression patterns at different stages of B. floridae embryos or larvae with in situ hybridization.
Embryos or larvae at 16-cell to L0 stage were viewed from the left side with anterior to the left (the A–P and D–V axes are labeled). Inserts in the panels of some T0 embryos or L0 larvae were viewed from the dorsal side. Numbers in the panels indicate the number of times the expression pattern shown was identified, out of the total number of embryos or larvae identified. Scale bar, 50 μm.
Figure 1—figure supplement 3
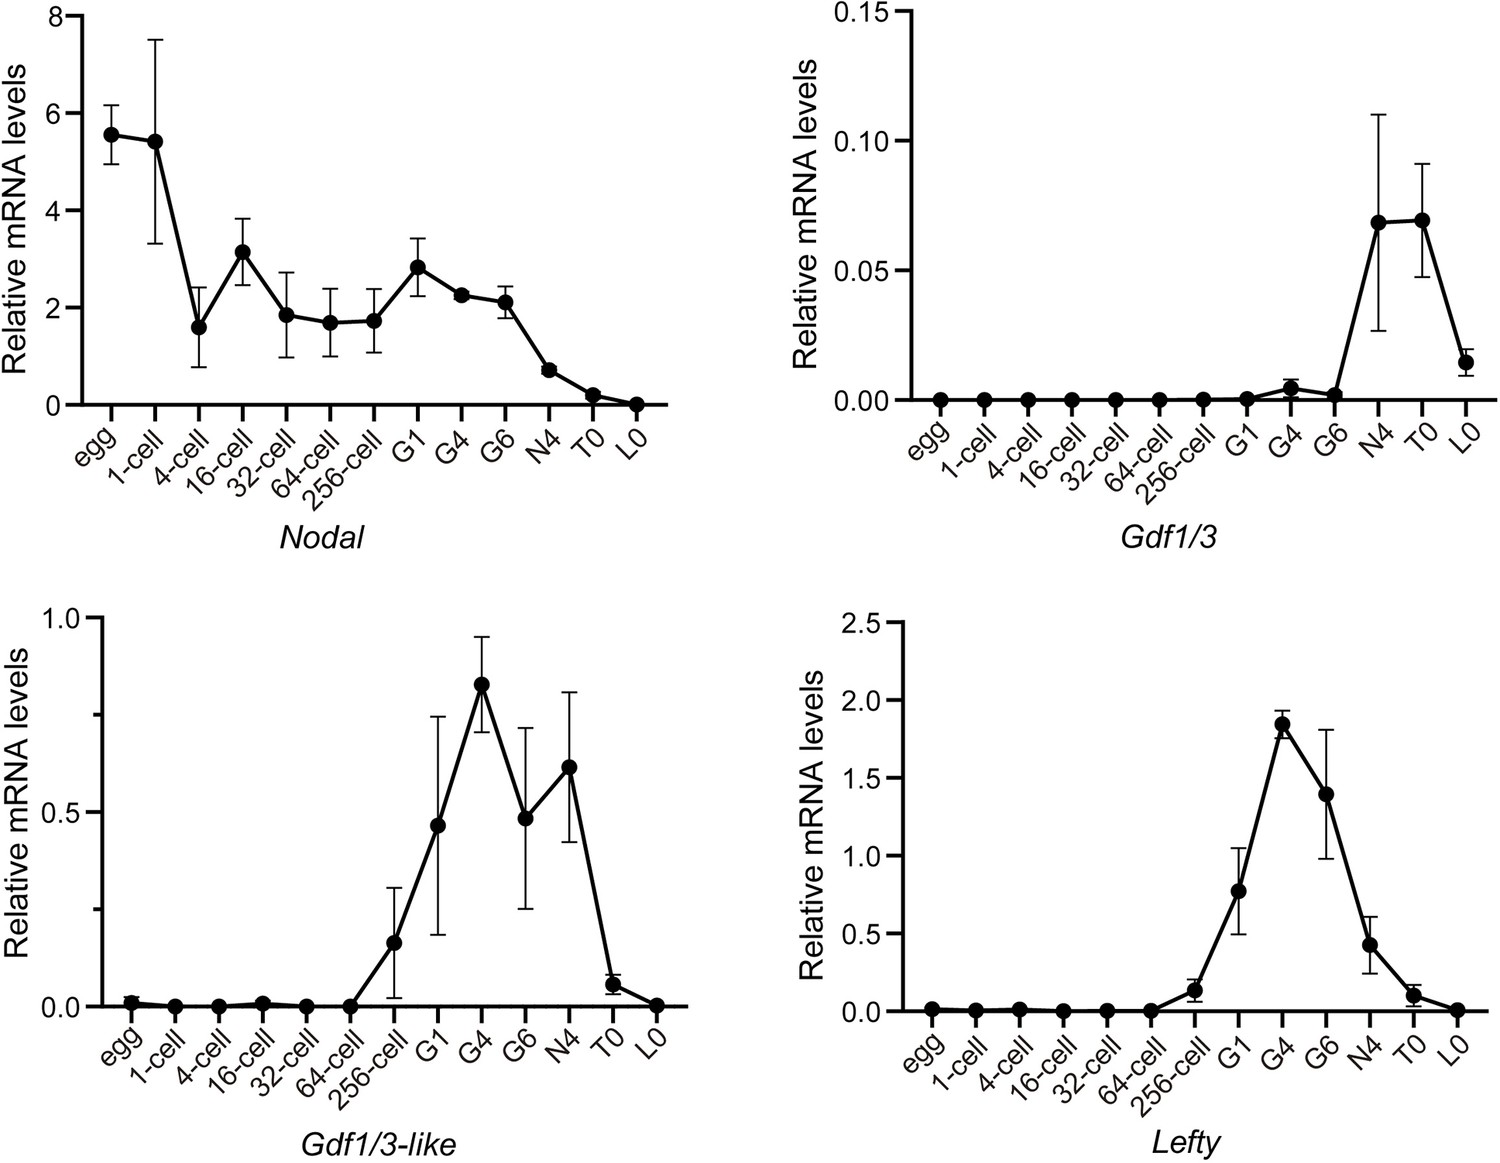
Analysis of Gdf1/3, Gdf1/3-like, and Lefty expression patterns at different stages of B. floridae embryos or larvae with quantitative real-time polymerase chain reaction.
The expression level of examined genes was normalized to that of Gapdh. Error bars indicate standard deviation from three biological replicates.
-
Figure 1—figure supplement 3—source data 1
The threshold cycle of each gene analyzed using quantitative real-time polymerase chain reaction.
- https://cdn.elifesciences.org/articles/89615/elife-89615-fig1-figsupp3-data1-v1.xlsx
Figure 1—figure supplement 4
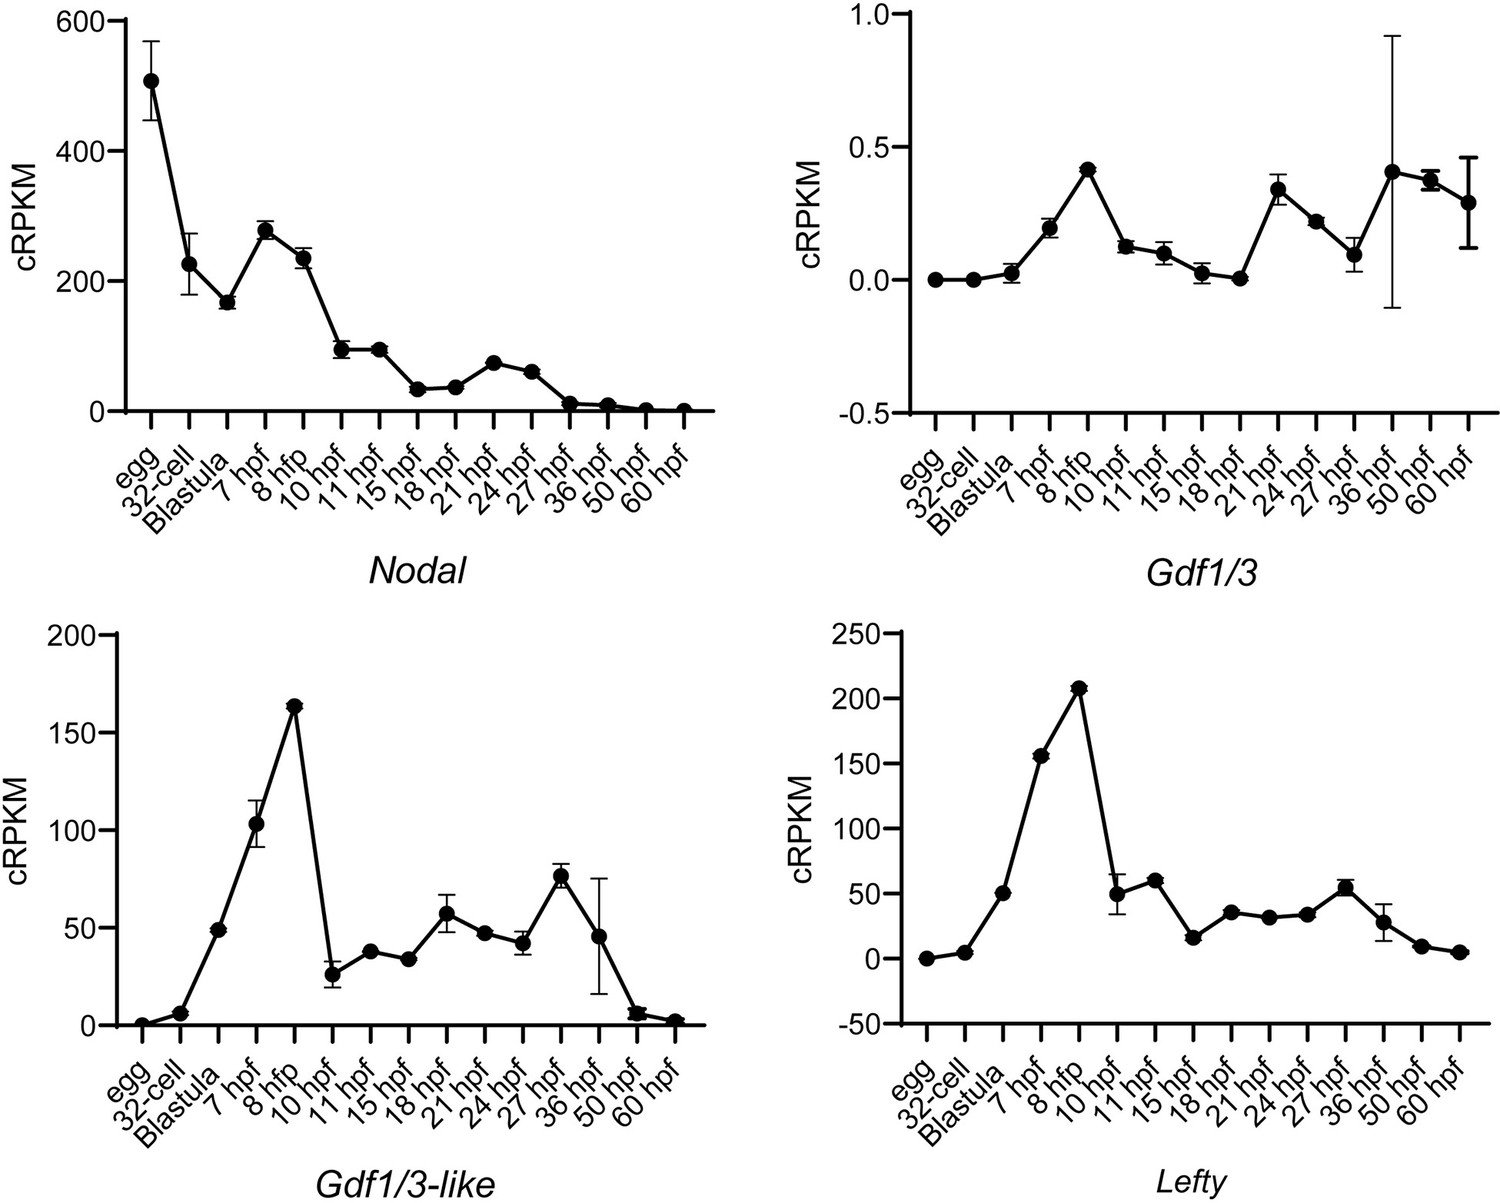
Analysis of Nodal, Gdf1/3, Gdf1/3-like, and Lefty expression patterns at different stages of B. lanceolatum embryos or larvae with RNA-seq.
The expression values (cRPKM) of each gene are directly derived from a previous study (Marlétaz et al., 2018). Error bars indicate standard deviation from two biological replicates at stage egg, Blastula, 7 hpf, 8 hpf, 10 hpf, 11 hpf, 18 hpf, 21 hpf, 24 hpf, 27 hpf, 50 hpf and 60 hpf, from five biological replicates at stage 32-cell, from four biological replicates at stage 15 hpf and from three biological replicates at stage 36 hpf.
Figure 1—figure supplement 5
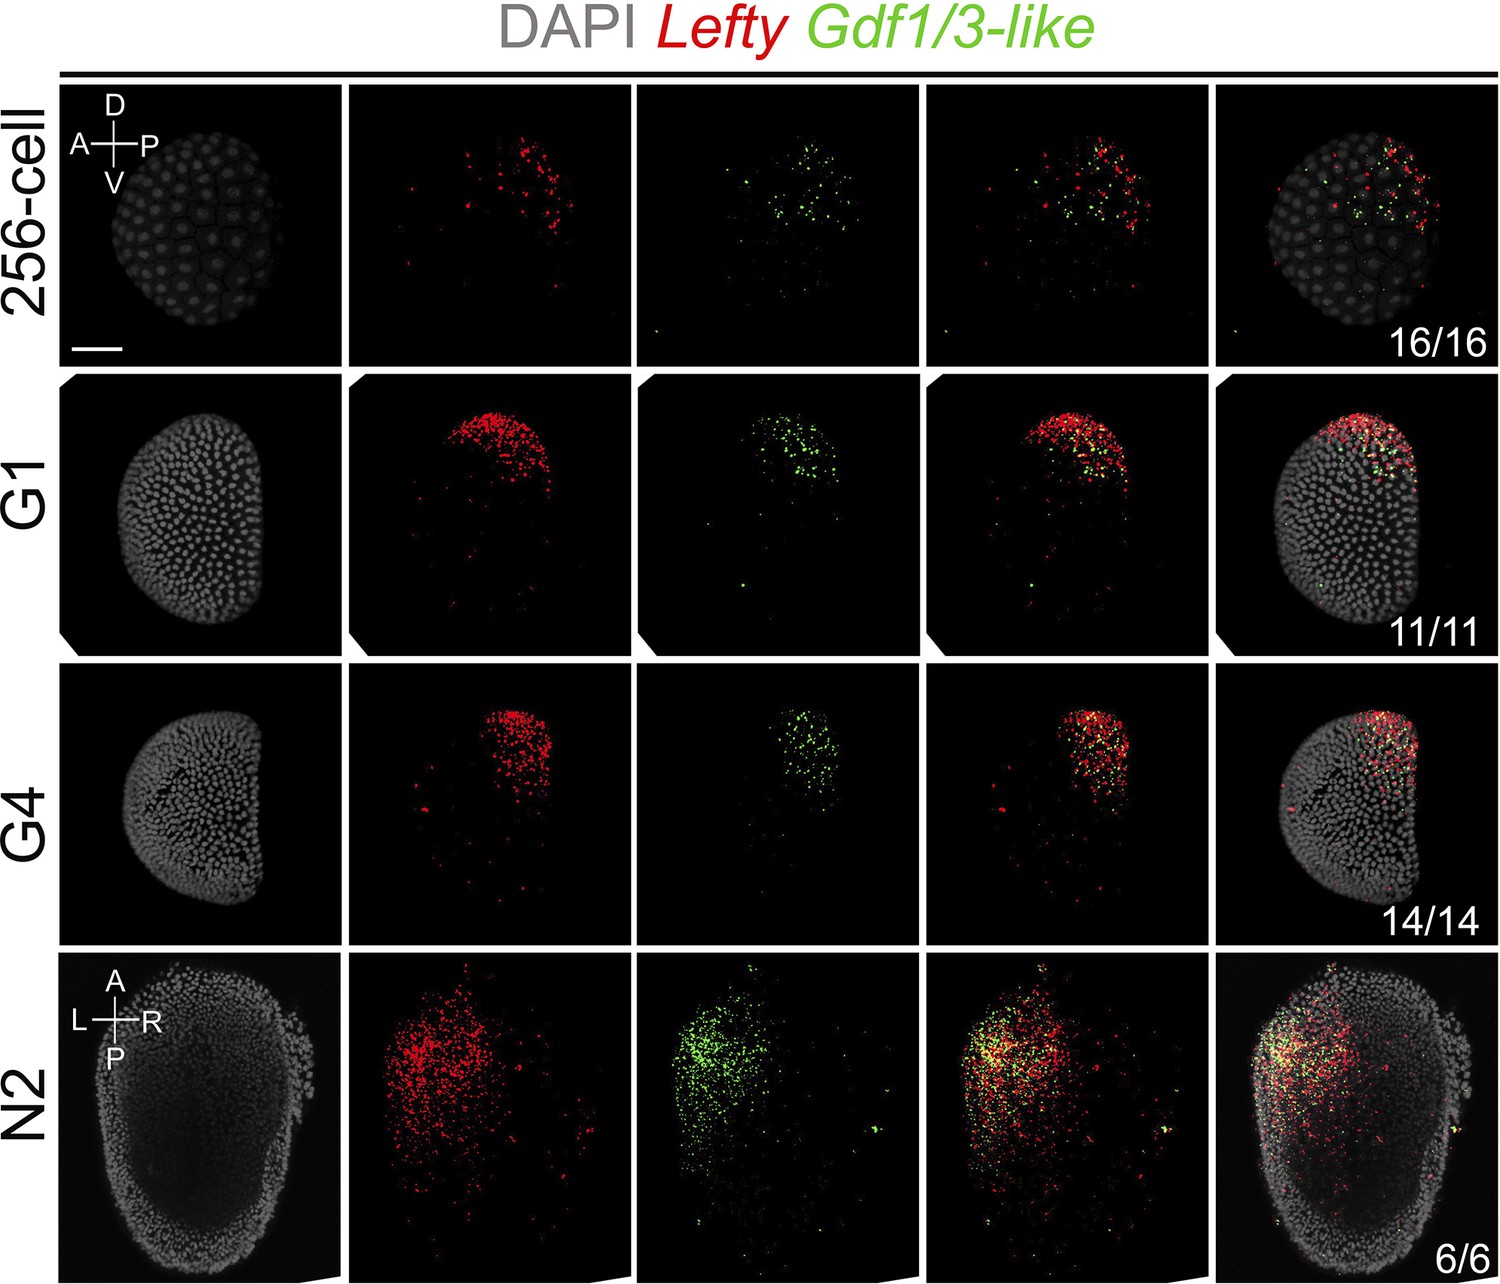
Analysis of Gdf1/3-like and Lefty expression patterns at different stages of B. floridae embryos with double fluorescence in situ hybridization.
Embryos at 256-cell to G4 stage were viewed from the left side with anterior to the left (the A–P and D–V axes are labeled), and those at N2 stage were viewed from dorsal side with anterior to the top (the A–P and L–R axes are labeled). Numbers in the panels indicate the number of times the expression pattern shown was identified, out of the total number of embryos identified. DAPI, 4,6-diamidino-2-phenylindole. Scale bar, 50 μm.
Figure 2 with 4 supplements
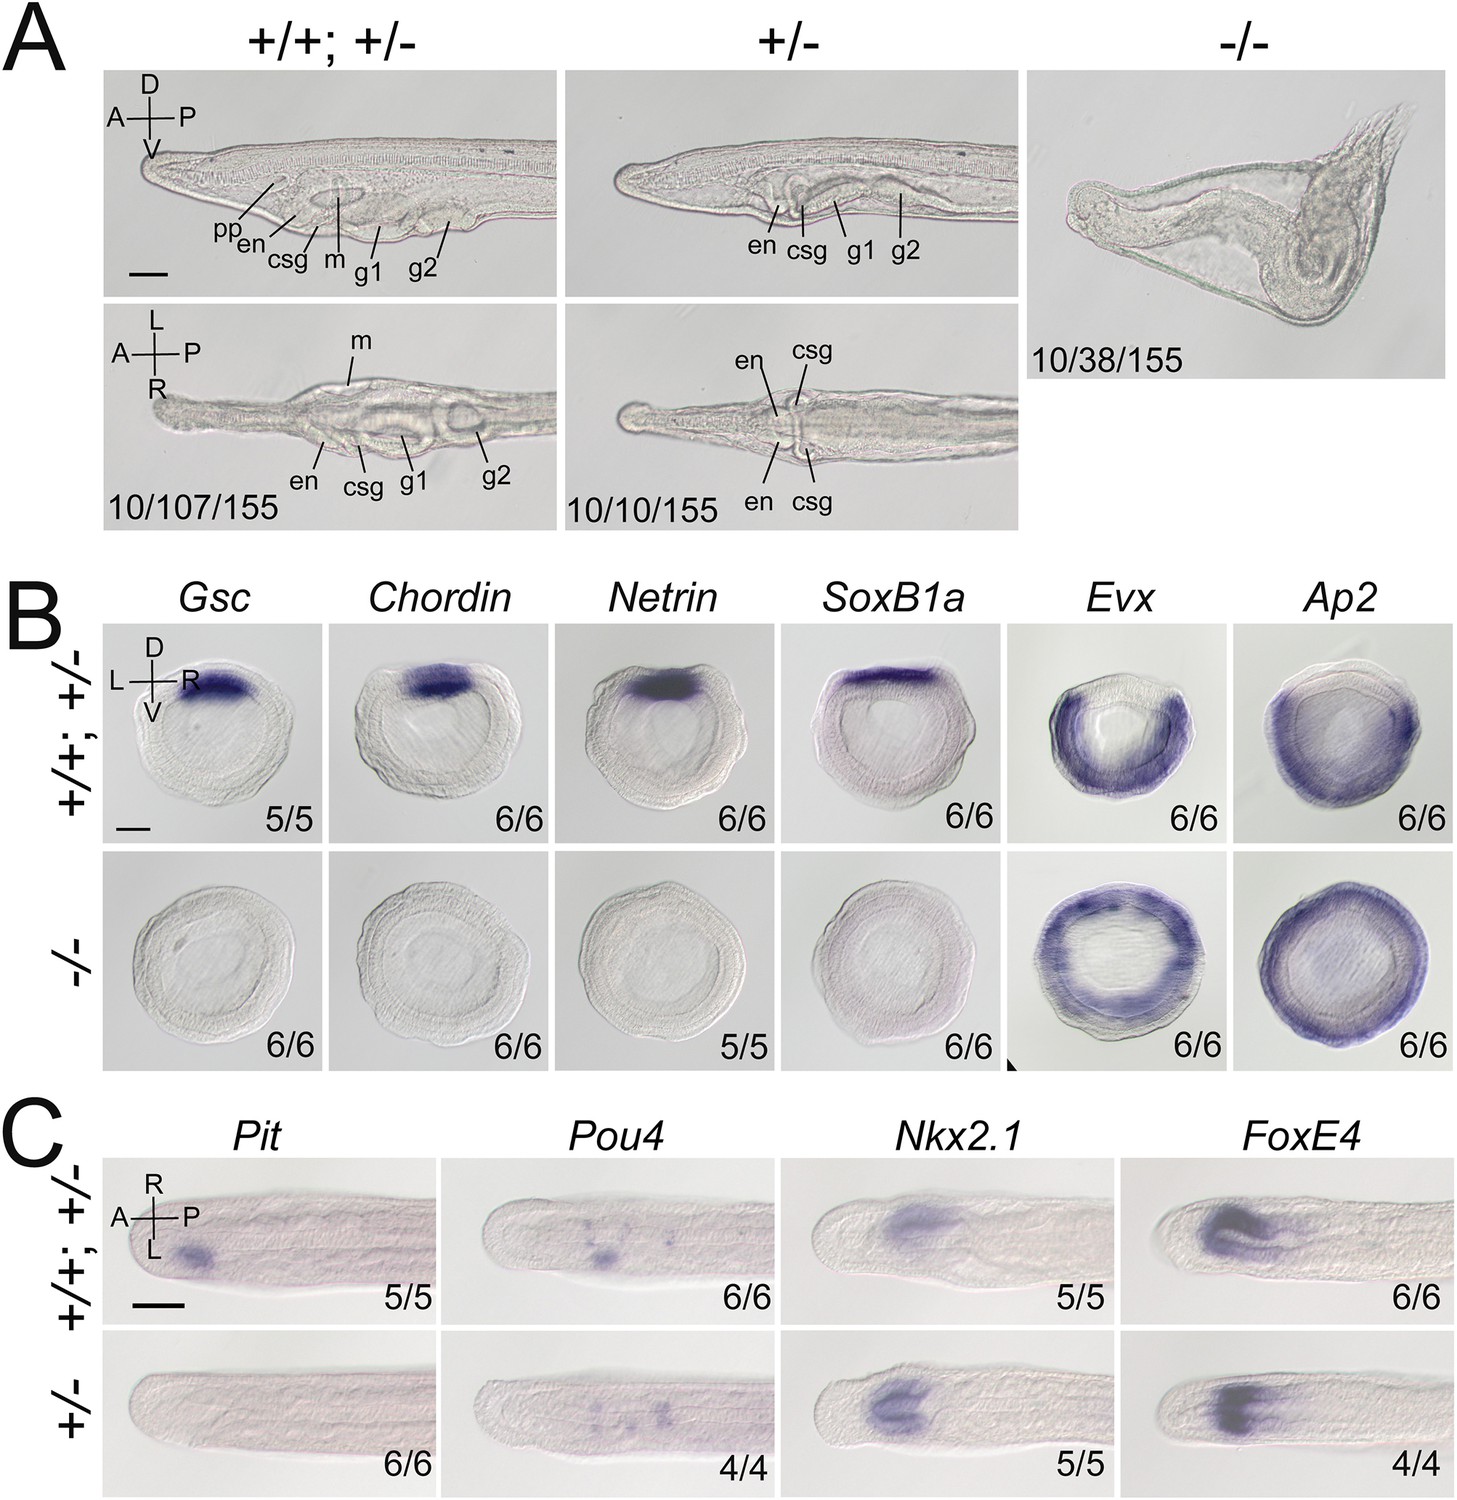
Gdf1/3-like loss-of-function affects amphioxus axes development.
(A) Phenotypic analyses of Gdf1/3-like mutants. Larvae at L2 stage were observed from the left side (upper panels) and ventral side (under panels) with anterior to the left (the A–P, D–V, and L–R axes are labeled). pp, preoral pit; en, endostyle; csg, club-shaped gland; m, mouth; g1, first gill slit; g2, second gill slit. The phenotypes of embryos from a same pool at early stages are provided in Figure 2—figure supplement 3. The three numbers (from left to right) at the bottom right of each panel indicate the number of larvae used for genotyping, the number of larvae with the phenotype, and the total number of larvae examined, respectively. (B, C) The expression of marker genes in Gdf1/3-like mutants. Embryos in (B) were at G5 stage and viewed from the blastopore with dorsal to the top (the D–V and L–R axes are labeled), while embryos in (C) were at T0–T1 stage and viewed from the dorsal side with anterior to the left (the A–P and L–R axes are labeled). Numbers at the bottom right indicate the number of times the genotype shown was identified, out of the total number of examined embryos with the expression pattern. The nomenclature +/+; +/– refer to a pool of animals with different genotypes (+/+ and +/–) in the figures of present study. Scale bars, 50 μm.
Figure 2—figure supplement 1
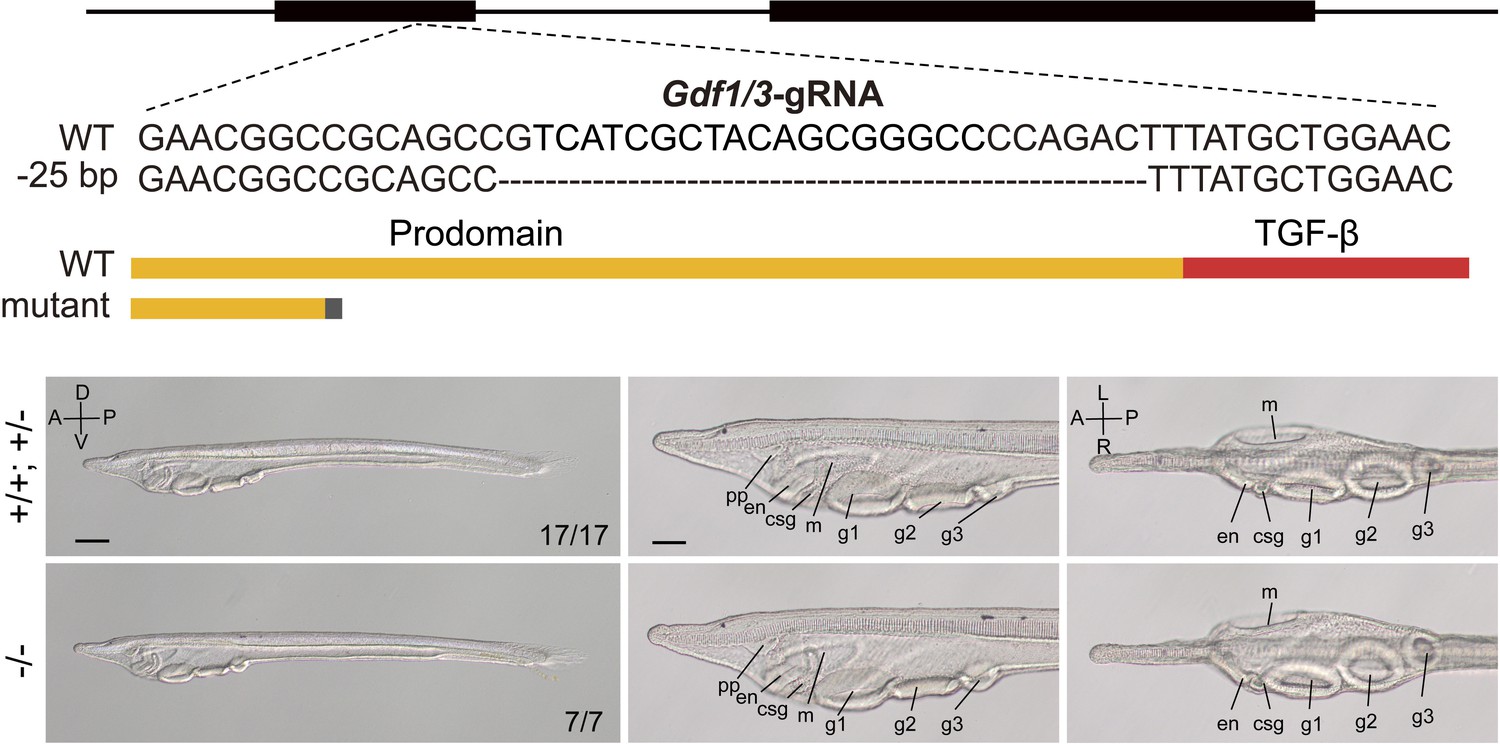
Phenotypic analysis of amphioxus Gdf1/3 mutants.
The top schematic diagram shows the exon/intron structure of Gdf1/3-coding sequence, the sgRNA used to target it, the introduced mutation (a 25-bp deletion), and the structure of the truncated proteins encoded by the mutated Gdf1/3 gene. Black boxes indicate Gdf1/3 exons. Panels in the bottom left show whole mount of Gdf1/3 larvae (L3 stage) of different genotypes (+/+, +/−, and −/−) observed from the left side with anterior to the left (the A–P and D–V axes are labeled). Numbers in the panels indicate the number of times the genotype shown was identified, out of the total number of larvae identified with the phenotype. Panels in the bottom middle and right are anterior parts of Gdf1/3 larvae, respectively, observed from the left side and ventral side (the A–P and L–R axes are labeled), with anterior to the left. pp, preoral pit; en, endostyle; csg, club-shaped gland; m, mouth; g1, first gill slit; g2, second gill slit; g3, third gill slit. Scale bars in panels on the left are 100 μm, and those in other panels are 50 μm.
Figure 2—figure supplement 2
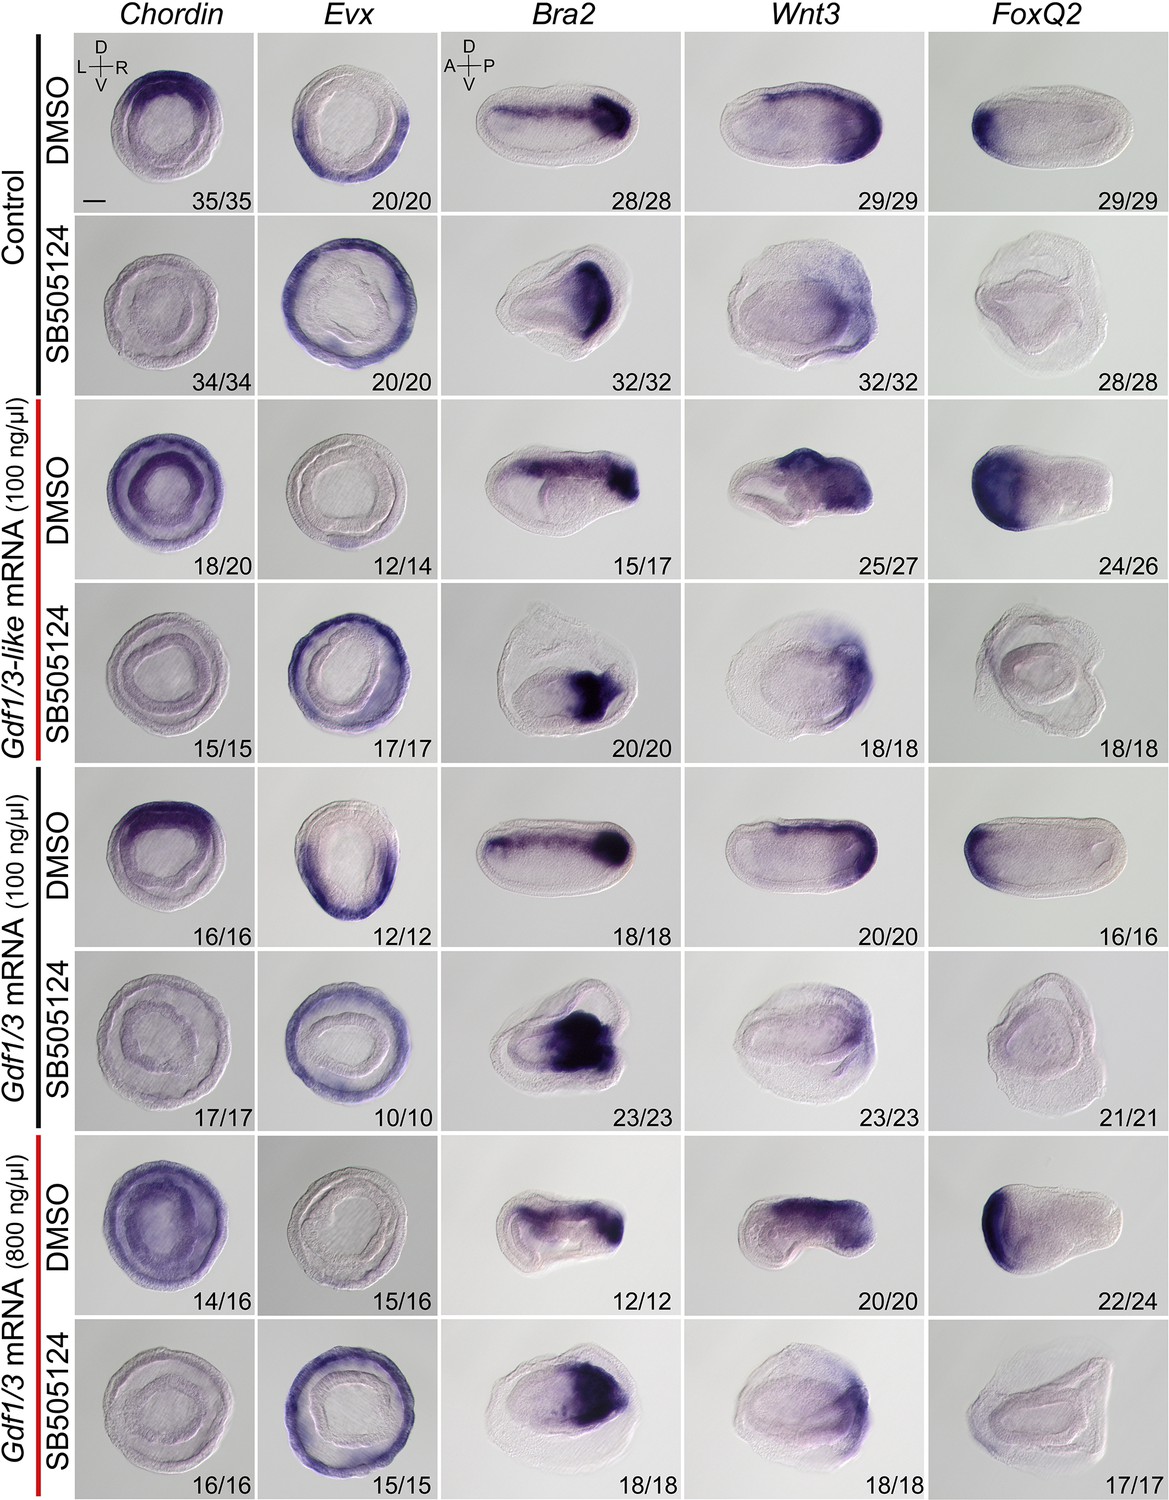
The expression of marker genes in embryos injected with Gdf1/3 or Gdf1/3-like mRNA and treated with dimethyl sulfoxide or SB505124.
Embryos stained with Chordin and Evx probes were at G4 stage and observed from the blastopore with dorsal to the top (the D–V and L–R axes are labeled). Embryos stained with Brachyury, Wnt3, and FoxQ2 probes were at N3 stage and observed from the left side with anterior to the left (the A–P and D–V axes are labeled). Numbers at the bottom right of each panel indicate the number of times the expression pattern shown was observed, out of the total number of examined embryos. DMSO, dimethyl sulfoxide. Scale bar, 50 μm.
Figure 2—figure supplement 3
Phenotypic analysis of Gdf1/3-like mutants and the expression of marker genes in Gdf1/3-like mutants.
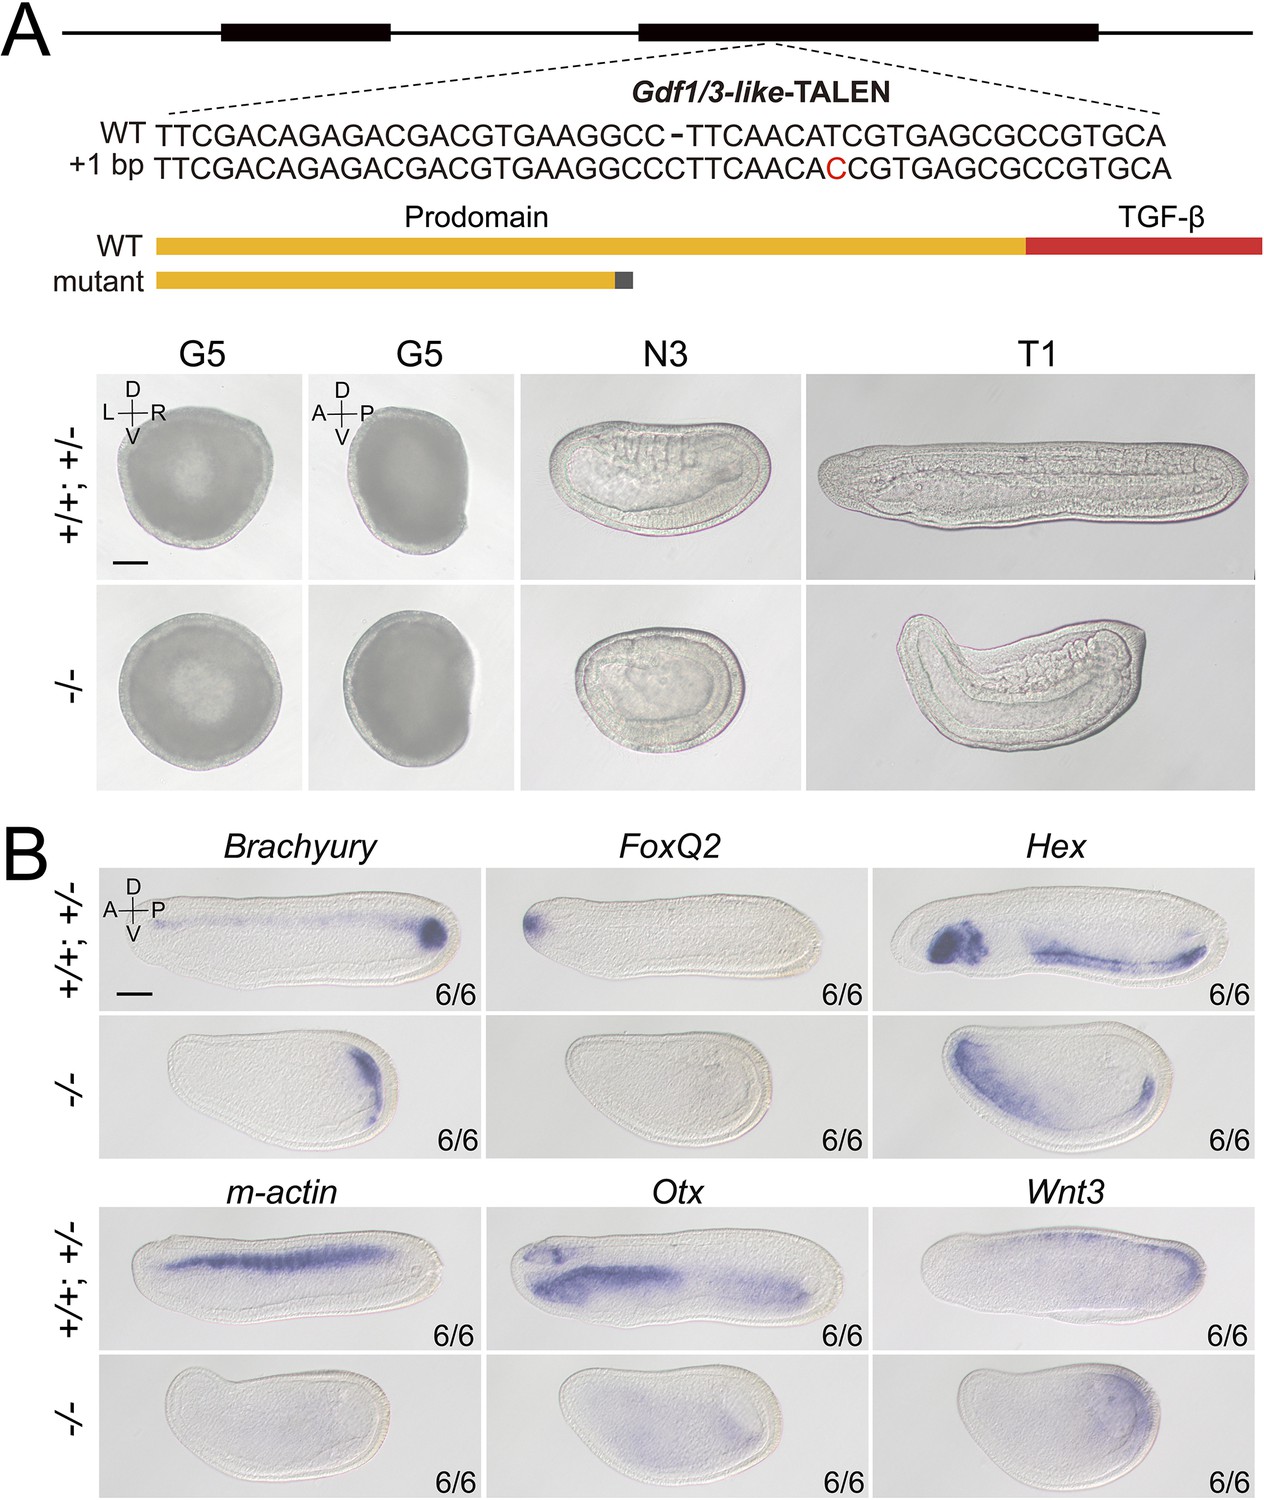
(A) The top schematic diagram shows the exon/intron structure of Gdf1/3-like-coding region, the TALEN used to target it, the introduced mutation (a 1-bp insertion), and the structure of the truncated proteins encoded by the mutated Gdf1/3-like gene. Black boxes indicate exons. Panels in the bottom show Gdf1/3-like embryos of different genotypes (+/+, +/−, and −/−) from a same pool in Figure 2. Embryos at G5 stage were observed from either the blastopore with dorsal to the top (right ones, the D–V and L–R axes are labeled), or from the left side with anterior to the left (left ones, the A–P and D–V axes are labeled). Embryos at other stages were observed from the left side with anterior to the left (the A–P and D–V axes are labeled). (B) All embryos were observed from the left side with anterior to the left at T0 stage (the A–P and D–V axes are labeled). Numbers at the bottom right indicate the number of times the genotype shown was identified, out of the total number of embryos identified with the phenotype or expression pattern. Scale bars, 50 μm.
Figure 2—figure supplement 4
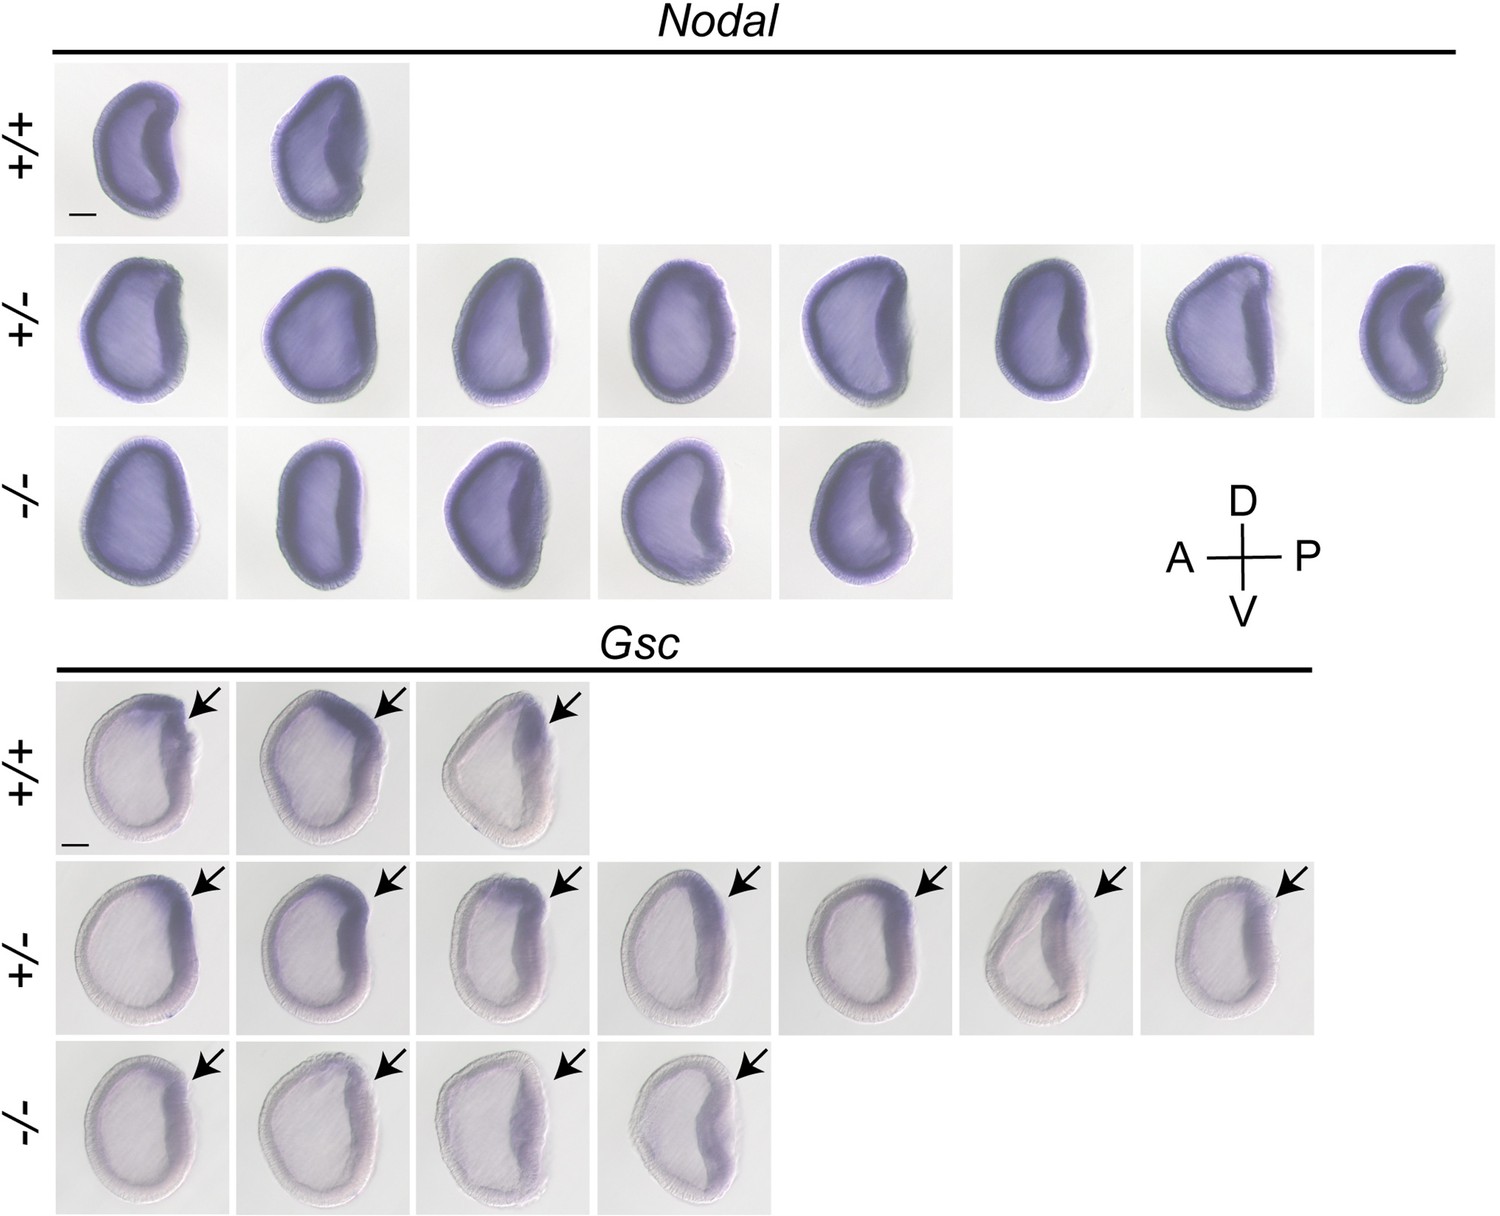
The expression pattern of Nodal and Gsc in Gdf1/3-like mutants at G1 stage.
All embryos identified with each genotype (+/+, +/−, and −/−) in the analyses were shown and they were all viewed from the left side with anterior to the left (the A–P and D–V axes are labeled). Arrows indicate the domain (the dorsal blastopore lip) of Gsc expression in each embryo. Scale bars, 50 μm.
Figure 3 with 4 supplements
Nodal gene is required for amphioxus axis development.
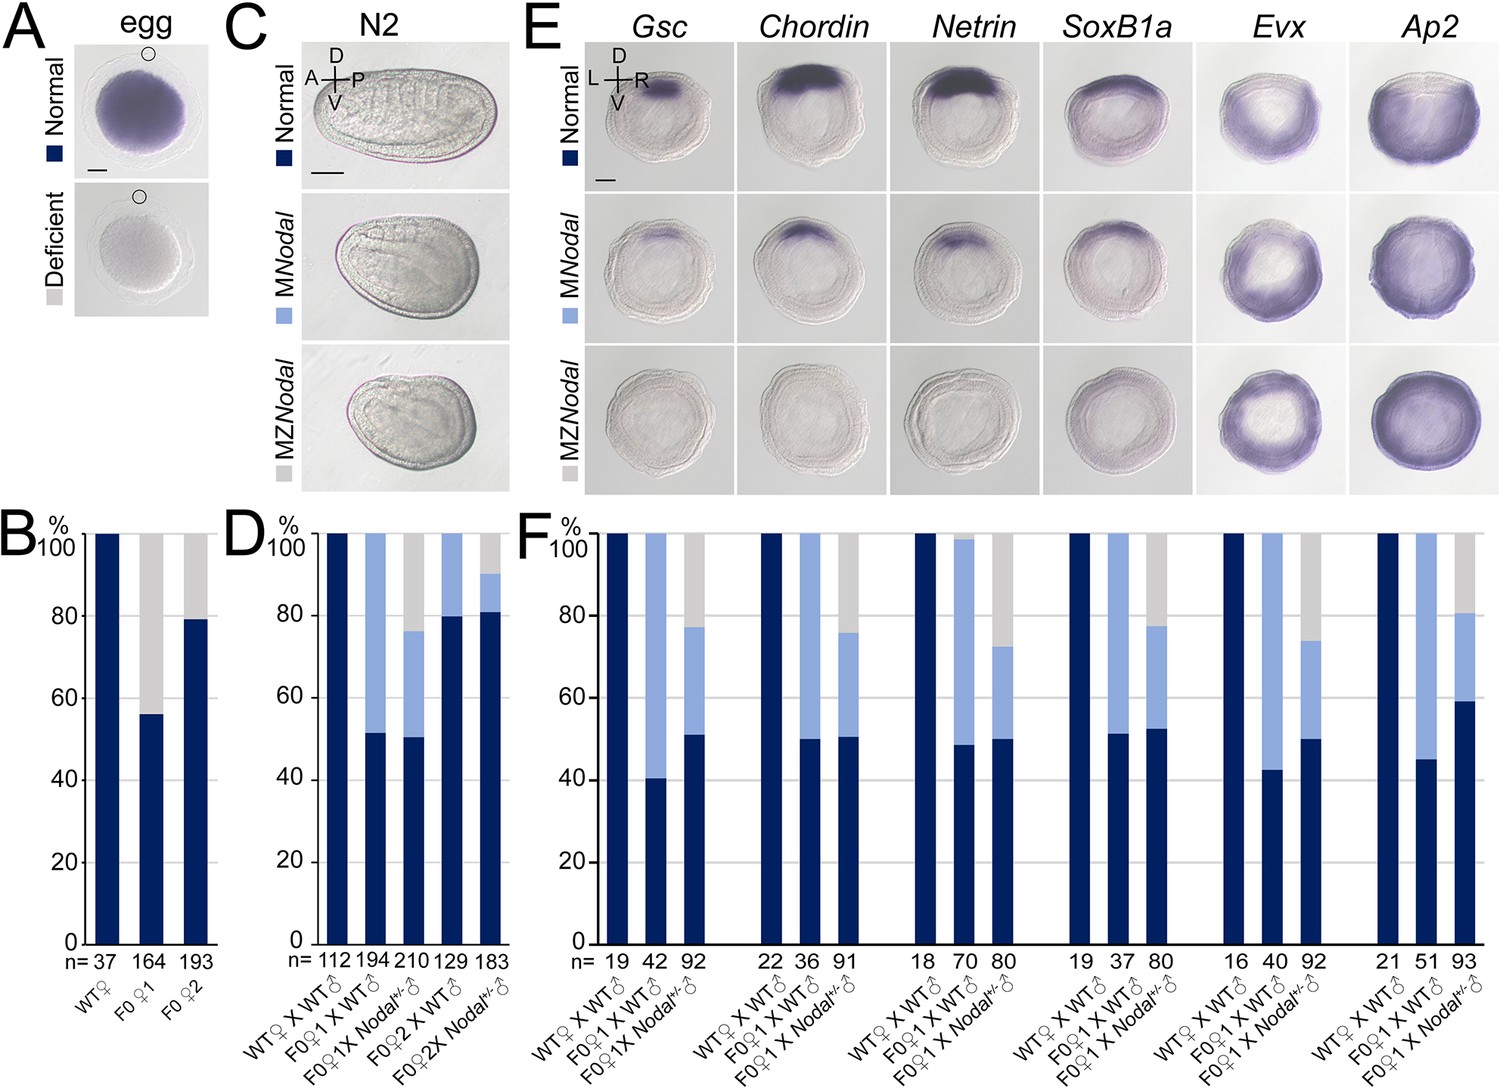
(A) Nodal expression in amphioxus eggs from different females (wild-type [WT], founder 1 [F0♀1] and founder 2 [F0♀2]). They were observed with animal pole to the top (circles indicate polar body). Two types of Nodal expression (normal and deficient) were observed. (B) Histogram showing the percentage of eggs of normal or deficient maternal Nodal accumulation from different females. (C) Phenotypic analyses of maternal (MNodal) and maternal–zygotic (MZNodal) Nodal mutants. They were observed from the left side with anterior to the left at N2 stage (the A–P and D–V axes are labeled). Phenotype of the two mutants from a same pool at other stages are provided in Figure 3—figure supplement 2. (D) The percentage of embryos of different phenotypes as shown in (C). Embryos from five different crosses were examined. (E) The expression of marker genes in MNodal and MZNodal mutants at G5 stage. All embryos were viewed from the blastopore with dorsal to the top (the D–V and L–R axes are labeled). (F) The percentage of embryos showing different expression patterns (normal, MNodal, and MZNodal) as indicated in (E). Embryos from three different crosses were examined. Scale bars, 50 μm (A, C, E). The total number of analyzed eggs or embryos are listed under each column (B, D, F).
-
Figure 3—source data 1
The number of eggs or embryos with different phenotypes or expression patterns.
- https://cdn.elifesciences.org/articles/89615/elife-89615-fig3-data1-v1.xlsx
Figure 3—figure supplement 1
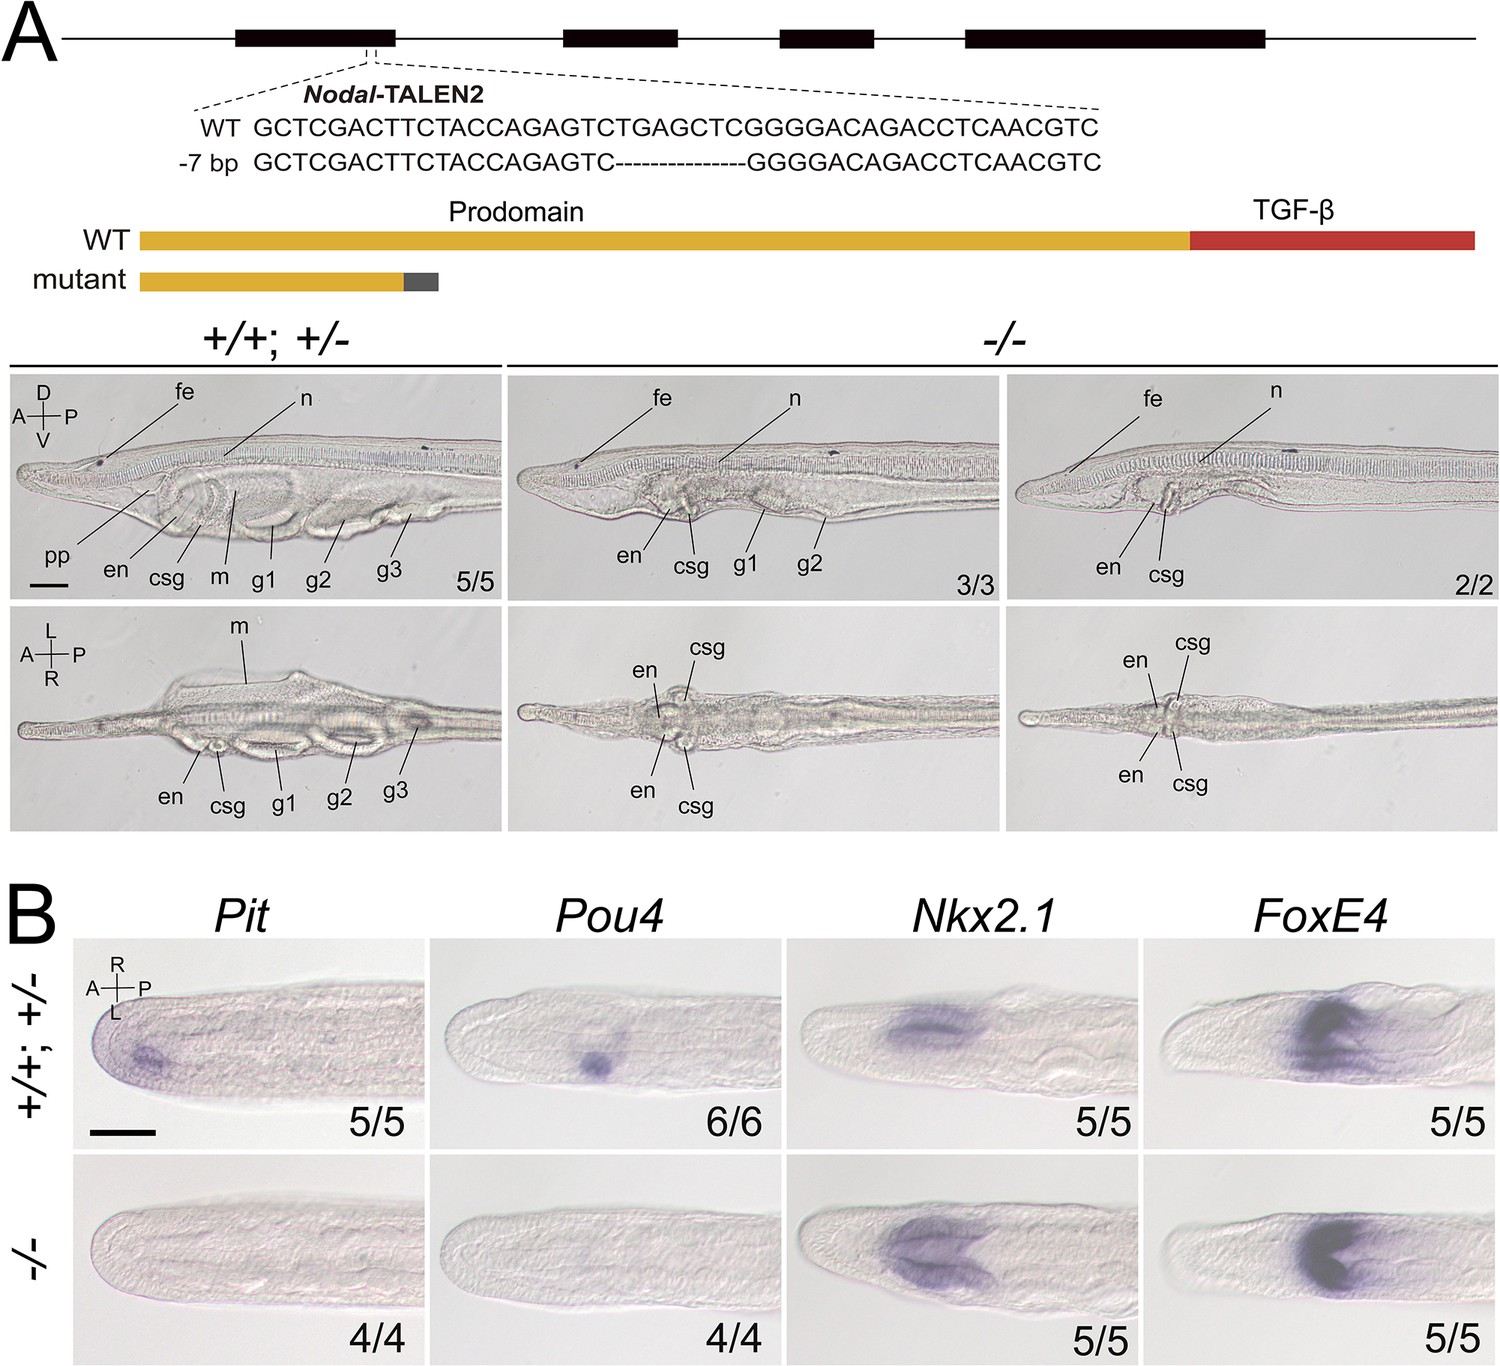
Phenotypic analysis of zygotic Nodal mutants and the expression of marker genes in zygotic Nodal mutants.
(A) The top schematic diagram shows the exon/intron structure of Nodal-coding sequence, the TALEN used to target it, the introduced mutation (a 7-bp deletion), and the structure of the truncated proteins encoded by the mutated Nodal gene. Black boxes indicate exons. Panels in the bottom show the anterior part of Nodal larvae (L3 stage) of different genotypes (+/+, +/−, and −/−), observed from the left side (upper panels, the A–P and D–V axes are labeled) and ventral side (lower panels, the A–P and L–R axes are labeled) with anterior to the left. Numbers at the bottom right indicate the number of times the genotype shown was identified, out of the total number of larvae identified with the phenotype. pp, preoral pit; en, endostyle; csg, club-shaped gland; m, mouth; g1, first gill slit; g2, second gill slit; g3, third gill slit; n, notochord; fe, frontal eye. Nodal−/− mutants have L–R defects but no obvious D–V or A–P defects (the anterior and dorsal structures, such as notochord and frontal eye, were formed normally). (B) All panels are anterior parts of embryos observed from the dorsal side at T0–T1 stage, with anterior to the left (the A–P and L–R axes are labeled). Numbers at the bottom right indicate the number of times the genotypes shown were identified, out of the total number of examined embryos with the expression pattern. Scale bars, 50 μm.
Figure 3—figure supplement 2
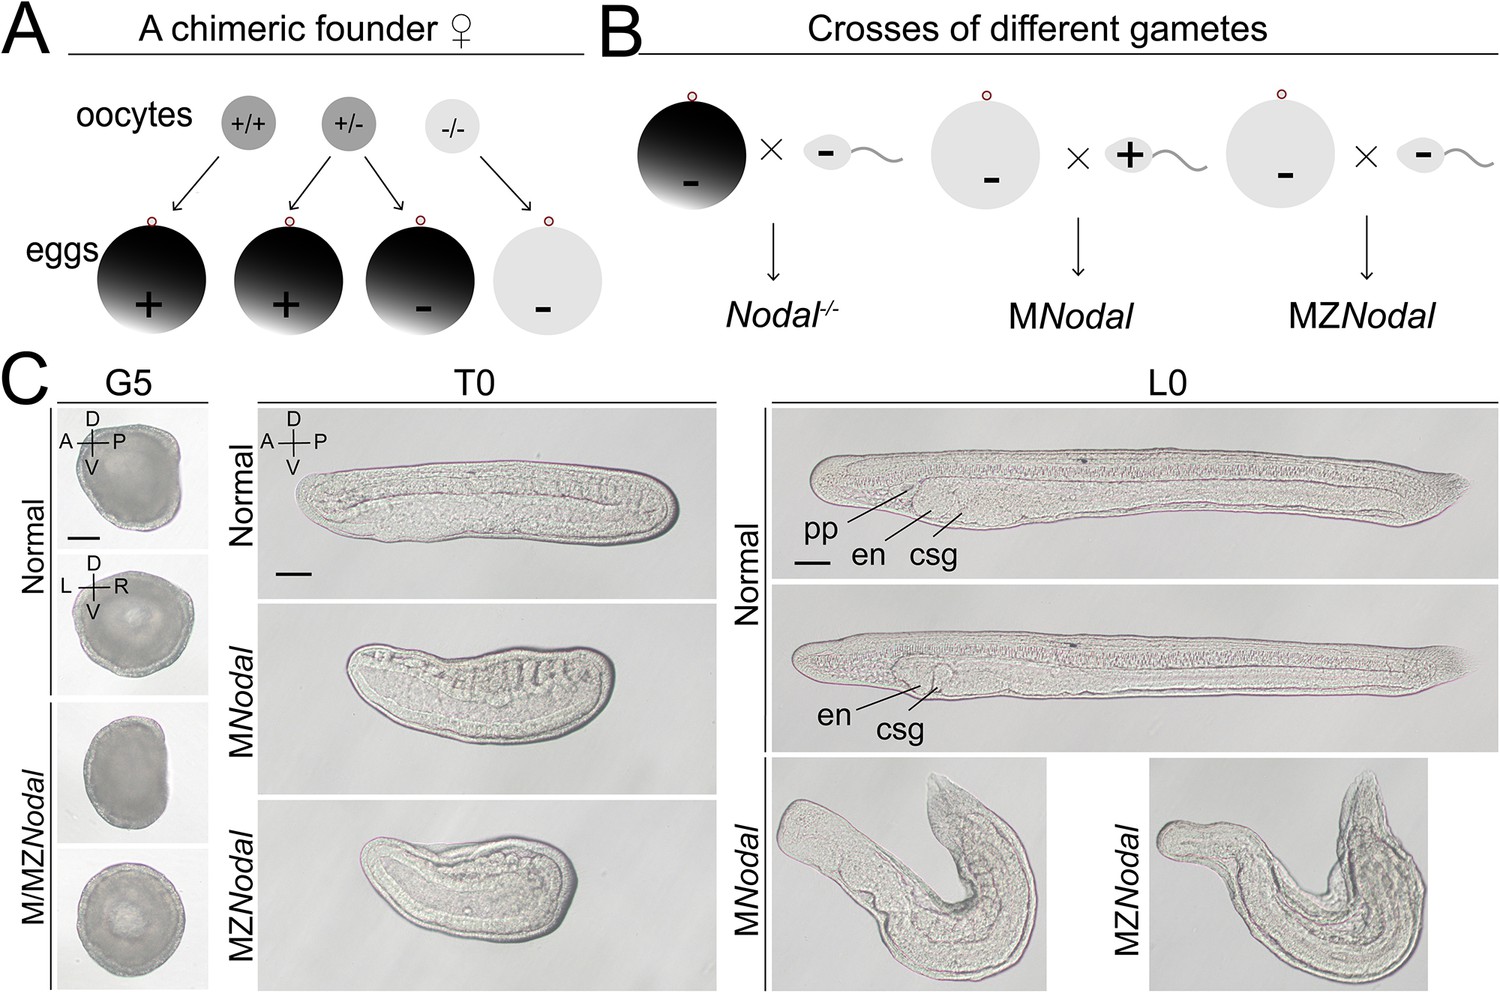
Phenotypic analysis of maternal and maternal–zygotic Nodal mutants.
(A) Schematic diagram shows how the eggs without maternal Nodal accumulation are acquired from chimeric female founders injected with TALEN or Cas9/sgRNA. Dark gray indicates deposited maternal Nodal mRNA, while light gray marks no maternal Nodal mRNA accumulation. (B) Schematic diagram shows how zygotic (Nodal−/−), maternal (MNodal), and maternal–zygotic Nodal (MZNodal) mutants used in the study are generated. (C) Phenotypic analysis of maternal and maternal–zygotic Nodal mutants from a same pool in Figure 3. Embryos at G5 stage were viewed from the left side (upper panels, the A–P and D–V axes are labeled) or blastopore (lower panels, the D–V and L–R axes are labeled), with dorsal to the top. Embryos at T0 and larvae at L0 stages were viewed from the left side with anterior to the left (the A–P and D–V axes are labeled). pp, preoral pit; en, emdostyle; csg, club-shaped gland. Scale bars, 50 μm.
Figure 3—figure supplement 3
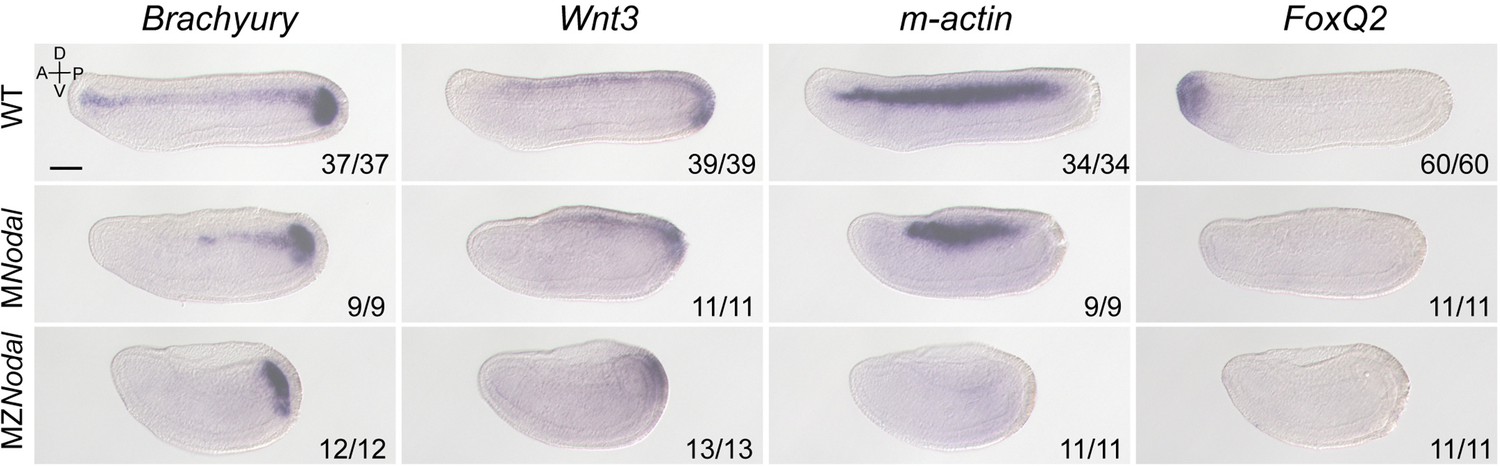
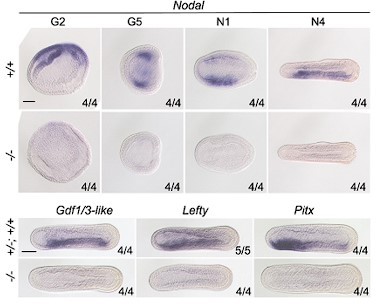
The expression of marker genes in maternal and maternal–zygotic Nodal mutants at T0 stage.
All embryos were viewed from the left side with anterior to the left (the A–P and D–V axes are labeled). MNodal and MZNodal mutants were distinguished from their siblings based on their phenotypes. Numbers at the bottom right of each panel indicate the number of times the expression pattern shown was observed, out of the total number of examined embryos. Scale bar, 50 μm.
Figure 3—figure supplement 4
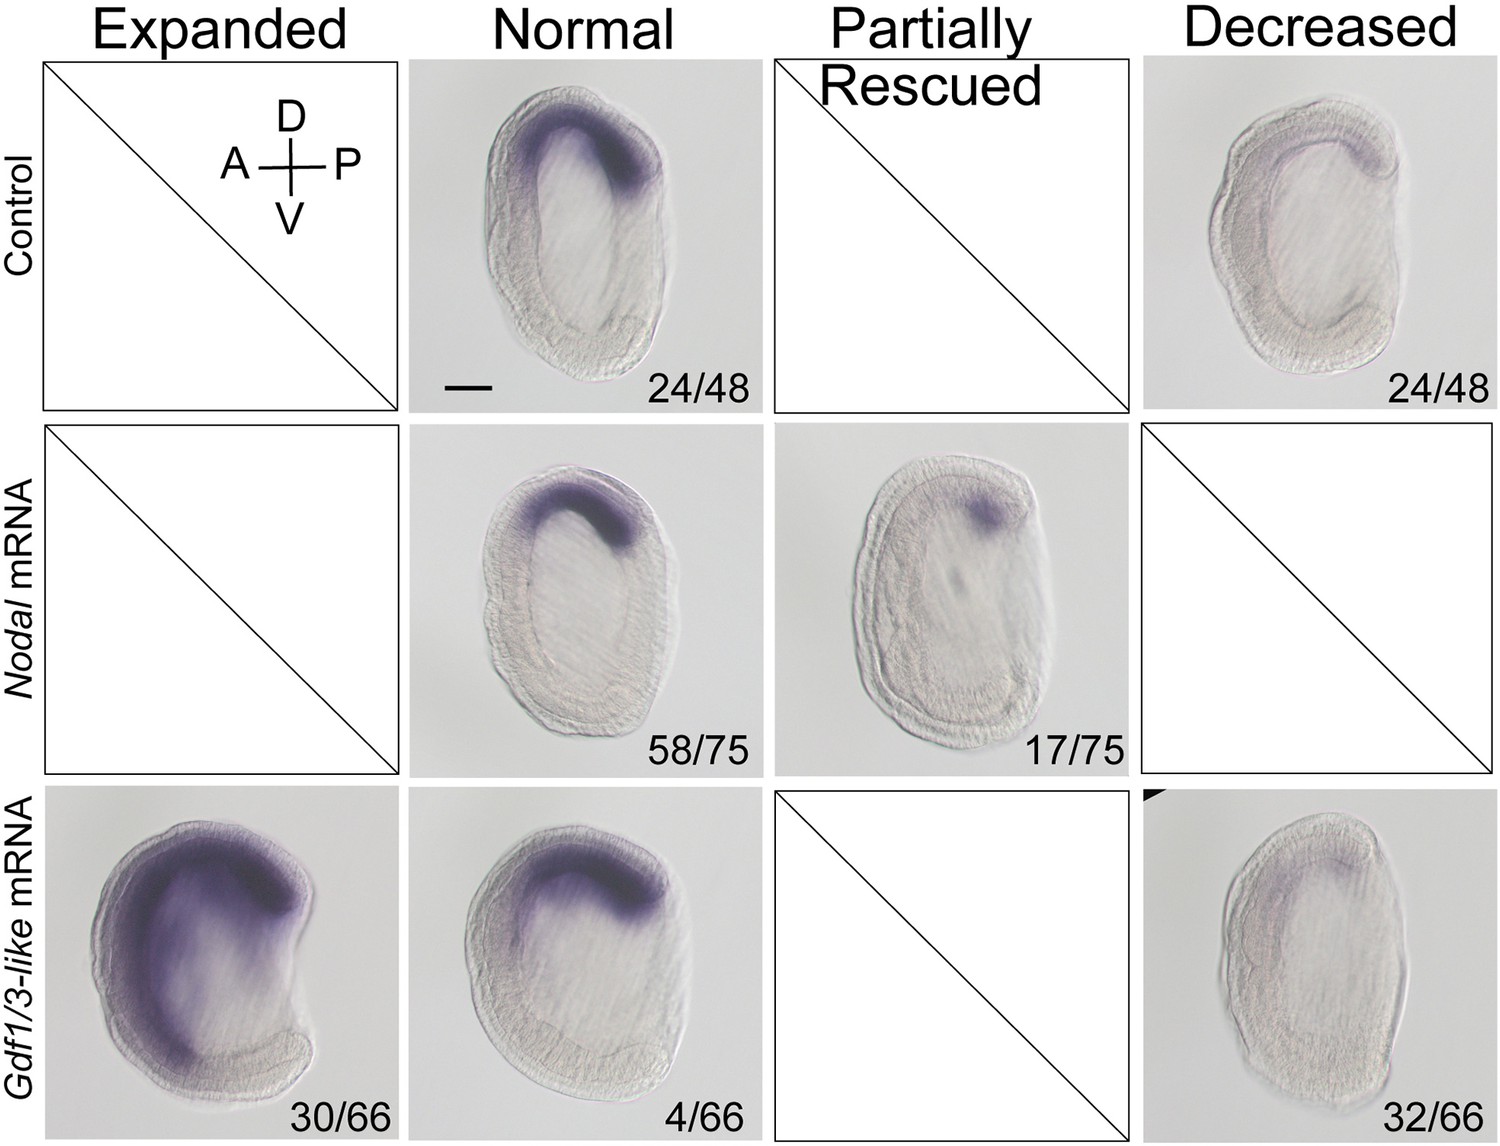
The expression of Gsc in maternal Nodal mutants injected with Nodal or Gdf1/3-like mRNA.
Eggs from the female founder 1 (F0♀1) were, respectively, injected with Nodal and Gdf1/3-like mRNA, and then fertilized with sperms from a wild-type (WT) male. Uninjected eggs from the same animal were also fertilized with sperms from the same WT male and used as control. They were collected at G5 stage for in situ analysis. In control embryos, two types of Gsc expression pattern (normal and decreased) were observed, while in Nodal mRNA and Gdf1/3-like mRNA injected embryos, two (normal and partially rescued) and three (expanded, normal, and decreased) types of Gsc expression pattern were, respectively, found. The number of embryos showing each Gsc expression pattern out of the total number of examined embryos are shown in the bottom of each panel. All embryos were viewed from the left side with anterior to the left (the A–P and D–V axes are labeled). Scale bar, 50 μm.
Figure 4 with 2 supplements
Regulatory activity of the intergenic region between Gdf1/3-like and Lefty genes.
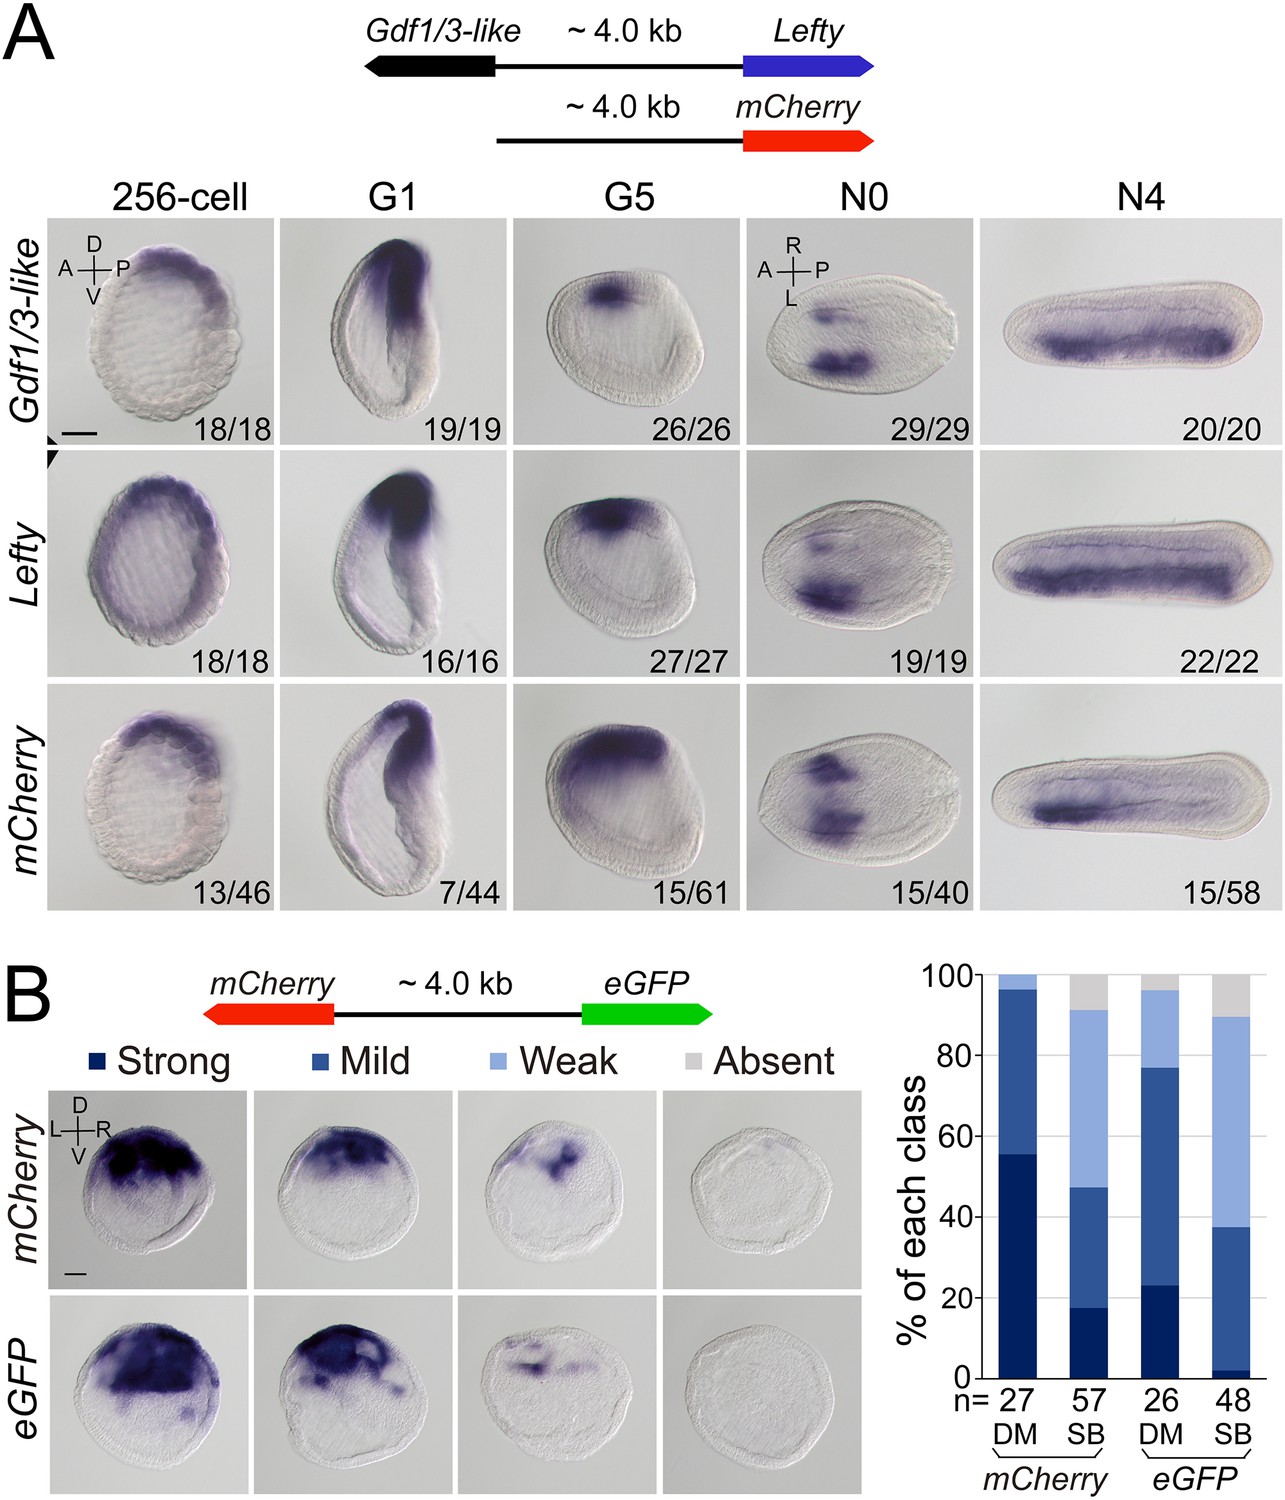
(A) The top schematic diagram shows the 4 kb region between Gdf1/3-like and Lefty and the construct used to generate stable amphioxus transgenic lines. Embryos used for in situ analysis were from a cross between a female founder and a wild-type (WT) male. The bottom panels show the expression patterns of Gdf1/3-like, Lefty, and mCherry reporter in transgenic embryos. Embryos at 256-cell to G5 stages were viewed from the left side (the A–P and D–V axes are labeled), and those at N0 and N4 stages were viewed from the dorsal side (the A–P and L–R axes are labeled). Numbers at the bottom right of each panel indicate the number of times the expression pattern was observed, out of the total number of examined embryos. (B) The left top schematic diagram shows the dual-reporter construct used in this analysis, and the panels below it shows the expression of mCherry and eGFP in embryos injected with the construct and then treated with dimethyl sulfoxide (DM) or SB505124 (SB). All embryos are at G1 stage viewed form the blastopore with dorsal to the top (the D–V and L–R axes are labeled). Four categories of expression (strong, mild, weak, and absent) for both mCherry and eGFP were observed in the dorsal blastopore lip of embryos, and their percentages are shown in the right histogram. The total number of analyzed embryos are listed under each column. Scale bars, 50 μm. The effect of SB505124 treatment on Nodal signaling was validated by the phenotype of larvae treated (shown in Figure 4—figure supplement 2).
-
Figure 4—source data 1
The number of embryos with different expression patterns.
- https://cdn.elifesciences.org/articles/89615/elife-89615-fig4-data1-v1.xlsx
Figure 4—figure supplement 1
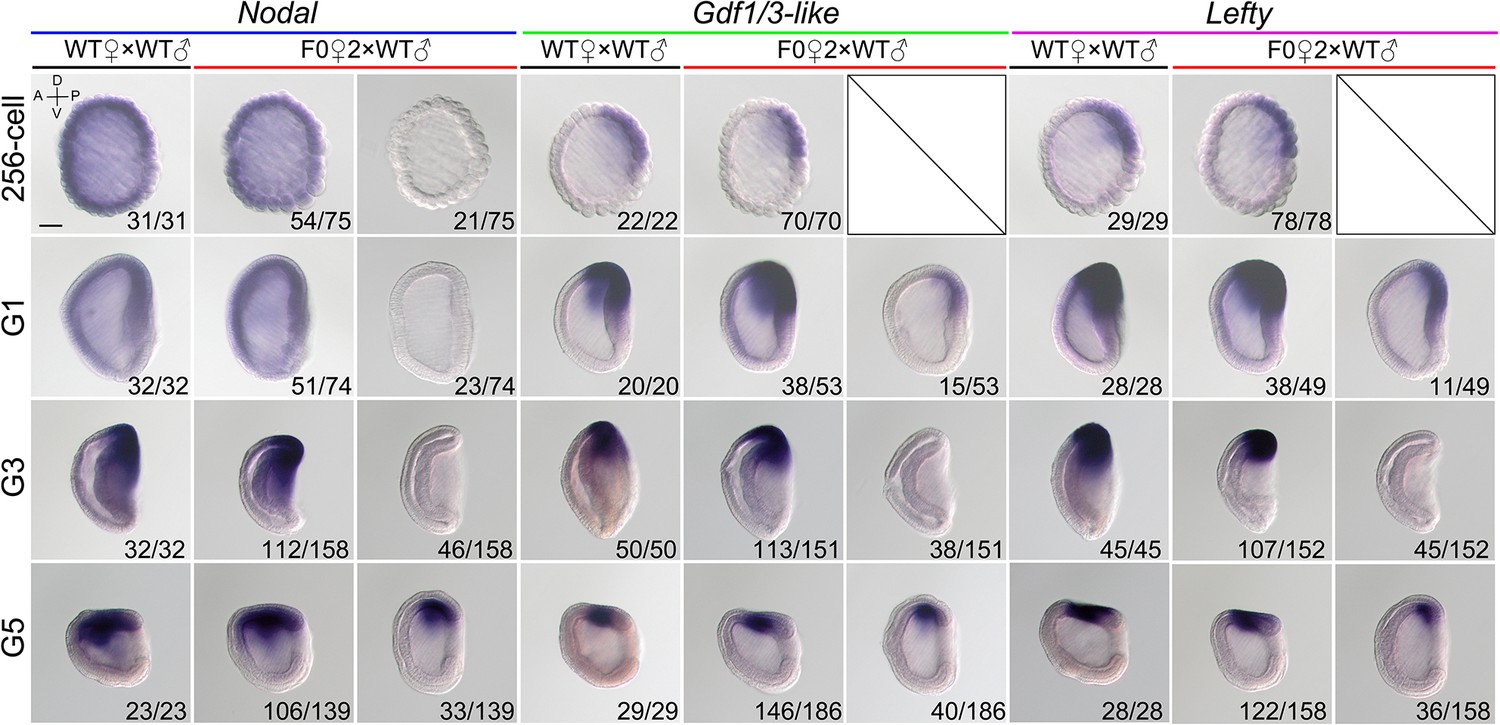
The expression of Nodal, Gdf1/3-like, and Lefty in maternal Nodal mutants at four different stages.
All embryos were viewed from the left side with anterior to the left (the A–P and D–V axes are labeled). Numbers at the bottom right of each panel indicate the number of times the expression pattern shown was observed, out of the total number of examined embryos from each cross. Scale bar, 50 μm.
Figure 4—figure supplement 2
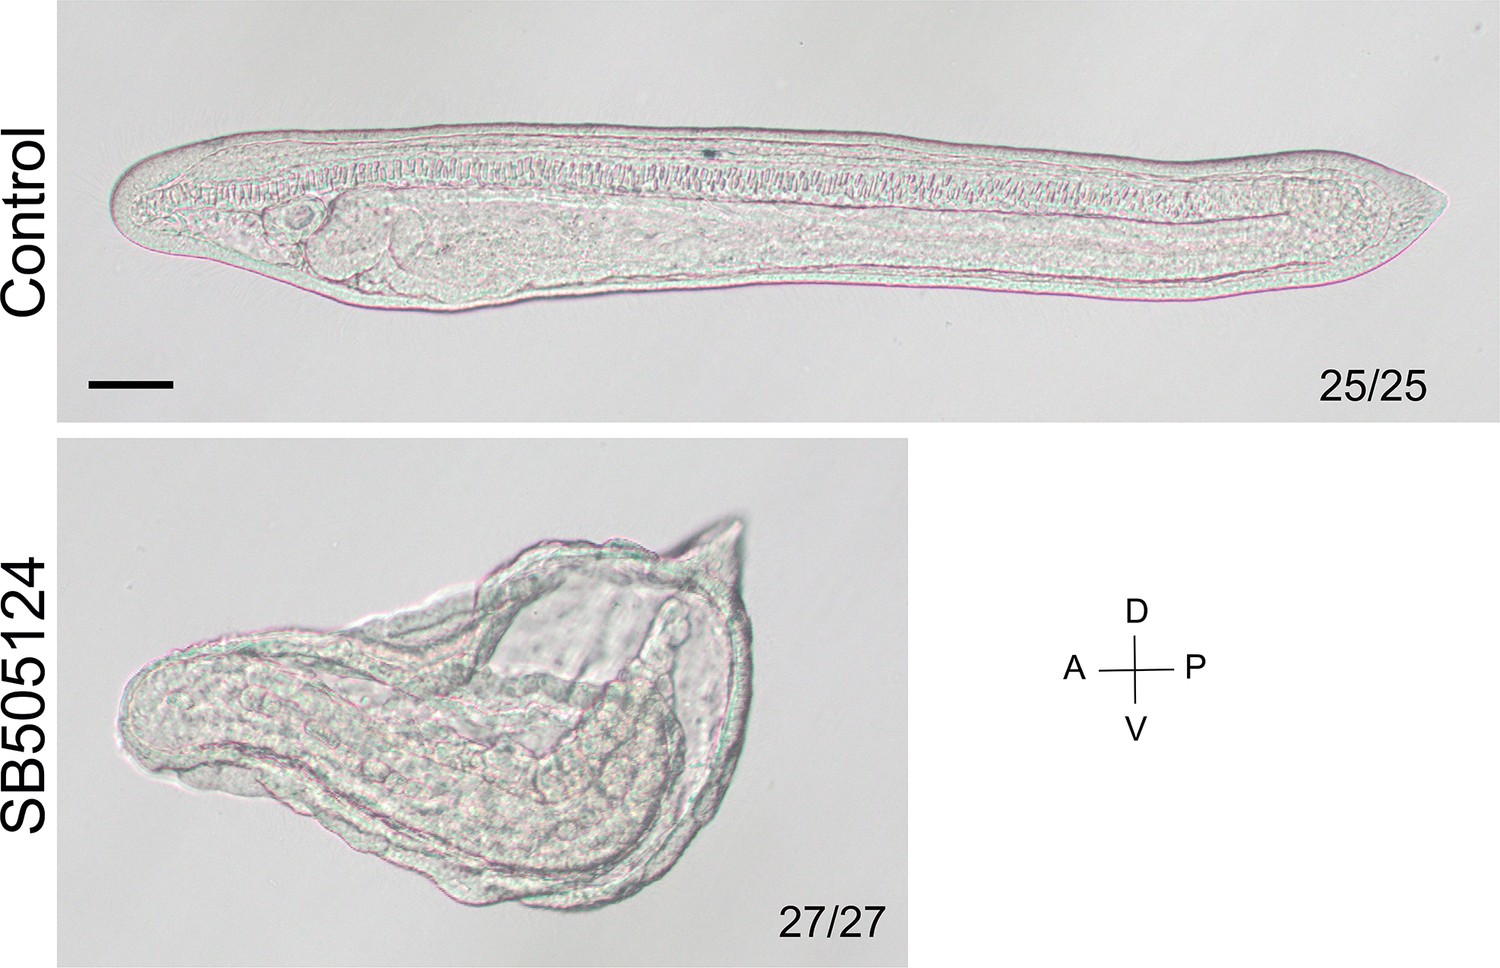
The phenotype of larvae treated with SB505124.
The larvae were at L1 stage and viewed from the left side with anterior to the left (the A–P and D–V axes are labeled). Numbers at the bottom right of each panel indicate the number of times the phenotype shown was observed, out of the total number of examined larvae. Scale bar, 50 μm. Consistent with previous study (Onai et al., 2010), the larvae treated with SB505124 failed to form dorsal and anterior structures, verifying the effectiveness on Nodal signaling.
Figure 5
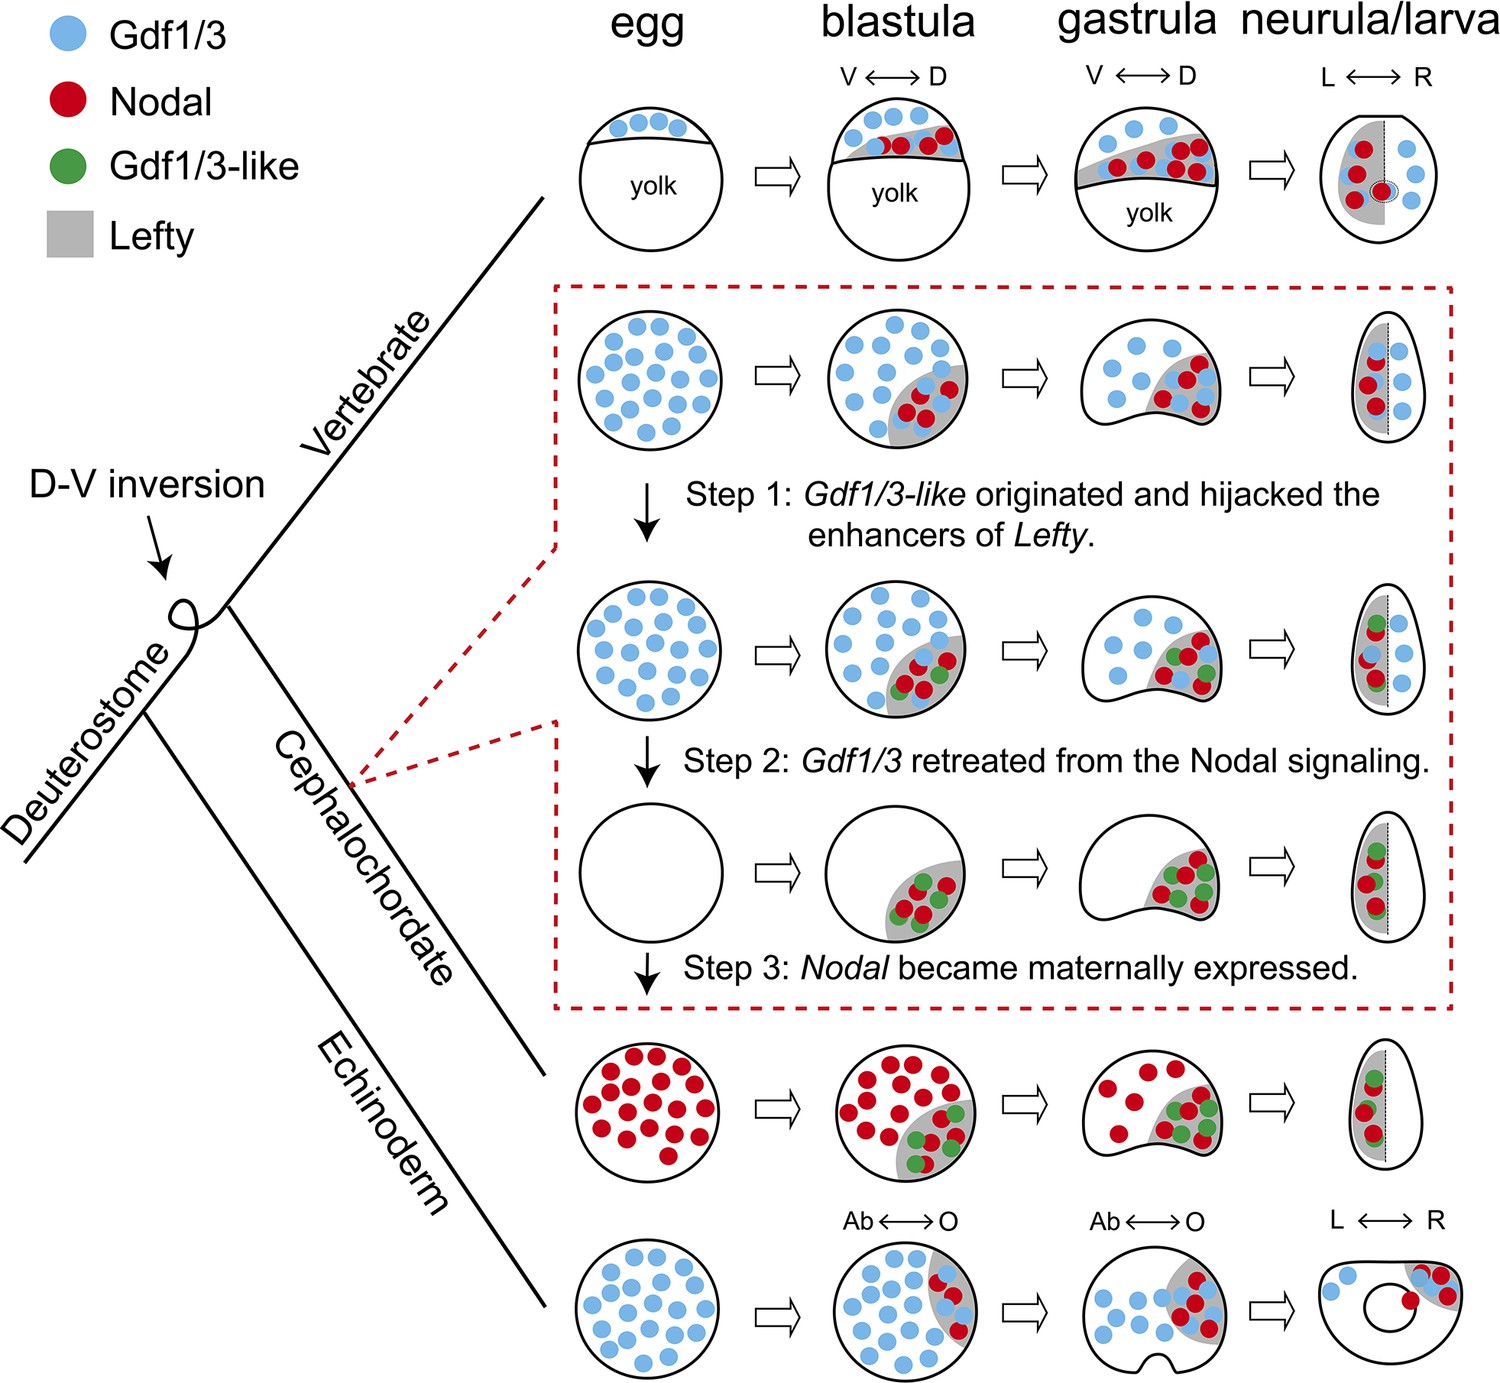
Scenario for evolution of the Nodal signaling in amphioxus.
The situation in sea urchin (echinoderm) and zebrafish (vertebrate) represents an ancestral scenario which has been rewired and modified in amphioxus through at least three sequential steps as shown in dashed box. D–V, dorsal–ventral axis; L–R, left–right axis; Ab–O, oral–aboral axis. The dorsal–ventral orientation of Chordata was inversed relative to that of Ambulacraria during evolution (Lowe et al., 2015), thus the oral and left side of sea urchin corresponds to the dorsal and right side of zebrafish and amphioxus, respectively.
Author response image 1
Additional files
-
Supplementary file 1
The expression pattern of Nodal and Gdf1/3 gene in representative deuterostomes studied previously.
(a) The expression pattern of Nodal gene in representative deuterostomes; (b) the expression pattern of Gdf1/3 and its paralogs in representative deuterostomes.
- https://cdn.elifesciences.org/articles/89615/elife-89615-supp1-v1.docx
-
MDAR checklist
- https://cdn.elifesciences.org/articles/89615/elife-89615-mdarchecklist1-v1.docx
Download links
A two-part list of links to download the article, or parts of the article, in various formats.
Downloads (link to download the article as PDF)
Open citations (links to open the citations from this article in various online reference manager services)
Cite this article (links to download the citations from this article in formats compatible with various reference manager tools)
Evolution of the gene regulatory network of body axis by enhancer hijacking in amphioxus
eLife 13:e89615.
https://doi.org/10.7554/eLife.89615


