Folding of prestin’s anion-binding site and the mechanism of outer hair cell electromotility
- Center for Mechanical Excitability, The University of Chicago, United States
- Department of Biochemistry and Molecular Biology, The University of Chicago, United States
- Institute for Neuroscience, The University of Chicago, United States
- Institute for Biophysical Dynamics, The University of Chicago, United States
- Prizker School for Molecular Engineering, The University of Chicago, United States
Figures
Figure 1 with 3 supplements
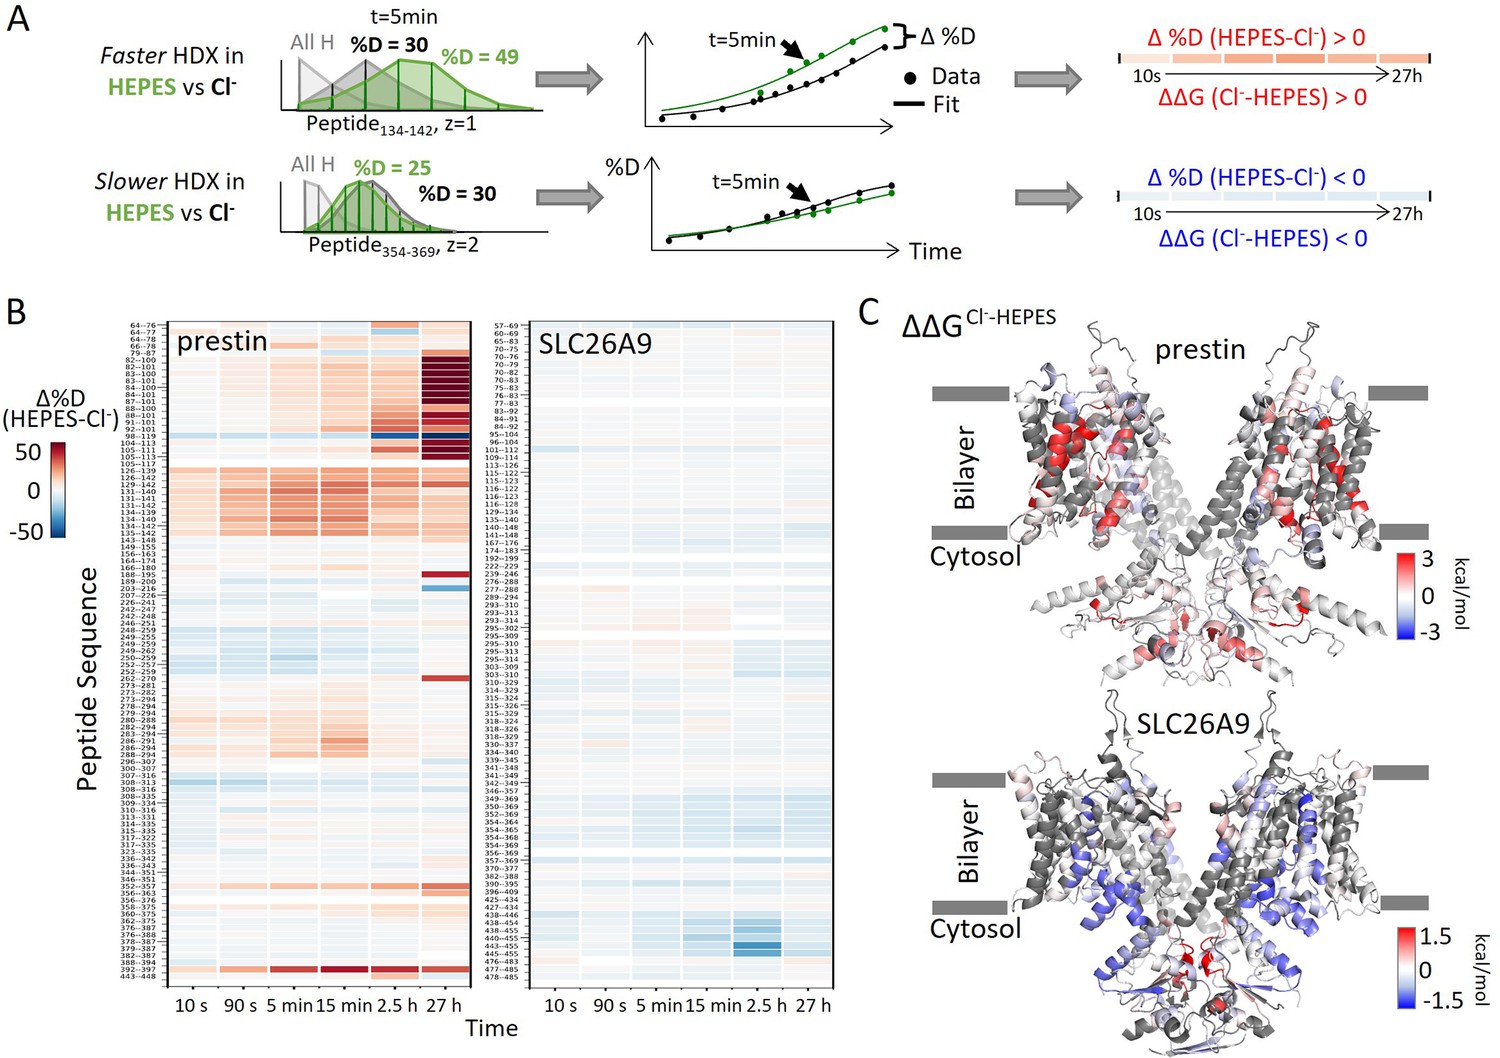
Distinct HDX response of prestin and SLC26A9 to Cl− binding.
(A) HDX data analysis to obtain (B) and (C). One example peptide is shown in cases where HDX becomes faster or slower in HEPES (the putative apo state) compared to in Cl−. Deuteration levels are obtained from the mass spectra. Here, spectra for the undeuterated peptide (gray) and after 5 min HDX labeling in Cl− (black) and HEPES (green) are shown as an example. The resulting deuterium uptake plots are used to generate the differential deuteration heatmaps in (B). Changes in free energy of unfolding (ΔΔG) in (C) are calculated after fitting the data with a stretched exponential (Materials and methods) (Hamuro, 2021). (B) Heatmaps showing the difference in deuteration levels at each labeling time for all transmembrane domain (TMD) peptides of prestin and SLC26A9 measured in HEPES compared to Cl−. Peptide sequences are displayed on the y-scale and legible through the high-resolution image. (C) The ΔΔGs in HEPES compared to Cl− for full-length prestin and SLC26A9 mapped onto the structure (PDB 7S8X and 6RTC). Red and blue indicate increased and decreased stability upon Cl− binding, respectively. Following regions of the left subunits are shown as low transparency to highlight the binding site – prestin: TM5 and TM12–14; SLC26A9: TM5 and TM13–14. Regions with no fitting results are in gray.
Figure 1—figure supplement 1
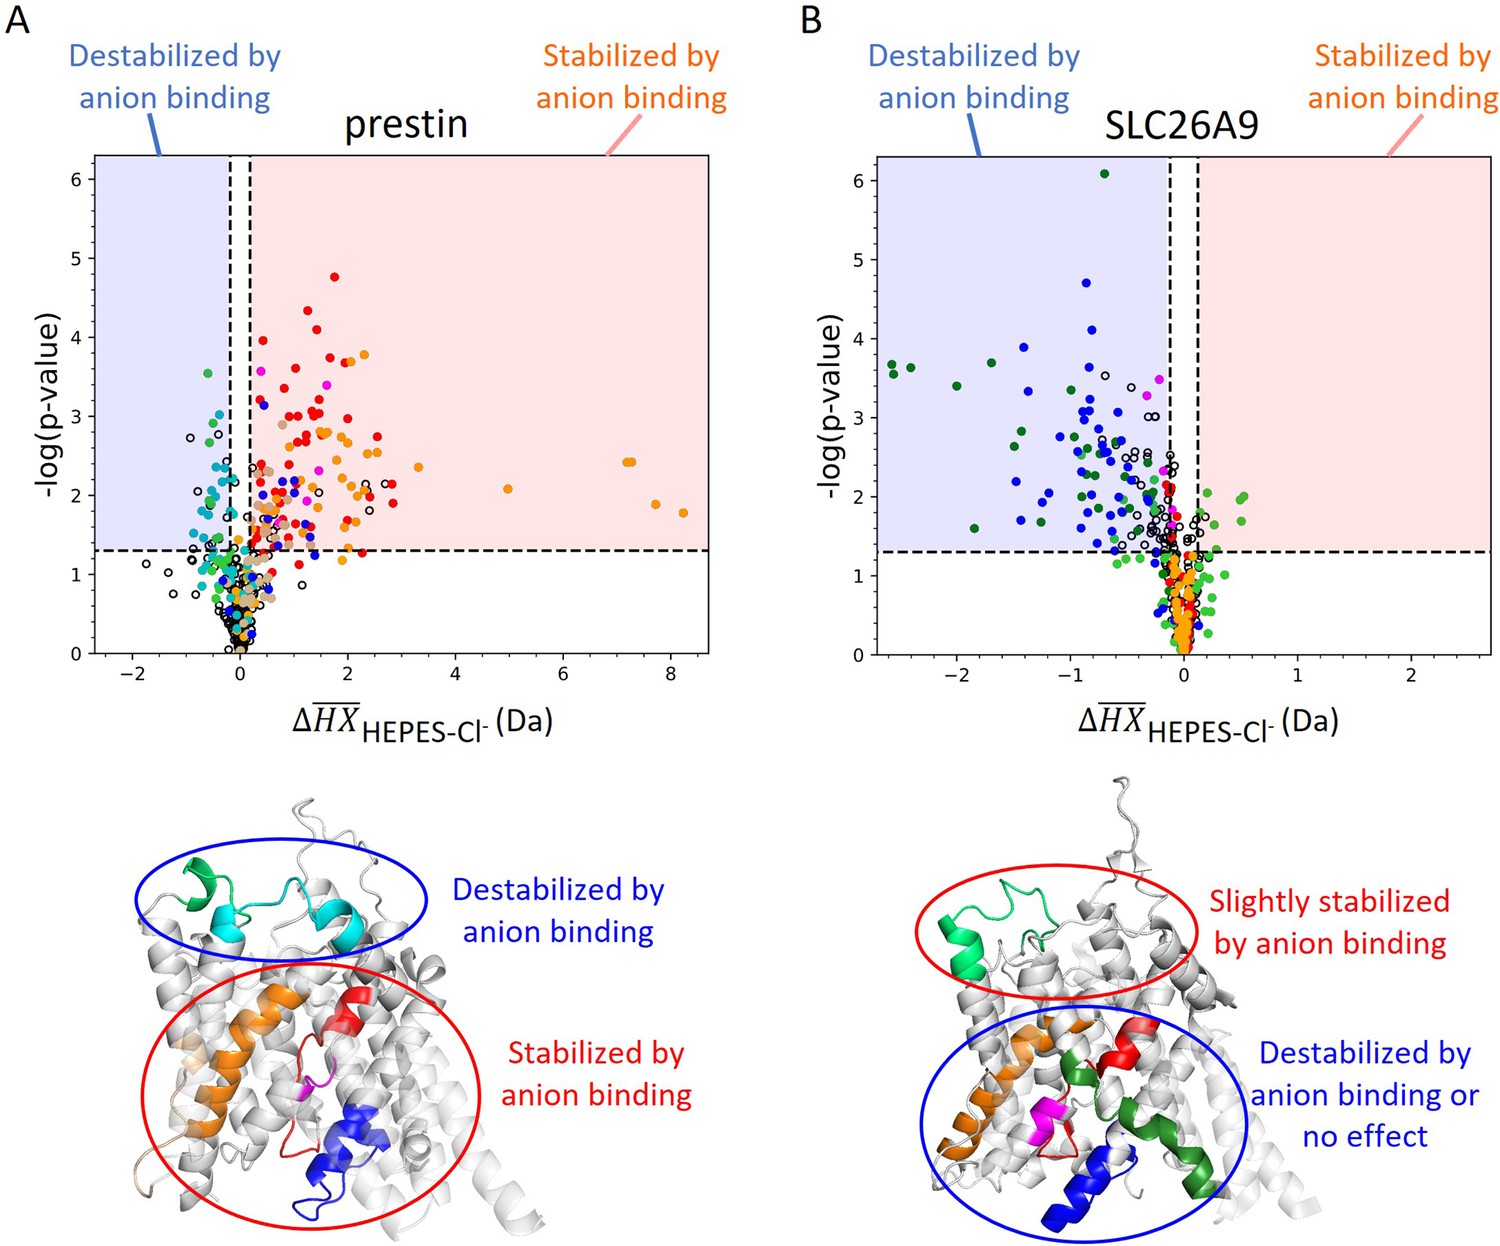
Volcano plot analysis of HDX for prestin (A) and SLC26A9 (B) in response to Cl− binding.
A hybrid statistical analysis is employed (Hageman and Weis, 2019). Each data point represents one time point of a peptide. The horizontal axis shows the difference between the observed mean peptide masses () for the protein in HEPES and in Cl−. The vertical axis shows Welch’s t-test p-values. The dashed horizontal lines denote p-value significance limits defined at α = 0.05. The dashed vertical lines denote the significance threshold corresponding to α = 0.05, calculated to be ±0.17 and ±0.11 Da for (A) prestin and (B) SLC26A9, respectively. Data points in the red and blue areas (i.e., exceeding significance limits in both dimensions) represent peptides that show statistical significance and are stabilized and destabilized upon Cl− binding, respectively. Colored data points correspond to colored regions in the corresponding transmembrane domain (TMD) structure below.
Figure 1—figure supplement 2
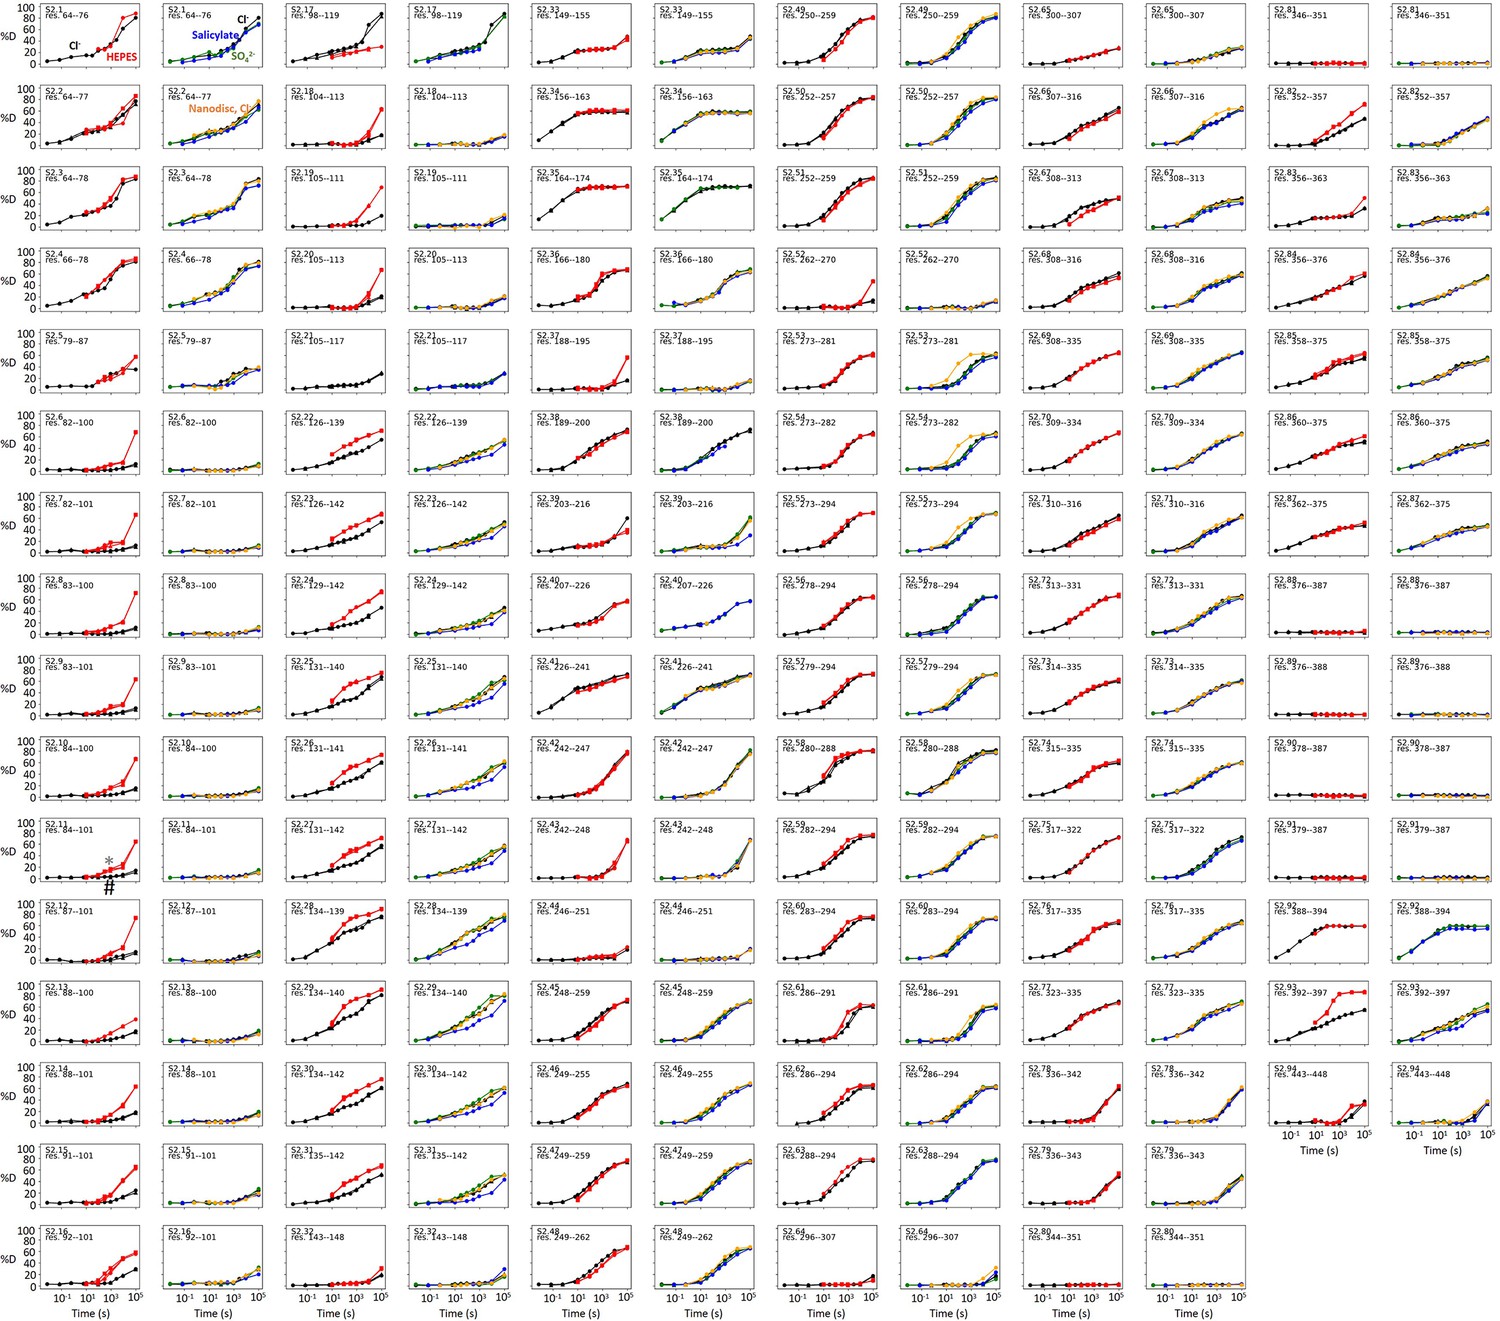
Deuterium uptake curves for all peptides covering prestin’s transmembrane domain.
Two deuterium uptake plots are shown for each peptide – left plot: Cl− (black) and HEPES (red); right plot: Cl− (black), SO42− (green), salicylate (blue), and prestin in nanodisc in Cl− (orange). Except for the orange curves, all other HDX data were collected on glyco-diosgenin (GDN)-solublized prestin. Replicates (circles, triangles, and squares): 2 in Cl−, 3 in HEPES, biological. Peptides covering TM9 (S2.88–S2.91) exhibited EX1 behavior in HEPES (Appendix 1—figure 2).
Figure 1—figure supplement 3
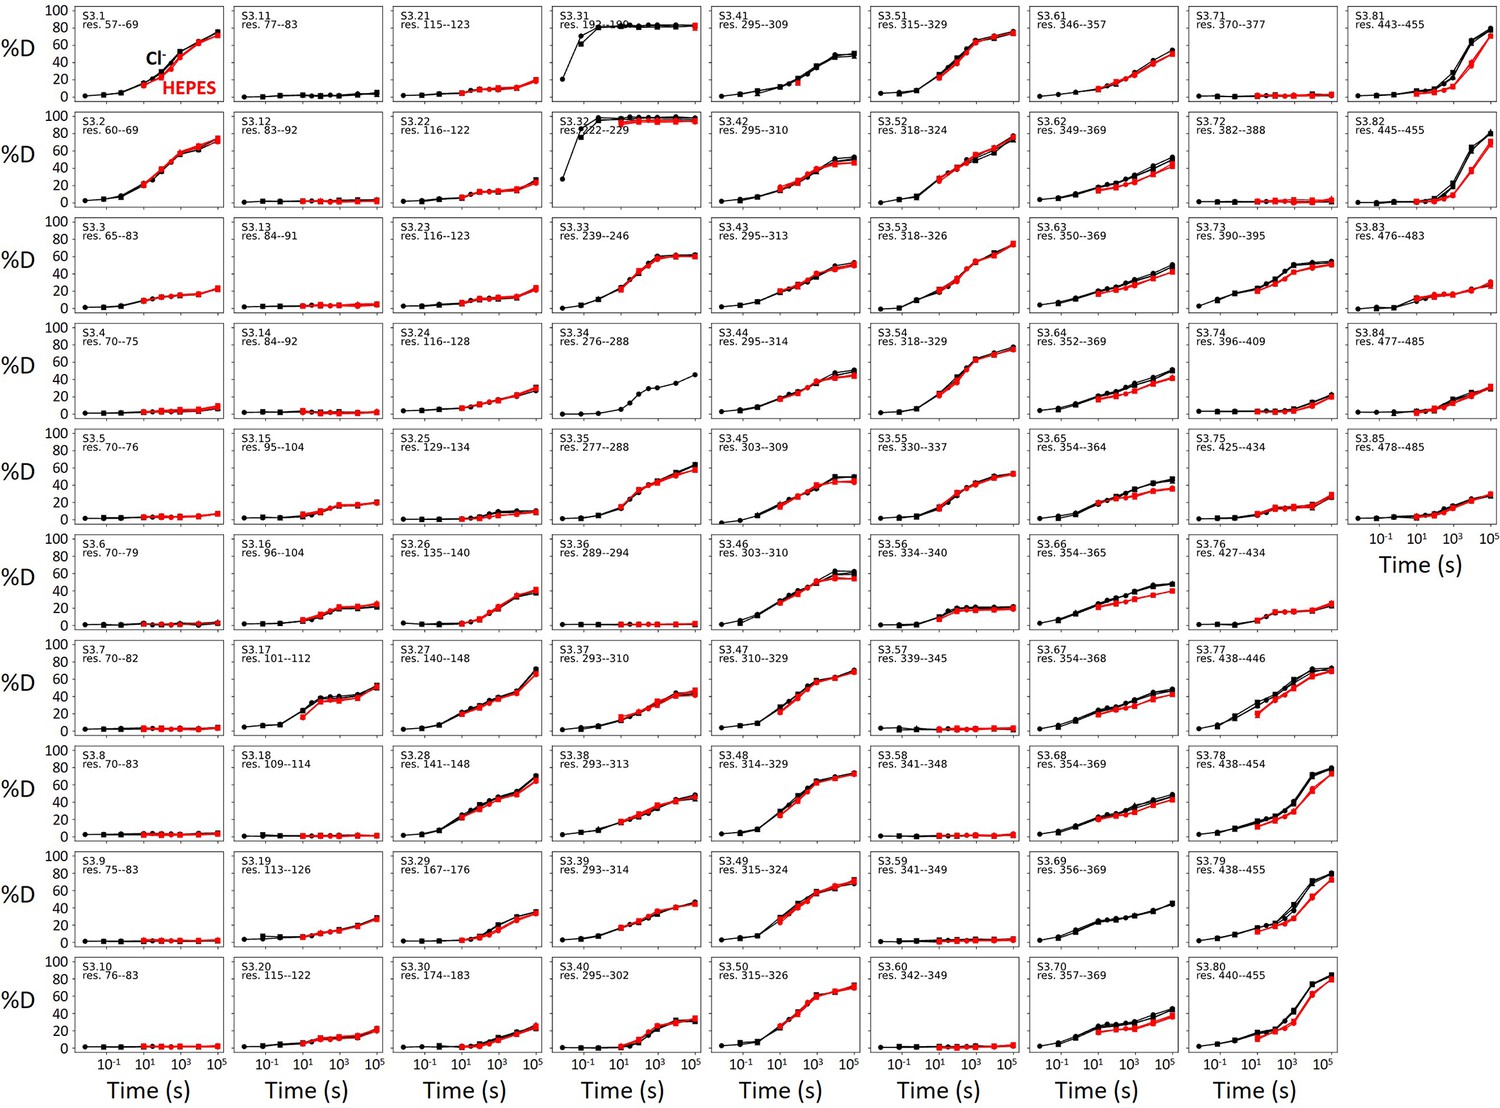
Deuterium uptake curves for all peptides covering SLC26A9’s transmembrane domain.
One deuterium uptake plot is shown for each peptide – Cl− (black) and HEPES (red). Three technical replicates are shown as circles, triangles, and squares. All HDX data were collected on glyco-diosgenin (GDN)-solubilized SLC26A9.
Figure 2 with 2 supplements
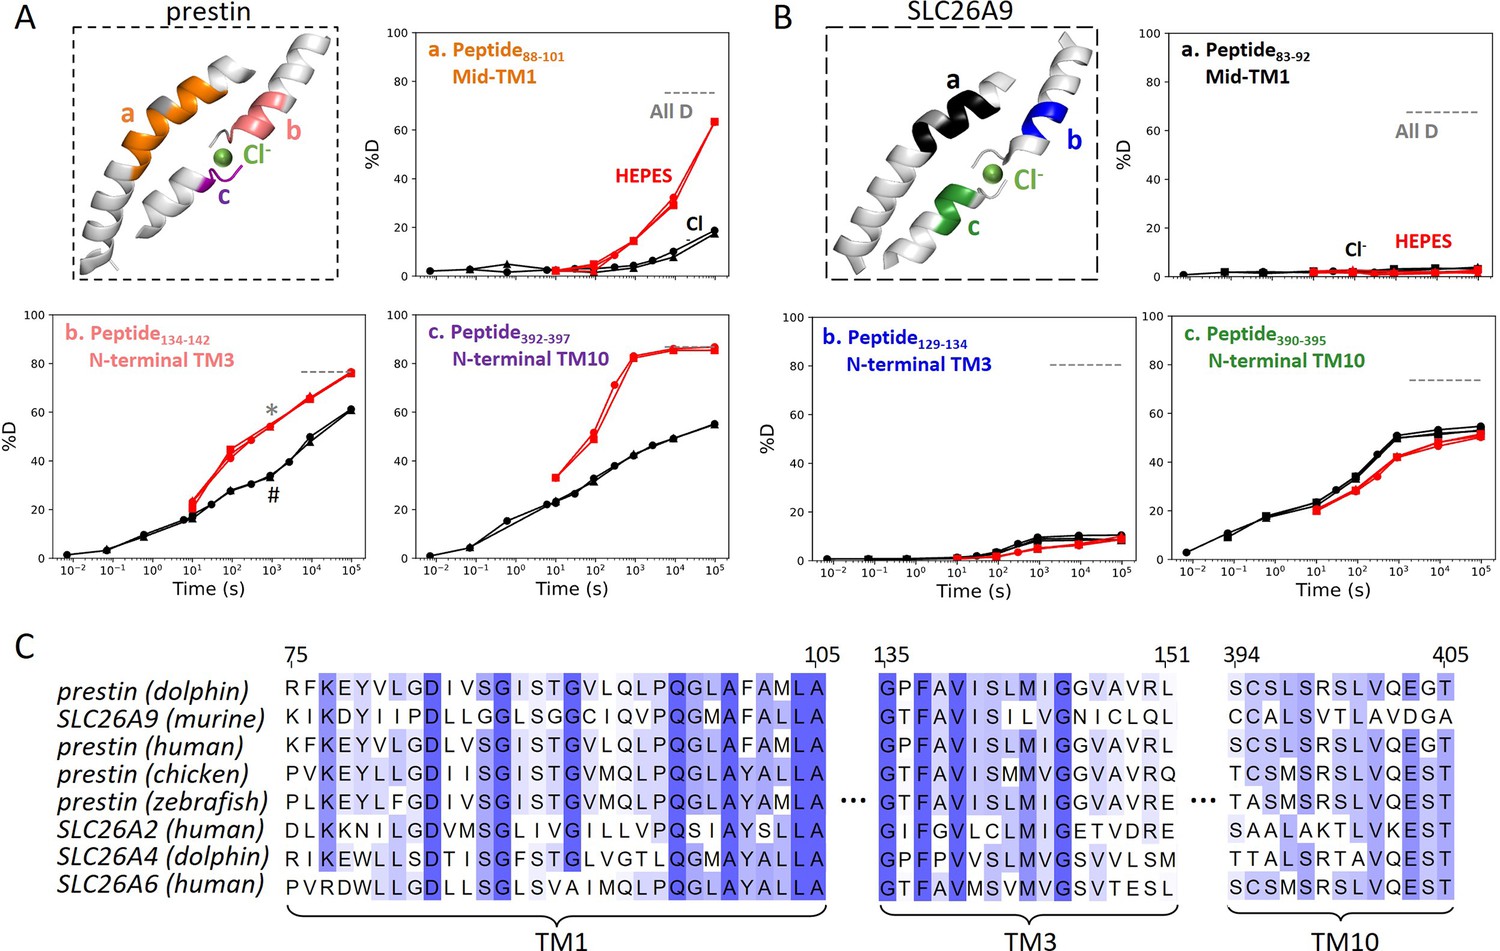
The anion-binding pockets for prestin and SLC26A9 exhibit distinct stability changes upon Cl− binding, albeit highly conserved.
Cl− binding stabilizes prestin’s anion-binding pocket (A) but mildly affects SLC26A9s (B). The structure shows the anion-binding pocket (TM1, TM3, and TM10) with the putative position of the bound Cl−. Colored regions correspond to peptides whose deuterium uptake plots are shown when the protein is in Cl− (black) and in HEPES (red). Prolines are colored in gray. Gray dashed lines indicate deuteration levels in the full-D control. Data from two and three biological replicates are shown for prestin in Cl− and HEPES, respectively. Data from three technical replicates are shown for SLC26A9. Replicates are shown as circles, triangles, and squares. Some replicates are superimposable and hence not observable. The symbols (* and #) in (A.b) denote data points used in Figure 3B. (C) Sequence alignment using Clustal Omega of prestin and close SLC26 transporters across species for the anion-binding pocket. Shades of blue indicate degree of conservation.
Figure 2—figure supplement 1
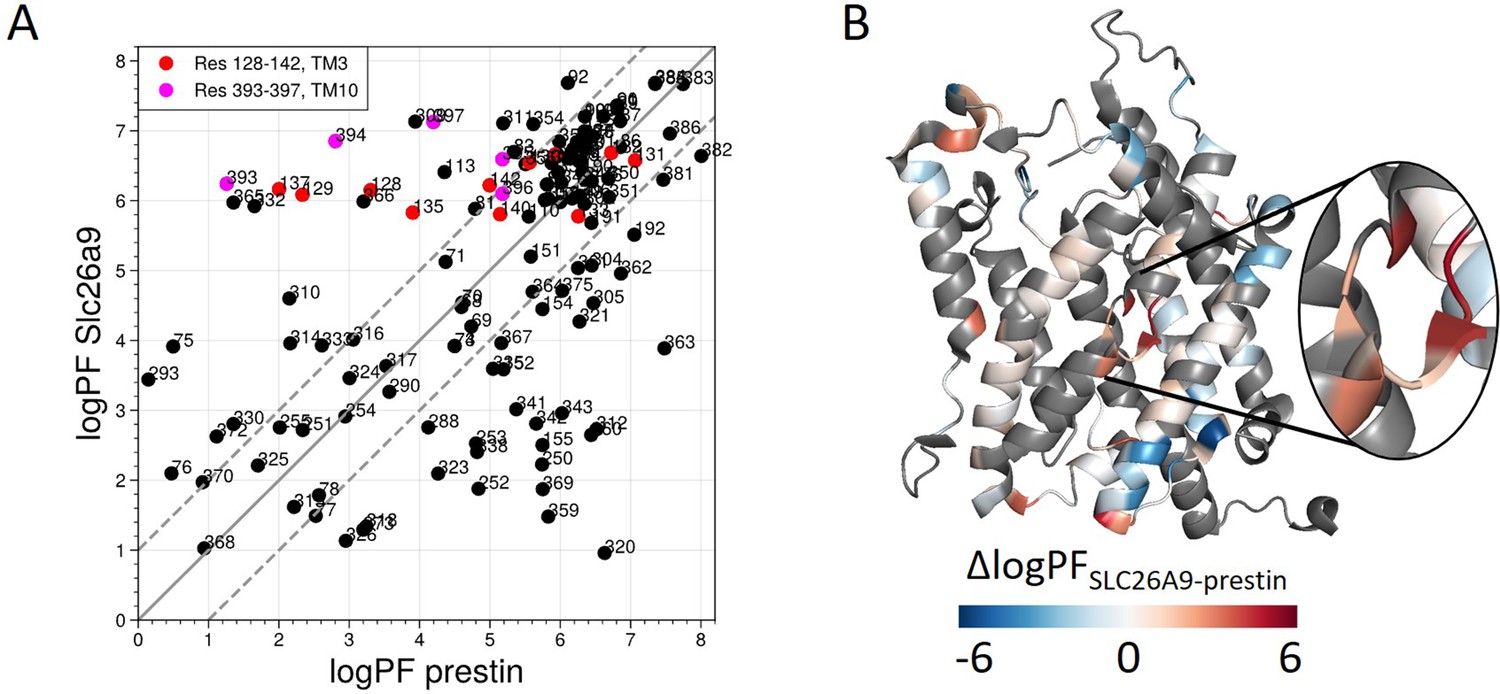
Site-resolved protection factors for prestin and SLC26A9 obtained using PyHDX.
(A) Site-resolved protection factors in a log scale (logPF) for the transmembrane domains (TMDs) of prestin and SLC26A9 with residue numbers denoted. (B) The difference in logPF (∆logPF) mapped onto the prestin structure. Gray represents regions with no fitting data available. TM5 and TM12–14 do not have fitting data and are not shown to highlight the anion-binding site. Fitting was done using PyHDX (Smit et al., 2021) on hydrogen–deuterium exchange mass spectrometry (HDX-MS) data measured for both proteins in Cl−.
Figure 2—figure supplement 2
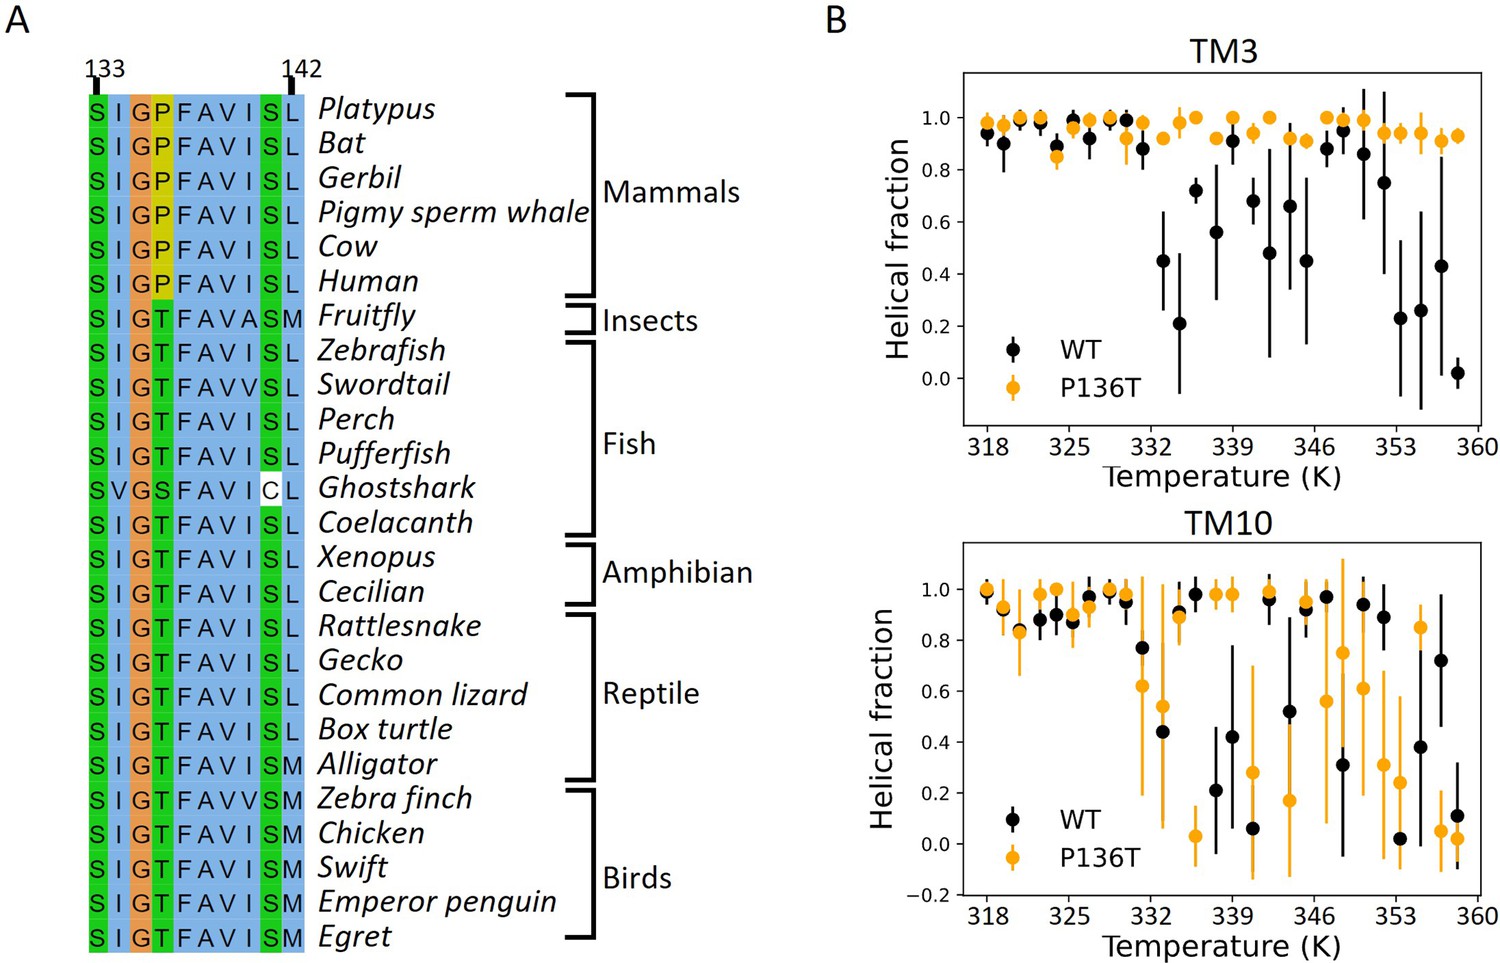
Mammalian prestin has a conserved and helix-destabilizing proline 136 on TM3.
(A) Sequence alignment for the N-terminus of TM3 for prestin across species. A conserved threonine at residue 136 in prestin from other vertebrates is replaced with a proline in mammalian prestin. (B) Molecular simulations of thermo-denaturation of prestin conducted with Upside (Jumper et al., 2018a; Jumper et al., 2018b) (Materials and methods). A P136T mutation largely increases the stability of TM3 but mildly decreases TM10 stability, as compared to wild-type prestin.
Figure 3
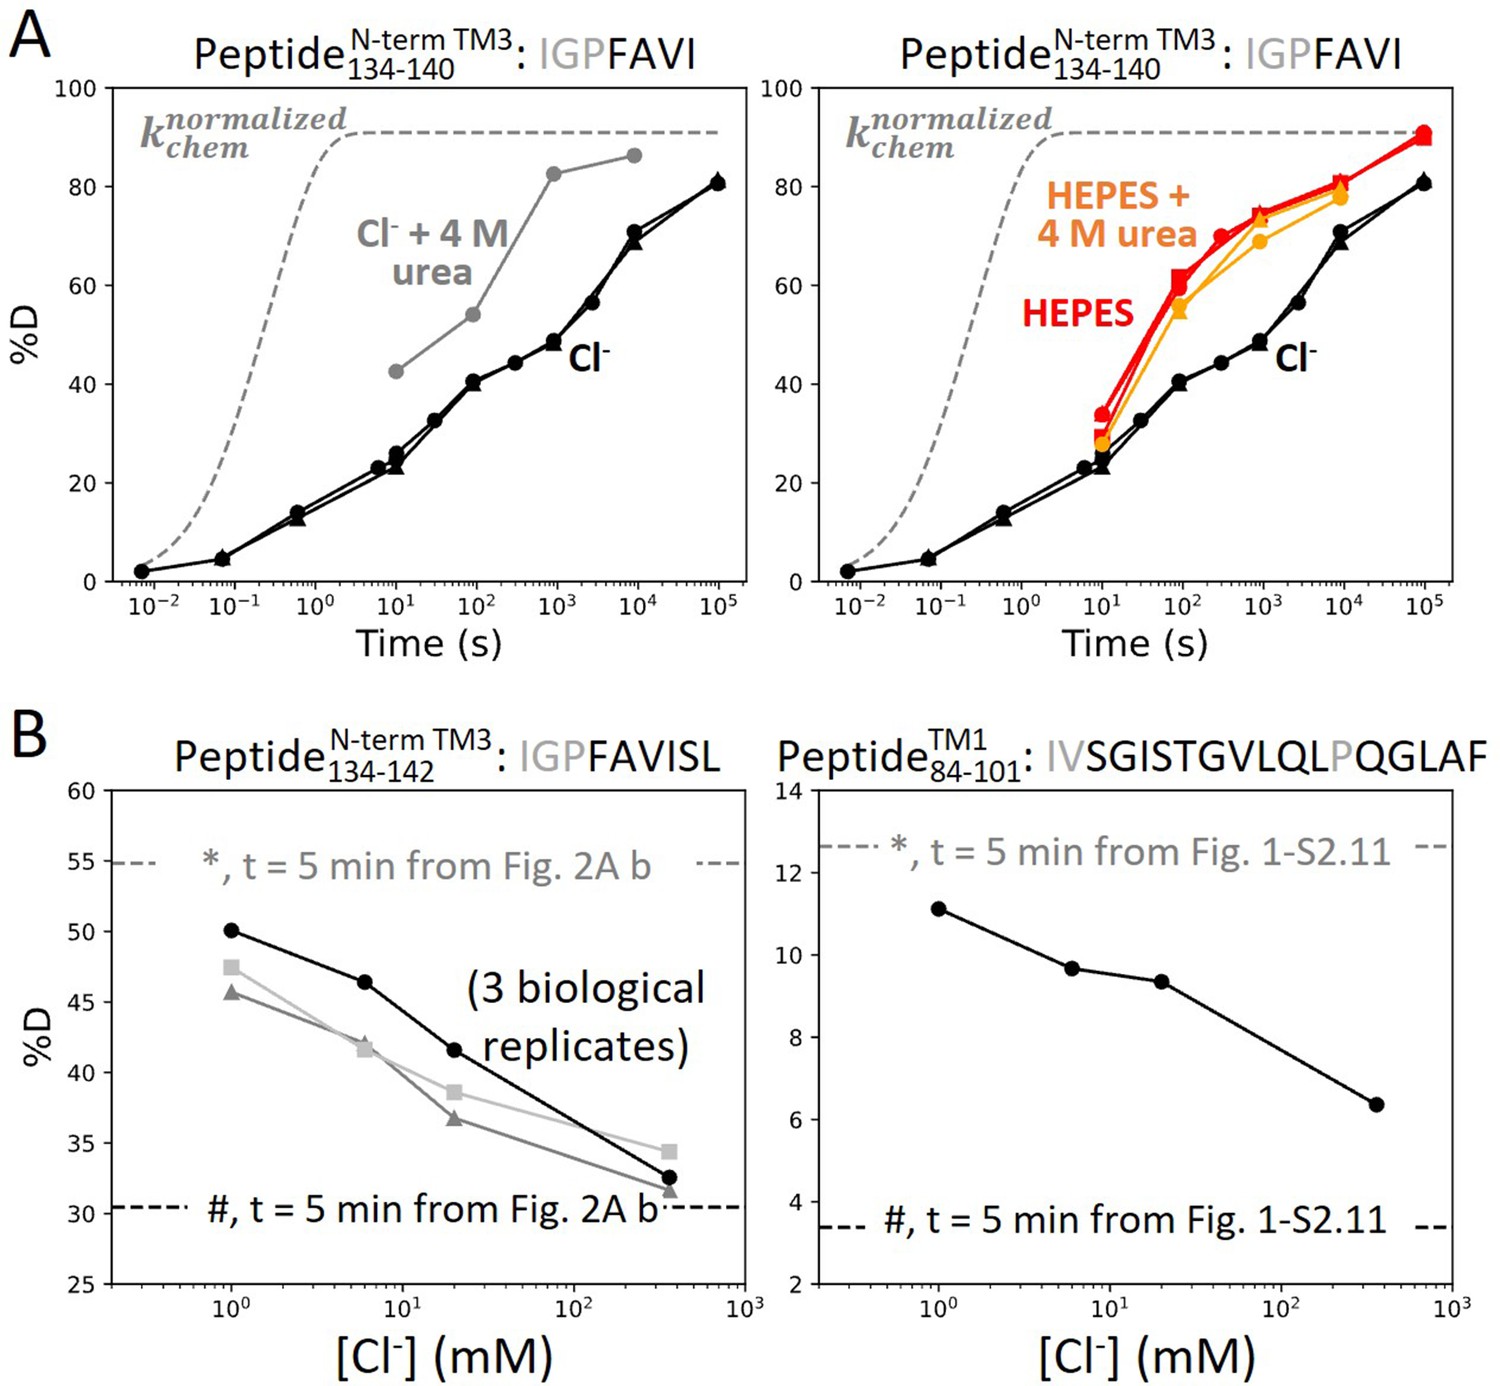
Anion binding folds and stabilizes prestin’s binding site.
(A) Deuterium uptake plots for the N-terminus of TM3 (Peptide134–140) measured in the absence and presence of 4 M urea, in a background of (left) Cl− and (right) HEPES. Replicates (circles, triangles, and squares): 2 in Cl−, 3 in HEPES, 2 in HEPES with urea, biological. Gray dashed curves represent deuterium uptake with kchem (Bai et al., 1993; Nguyen et al., 2018), normalized with the back-exchange level. (B) Deuteration levels for (left) the N-terminus of TM3 (Peptide134–142) in three biological replicates and for (right) TM1 (Peptide84–101) after 5 min labeling upon titrating Cl− to apo state of prestin. Dashed lines indicate deuteration levels at t = 5 min (* and # for apo and Cl−-bound states, respectively) taken from Figure 2A.b and Figure 1—figure supplement 2.11. Residues in gray denoted in the peptide sequence do not contribute to the deuterium uptake curve.
Figure 4
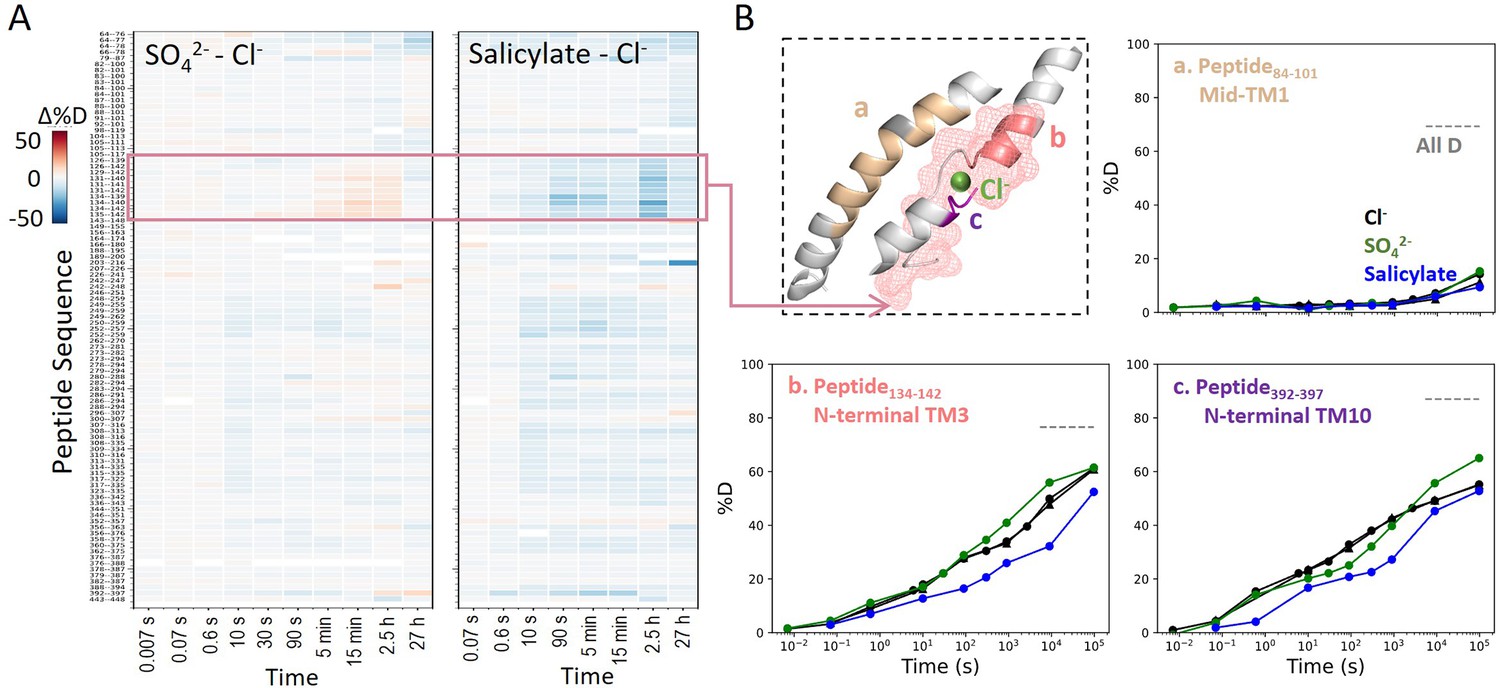
Prestin’s dynamics are regulated by anions of varying identities.
(A) Heatmaps showing the difference in deuteration levels at each labeling time for all transmembrane domain (TMD) peptides measured in SO42− or salicylate compared to Cl−. Peptide sequences are displayed on the y-scale and legible through the high-resolution image. (B) The structure shows the anion-binding pocket with the putative position of the bound Cl−. The pink mesh highlights the region with the greatest HDX response to binding to various anions. Colored regions correspond to peptides whose deuterium uptake plots are shown when the protein is in Cl− (black, two biological replicates shown in circles and triangles), SO42− (green), and salicylate (blue). Prolines are colored in gray. Gray dashed lines indicate deuteration levels in the full-D control.
Figure 5
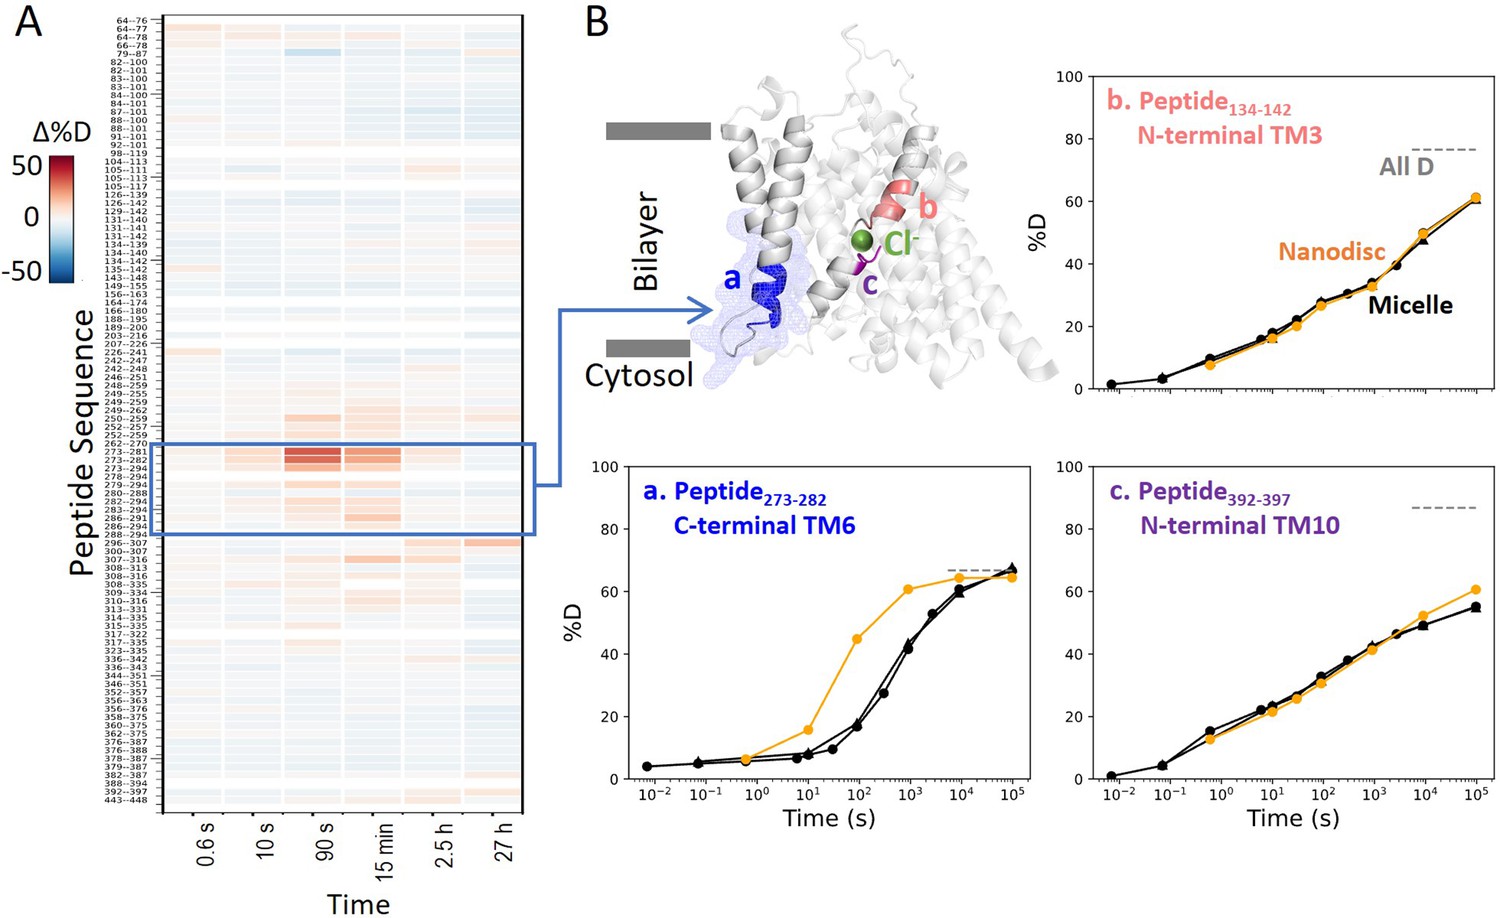
Prestin in nanodisc displays similar folding stability to prestin in micelle, except for a more dynamic TM6.
(A) Heatmaps showing the difference in deuteration levels at each labeling time for all available transmembrane domain (TMD) peptides measured for prestin in nanodisc (porcine brain total lipid extract) compared to prestin in detergent micelle (glyco-diosgenin, GDN), both in Cl−. Peptide sequences are displayed on the y-scale and legible through the high-resolution image. (B) The structure shows the TMD for one subunit of prestin with the putative position of the bound Cl−. The blue mesh highlights the region where the greatest HDX difference was seen for prestin in nanodisc compared to micelle. Colored regions correspond to peptides whose deuterium uptake plots are shown when the protein is in micelle (black, biological duplicates shown in circles and triangles) and in nanodisc (orange). Gray dashed lines indicate deuteration levels in the full-D control.
Figure 6 with 1 supplement
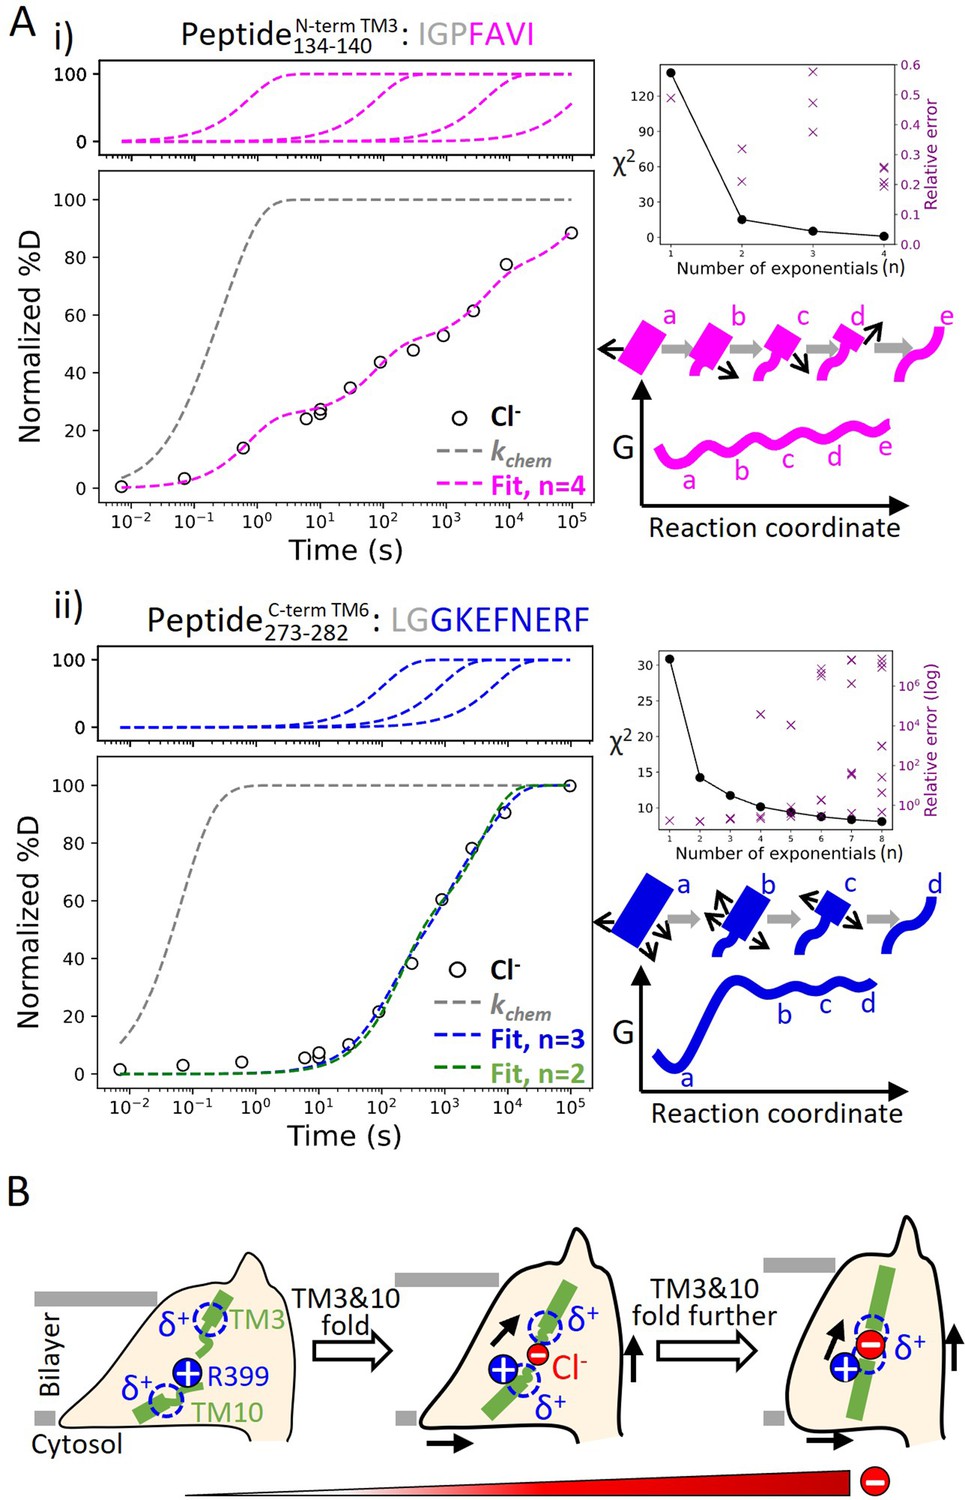
Helix folding cooperativity and the proposed mechanism for prestin’s electromotility.
(A) Left: Deuterium buildup curves for (i) the N-terminal TM3 (Peptide134–140) and (ii) the intracellular portion of TM6 (Peptide273–282) in Cl− depicting helix fraying and mild cooperativity, respectively. Circles: experimental deuteration levels, normalized with in- and back-exchange levels. Gray dashed curves: hypothetical intrinsic uptake curves (PF = 1). On the top shows individual exponentials whose sum is fitted to the experimental values and plotted on the main buildup curves. Residues in gray denoted in the peptide sequence do not contribute to the deuterium uptake curve. Upper right: χ2 and the relative error as the number of fit exponentials increases, used to assess the quality of fit. Lower right: Models and free energy surface of unfolding illustrating the difference between (i) fraying and (ii) mild cooperativity. (B) Mechanism for prestin’s conformational transition from the expanded to the contracted state regulated by the anion concentration. Green rectangles and curved lines: folded and unfolded fractions, respectively, of TM3 and TM10. Blue filled circle: R399. Blue dashed circle: partial positive charges from TM3 and TM10 helical dipoles. Red filled circle: anions, with the size of the circle depicting anion concentrations. Black arrows: prestin’s conformational change.
Figure 6—figure supplement 1

PyHDX fitting supports that prestin exhibits helix fraying at the N-terminus of TM3 and mild cooperativity at the intracellular portion of TM6.
Left: Site-resolved protection factor values in a log scale (logPF) obtained by deconvoluting hydrogen–deuterium exchange mass spectrometry (HDX-MS) data using PyHDX (Smit et al., 2021) for regions covering (A) the N-terminus of TM3 and (B) the intracellular portion of TM6. Right: PyHDX fittings for the corresponding peptides – black circles: experimental deuteration levels; red curves: fittings.
Appendix 1—figure 1
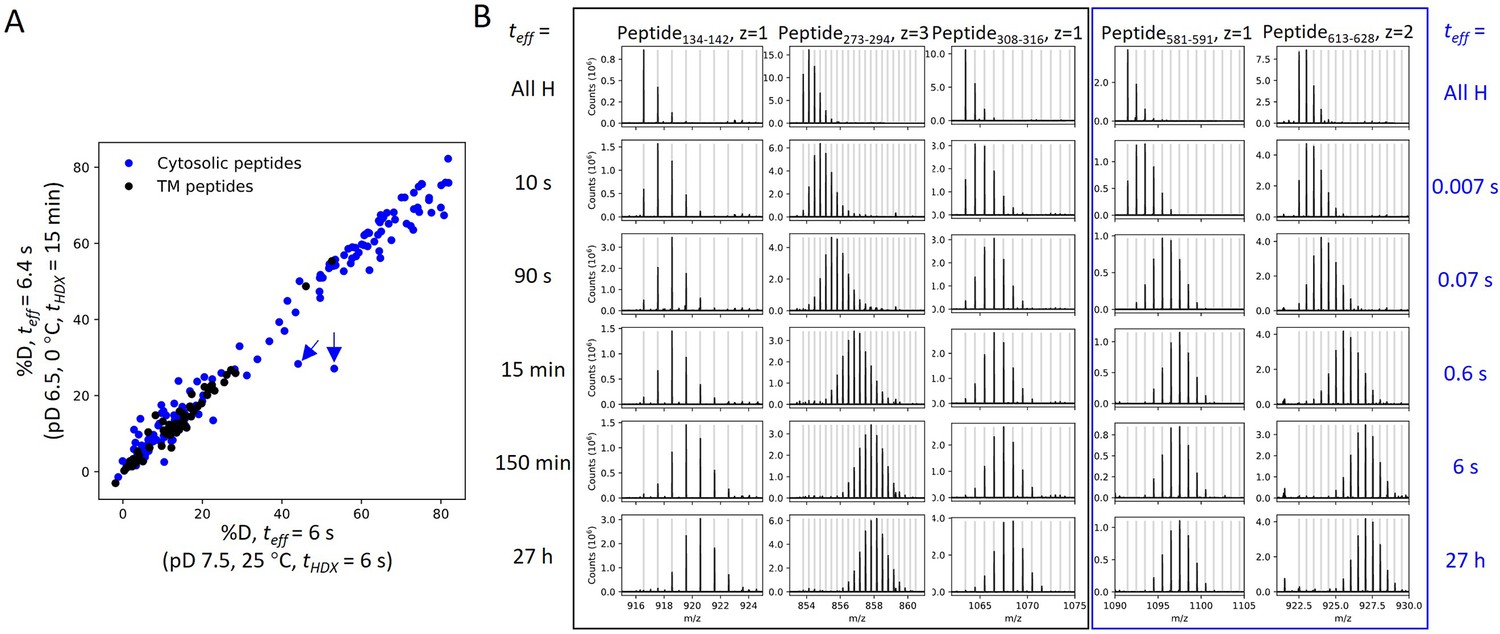
HDX for prestin occurs via EX2 mechanism.
(A) Comparison of deuteration levels of all prestin peptides labeled under two HDX conditions: (1) pDread 7.1, 25°C, tHDX = 6 s; (2) pDread 6.1, 0°C, tHDX = 15 min, teff = 6.4 s, where teff represents effective HDX labeling time in pDread 7.1, 25°C (Materials and methods). Black: transmembrane (TM) peptides, blue: cytosolic peptides. The two outliers denoted by the blue arrows represent peptides covering the Cα2 helix in the STAS domain, whose large apparent %D difference between the two conditions results from pH-/temperature-dependent dynamics (data not shown). (B) Mass spectra of a representative set of peptides showing progressive unimodal isotope envelopes toward high m/z over time. Gray horizontal bars indicate theoretical m/z values for the corresponding isotopes.
Appendix 1—figure 2
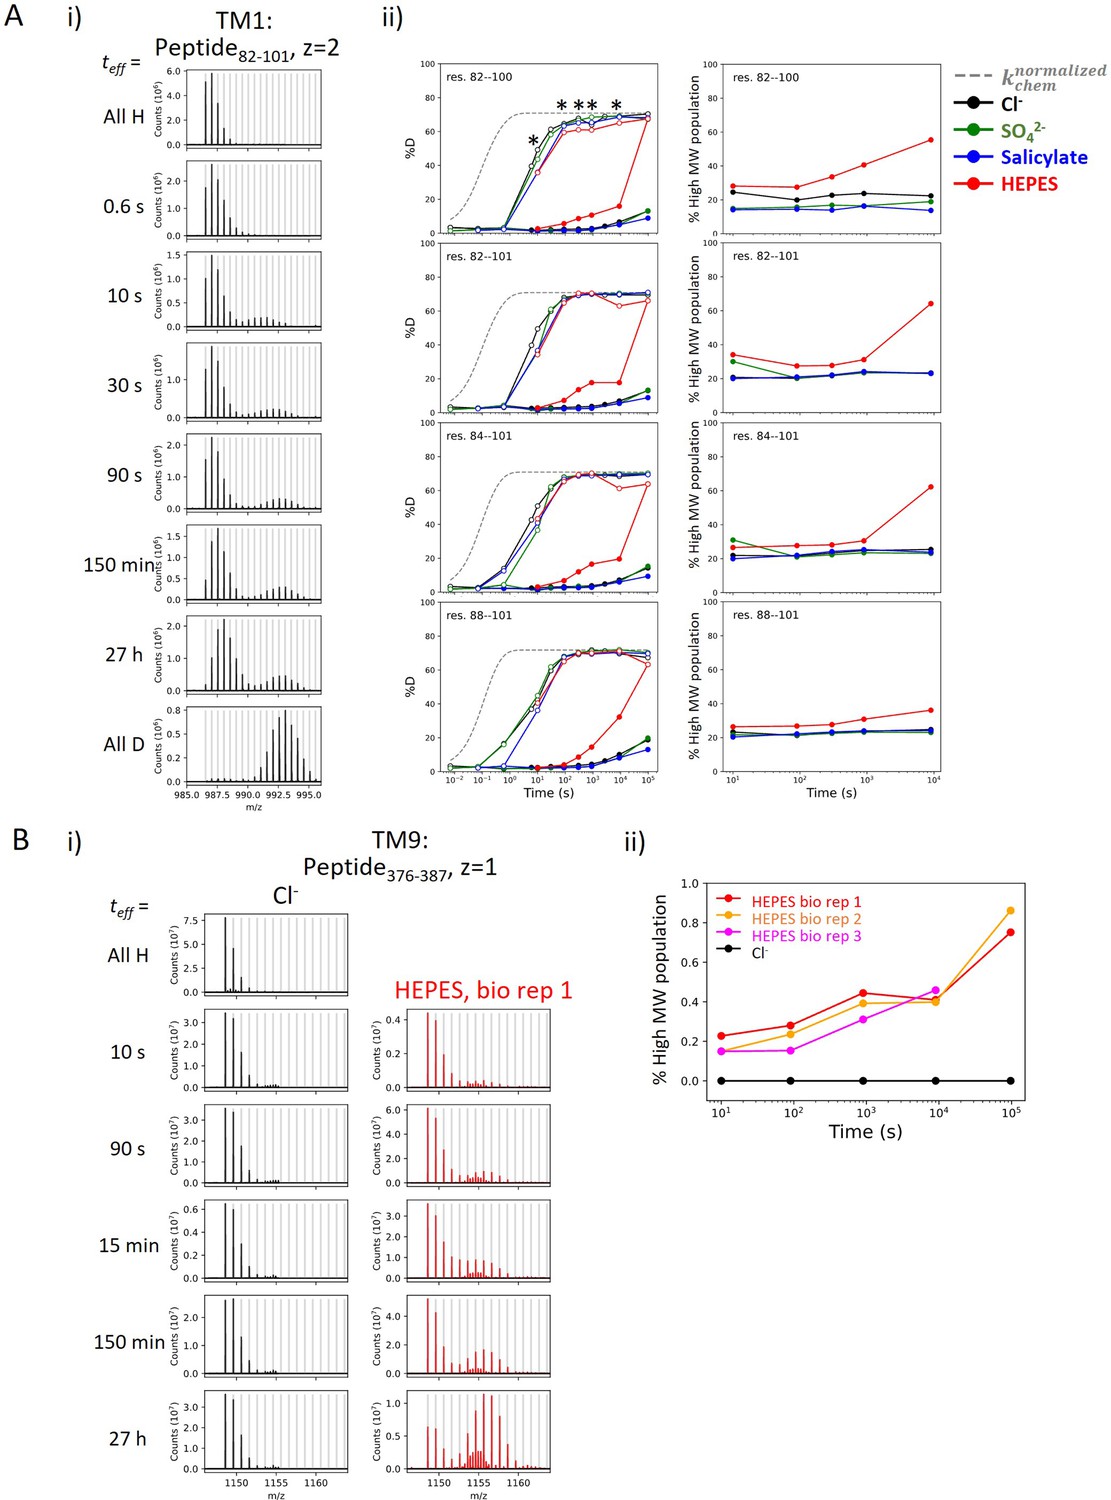
Heterogeneity and HDX kinetics in TM1 and TM9.
(A) Conformational heterogeneity at TM1. (i) Example mass spectra for a TM1 peptide showing bimodal isotope envelopes, with both isotope distributions increasing in mass over time and exchanging via EX2 kinetics. (ii) Left: Deuterium uptake curves of example TM1 peptides plotting both the left (filled markers) and the right (empty markers) isotope envelopes under different anion conditions. Gray dashed curves represent deuterium uptake with kchem, normalized with the in- and back-exchange levels. Only one replicate is shown for clarity. Asterisks represent time points used for the (right) population fraction analysis, chosen as two isotope envelopes are well separated. Fractions of the heavier envelope (i.e., % high MW population) in HEPES are higher than those in other conditions as the left envelope merges into the right envelope, resulting in less distinct separation between the two envelopes. (B) HDX for prestin’s TM9 exhibits EX1 kinetics in the apo state. (i) Example mass spectra for a TM9 peptide measured for prestin in Cl− (black) and HEPES (red). Identification of EX1 kinetics in HEPES is supported by the presence of two distinct mass envelopes, with the amplitude of the lighter envelope decreasing with a commensurate increase in the heavier envelope over time (Weis et al., 2006). (ii) The fraction of the heavier envelope over time for prestin in Cl− (black) and HEPES (three biological replicates are shown).
Appendix 2—figure 1
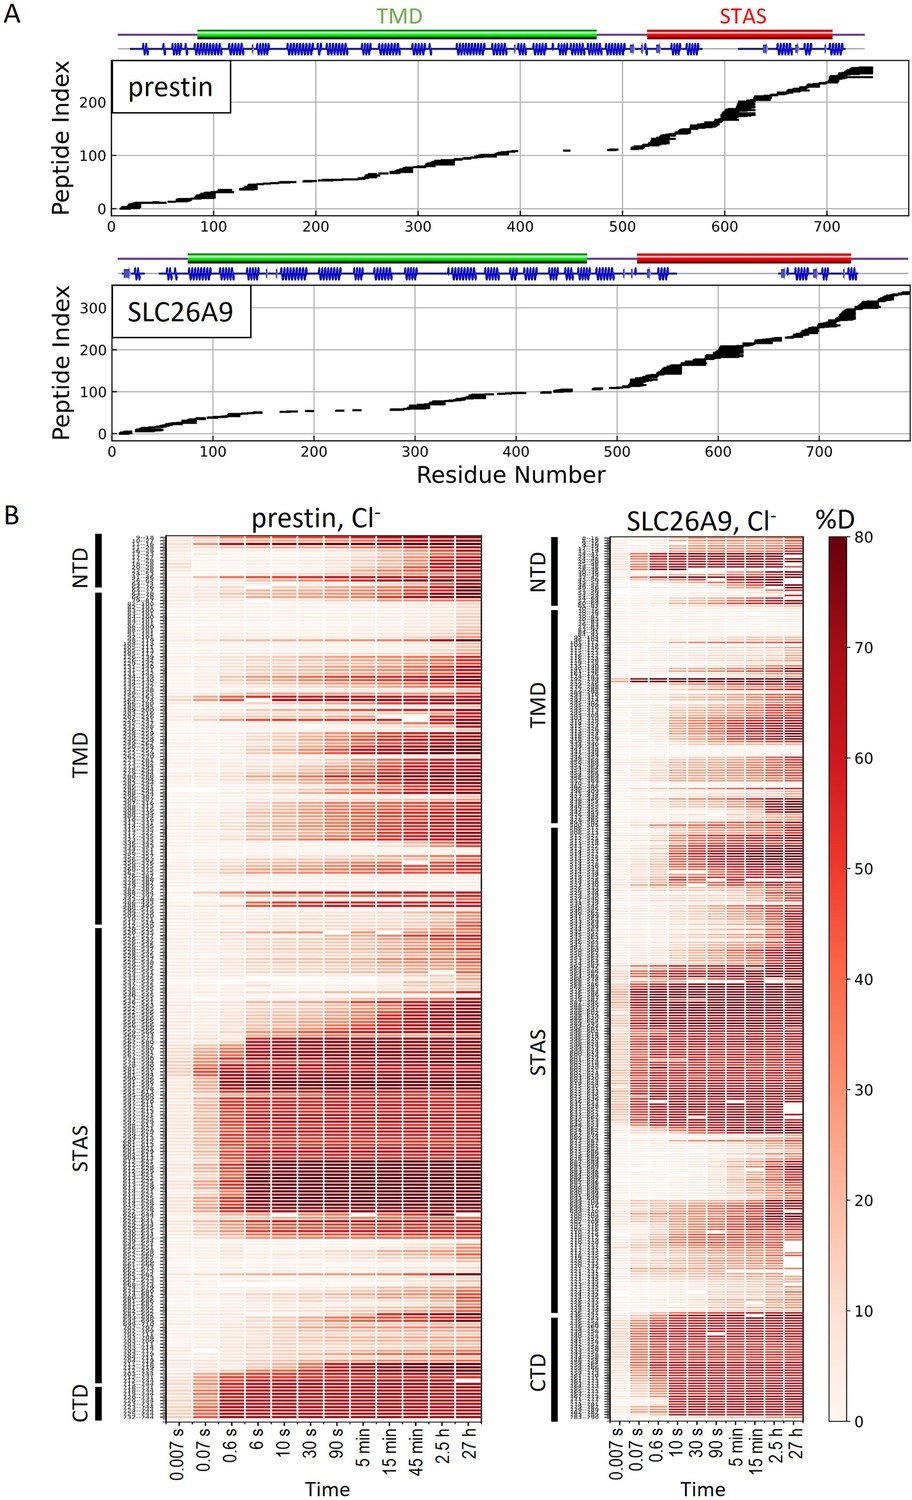
HDX-MS sequence coverage and measurements for prestin and SLC26A9 in Cl−.
(A) Peptide sequence coverage for prestin and SLC26A9 suitable for HDX-MS analysis. On the top indicates the sequence boundary for domains and secondary structures. (B) Heatmaps showing deuteration levels of all the peptides at each labeling time for prestin and SLC26A9 measured in Cl−. Peptide sequences are displayed on the y-axis and legible through high-resolution images.
Appendix 2—figure 2
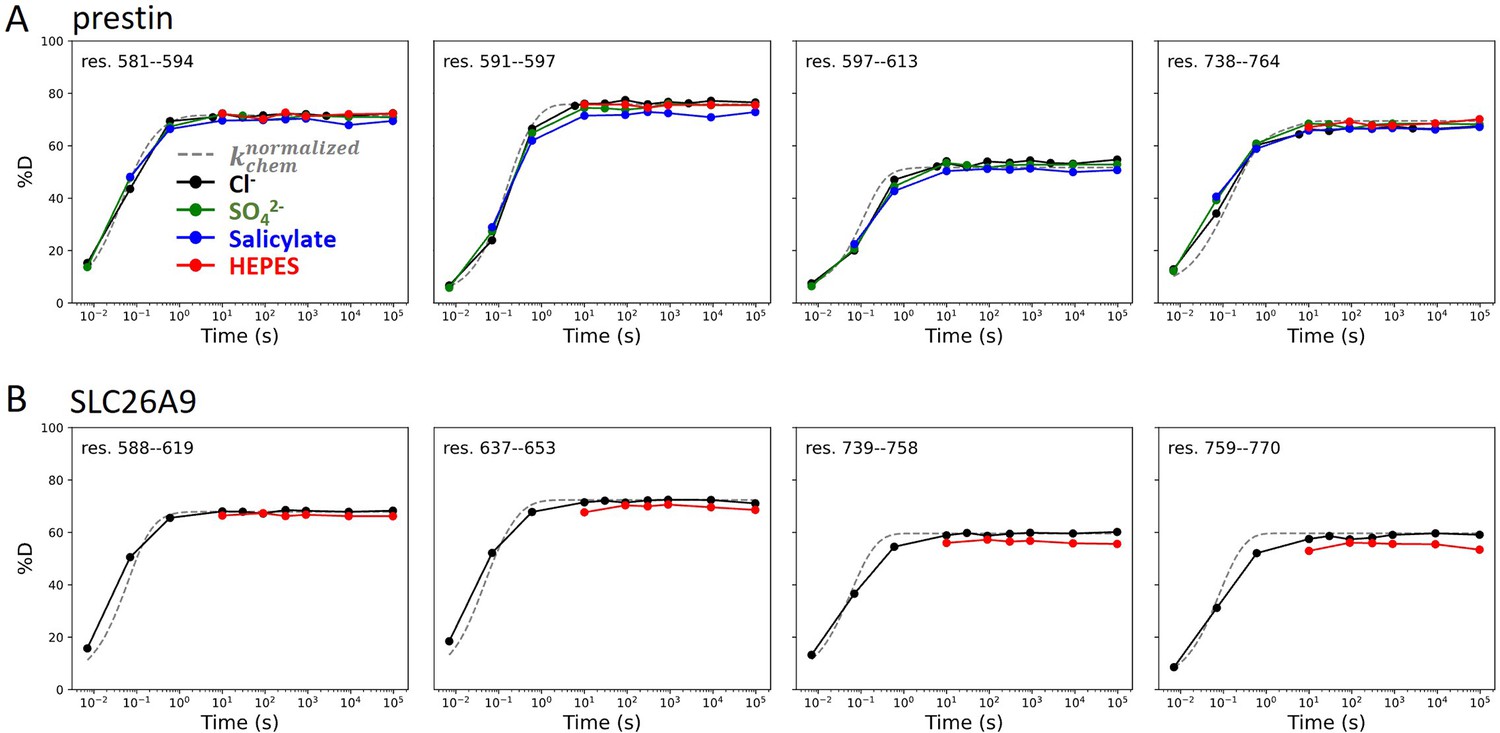
Regions unresolved in cryo-EM structures are unfolded in all conditions examined.
Deuterium uptake plots for example peptides covering regions unresolved in cryo-EM structures for (A) prestin and (B) SLC26A9: black, Cl−; green: SO42−; blue: salicylate; red: HEPES. Gray dashed curves represent deuterium uptake with kchem, normalized with the in- and back-exchange levels. Only one replicate for Cl− and HEPES are shown for clarity.
Appendix 3—figure 1
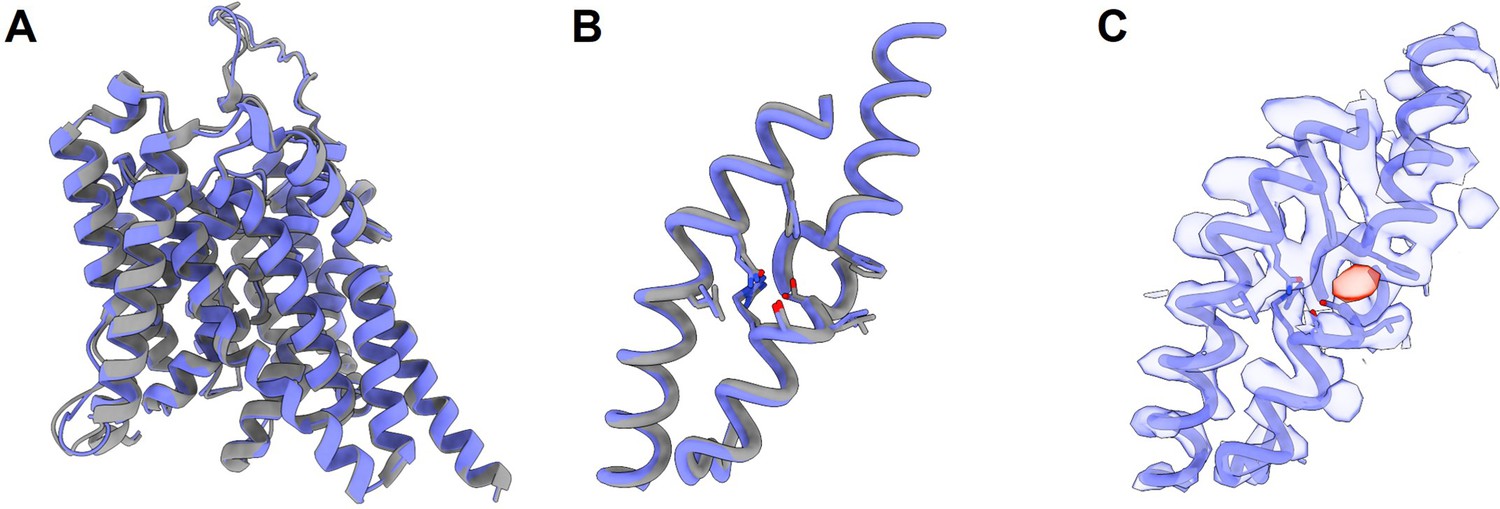
The cryo-EM structure for prestin in a HEPES-based buffer containing 1 mM Cl− (blue; PDB 8UC1) highly resembles the structure in the reported Cl−-bound state.
(A) Overlay of prestin’s transmembrane domain (TMD) with that solved in a high-chloride buffer (gray; PDB 7S8X). (B) Overlay of TM1, TM3, and TM10, with key residues that make up the anion-binding site. (C) Cryo-EM density forming the anion-binding site (blue). Additional density (red) that is incompatible with the placing of a HEPES molecule was resolved at the anion-binding site.
Appendix 3—figure 2
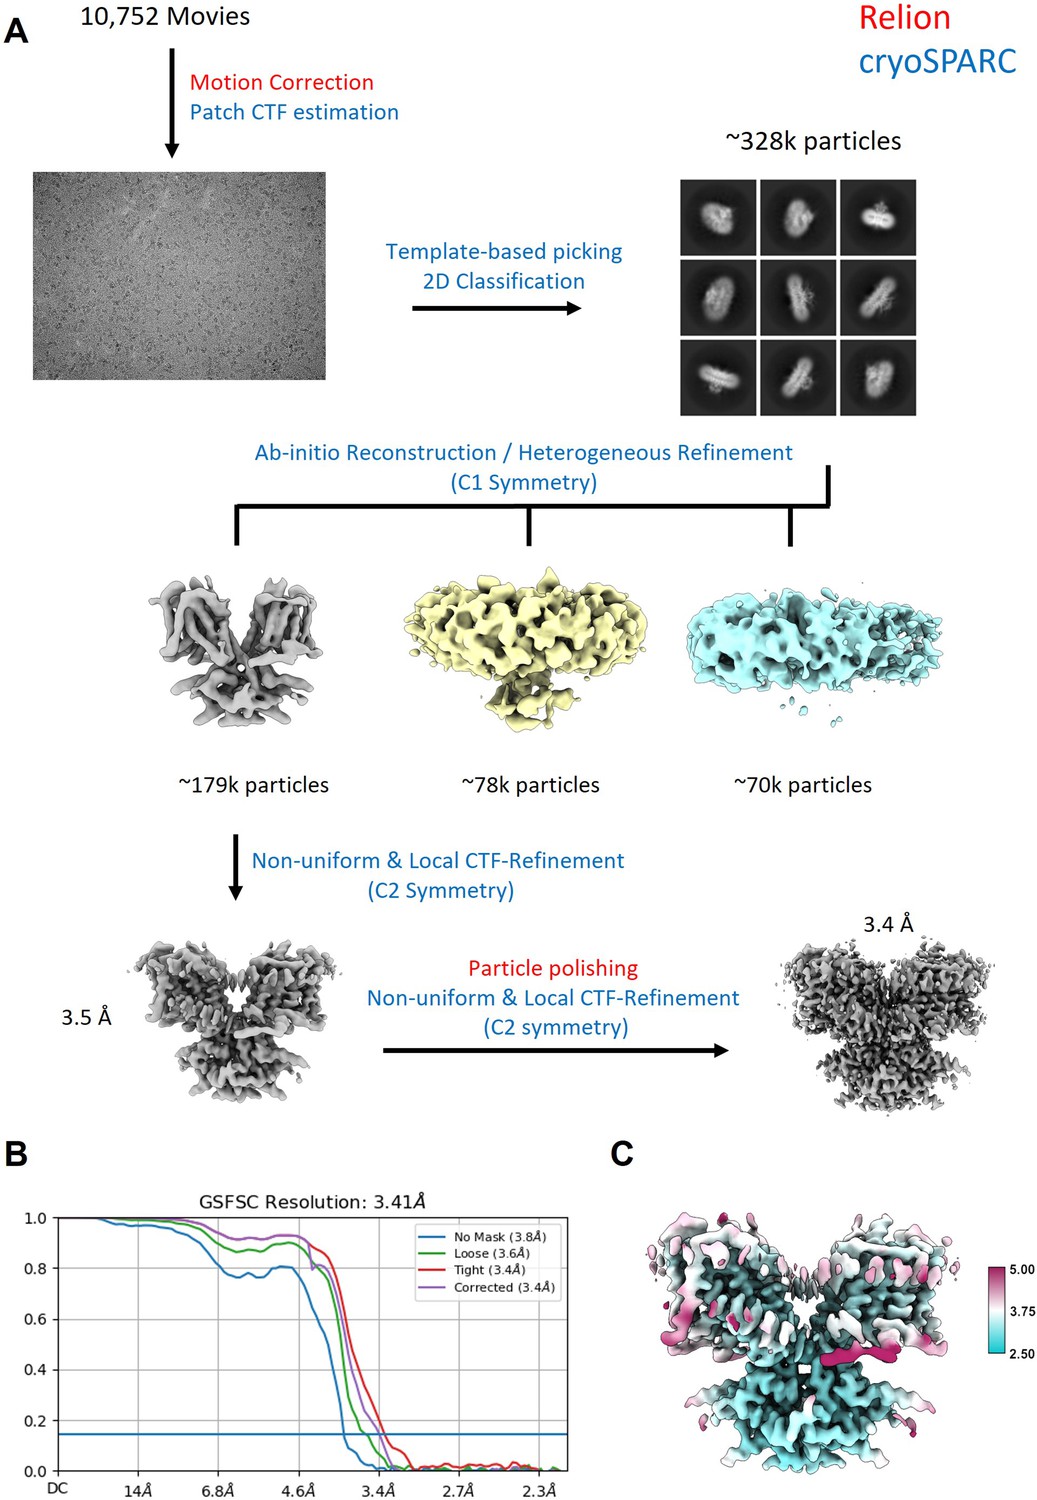
Workflow for the processing of the cryo-EM data.
(A) Steps indicated in red font were performed in Relion, steps indicated in blue were performed in cryoSPARC. (B) FSC curve showing that the final reconstruction reached a nominal resolution of 3.4 Å (at FSC = 0.143). (C) Local resolution estimation of the final reconstruction.
Tables
Table 1
Biochemical and statistical details for HDX.
| Dataset | Prestin, Cl− | Prestin, HEPES (apo) | Prestin, SO42− | Prestin, salicylate | Prestin, nanodisc, Cl− | Slc26a9, Cl− | Slc26a9, HEPES (apo) |
|---|---|---|---|---|---|---|---|
| HDX reaction details | 360 mM NaCl, 20 mM Tris (NaPi for pDread 6.1, 0°C), 3 mM DTT, 1 mM EDTA, 0.02% GDN. pDread 7.1, 25°C or pDread 6.1, 0°C | 150 mM HEPES, 0.02% GDN. pDread 7.1, 25°C | 140 mM Na2SO4, 5 mM MgSO4, 20 mM NaPi, 0.02% GDN. pDread 7.1, 25°C or pDread 6.1, 0°C | 140 mM Na2SO4, 5 mM MgSO4, 50 mM salicylate, 20 mM NaPi, 0.02% GDN. pDread 7.1, 25°C or pDread 6.1, 0°C | 20 mM Tris (NaPi for pDread 6.1, 0°C), 150 mM NaCl. pDread 7.1, 25°C or pDread 6.1, 0°C | 360 mM NaCl, 20 mM Tris (NaPi for pD 6.5, 0°C), 3 mM DTT, 1 mM EDTA, 0.02% GDN. pDread 7.1, 25°C or pDread 6.1, 0°C | 150 mM HEPES, 0.02% GDN. pDread 7.1, 25 °C |
| HDX time course (*: replicated. Times in parenthesis: times in pDread 7.1, 25°C after correcting for the kchem difference) | pDread 6.1, 0°C: 1 s (0.007 s), 10 s (0.07 s)*, 90 s (0.6 s)*; pDread 7.1, 25°C: 6 s, 10 s*, 30 s, 90 s*, 5 min, 15 min*, 45 min, 150 min*, 27 hr* | pDread 7.1, 25°C: 10 s*, 90 s*, 5 min*, 15 min*, 150 min*, 27 hr* | pDread 6.1, 0°C: 1 s (0.007 s), 10 s (0.07 s), 90 s (0.6 s); pDread 7.1, 25°C: 10 s, 30 s, 90 s, 5 min, 15 min, 150 min, 27 hr | pDread 6.1, 0°C: 1 s (0.007 s), 90 s (0.6 s); pDread 7.1, 25°C: 10 s, 90 s, 5 min, 15 min, 150 min, 27 hr | pDread 6.1, 0°C: 90 s (0.6 s); pDread 7.1, 25°C: 10 s, 90 s, 15 min, 150 min, 27 hr | pDread 6.1, 0°C: 1 s (0.007 s), 10 s (0.07 s)*, 90 s (0.6 s)*; pDread 7.1, 25°C: 10 s*, 30 s, 90 s*, 5 min, 15 min*, 150 min*, 27 hr* | pDread 7.1, 25 °C: 10 s*, 90 s*, 15 min*, 150 min*, 27 h* |
| HDX control samples | Non-deuterated control; in-exchange control; maximally labeled control | Non-deuterated control; in-exchange control; maximally labeled control | |||||
| In- and back-exchange, mean/IQR | In-exchange: 3.1%/2.0%; back-exchange: 27%/14% | In-exchange: 2.5%/1.9%; back-exchange: 29%/17% | |||||
| No. of peptides | 266 (TMD: 95; cytosolic: 171) | 265 (TMD: 94; cytosolic: 171) | 266 (TMD: 95; cytosolic: 171) | 265 (TMD: 94; cytosolic: 171) | 256 (TMD: 85; cytosolic: 171) | 338 (TMD: 85; cytosolic: 253) | 335 (TMD: 82; cytosolic: 253) |
| Sequence coverage | 83% (TMD: 75%; cytosolic: 95%) | 83% (TMD: 75%; cytosolic: 95%) | 83% (TMD: 75%; cytosolic: 95%) | 83% (TMD: 74%; cytosolic: 95%) | 79% (TMD: 67%; cytosolic: 95%) | 81% (TMD: 68%; cytosolic: 96%) | 81% (TMD: 68%; cytosolic: 96%) |
| Average peptide length/redundancy | 12.2/4.3 | 12.2/4.3 | 12.2/4.3 | 12.2/4.3 | 12.2/4.1 | 12.5/5.3 | 12.5/5.3 |
| Replicates | 2 (Biological) | 3 (Biological) | 1 | 1 | 1 | 3 (Technical) | 3 (Technical) |
| Repeatability (TM peptides only) | 0.69%/0.06 Da (average SD of the Δ%D/Δ#D between the duplicates) | 0.93%/0.09 Da (average SD) | N/A | N/A | N/A | 0.64%/0.06 Da (average SD) | 0.60%/0.05 Da (average SD) |
| Significant differences in HDX (ΔHDX > X Da, TM peptides only) | N/A | 0.22 Da (95% CI) | N/A | N/A | N/A | 0.14 Da (95% CI) | 0.13 Da (95% CI) |
| 0.17 Da (95% CI) | N/A | N/A | N/A | 0.11 Da (95% CI) | |||
Appendix 3—table 1
Cryo-EM data collection, refinement, and validation statistics.
| Data collection and processing | |
|---|---|
| Magnification | 81,000 |
| Voltage (kV) | 300 |
| Electron exposure (e−/Å2) | 60 |
| Defocus range (μm) | 0.7–2.1 |
| Pixel size (Å) | 1.068 |
| Symmetry imposed | C2 |
| Initial particle images (no.) | 328,033 |
| Final particle images (no.) | 170,313 |
| Map resolution (Å) FSC threshold 0.143 | 3.4 |
| Map resolution range (Å) | 2.9–6.0 |
| Refinement | |
| Model resolution (Å) 0.5 FSC threshold | 3.7 |
| Model resolution range (Å) | n/a |
| Map sharpening b-factor (Å2) | 140.0 |
| Model composition Non-hydrogen atoms Protein residues Ligands | 10,310 1336 2 |
| B factors (Å2) Protein Ligands | 33.6 30 |
| R.m.s. deviations Bond lengths (Å) Bond angles (°) | 0.006 1.022 |
| Validation MolProbity score Clashscore Poor rotamers (%) | 1.98 14.14 0.71 |
| Ramachandran plot Favored (%) Allowed (%) Disallowed (%) | 95.78 4.22 0 |
Additional files
Download links
A two-part list of links to download the article, or parts of the article, in various formats.
Downloads (link to download the article as PDF)
Open citations (links to open the citations from this article in various online reference manager services)
Cite this article (links to download the citations from this article in formats compatible with various reference manager tools)
Folding of prestin’s anion-binding site and the mechanism of outer hair cell electromotility
eLife 12:RP89635.
https://doi.org/10.7554/eLife.89635.3


