Investigating macroecological patterns in coarse-grained microbial communities using the stochastic logistic model of growth
- Quantitative Life Sciences, The Abdus Salam International Centre for Theoretical Physics (ICTP), Italy
Figures
Figure 1 with 2 supplements
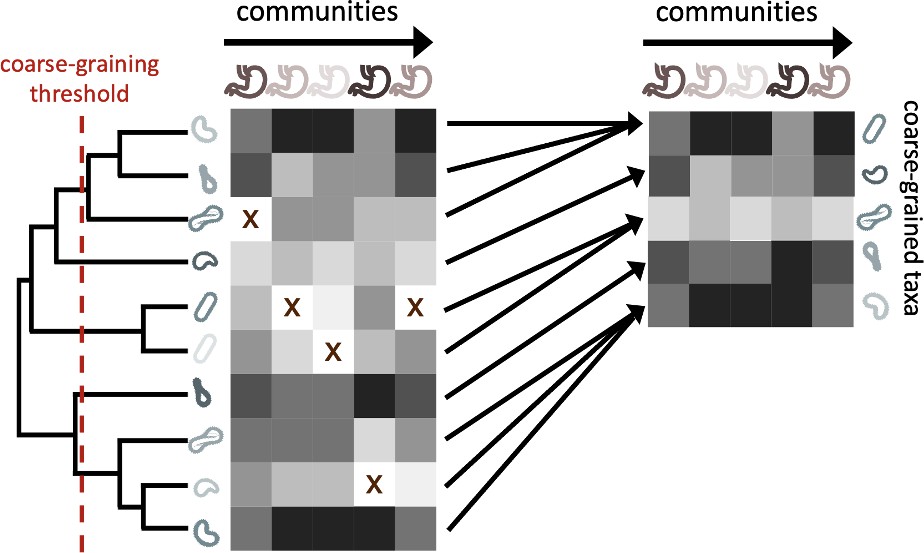
The process of coarse-graining abundances using the phylogeny.
Taxonomic assignment in 16S rRNA amplicon sequence data provided the opportunity to investigate how properties of communities vary at different taxonomic scales. The most straightforward means of coarse-graining here is to sum the abundances of OTUs/ASVs that belong to the same taxonomic group. Amplicon data-based studies provide information about the shared evolutionary history of community constituents, information that can be leveraged by the construction of phylogenetic trees. A coarse-graining procedure can be defined that is analogous to one based on taxonomy, where a phylogenetic root-to-tip distance is chosen and terminal nodes are collapsed if their distance to a common ancestor is less than the prescribed distance.
Figure 1—figure supplement 1

The process of coarse-graining using taxonomic information.
Taxonomic assignment in 16S rRNA amplicon sequence data provides the opportunity to investigate how properties of communities vary at different taxonomic scales. A straightforward means of coarse-graining is to sum the abundances of OTUs/ASVs that belong to the same taxonomic group.
Figure 1—figure supplement 2
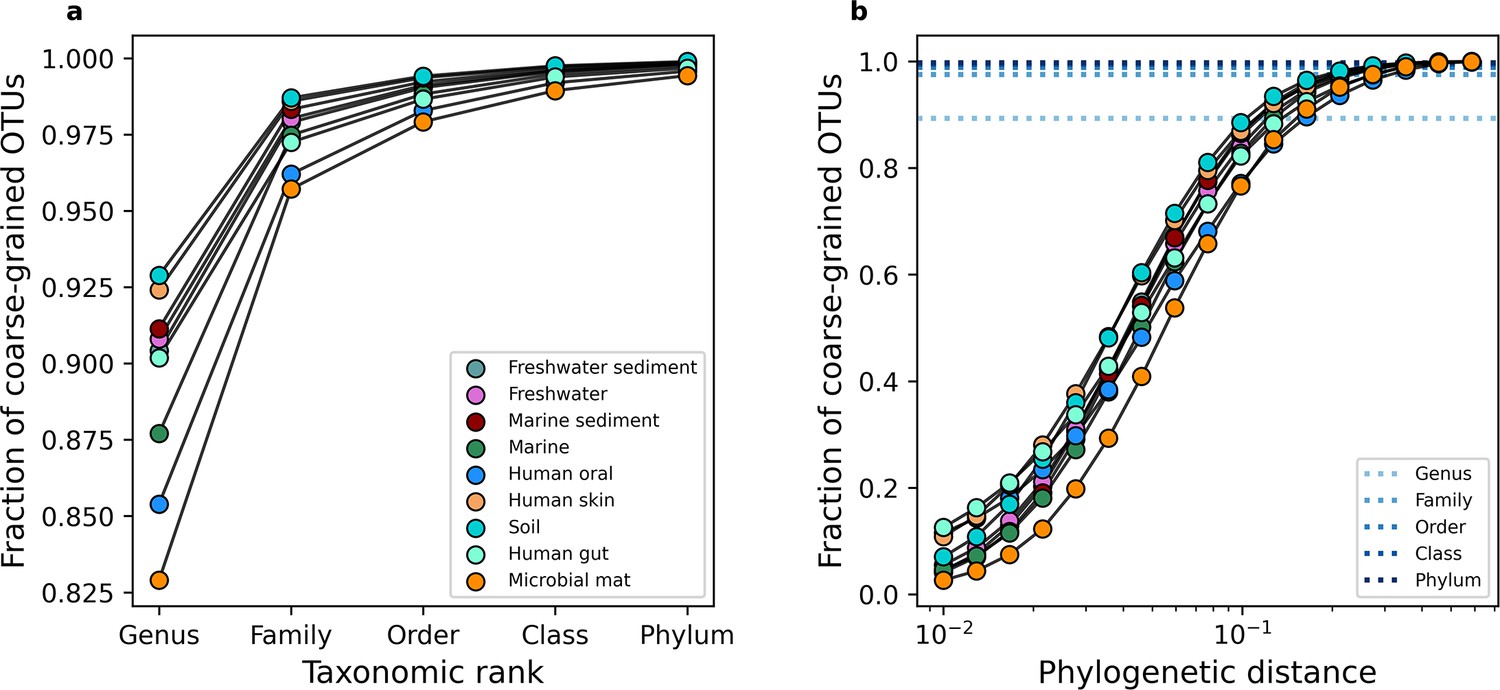
Examining the change in relative richness under coarse-graining.
To gain an intuition for how the number of community members changes in the face of coarse-graining, we can examine the fraction of OTUs that remain across scales of (a) taxonomic and (b) phylogenetic coarse-graining. In (b) the mean fraction across environments for a given taxonomic rank is plotted as a point of reference.
Figure 2 with 13 supplements
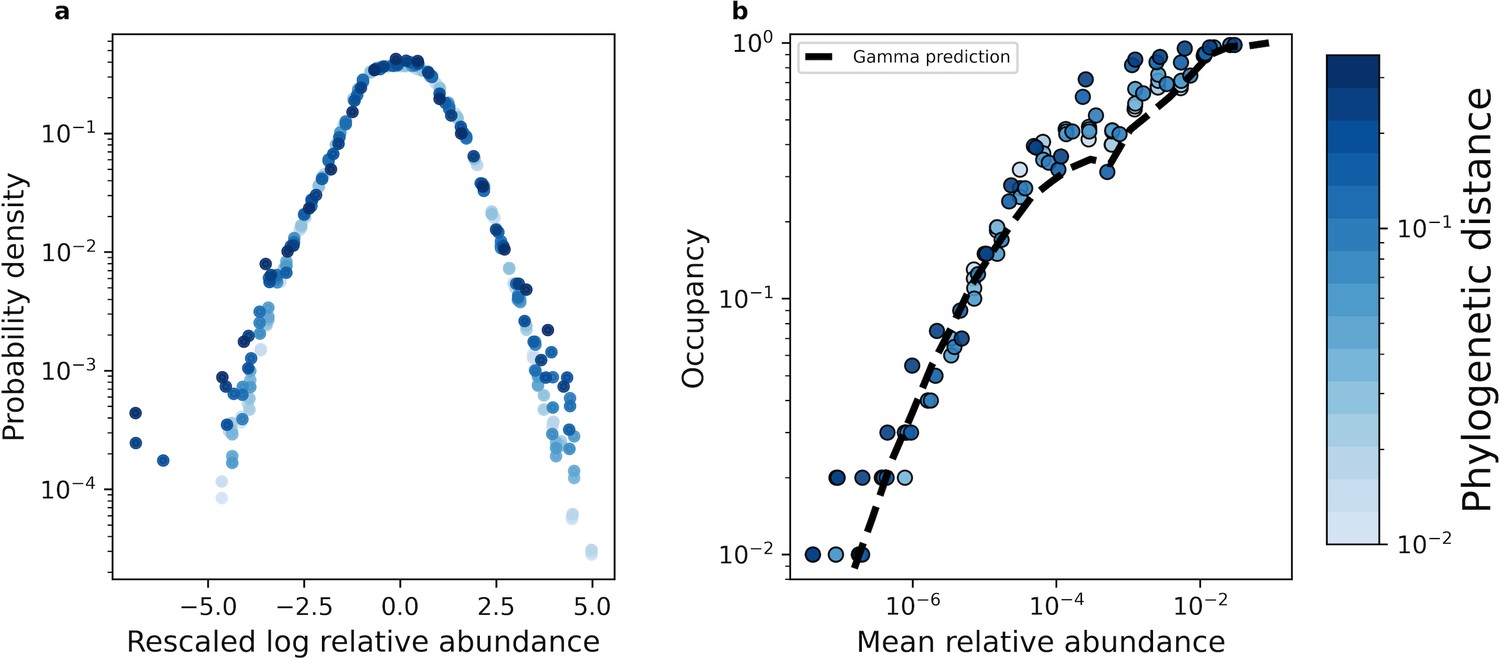
The shape of the AFD remained qualitatively invariant under coarse-graining.
(a) Under phylogenetic coarse-graining the general shape of the AFD for OTUs that were present in all sites (i.e. an occupancy of one) remained qualitatively invariant. (b) Similarly, the shape of the relationship between the mean coarse-grained abundance across hosts and occupancy across sites did not tend to vary. Predictions obtained from the gamma distribution are capable of capturing the relationship between the mean abundance and occupancy, suggesting that the gamma distribution remains a useful quantitative null model under coarse-graining. All data in this plot is from the human gut microbiome.
Figure 2—figure supplement 1
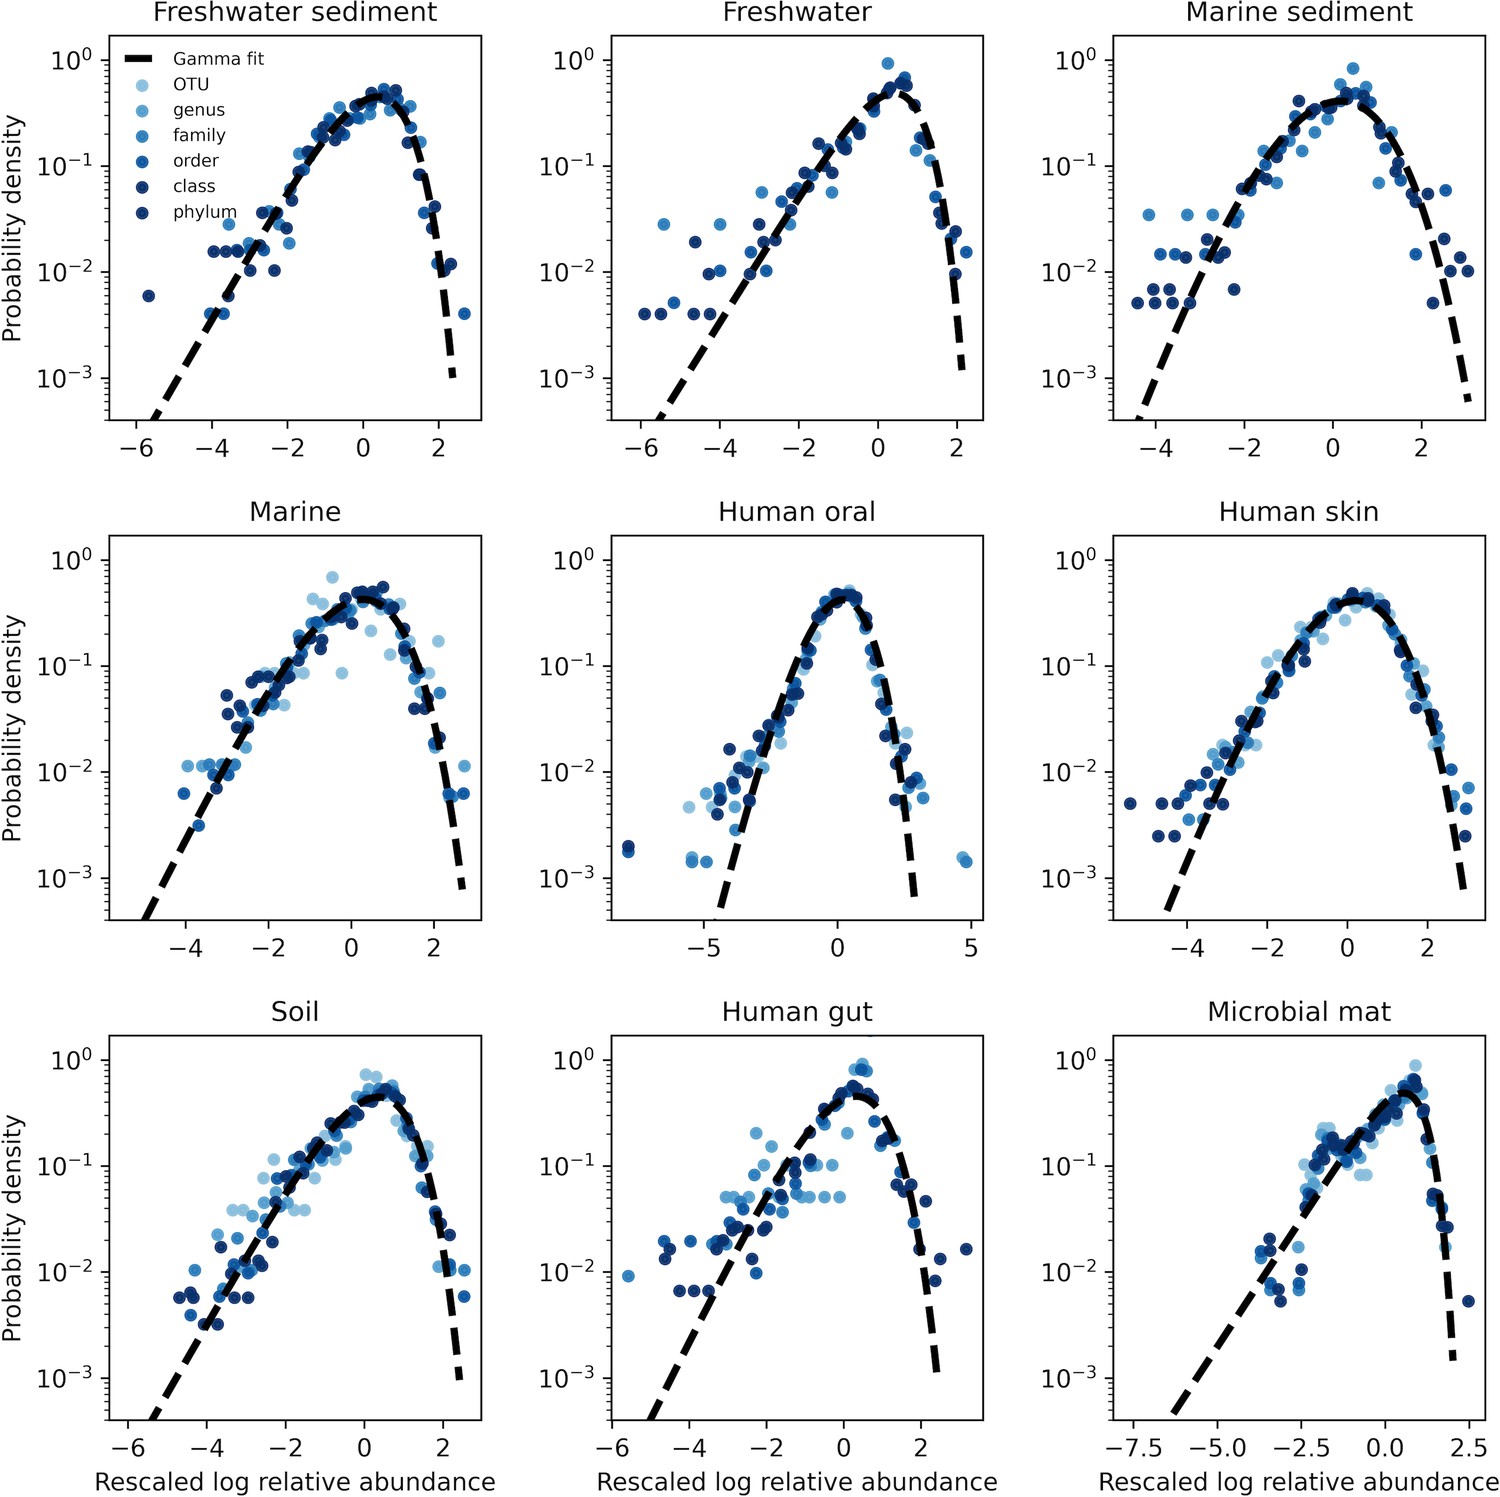
The AFD of all environments under taxonomic coarse-graining.
To control for the effect of sampling we only examined the AFDs of OTUs that were present in all sites (i.e. an occupancy of one). The single exception was the microbial mat, where we used a minimum occupancy of 0.75 as the environment harbored no OTUs that were present among all sites. Black lines represent fits of the gamma distribution obtained using SciPy.
Figure 2—figure supplement 2

The AFD of all environments under phylogenetic coarse-graining.
To control for the effect of sampling we only examined the AFDs of OTUs that were present in all sites (i.e. an occupancy of one). Black lines represent fits of the gamma distribution obtained using SciPy.
Figure 2—figure supplement 3
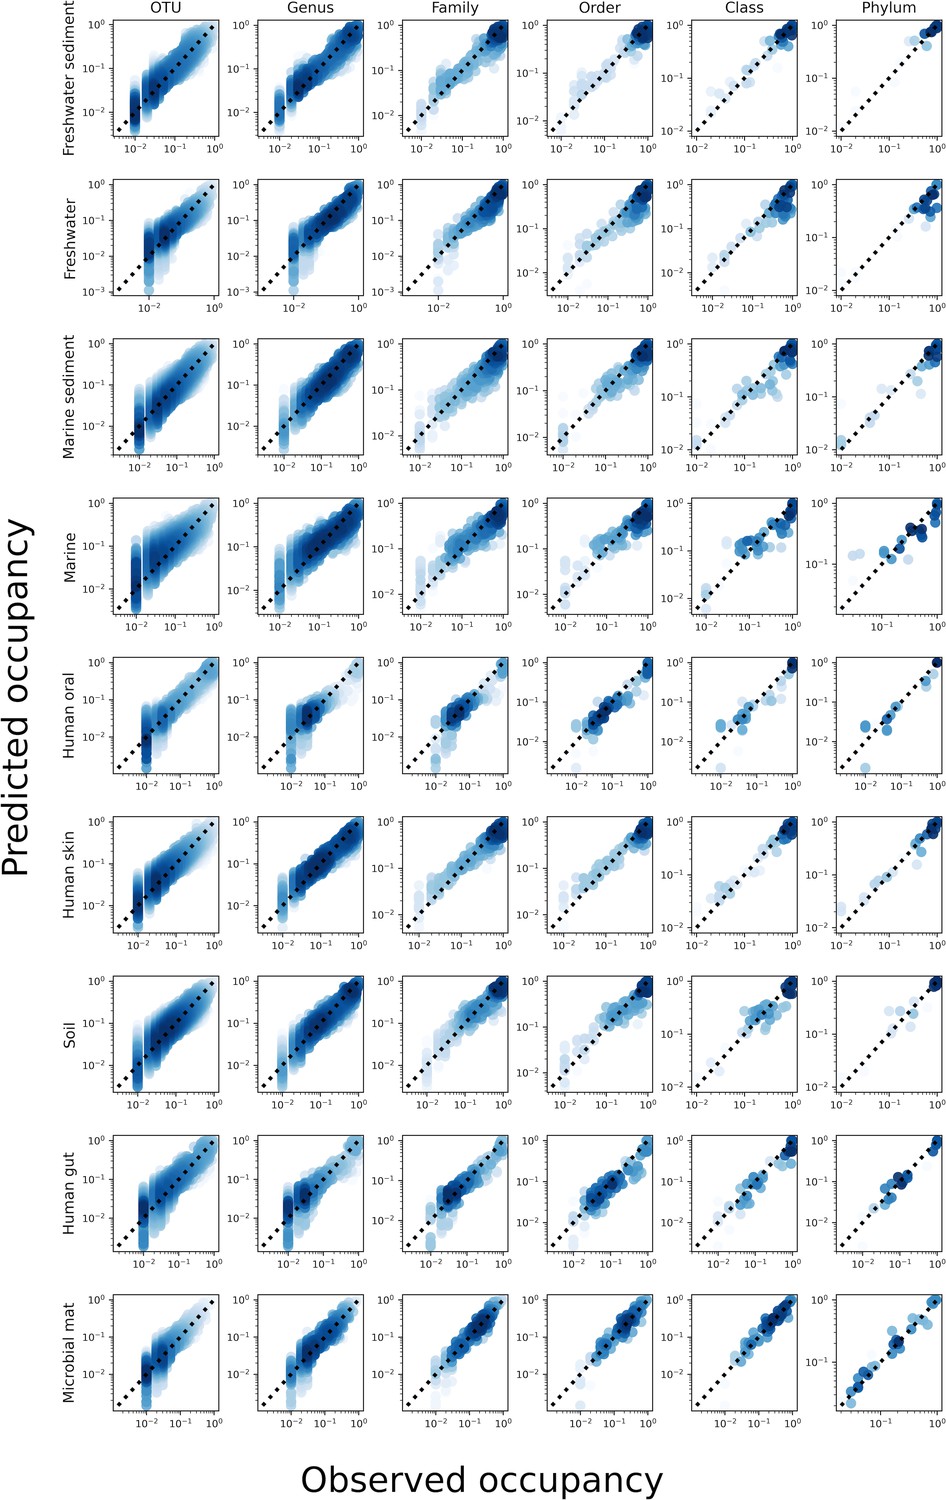
The predicted occupancy across sites for a gamma-distributed AFD under taxonomic coarse-graining for all environments.
Figure 2—figure supplement 4
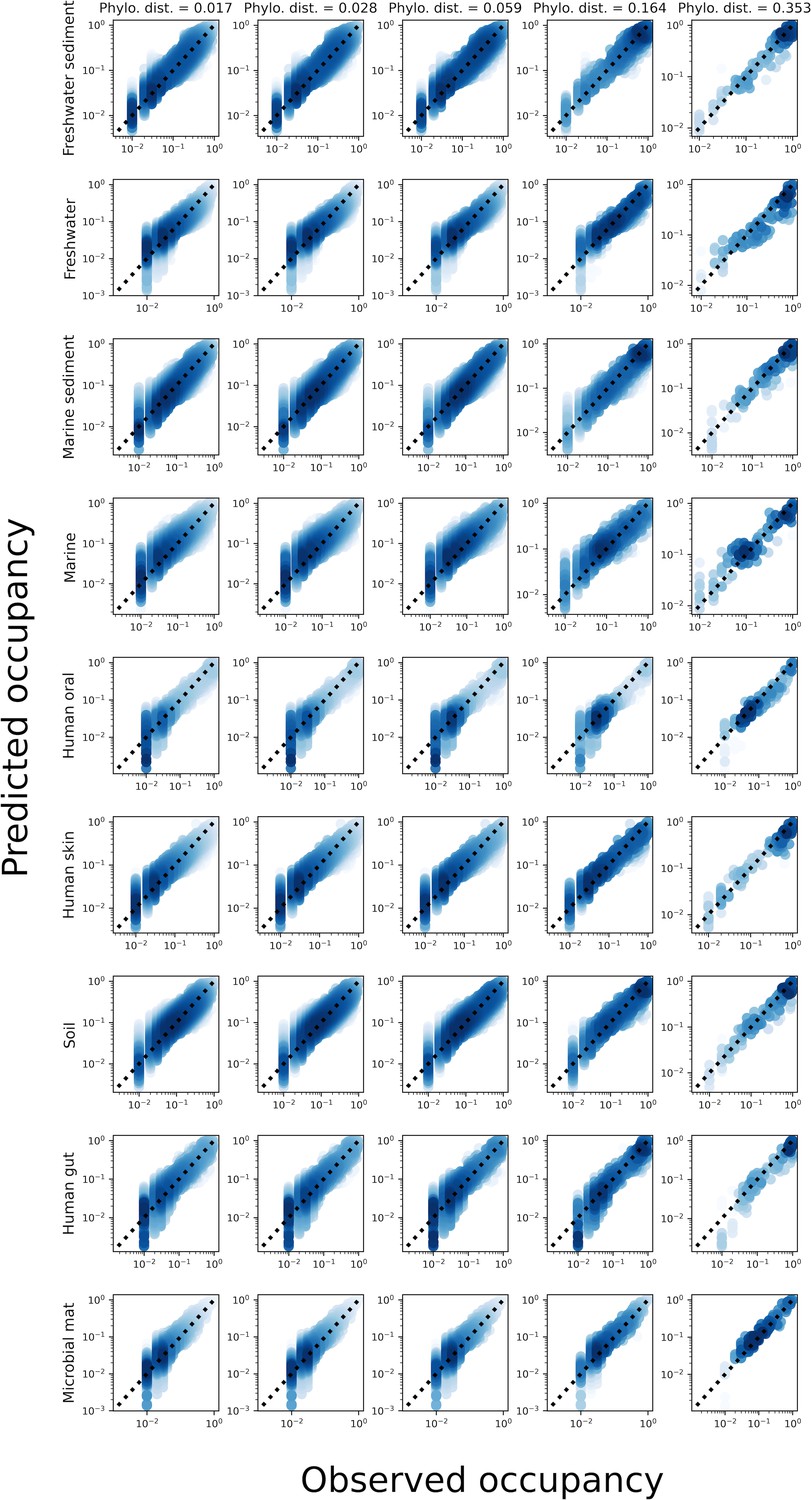
The predicted occupancy across sites for a gamma distributed AFD under phylogenetic coarse-graining for all environments.
Figure 2—figure supplement 5
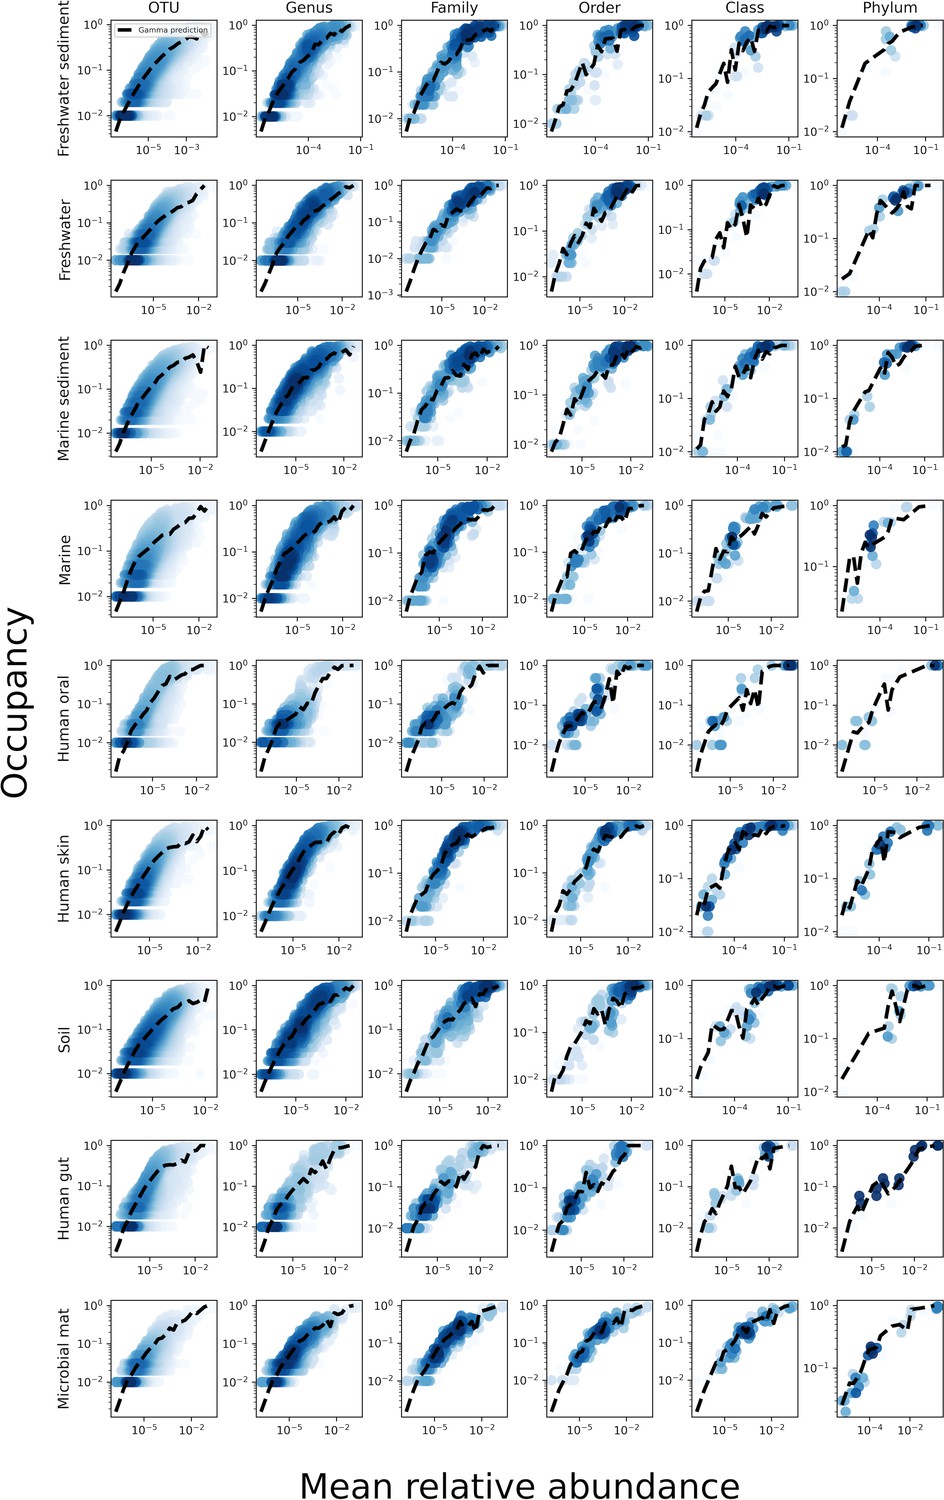
The relationship between the mean abundance across sites and the occupancy for various taxonomic coarse-graining scales.
The black line represents the prediction of the gamma distribution.
Figure 2—figure supplement 6
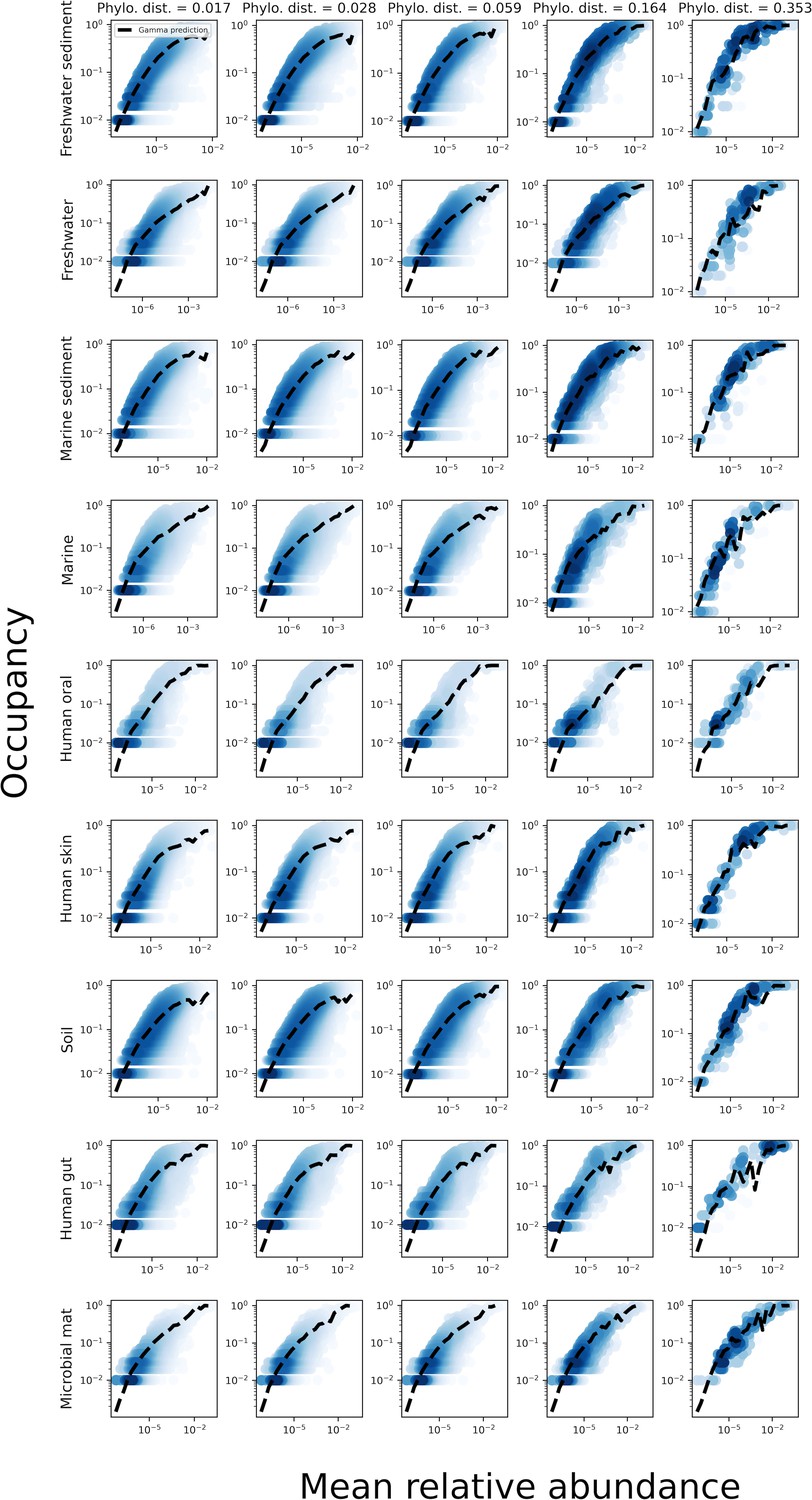
The relationship between the mean abundance across sites and the occupancy for various phylogenetic coarse-graining scales.
The black line represents the prediction of the gamma distribution.
Figure 2—figure supplement 7
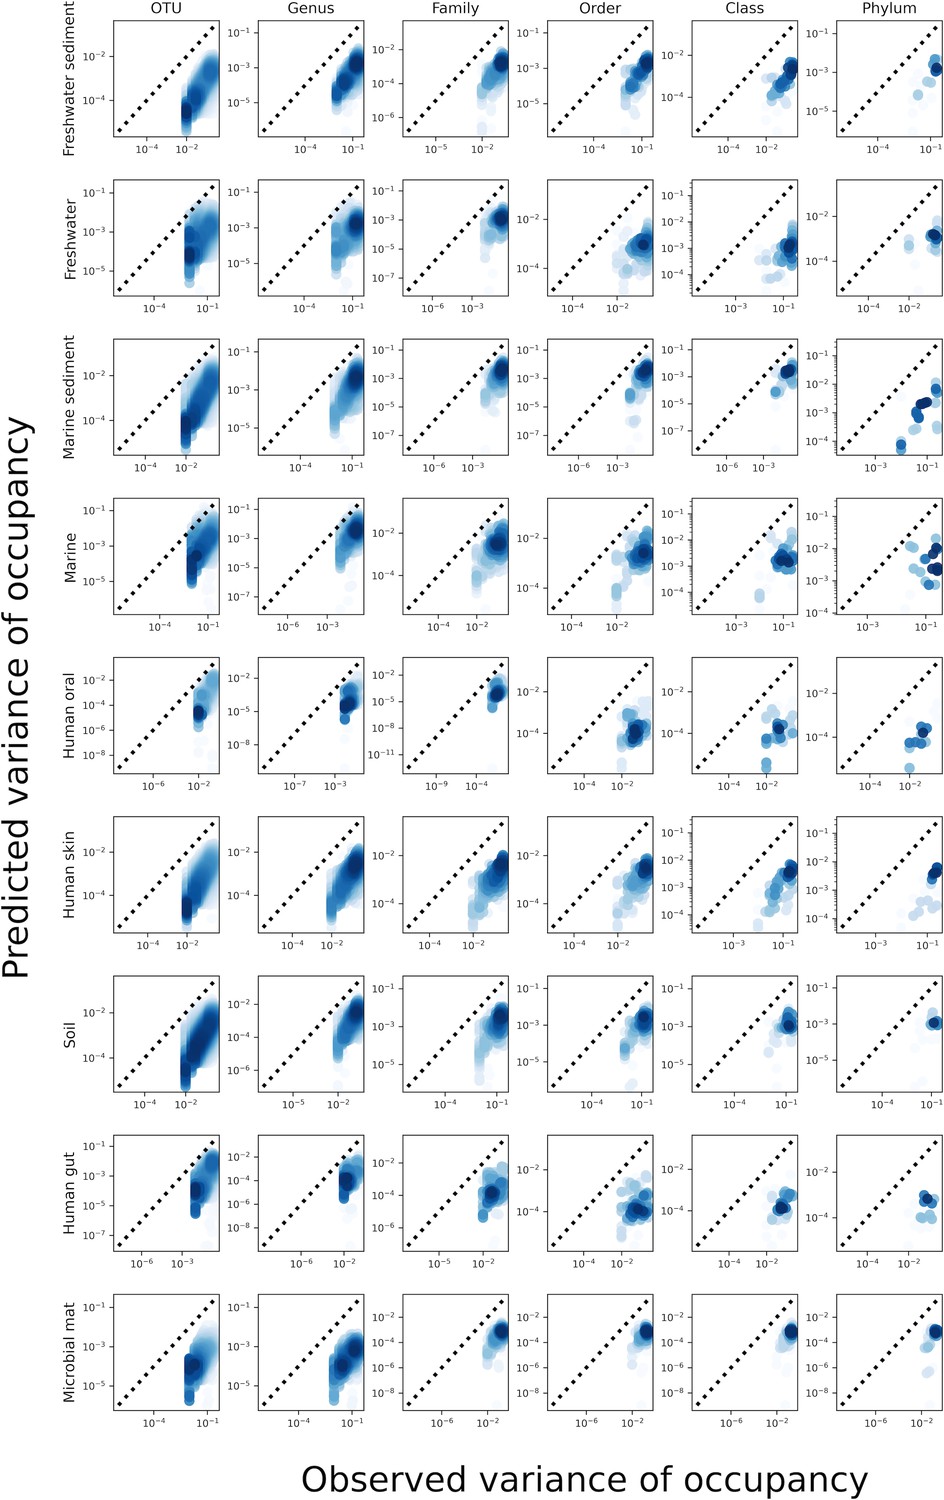
Predictions of the variance of occupancy failed across taxonomic coarse-graining thresholds.
While the gamma distribution succeeded in predicting mean occupancy, it failed to predict the variance of occupancy.
Figure 2—figure supplement 8
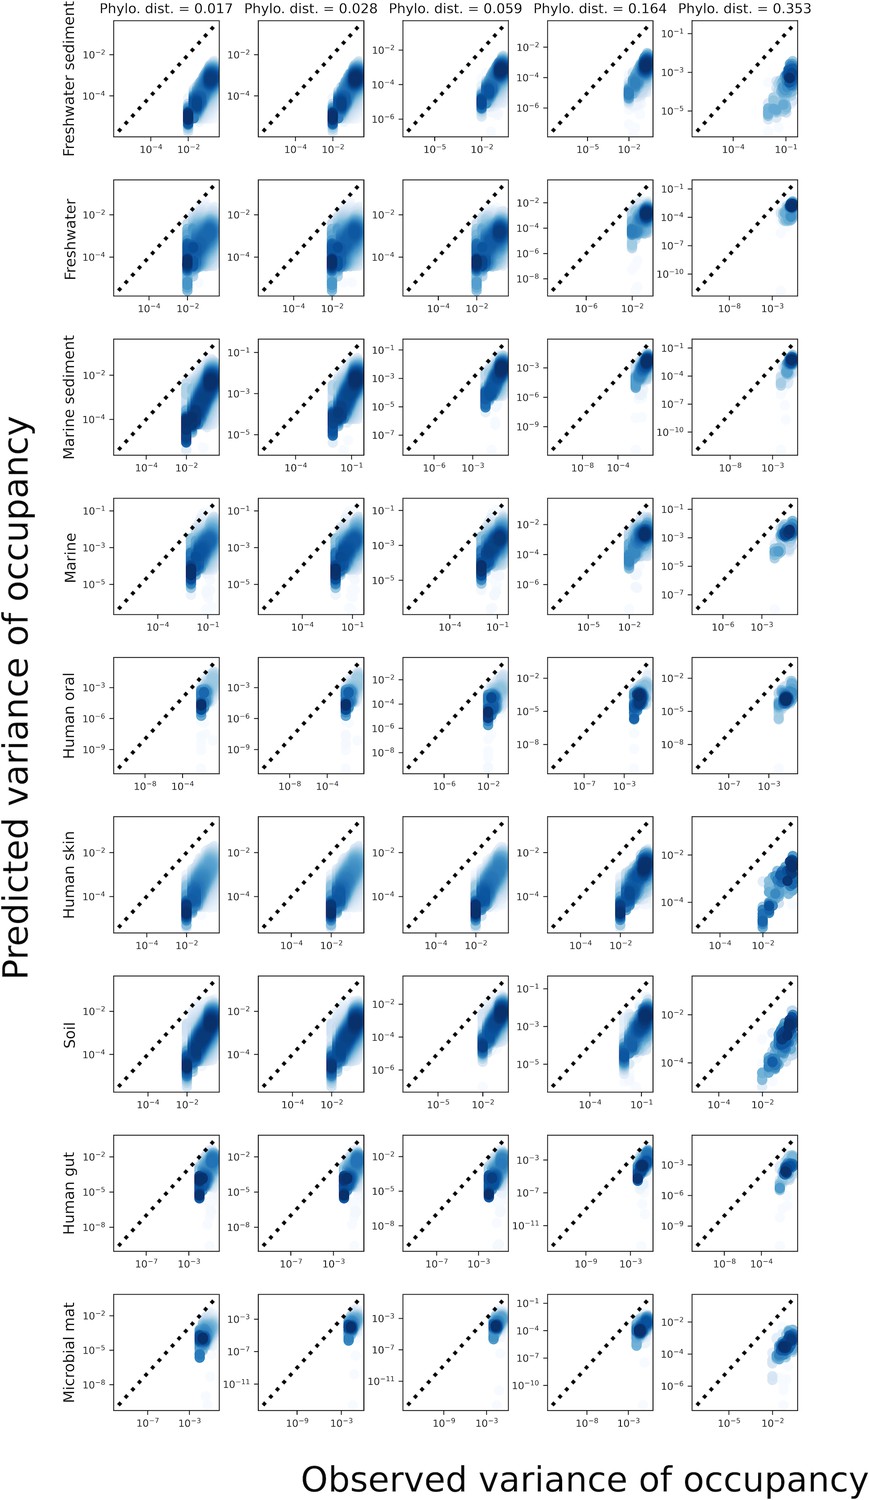
Predictions of the variance of occupancy failed across phylogenetic coarse-graining thresholds.
Analogous plot of Figure 2—figure supplement 7 for phylogenetic coarse-graining.
Figure 2—figure supplement 9

Occupancy predictions of the gamma remained invariant despite coarse-graining.
Despite (a) taxonomic and (b) phylogenetic coarse-graining the mean relative error of occupancy predictions using the gamma did not increase. Instead, the error tended to decline over extended coarse-graining scales, only increasing for phylogenetic coarse-graining when communities were coarse-grained to ≲5 members.
Figure 2—figure supplement 10
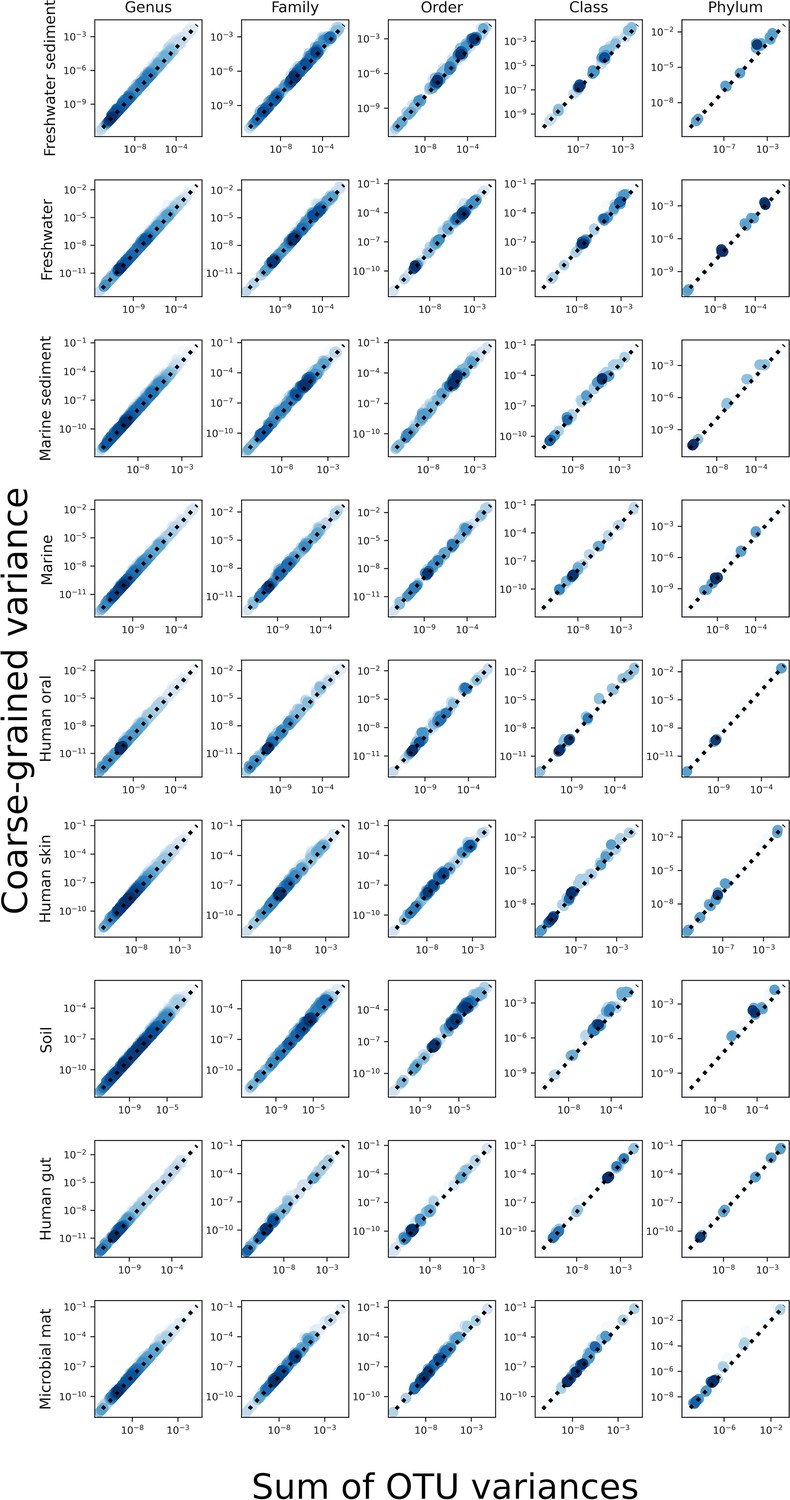
The sum of the variances of OTUs was close to the value of the variance of a taxonomic coarse-grained group, implying that the contribution of covariance to the variance of a given coarse-grained group was low.
Figure 2—figure supplement 11

The analysis presented in Figure 2—figure supplement 10 but for phylogenetic coarse-graining.
Figure 2—figure supplement 12

The plot presented in Figure 2—figure supplement 10 but with the ratio of coarse and fine-grained variances plotted on the y-axis for the purpose of visualizing deviations from the 1:1 line.
Figure 2—figure supplement 13

The analysis presented in Figure 2—figure supplement 12 but for phylogenetic coarse-graining.
Figure 3 with 3 supplements
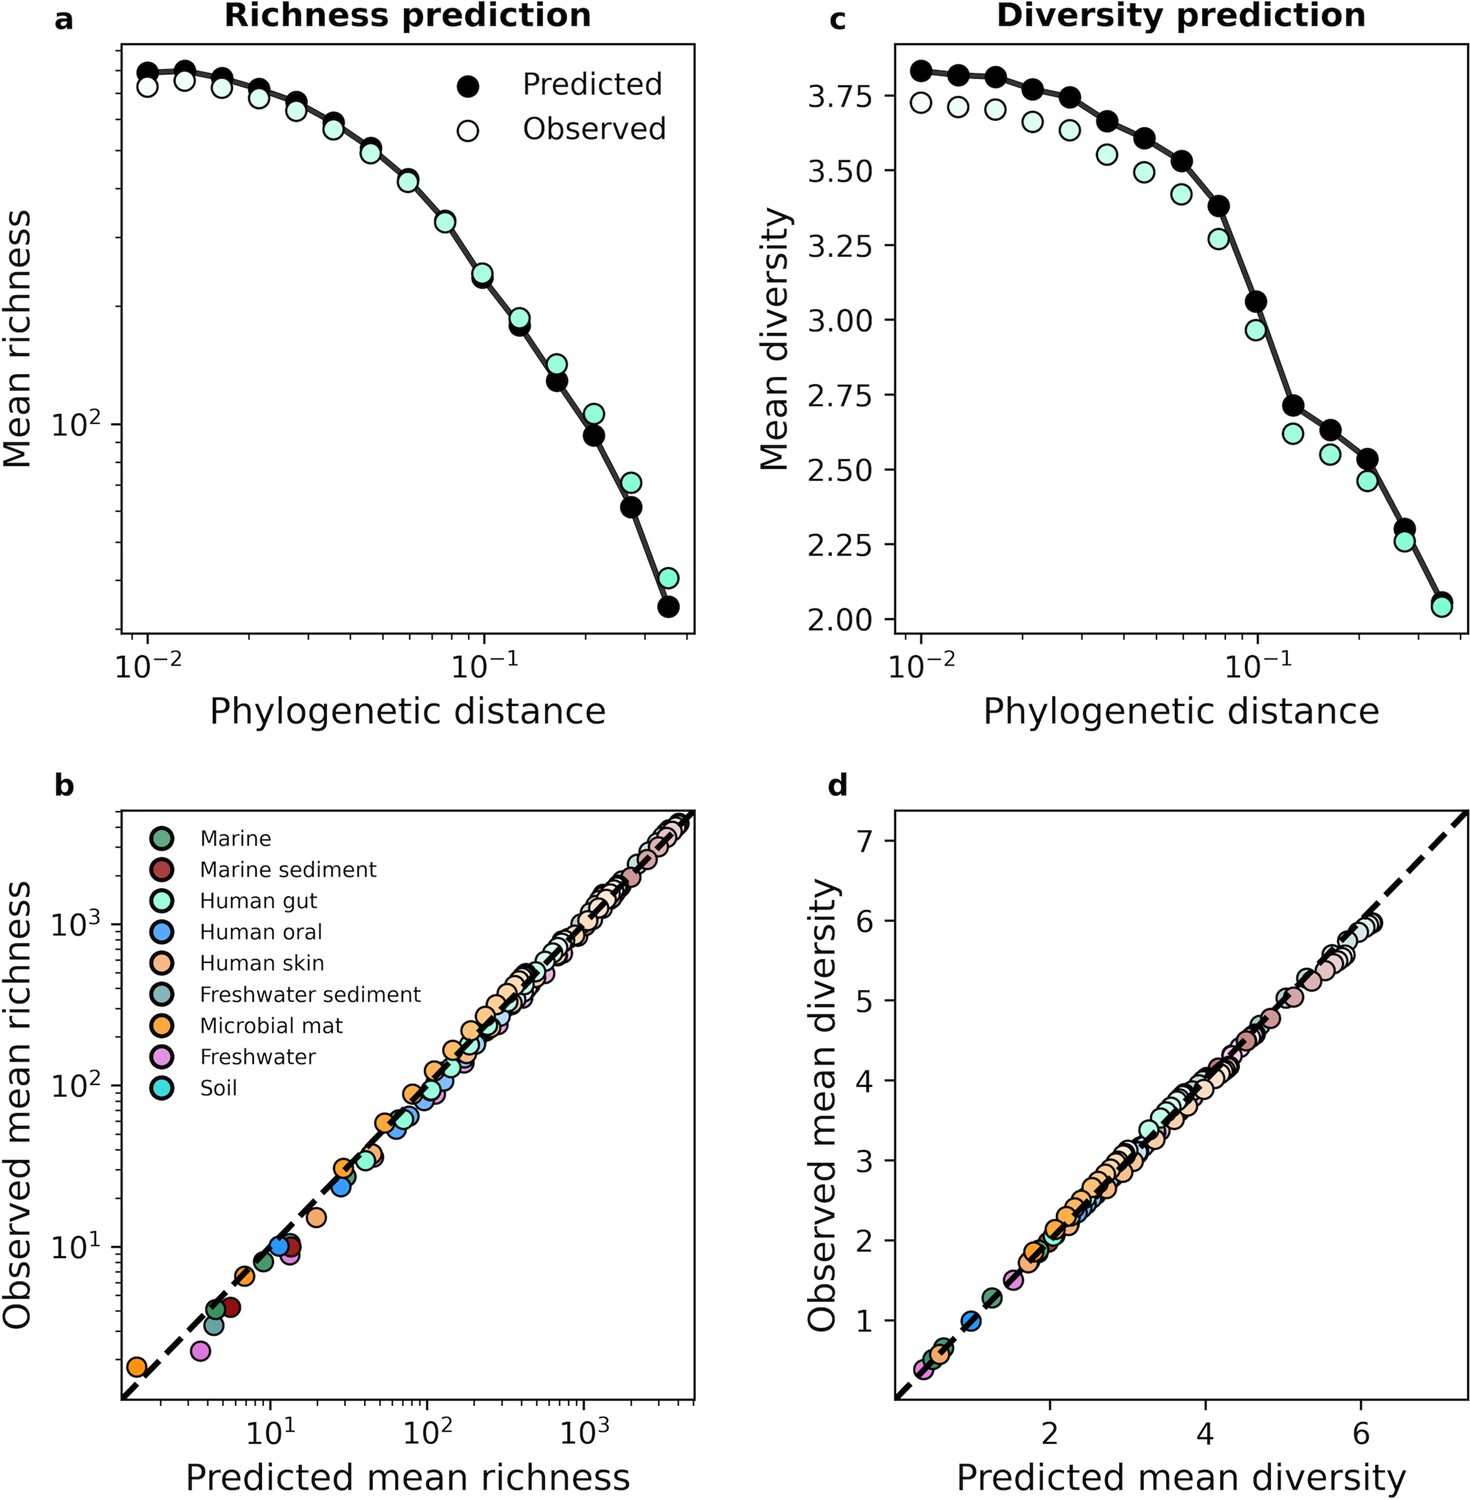
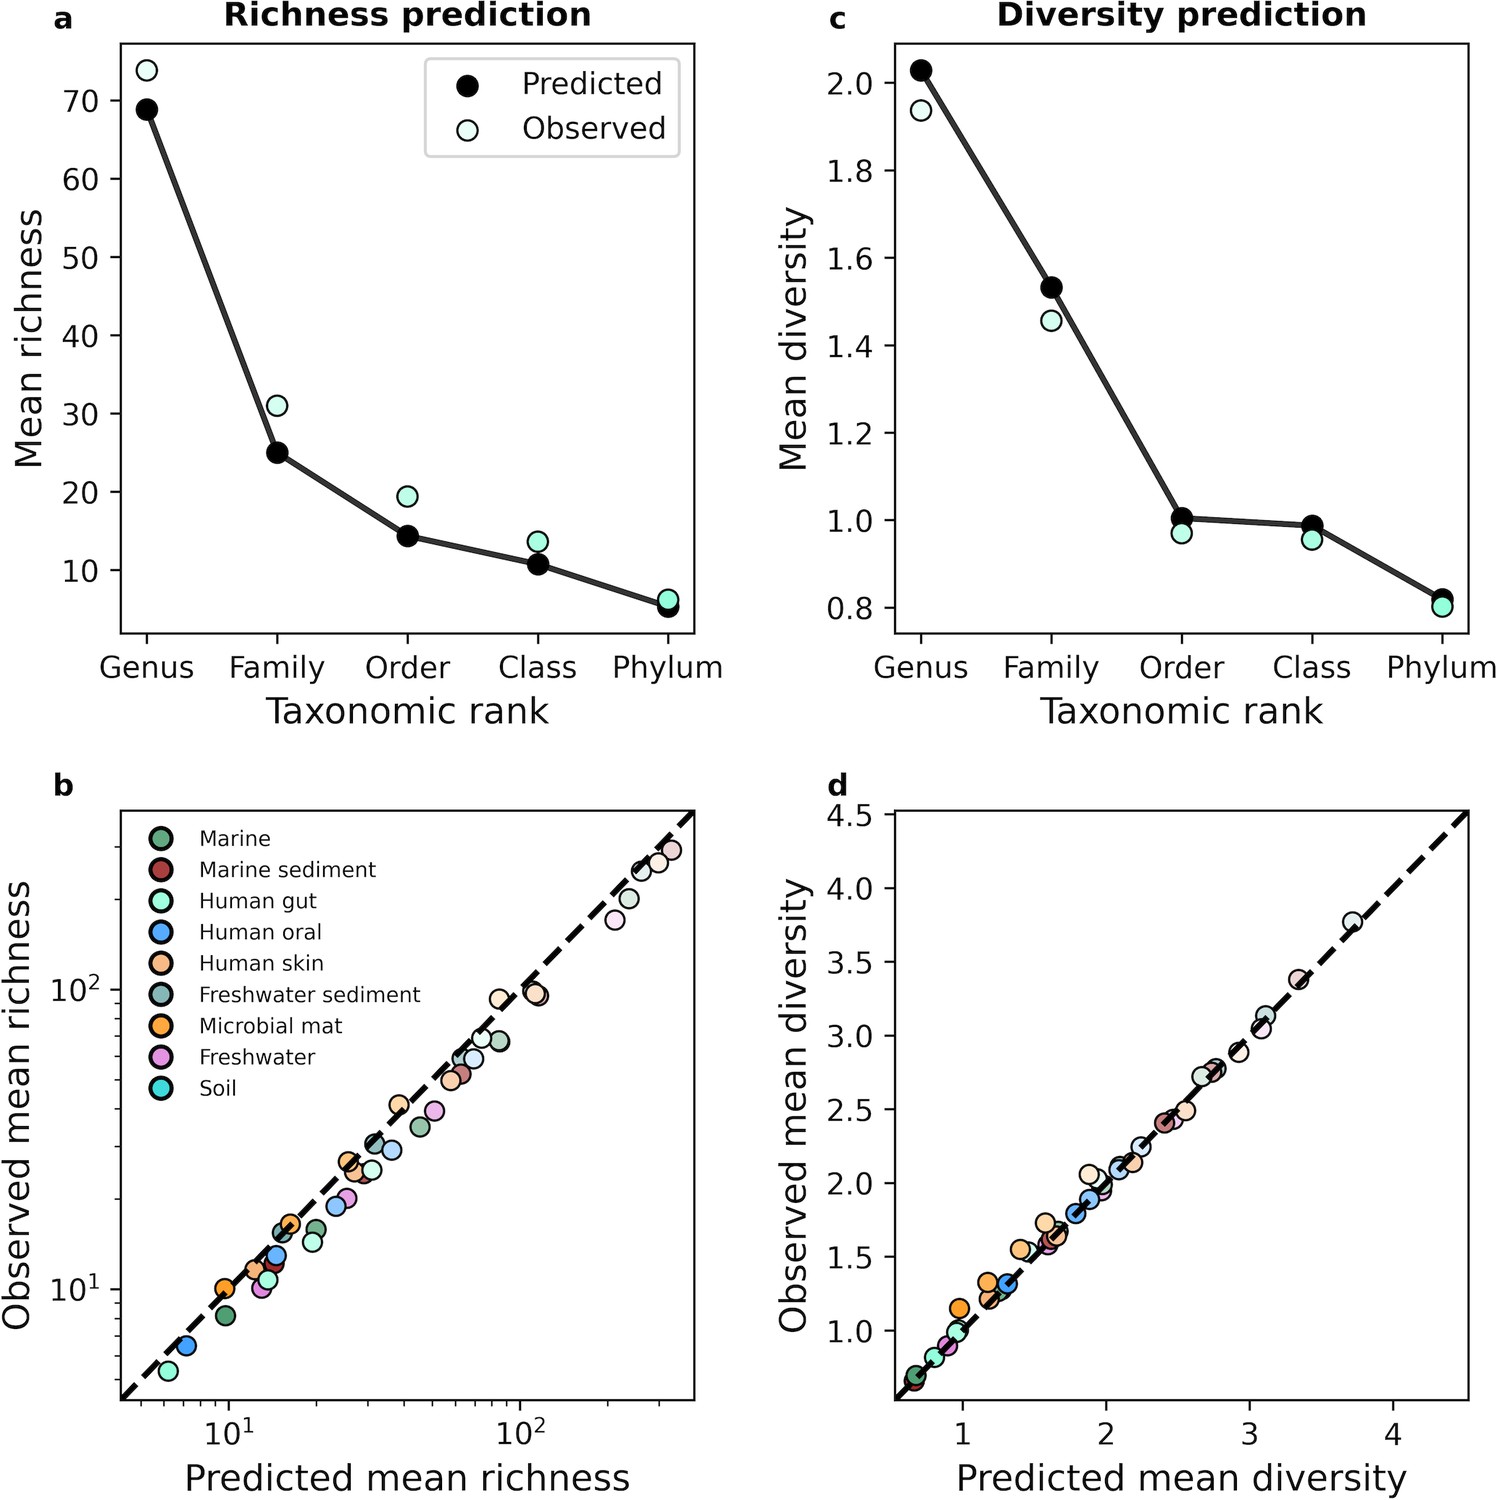
The gamma distribution successfully predicted mean richness and diversity under phylogenetic coarse-graining.
(a) The expected richness derived from the gamma distribution (Equation 13a) was capable of predicting richness across phylogenetic coarse-graining scales, as illustrated by data from the human gut. (b) Predictions remained successful across all environments, suggesting that a minimal model of zero interactions was sufficient to predict observed properties of community composition, (c, d) Similarly, predictions of expected diversity (14) also succeeded across coarse-graining scales for all environments. The shade of a color of a given datapoint represents the phylogenetic distance used for coarse-graining, with lighter colors representing finer scales and darker colors representing coarser scales.
Figure 3—figure supplement 1

The analytic predictions of the mean and variance of richness and diversity vs. the results of simulations that assume gamma-distributed AFDs and reads drawn from a multinomial distribution.
Figure 3—figure supplement 2
The gamma distribution successfully predicted mean richness and diversity under taxonomic coarse-graining.
An equivalent set of analyses is depicted in Figure 3 for taxonomic coarse-graining.
Figure 3—figure supplement 3
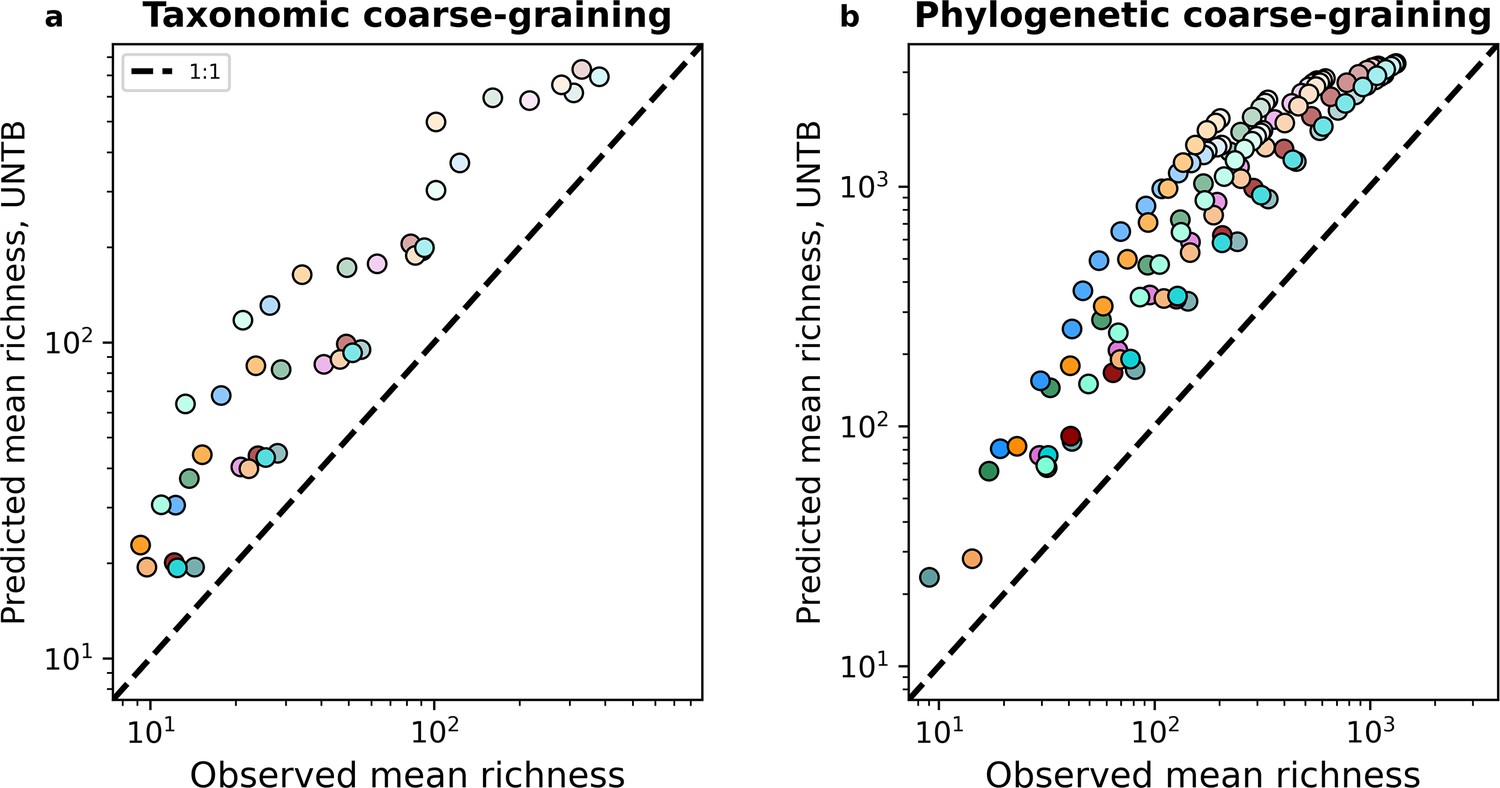
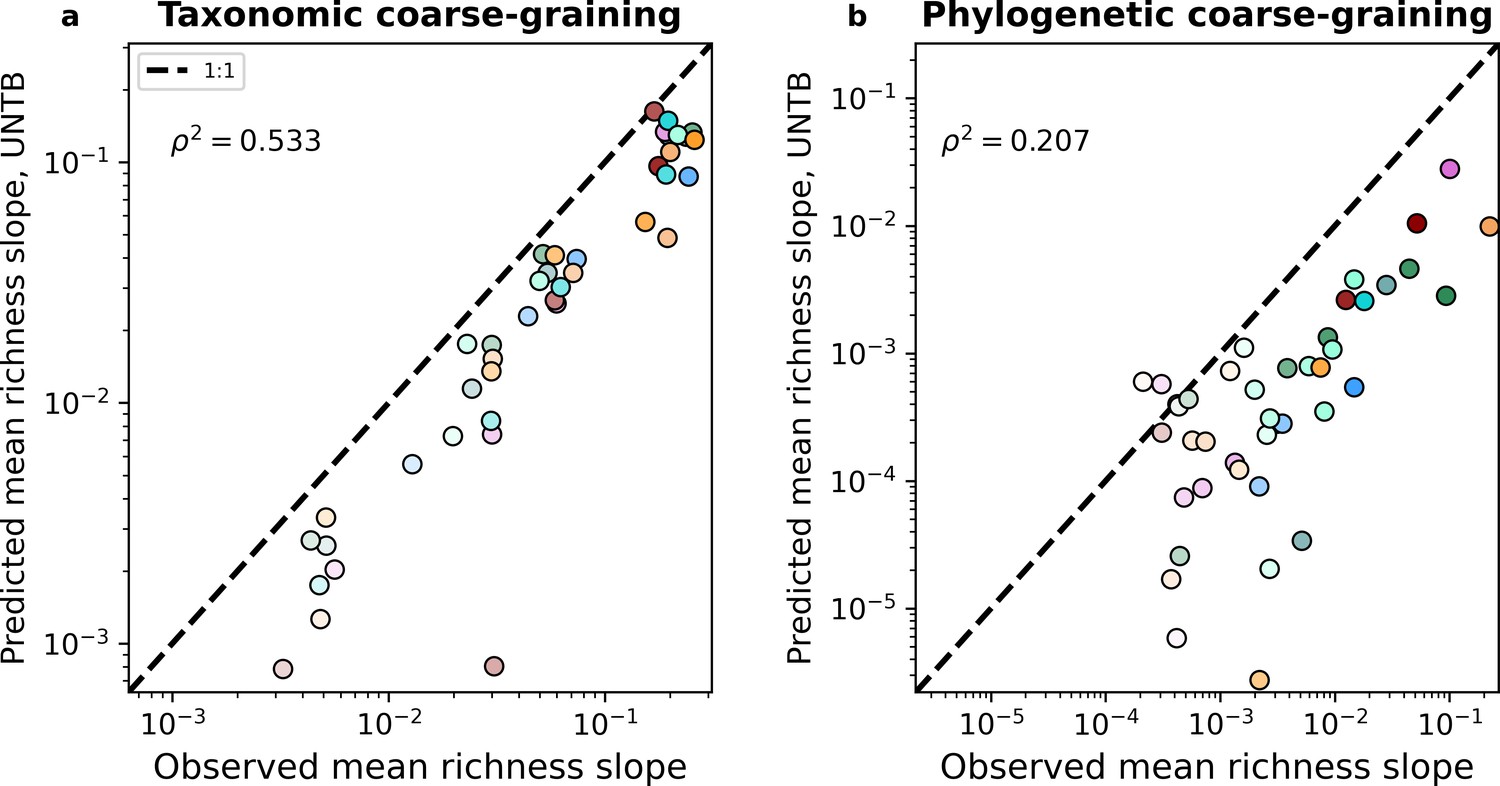
Unified Neutral Theory of Biodiversity (UNTB) failed to predict mean richness. UNTB consistently overpredicted richness under both taxonomic and phylogenetic coarse-graining.
Figure 4 with 1 supplement
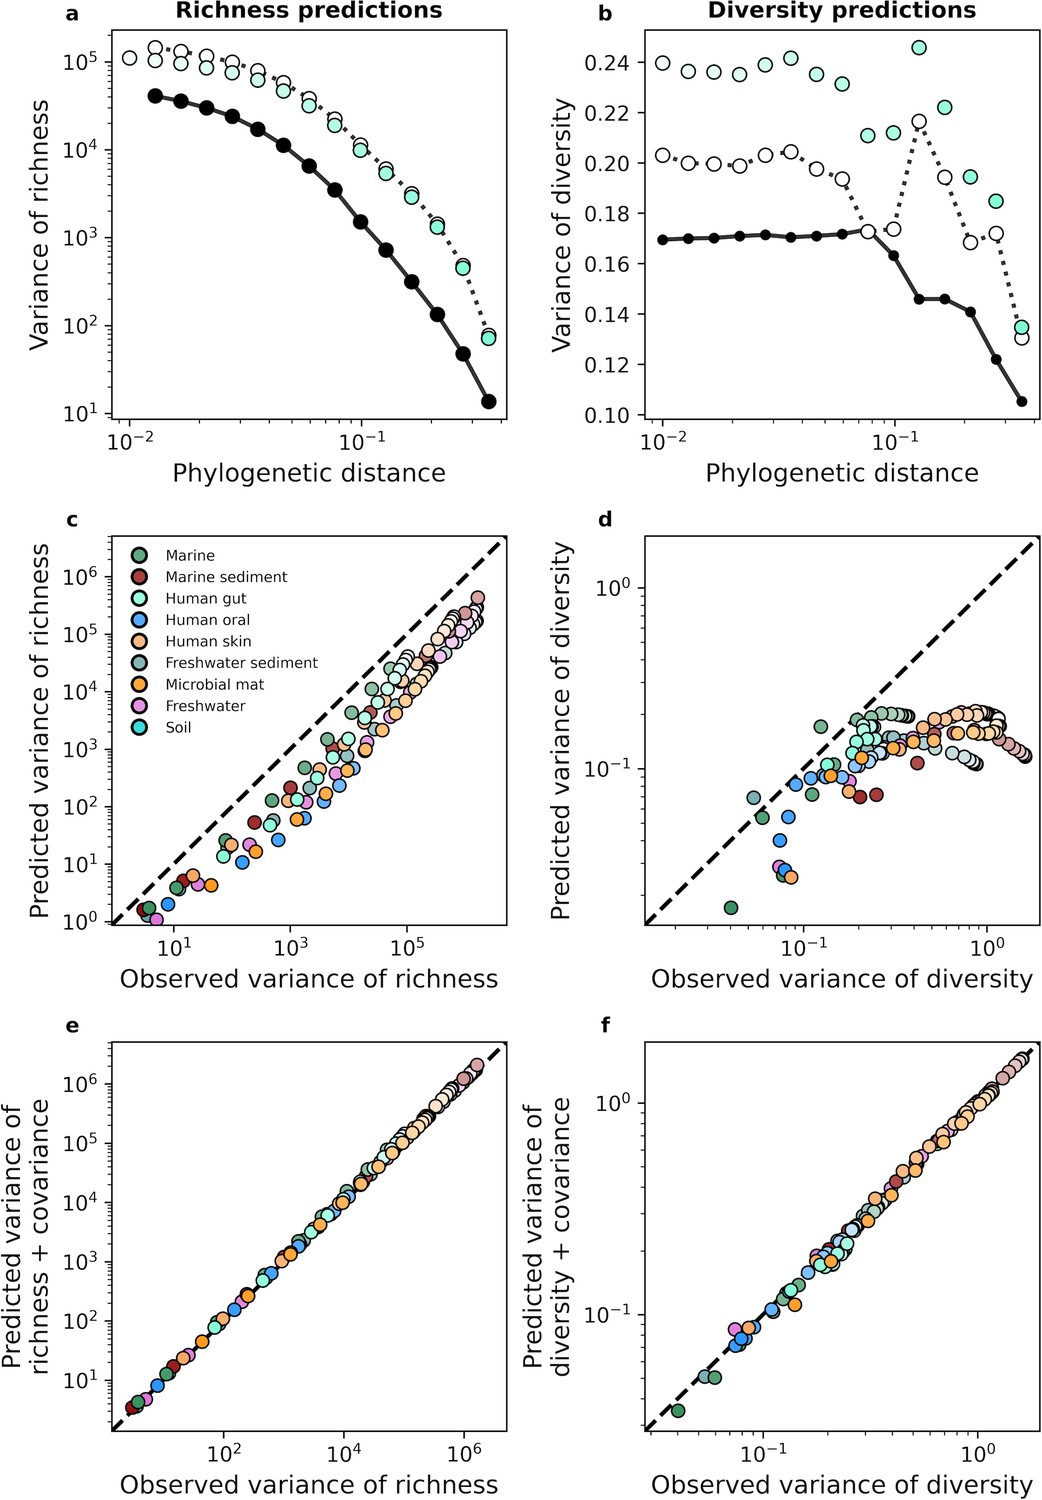
The gamma distribution only predicts the variance of richness and diversity under phylogenetic coarse-graining when covariance is included.
(a, b) In contrast with the mean, the variance of richness and diversity estimates predicted by the gamma distribution (Equation 17a) failed to capture empirical estimates from the human gut. Predictions are only comparable when empirical estimates of covariance are included in the predictions of the gamma distribution, meaning that dependence among community members is essential to describe the variation in measures of biodiversity across communities. (c, d) This lack of predictive success was constant across environments, (e, f) though the addition of covariance consistently improves our analytic predictions. The color scale used here is identical to the color scale used in Figure 3.
Figure 4—figure supplement 1
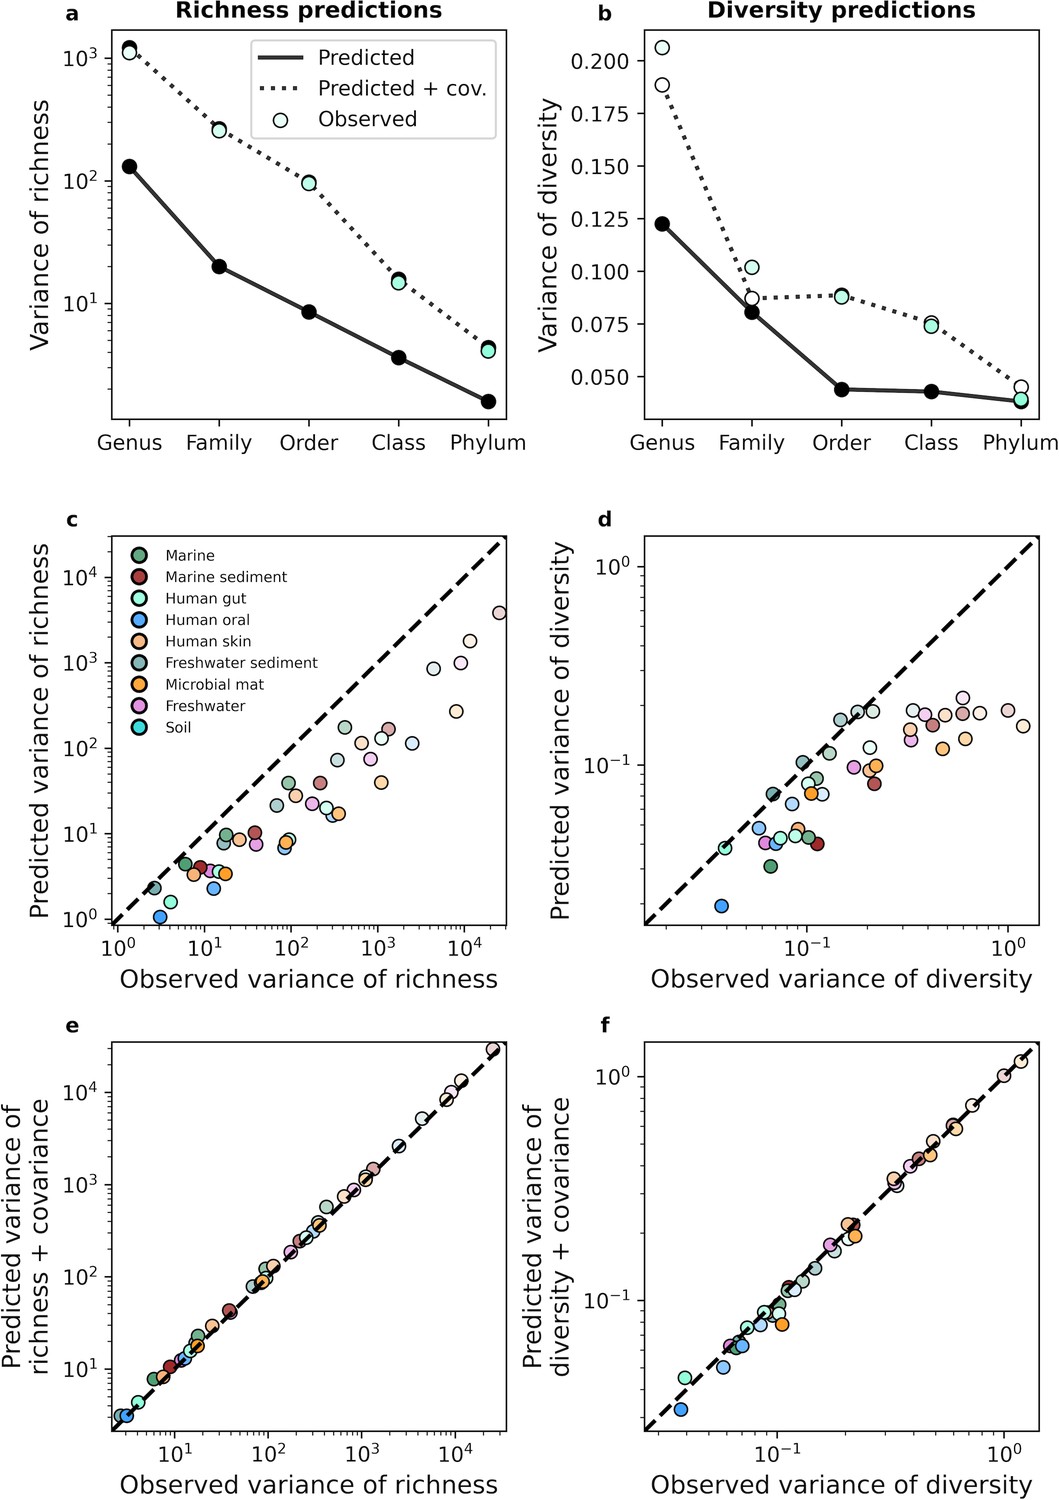
A gamma AFD can only predict the variance of richness and diversity under taxonomic coarse-graining when covariance is included.
An equivalent set of analyses is depicted in Figure 4 for taxonomic coarse-graining.
Figure 5 with 11 supplements
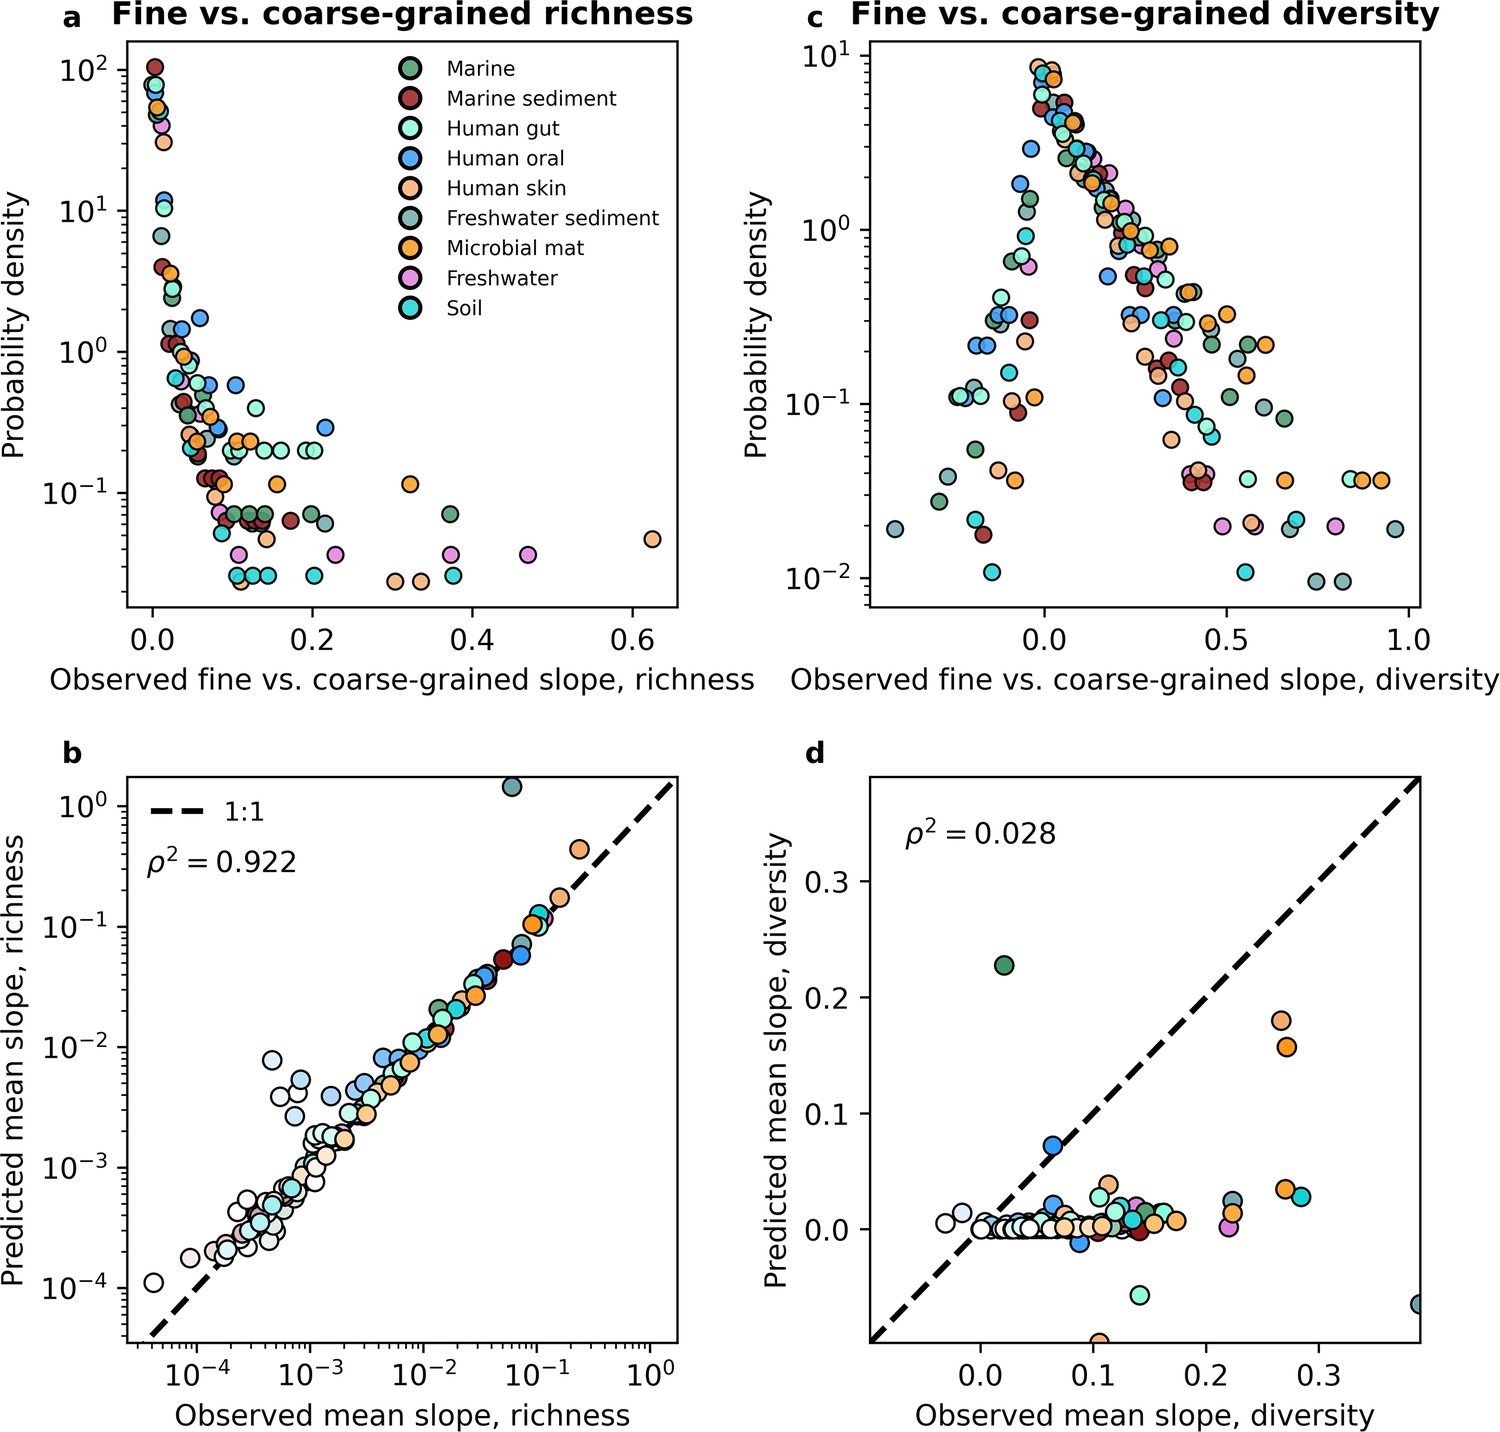
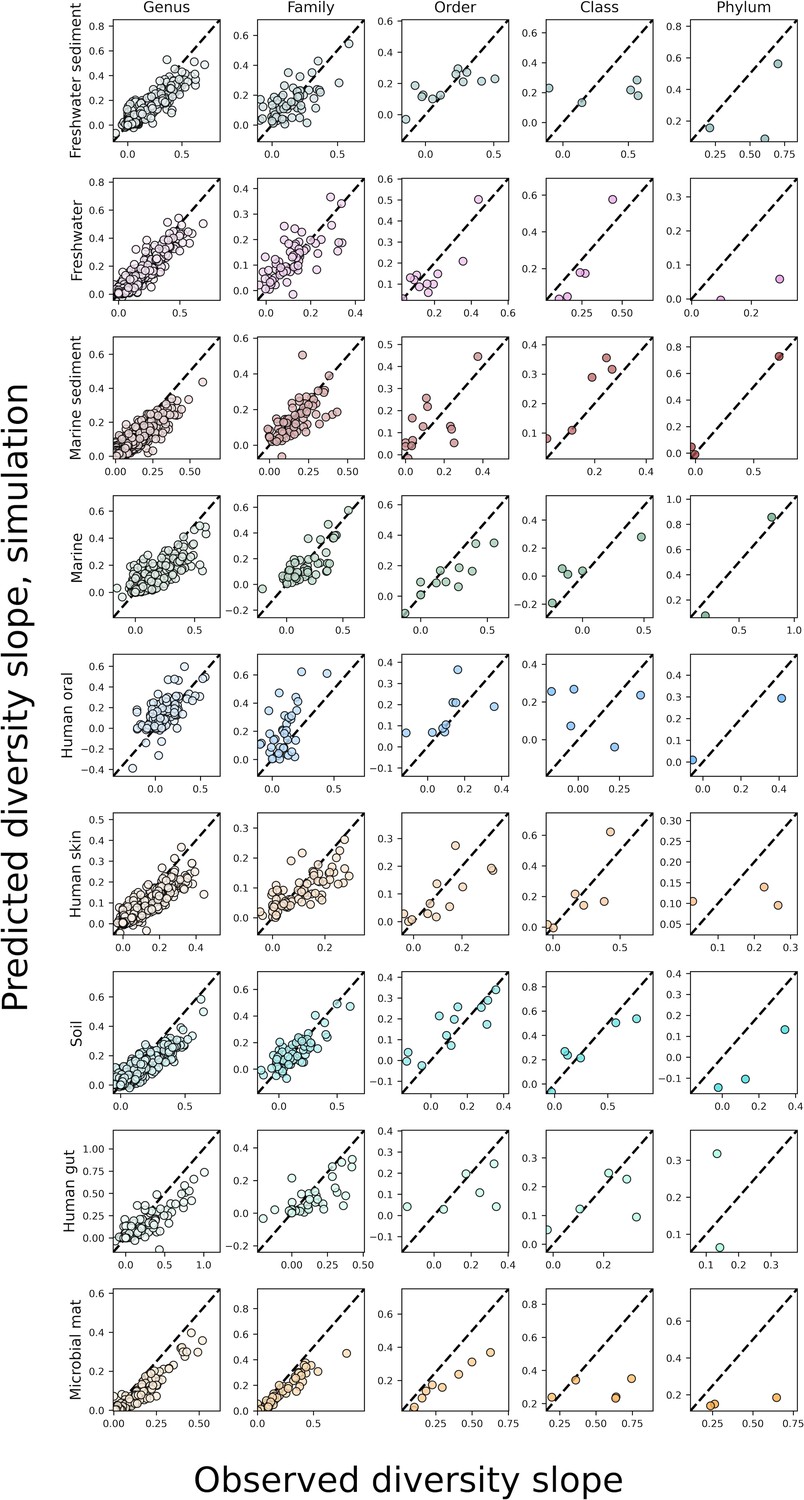
The slope of the fine vs. coarse-grained relationship for richness could be predicted by the gamma distribution, but was novel for estimates of diversity.
(a, b) The predictions of the gamma distribution (Equation 3a) successfully reproduced observed fine vs. coarse-grained richness slopes across scales of phylogenetic coarse-graining. (c, d) In contrast, the predictions of the gamma distribution failed to capture diversity slopes (Equation 4a). The color scale used here is identical to the color scale used in Figure 3. Squared Pearson correlation coefficients () are computed over all slopes for all taxa across all coarse-graining scales.
Figure 5—figure supplement 1
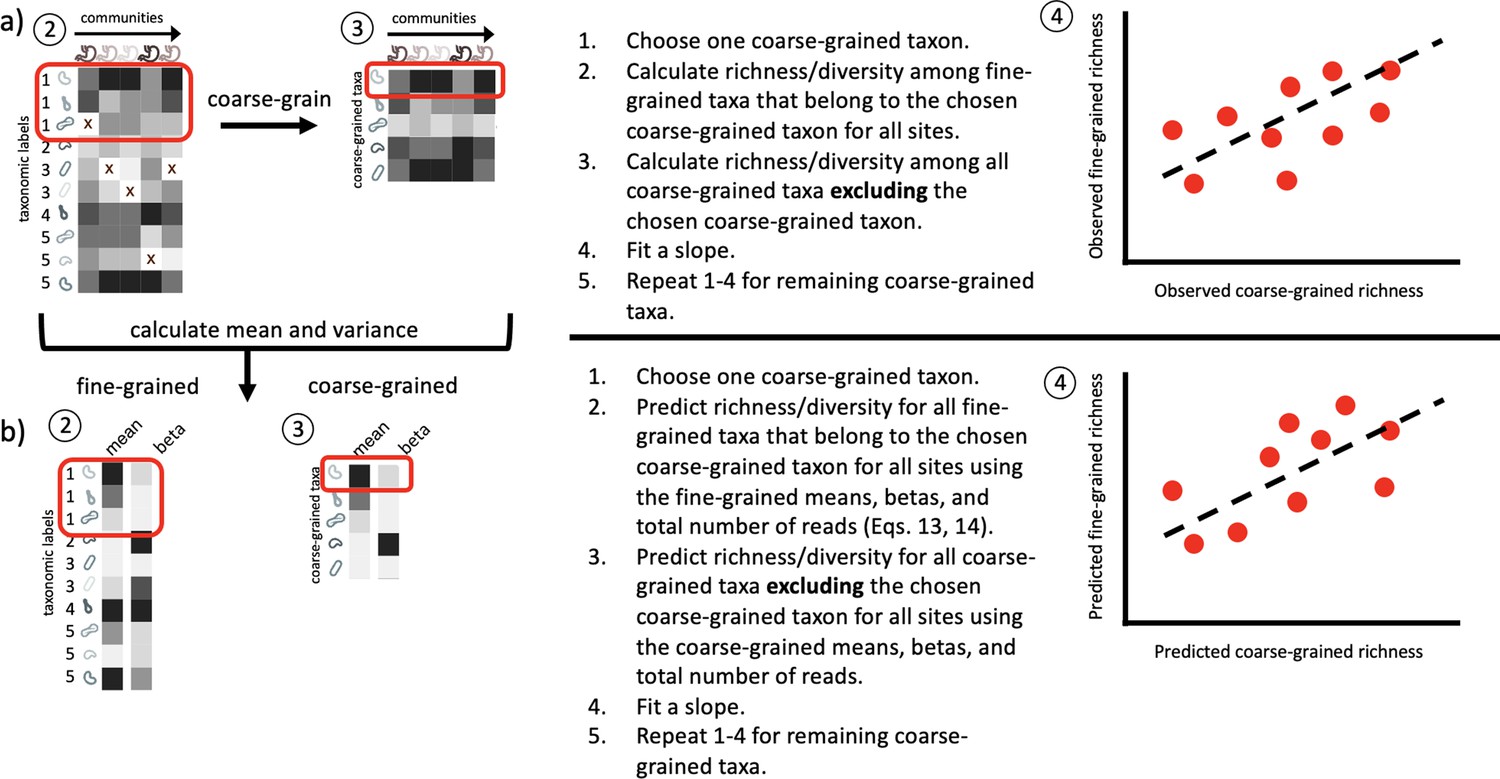
Conceptual diagram illustrating how fine vs. coarse-grained slopes are inferred.
(a) Slopes were inferred from empirical data by estimating fine and coarse-grained measures of biodiversity (for this diagram, richness) according to the leave-one-out procedure used by Madi et al., 2023. (b) The mean relative abundance and beta (squared inverse coefficient of variation) were then estimated from the data and then used to predict fine and coarse-grain estimates of a given measure of biodiversity using the same leave-one-out procedure. Separate regressions were then fit to the empirical and predicted fine and coarse-grained measures of biodiversity.
Figure 5—figure supplement 2

The gamma distribution as a tool for investigating the novelty of fine vs.coarse-grained slopes.
An equivalent set of analyses is depicted in Figure 5 for taxonomic coarse-graining.
Figure 5—figure supplement 3
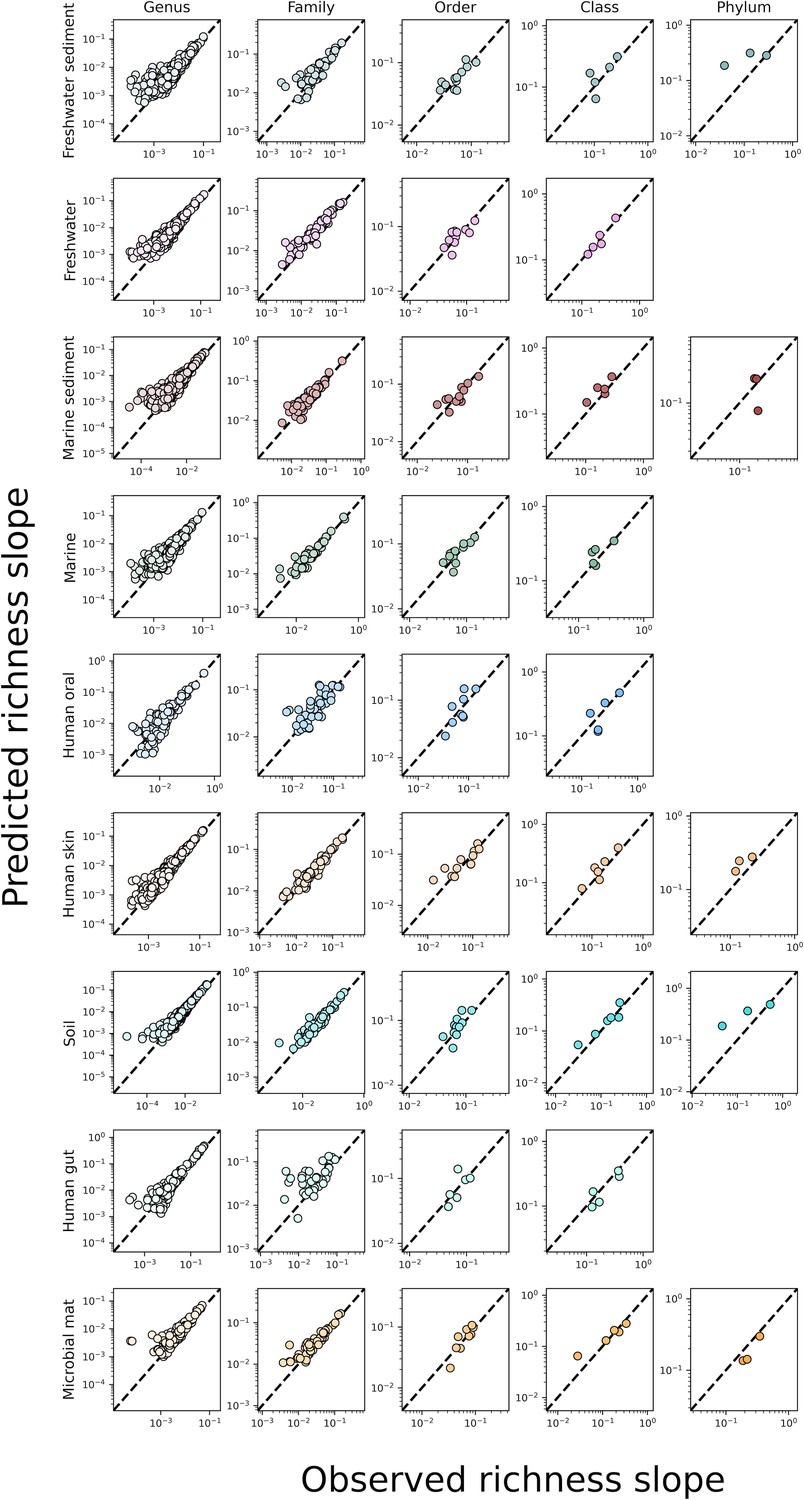
The predicted slopes of fine vs. coarse-grained richness from the sampling form of the gamma distribution under taxonomic coarse-graining.
Figure 5—figure supplement 4

The predicted slopes of fine vs. coarse-grained richness from the sampling form of the gamma distribution under phylogenetic coarse-graining.
Figure 5—figure supplement 5
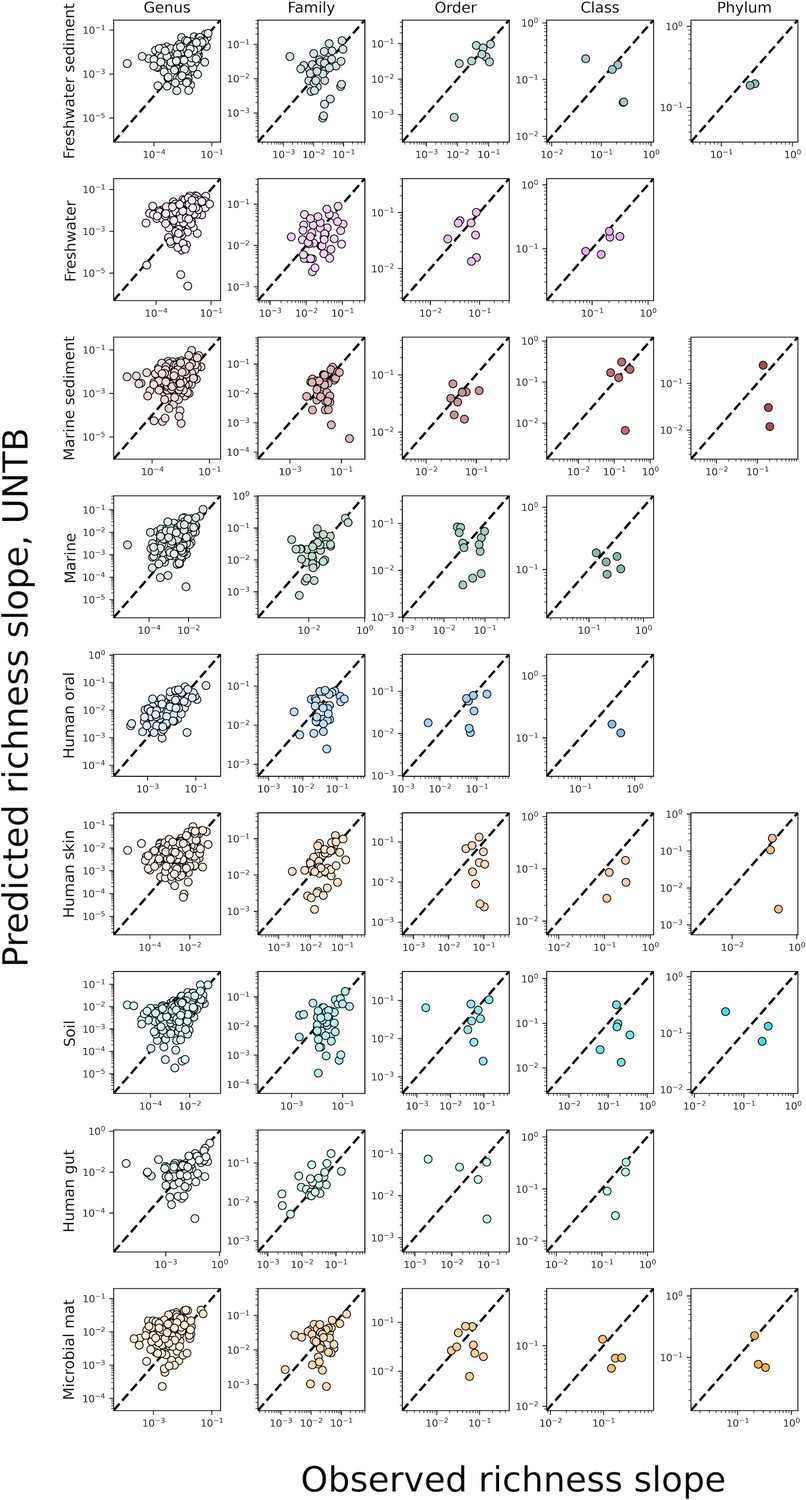
The predicted slopes of fine vs. coarse-grained richness under taxonomic coarse-graining using the UNTB.
Figure 5—figure supplement 6

The predicted slopes of fine vs. coarse-grained richness under phylogenetic coarse-graining using the UNTB.
Figure 5—figure supplement 7
The mean predicted slopes of fine vs. coarse-grained richness under (a) taxonomic and (b) phylogenetic coarse-graining using the Unified Neutral Theory of Biodiversity (UNTB).
Figure 5—figure supplement 8
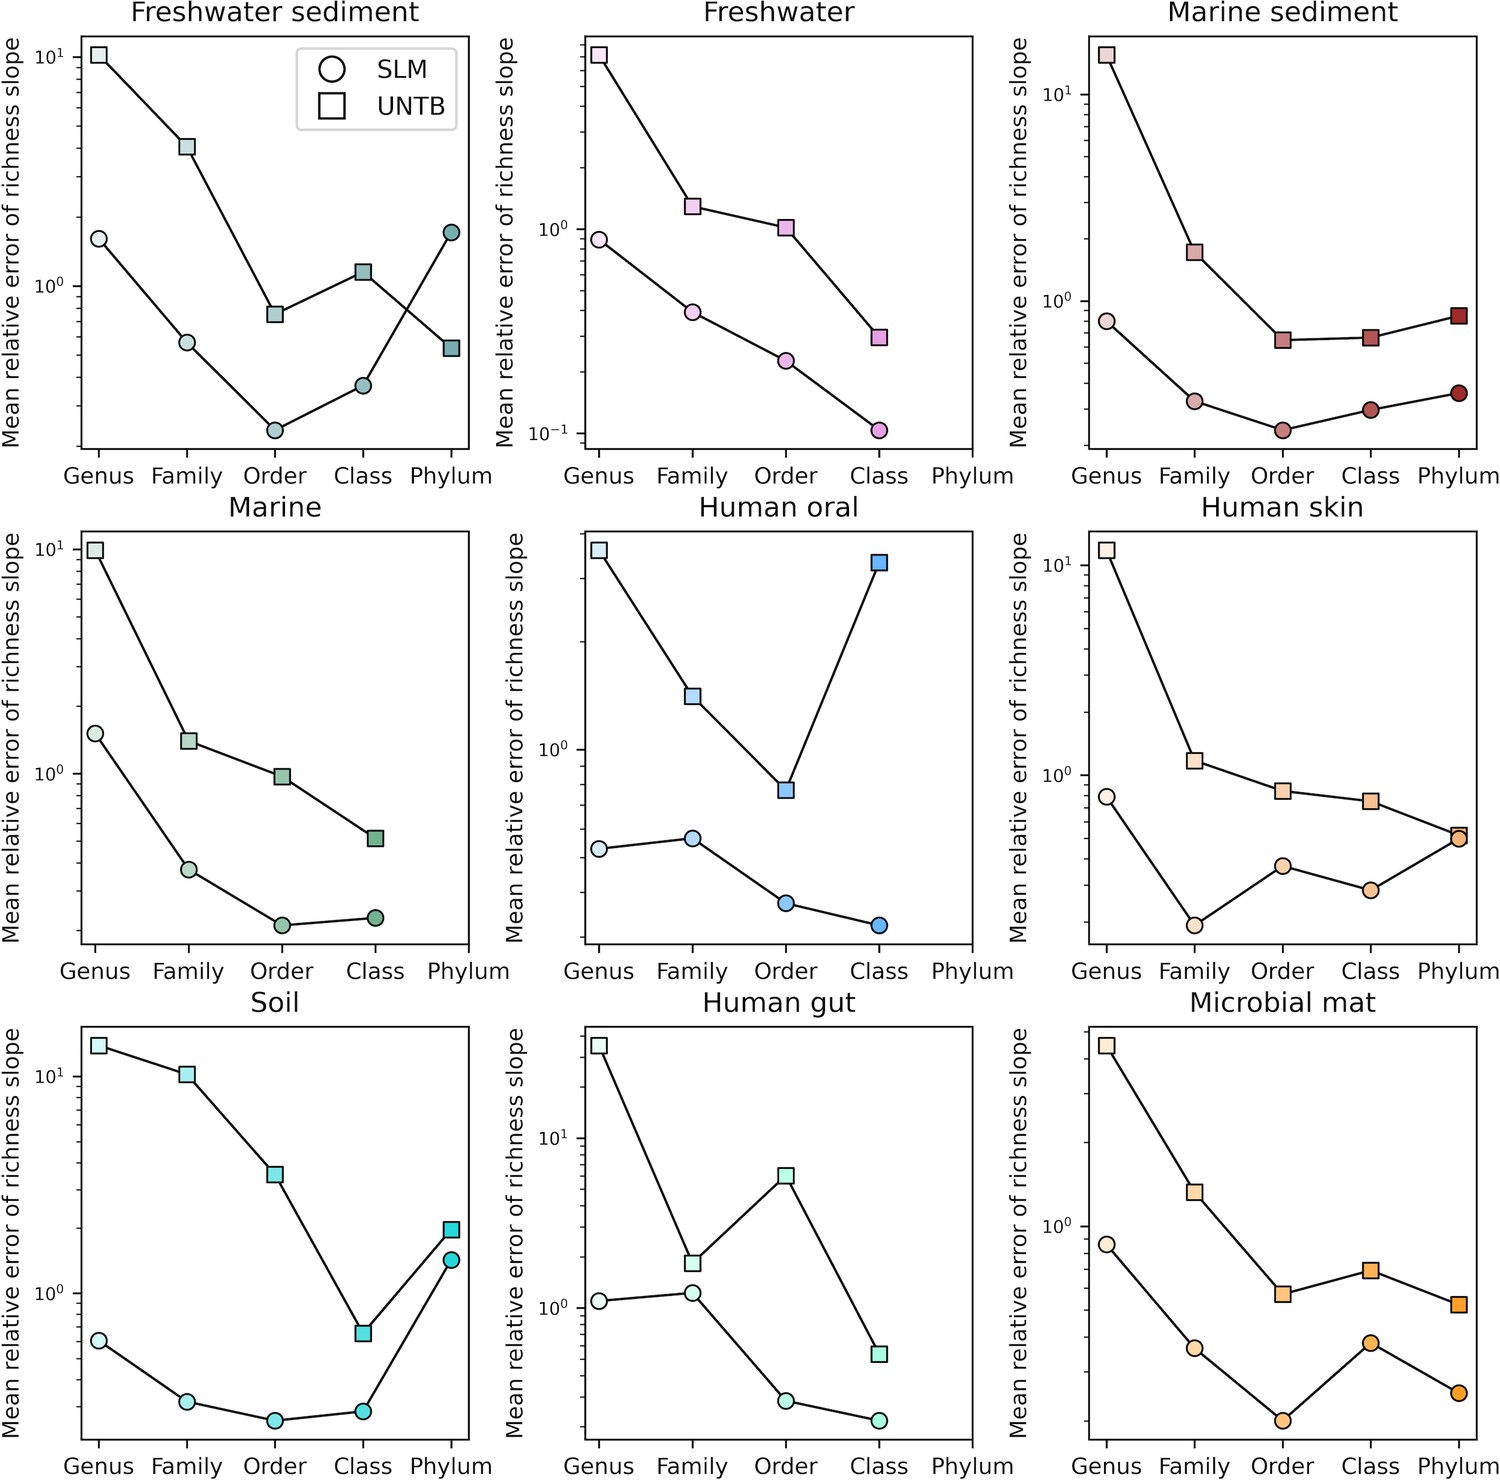
Comparisons of the relative error of fine vs. coarse-grained richness slope predictions between the Stochastic Logistic Model (SLM) and Unified Neutral Theory of Biodiversity (UNTB) for taxonomic coarse-graining.
Figure 5—figure supplement 9

Comparisons of the relative error of fine vs. coarse-grained richness slope predictions between the Stochastic Logistic Model (SLM) and Unified Neutral Theory of Biodiversity (UNTB) for phylogenetic coarse-graining.
Figure 5—figure supplement 10

The predicted slopes of fine vs. coarse-grained diversity from the sampling form of the gamma distribution under taxonomic coarse-graining.
Figure 5—figure supplement 11

The predicted slopes of fine vs. coarse-grained diversity from the sampling form of the gamma distribution under phylogenetic coarse-graining.
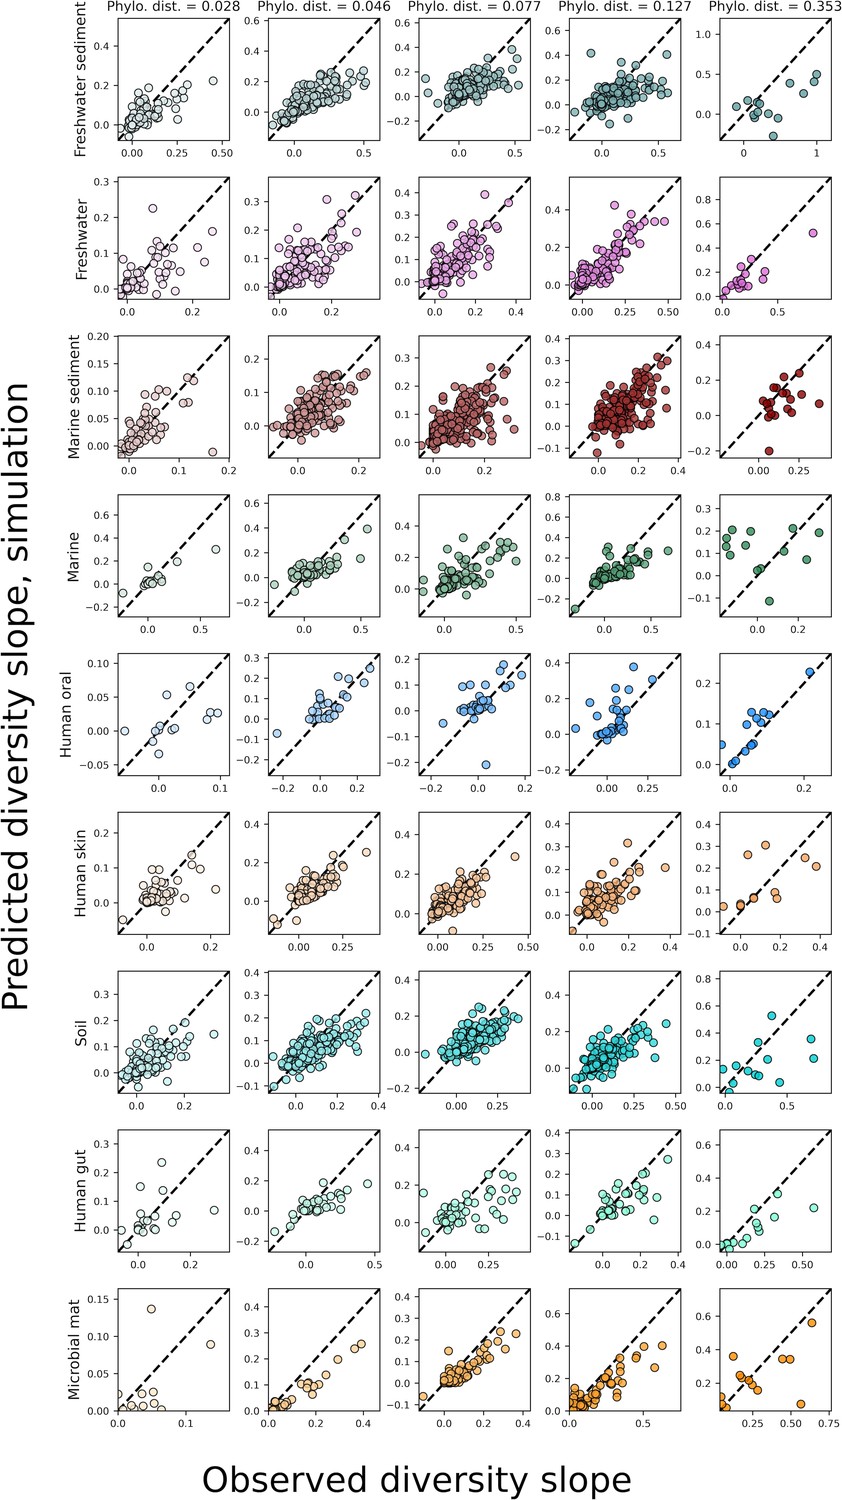
Figure 6 with 3 supplements

Including correlations allows the gamma distribution to capture observed diversity slopes.
Observed fine vs. coarse-grained diversity slopes could be quantitatively reproduced under phylogenetic coarse-graining by simulating correlated gamma-distributed AFDs at the OTU-level. The color scale used here is identical to the color scale used in Figure 3. Squared Pearson correlation coefficients () are computed over all slopes for all taxa across all coarse-graining scales.
Figure 6—figure supplement 1
The predicted slopes of fine vs. coarse-grained diversity from the sampling form of the gamma distribution with correlations between OTUs under taxonomic coarse-graining.
Figure 6—figure supplement 2
The predicted slopes of fine vs. coarse-grained diversity from the sampling form of the gamma distribution with correlations between OTUs under phylogenetic coarse-graining.
Figure 6—figure supplement 3

Gamma distribution simulations with correlations capture observed diversity slopes.
An equivalent set of analyses is depicted in Figure 6 for taxonomic coarse-graining.
Tables
Table 1
Summary statistics for the 100 sites randomly selected for each environment.
These statistics reflect the data used for taxonomic coarse-graining, as OTUs lacking taxonomic labels were excluded from taxonomic coarse-graining analyses.
| Environment | Total # OTUs | Mean # OTUs | Mean # reads |
|---|---|---|---|
| Marine | 9090 | 690.80 | 95,129.43 |
| Marine sediment | 16,110 | 1,393.67 | 40,440.38 |
| Human gut | 6175 | 599.09 | 32,894.50 |
| Human oral | 4716 | 537.45 | 44,271.22 |
| Human skin | 17,955 | 1293.45 | 36,344.13 |
| Freshwater sediment | 12,231 | 1080.95 | 18,979.56 |
| Microbial mat | 5087 | 200.24 | 8,659.36 |
| Freshwater | 12,052 | 822.37 | 33,646.53 |
| Soil | 20,298 | 1814.76 | 36,268.93 |
Table 2
Summary statistics for the 100 sites randomly selected for each environment.
These statistics reflect the data used for phylogenetic coarse-graining as all OTUs could be used.
| Environment | Total # OTUs | Mean # OTUs | Mean # Reads |
|---|---|---|---|
| Marine | 18,173 | 1,356.37 | 168,520.66 |
| Marine sediment | 41,304 | 4,167.25 | 106,166.92 |
| Human gut | 10,190 | 862.73 | 44,031.12 |
| Human oral | 7062 | 614.97 | 46,104.84 |
| Human skin | 29,448 | 1817.12 | 48,285.68 |
| Freshwater sediment | 33,193 | 3,569.59 | 65,582.56 |
| Microbial mat | 11,869 | 431.42 | 23,216.02 |
| Freshwater | 26,645 | 1775.89 | 74,298.17 |
| Soil | 45,273 | 4730.74 | 106,578.45 |
Additional files
Download links
A two-part list of links to download the article, or parts of the article, in various formats.
Downloads (link to download the article as PDF)
Open citations (links to open the citations from this article in various online reference manager services)
Cite this article (links to download the citations from this article in formats compatible with various reference manager tools)
Investigating macroecological patterns in coarse-grained microbial communities using the stochastic logistic model of growth
eLife 12:RP89650.
https://doi.org/10.7554/eLife.89650.3


