Postsynaptic mitochondria are positioned to support functional diversity of dendritic spines
- Electron Microscopy Core Facility, Max Planck Florida Institute for Neuroscience, Max Planck Way, United States
- Department of Neuroscience, Perelman School of Medicine at the University of Pennsylvania, United States
Figures
Figure 1
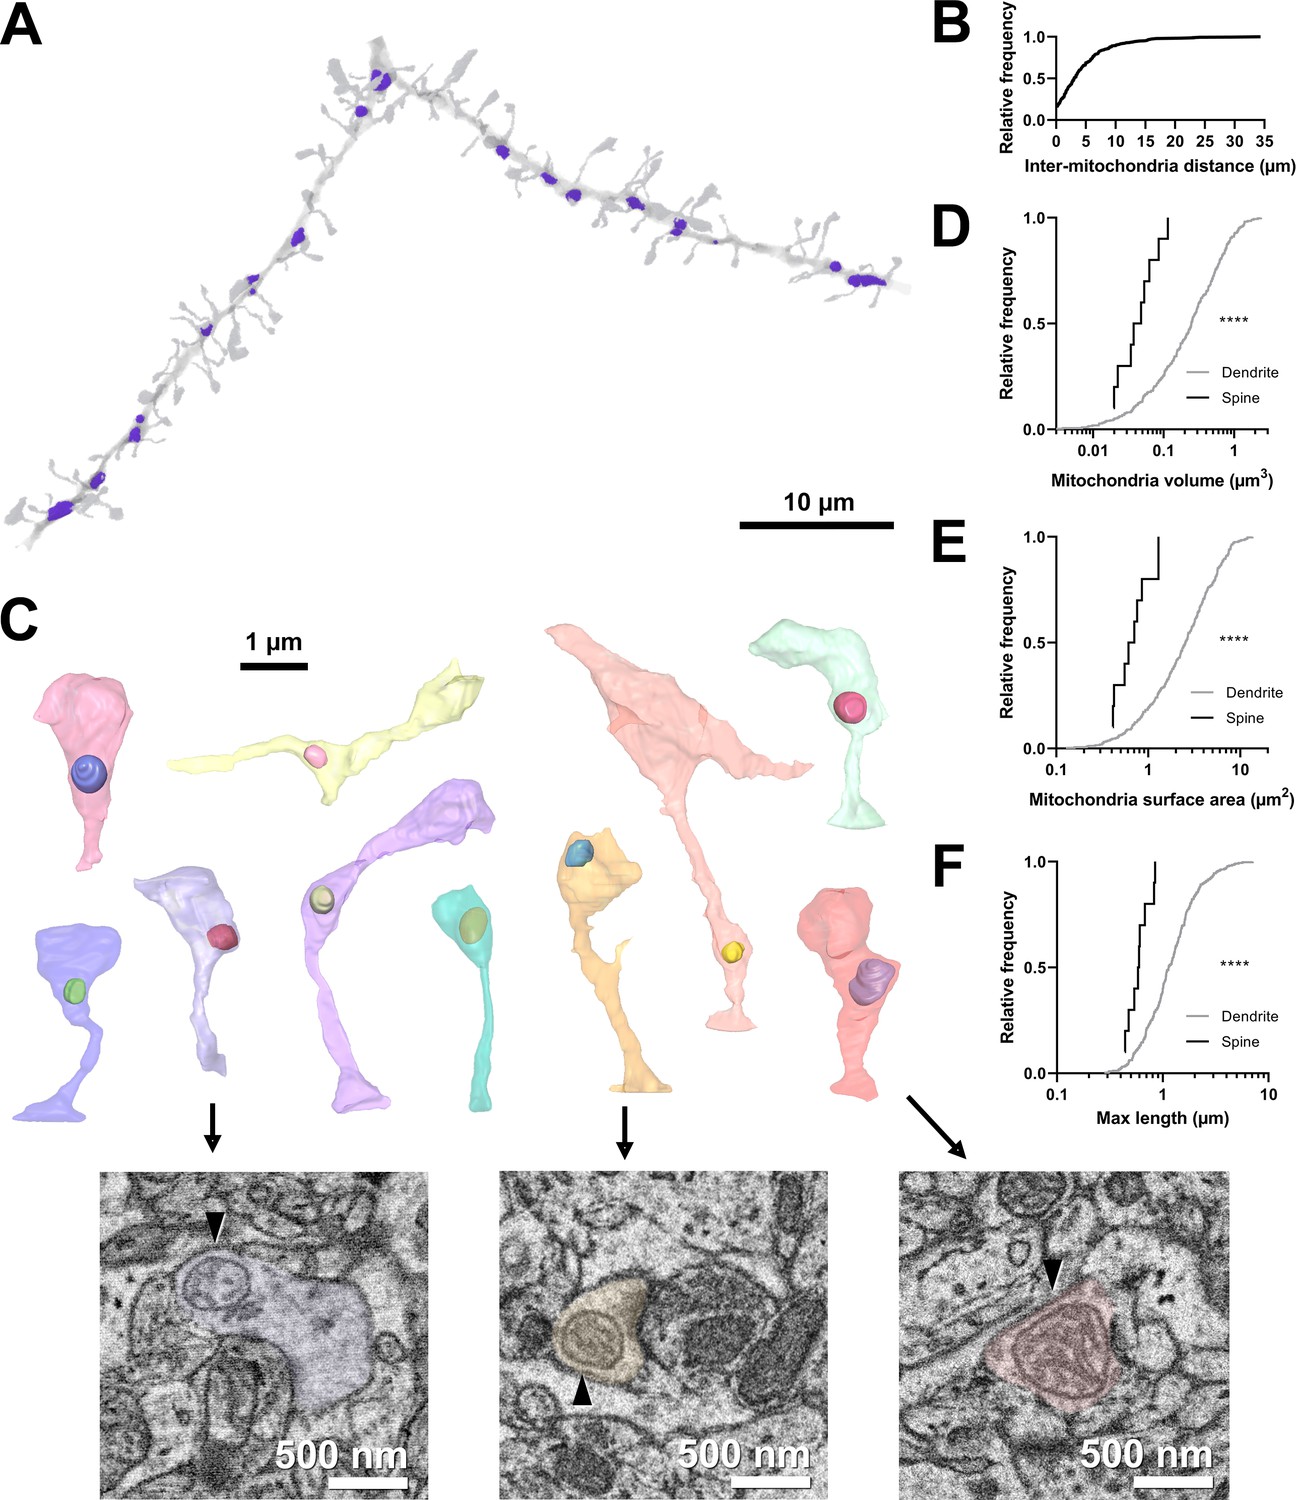
Volumetric characterization of postsynaptic mitochondria in L2/3 pyramidal neurons of ferret visual cortex.
(A) Example electron microscopy (EM) reconstruction of a dendrite with mitochondria (purple). (B) Cumulative frequency distribution of inter-mitochondria distance. (C) EM reconstructions of all functionally characterized spines that contain mitochondria in the head or neck of the spine. Mitochondria were observed either fully within the head, at the base of the head near the opening of the neck, or in the neck. Electron micrographs show cross sections through three example spines having mitochondria (arrowheads) at the base of the head (purple), fully within the head (yellow), or in the neck (pink). (D) Cumulative frequency distribution of mitochondria volume, comparing mitochondria found in dendrites (gray) versus those found in spines (black). (E) Mitochondria surface area. (F) Maximum mitochondria length. Mann-Whitney U tests; ****p<0.0001.
Figure 2
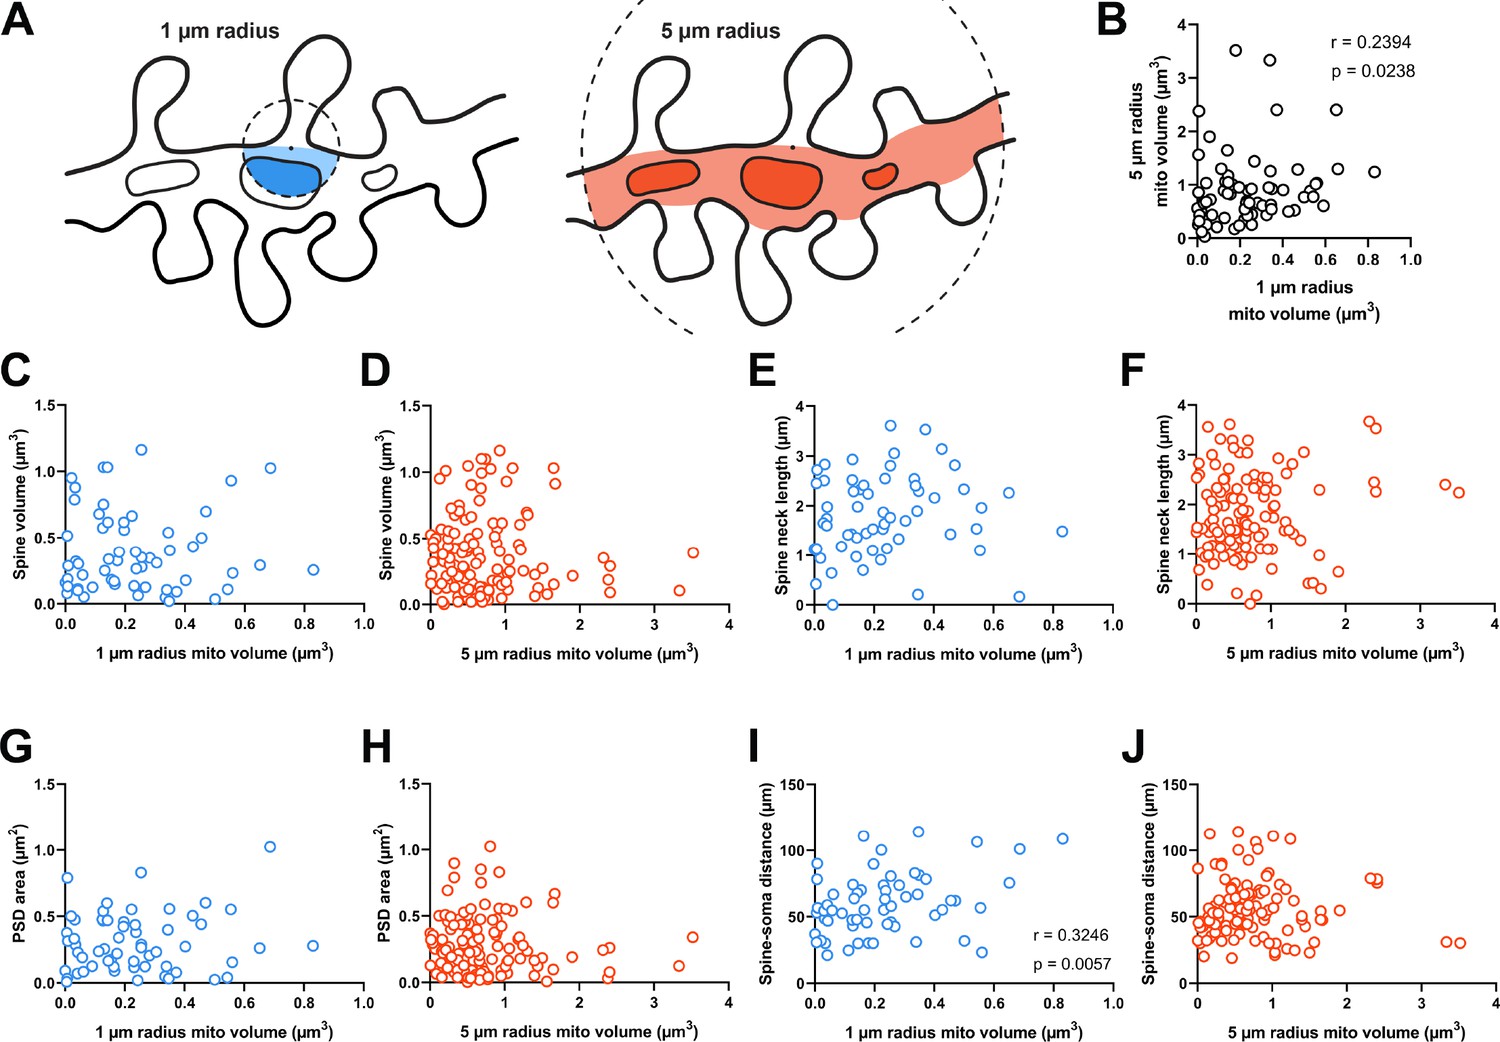
Dendritic mitochondria are positioned to support a diversity of anatomical strengths.
(A) Schematic illustration of the method used to measure dendritic mitochondria volume near structurally and functionally characterized spines in electron microscopy (EM) reconstructions. A sphere of a short (1 µm, blue) or extended radius (5 µm, orange) from the base of the spine neck (black dot) was used to sample the nearby volume of mitochondria for each spine. (B) Correlation plot of the volume of mitochondria present within short and extended radii for individual spines. Only spines that had dendritic mitochondria within 5 µm were considered. (C, D) Correlation of spine volume and mitochondria volume within a short or extended distance. (E, F) Correlation of spine neck length and mitochondria volume. (G, H) Correlation of postsynaptic density (PSD) area and mitochondria volume. (I, J) Correlation of the distance between a spine/soma and mitochondria volume. r=Spearman’s correlation coefficient. Correlation plots exclude spines that have zero mitochondria volume within the corresponding measurement radius.
Figure 3
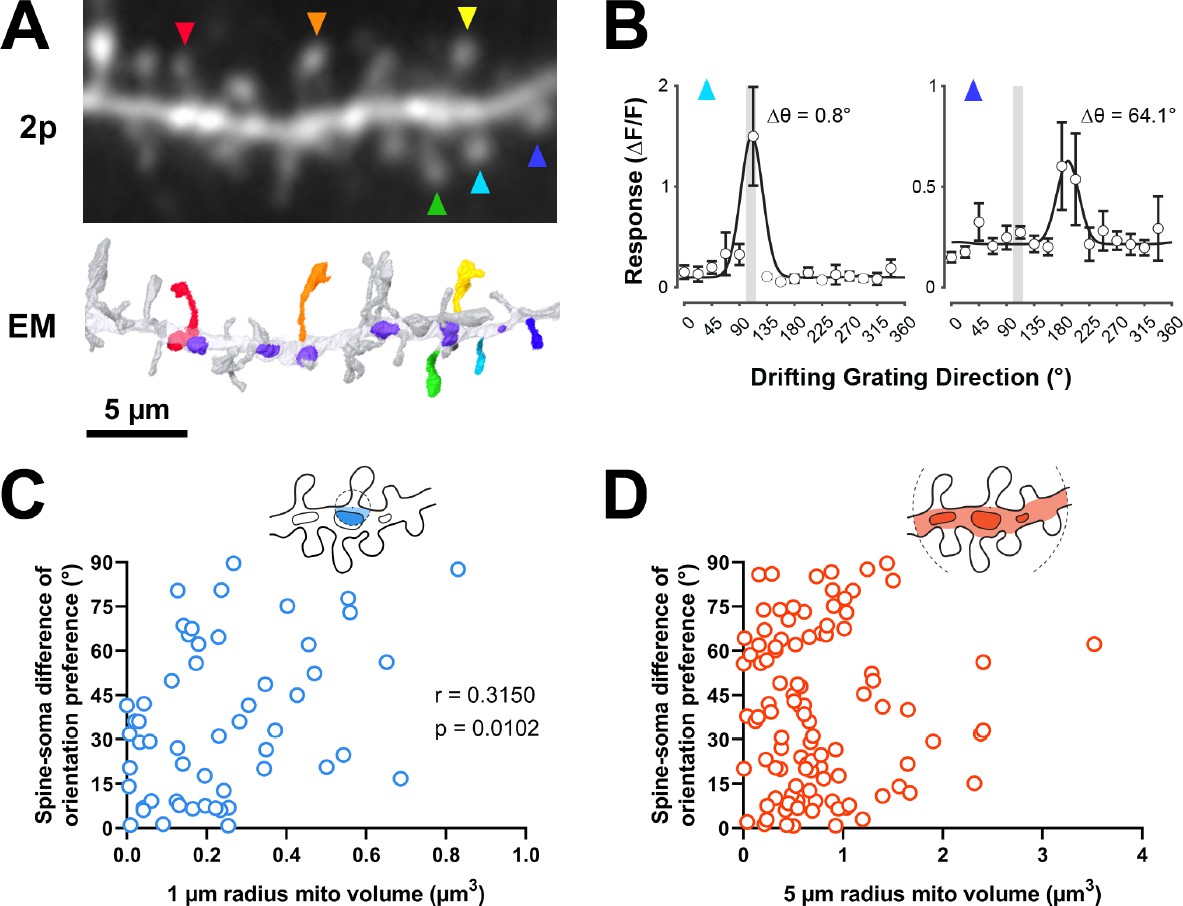
Dendritic mitochondria are positioned to support spines with a diversity of orientation tuning.
(A) Two-photon average projection image of a short segment of GCaMP6s-labeled dendrite and the corresponding electron microscopy (EM) reconstruction. Functionally characterized spines are indicated with rainbow colors/arrows, mitochondria in the EM reconstruction are purple. (B) Peak ΔF/F responses in response to visual stimulus for two example spines shown in A (teal and indigo), showing two different orientation preferences. The teal spine has a preference that is aligned with the average preference of the soma (vertical gray bar), while the indigo spine has a preference that is dissimilar to the soma. Spine data are mean ± s.e.m. (n=8 stimulus trials). (C, D) Correlation of spine-soma difference of orientation preference and mitochondria volume for short (1 µm, blue) and extended (5 µm radius, orange) distances from the base of a spine. r=Spearman’s correlation coefficient. Correlation plots exclude spines that have zero mitochondria volume within the corresponding measurement radius.
Figure 4
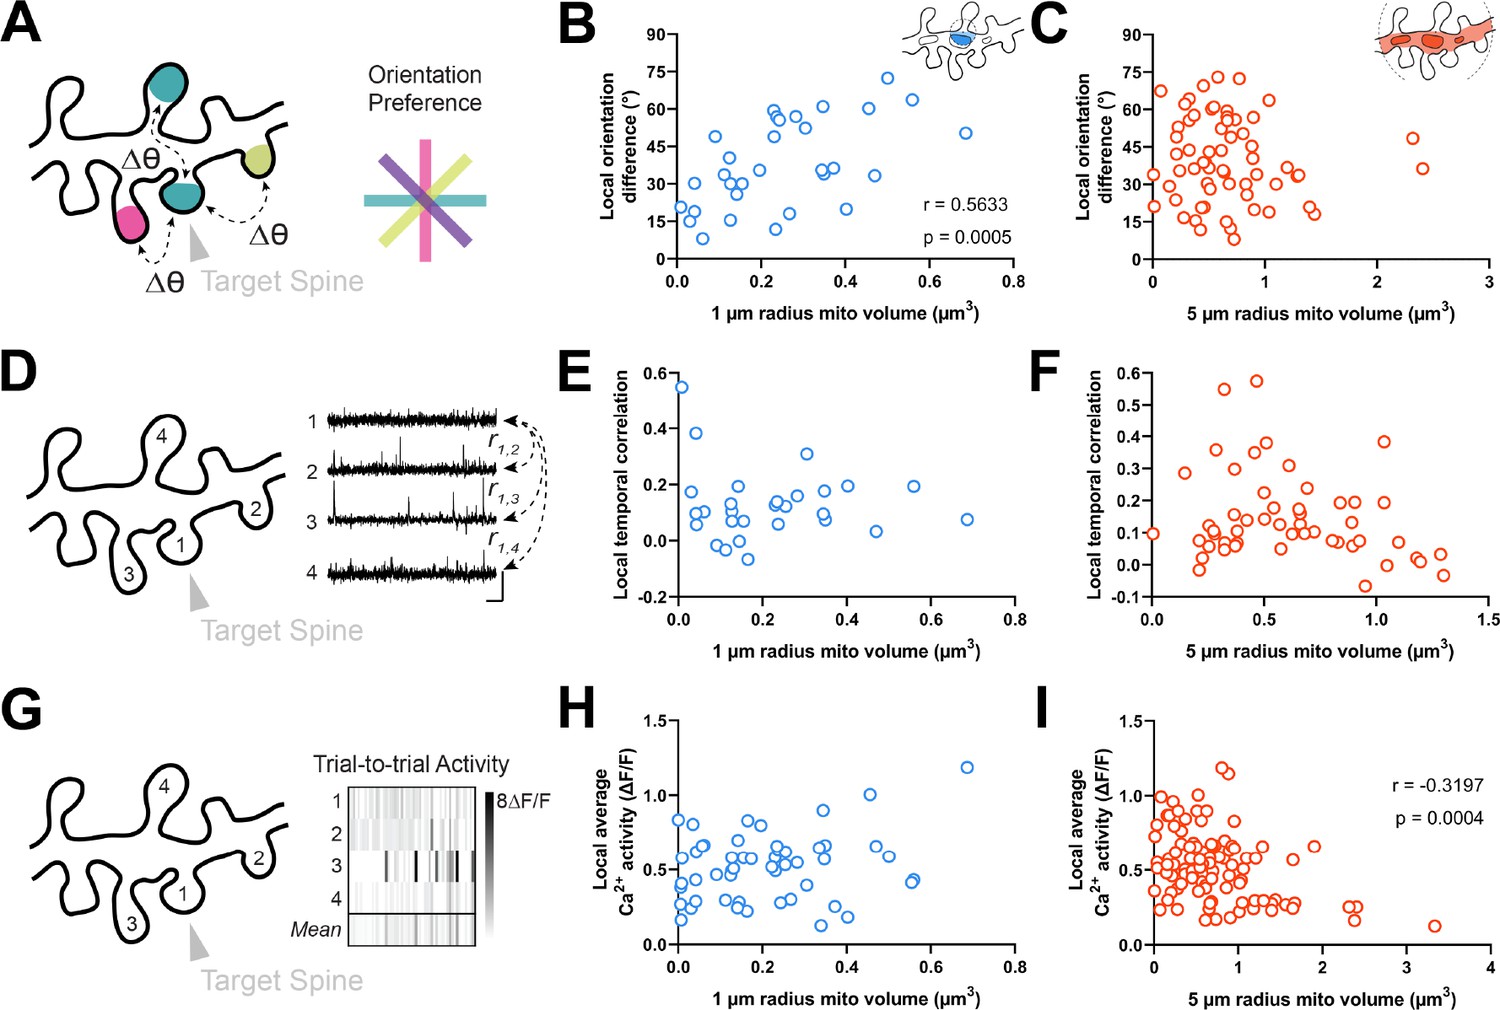
Dendritic mitochondria are positioned locally in regions having diverse synaptic orientation preferences and broadly in areas of low local Ca2+ activity.
(A) Illustration of average difference in orientation preference between a target spine (arrowhead) and neighboring spines within 5 µm. (B, C) Correlation of local orientation difference and mitochondria volume for short (1 µm, blue) and extended (5 µm radius, orange) distances form the base of a spine. (D) Illustration of average local temporal correlation of spines within 5 µm of the target spine. Scale bar is 1 s and 100% ΔF/F. (E, F) Correlation of local temporal correlation and mitochondria volume. (G) Illustration of local Ca2+ activity, shown as mean trial-to-trial ΔF/F, within 5 µm of the target spine. (H, I) Correlation of local average Ca2+ activity and mitochondria volume. r=Spearman’s correlation coefficient. Correlation plots exclude spines that have zero mitochondria volume within the corresponding measurement radius.
Figure 5
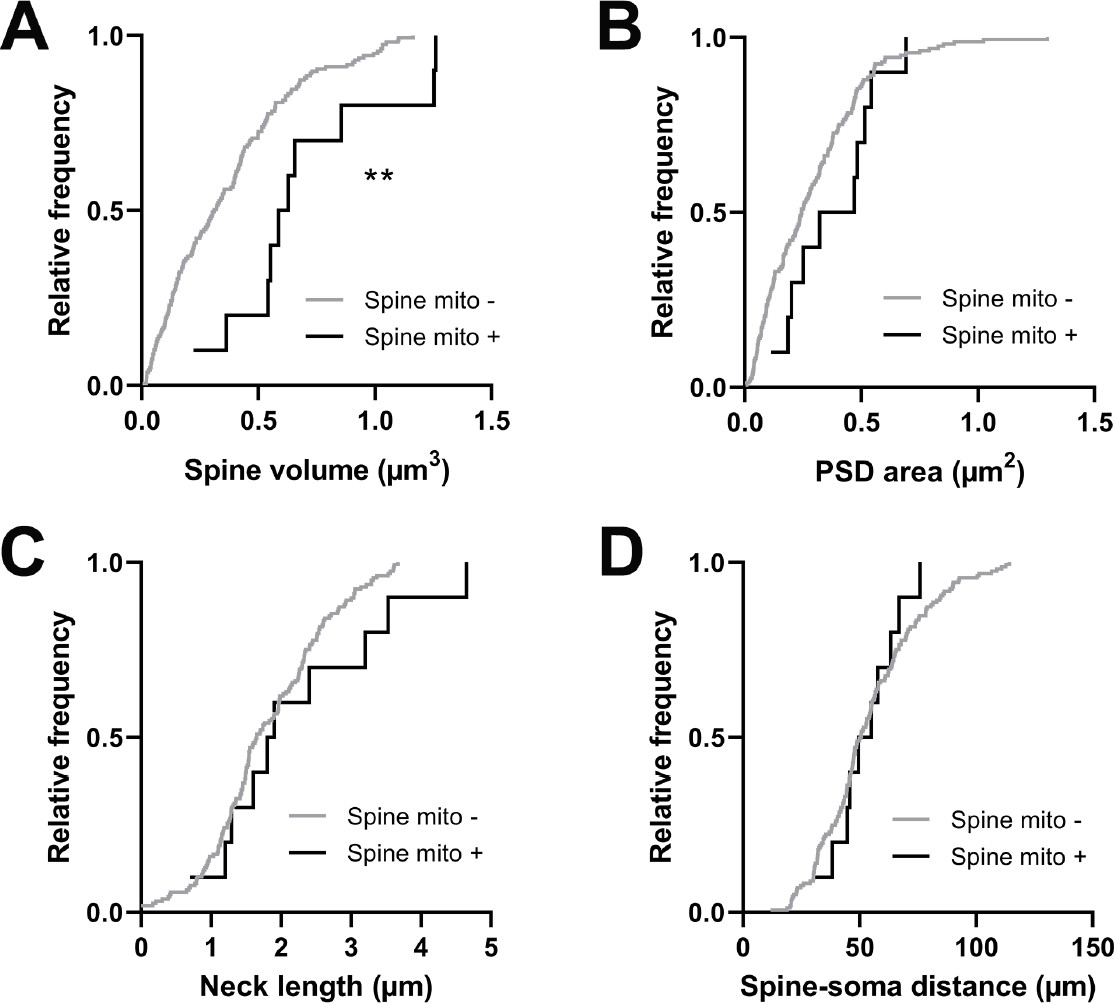
Spines having a mitochondrion in the head or neck are larger.
(A) Cumulative frequency distribution of spine head volume for spines that have a mitochondrion in the head or neck (black, n=10 spines, shown in Figure 1C) versus spines that do not (gray). (B) PSD area. (C) Neck length. (D) Distance between the spine and soma. Mann-Whitney U tests, **p<0.01.
Figure 6
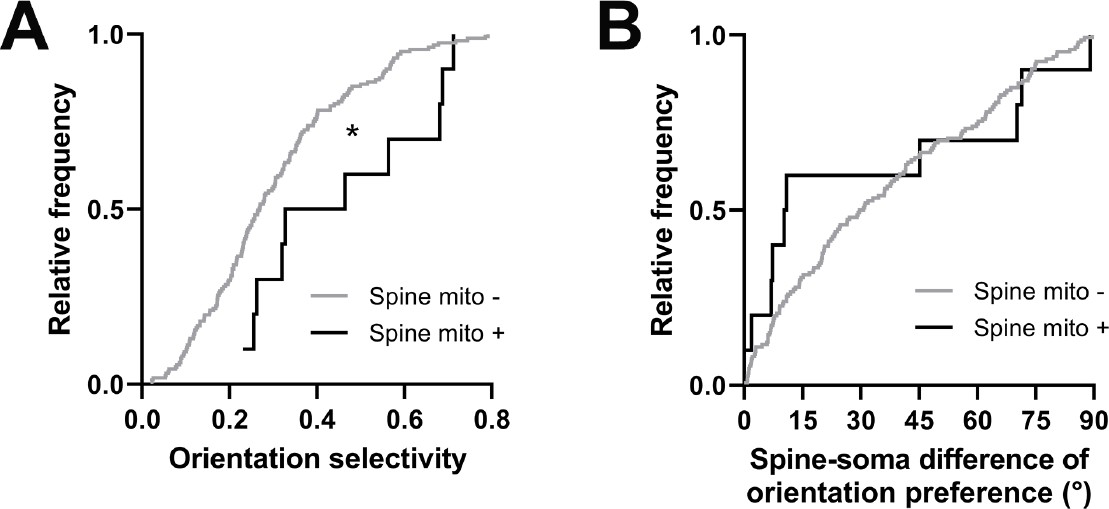
Spines having a mitochondrion in the head or neck are more selective for visual features.
(A) Cumulative frequency distribution of orientation selectivity for spines that have a mitochondrion in the head or neck (black, n=10 spines, shown in Figure 1C) versus spines that do not (gray). (B) Spine-soma difference of orientation preference. Mann-Whitney U tests, *p<0.05.
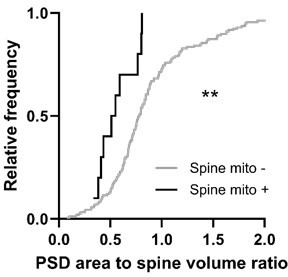
Author response image 1

Here, we examined the relationship to spine head volume, spine-soma orientation preference difference, and the local orientation preference heterogeneity.
No relationship showed any significant correlation. Again, this may not be surprising given the drawbacks of measuring ‘distance to mitochondria’.
Author response image 2
Additional files
Download links
A two-part list of links to download the article, or parts of the article, in various formats.
Downloads (link to download the article as PDF)
Open citations (links to open the citations from this article in various online reference manager services)
Cite this article (links to download the citations from this article in formats compatible with various reference manager tools)
Postsynaptic mitochondria are positioned to support functional diversity of dendritic spines
eLife 12:RP89682.
https://doi.org/10.7554/eLife.89682.3


