Systems analysis of miR-199a/b-5p and multiple miR-199a/b-5p targets during chondrogenesis
- Campus for Ageing and Vitality, Biosciences Institute, Newcastle University, United Kingdom
- Regenerative Medicine, Stem Cells, Transplantation, Biosciences Institute, Newcastle University, United Kingdom
- Computational Biology Facility, Faculty of Health and Life Sciences, University of Liverpool, United Kingdom
- School of Biological Sciences, University of East Anglia, United Kingdom
Figures
Figure 1
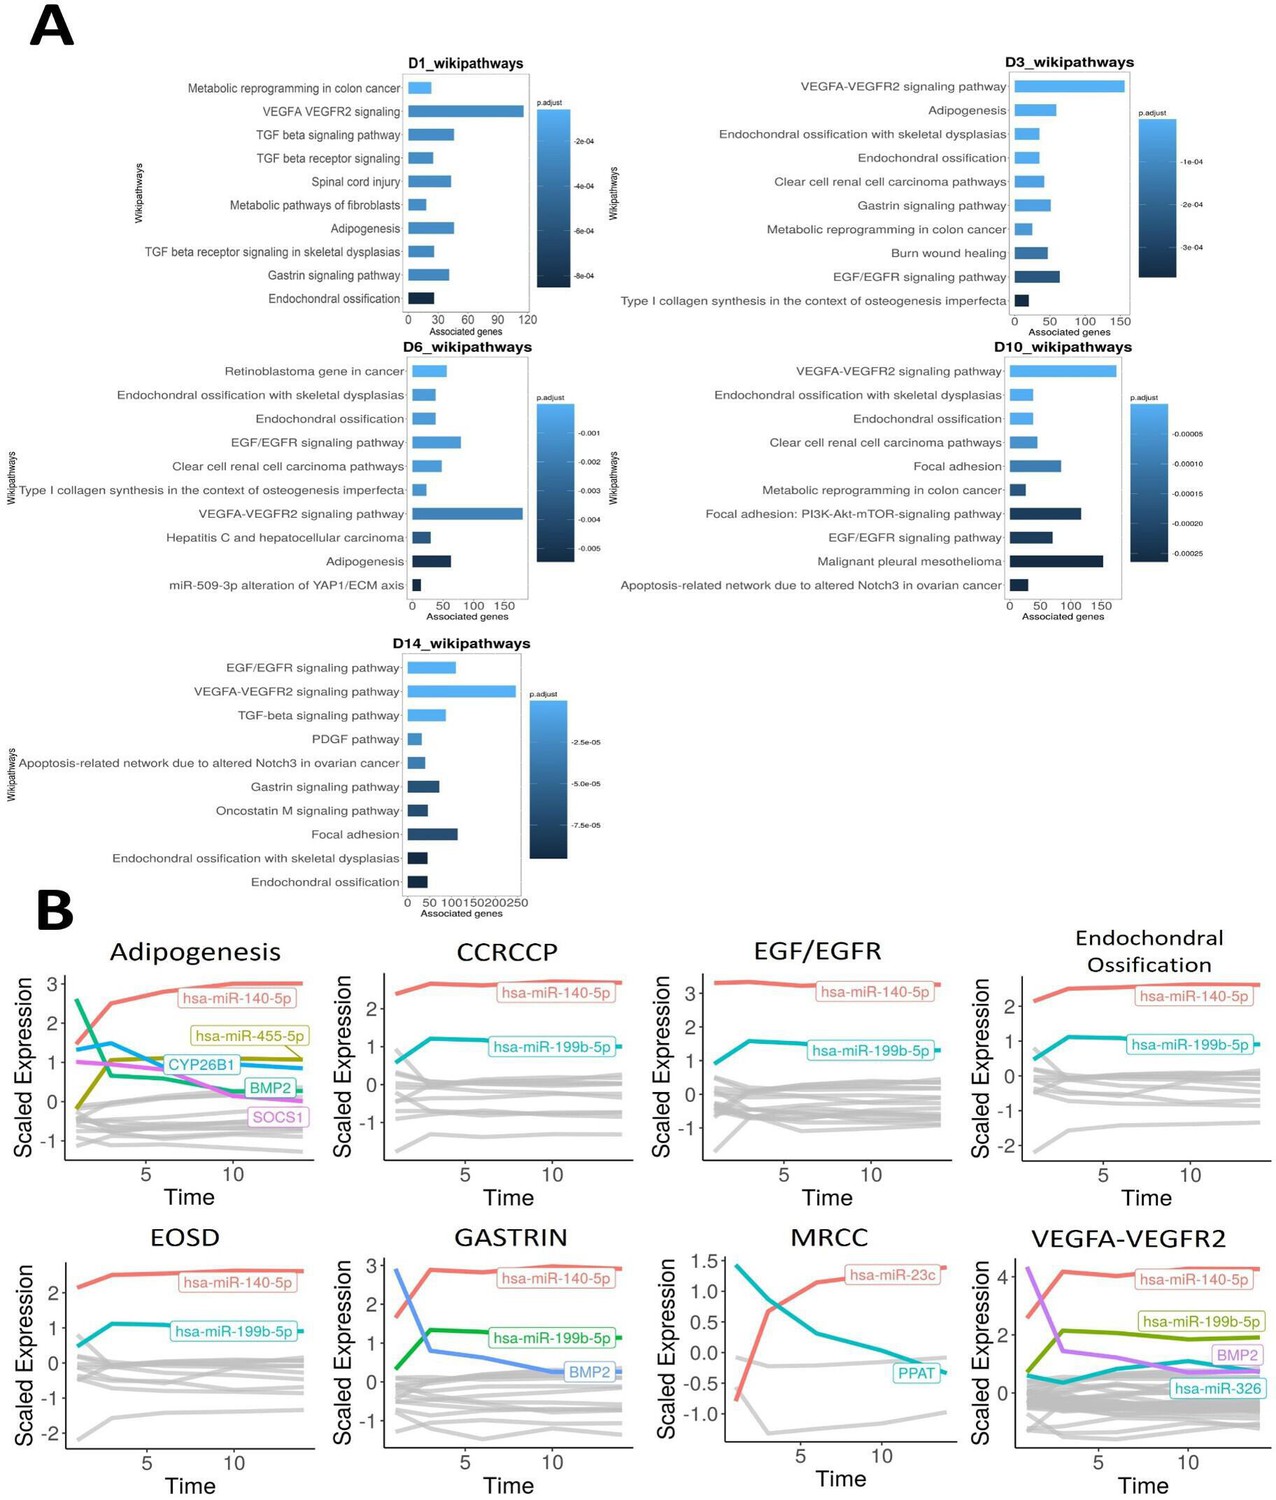
Time-course bioinformatic identification of miR-199 as a key regulator of chondrogenic gene expression.
(A) Overrepresentation analysis (ORA) of the differentially expressed miRNAs and mRNAs at each timepoint contrasted to D0. For each significantly enriched pathway identified, the number of associated genes found from the pathway is shown on the x-axis. (B) Line plots displaying scaled log2FC values over the 14-day time course for the indicated pathways. Acronyms are defined the text. MRCC = metabolic reprogramming in colon cancer. Here, individual genes found in the filtered miRNA–mRNA interactions for each pathway are plotted along a time course. Only genes (miRNAs or mRNAs) that have a scaled log2FC value of at least 1 at any point of the line plot are highlighted and labelled.
Figure 2 with 1 supplement
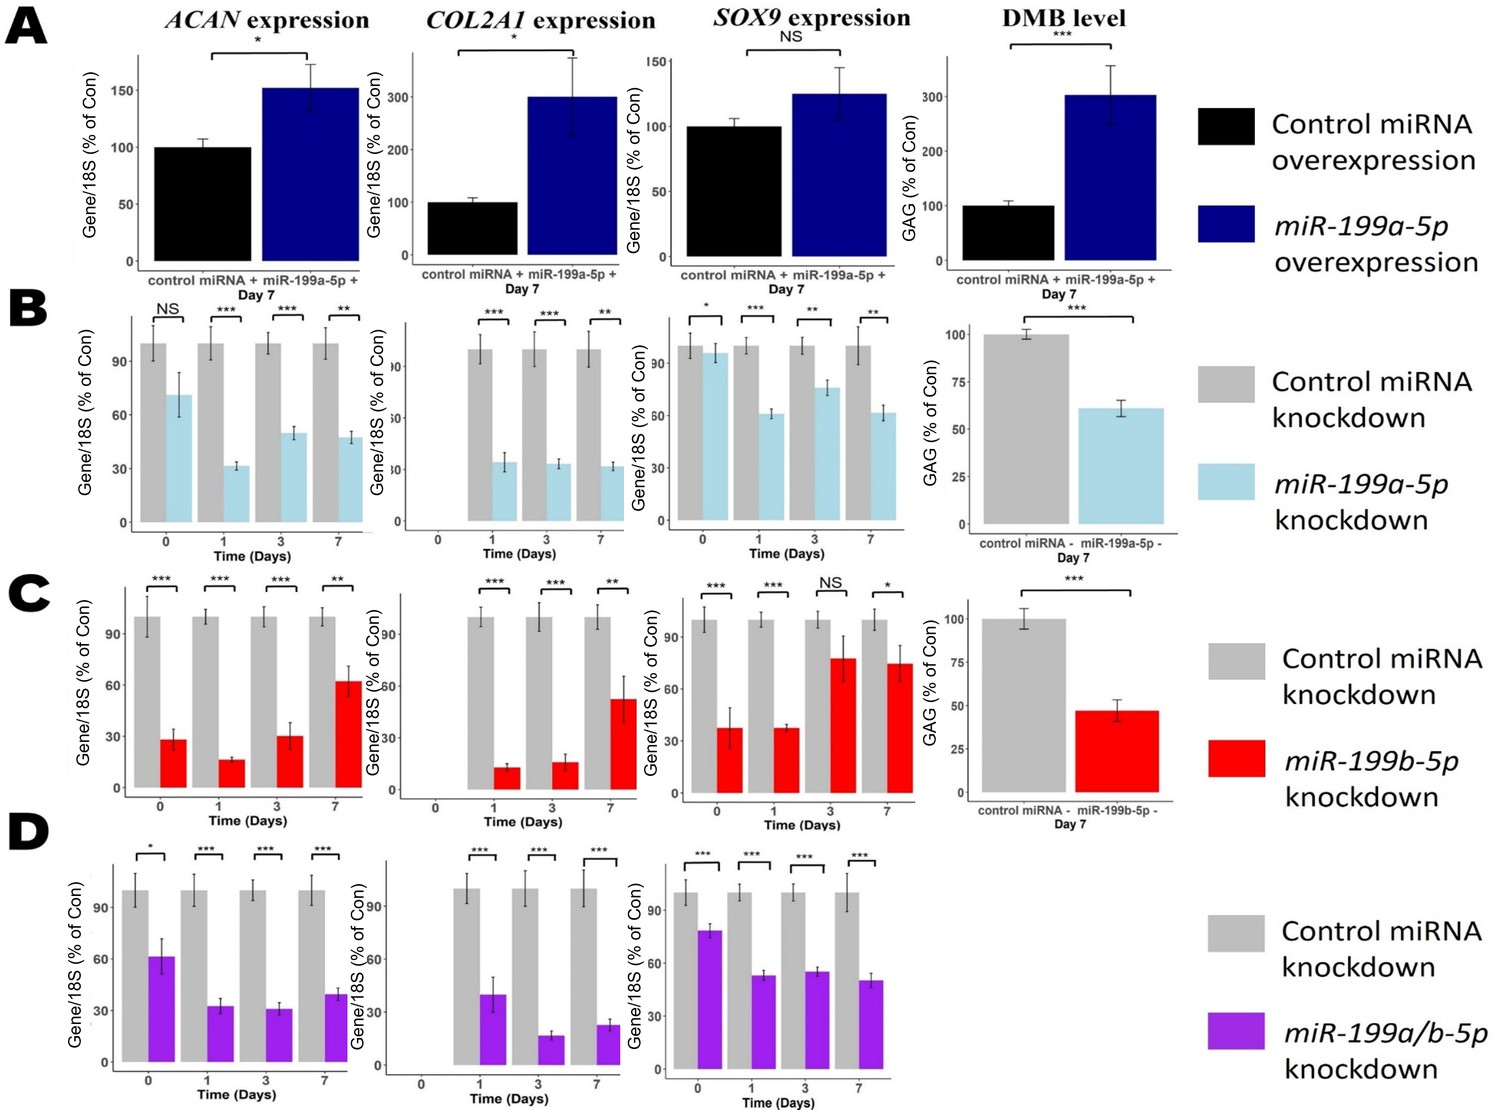
Modulation of miR-199 affects chondrogenesis gene expression and extracellular matrix (ECM) production.
Mesenchymal stem cells (MSCs) were transfected for 24 hr with miR-199a-5p, miR-199b-5p, or non-targeting miRNA control mimics or inhibitors prior to the induction of chondrogenesis. (A) Overexpression of miR-199a-5p. (B–D) Inhibition of (B) miR-199a-5p (C), miR-199b-5p, or (D) miR-199a-5p and -199b-5p. (A–D) At days 0, 1, 3, and 7 after initiation of chondrogenesis, RNA was extracted and measurements of ACAN, COL2A1, and SOX9 gene expression were taken. qPCR results for day 0 were undetectable for COL2A1. Gene expression was normalised to 18S. Values are the mean ± SEM of data pooled from 3 to 4 separate MSC donors (N=3-4), with 4–6 biological replicates per donor (n=4-6). Presented as % of non-targeting control levels. The p-values calculated by paired two-tailed Student’s t-test, NS = not significant, *<0.05, **<0.01, ***<0.001.
Figure 2—figure supplement 1

Mesenchymal stem cells (MSCs) were transfected for 48 hr with (A) miR-199a-5p mimic (mi) or (B) miR-199a-5p/199b-5p hairpin (hp) inhibitor, or non-targeting controls (Con2).
RNA was extracted, reverse transcribed, and (A) miR-199a-5p or (B) miR-199a-5p/199b-5p expression measured by qRT-PCR normalised to U6.
Figure 3 with 1 supplement
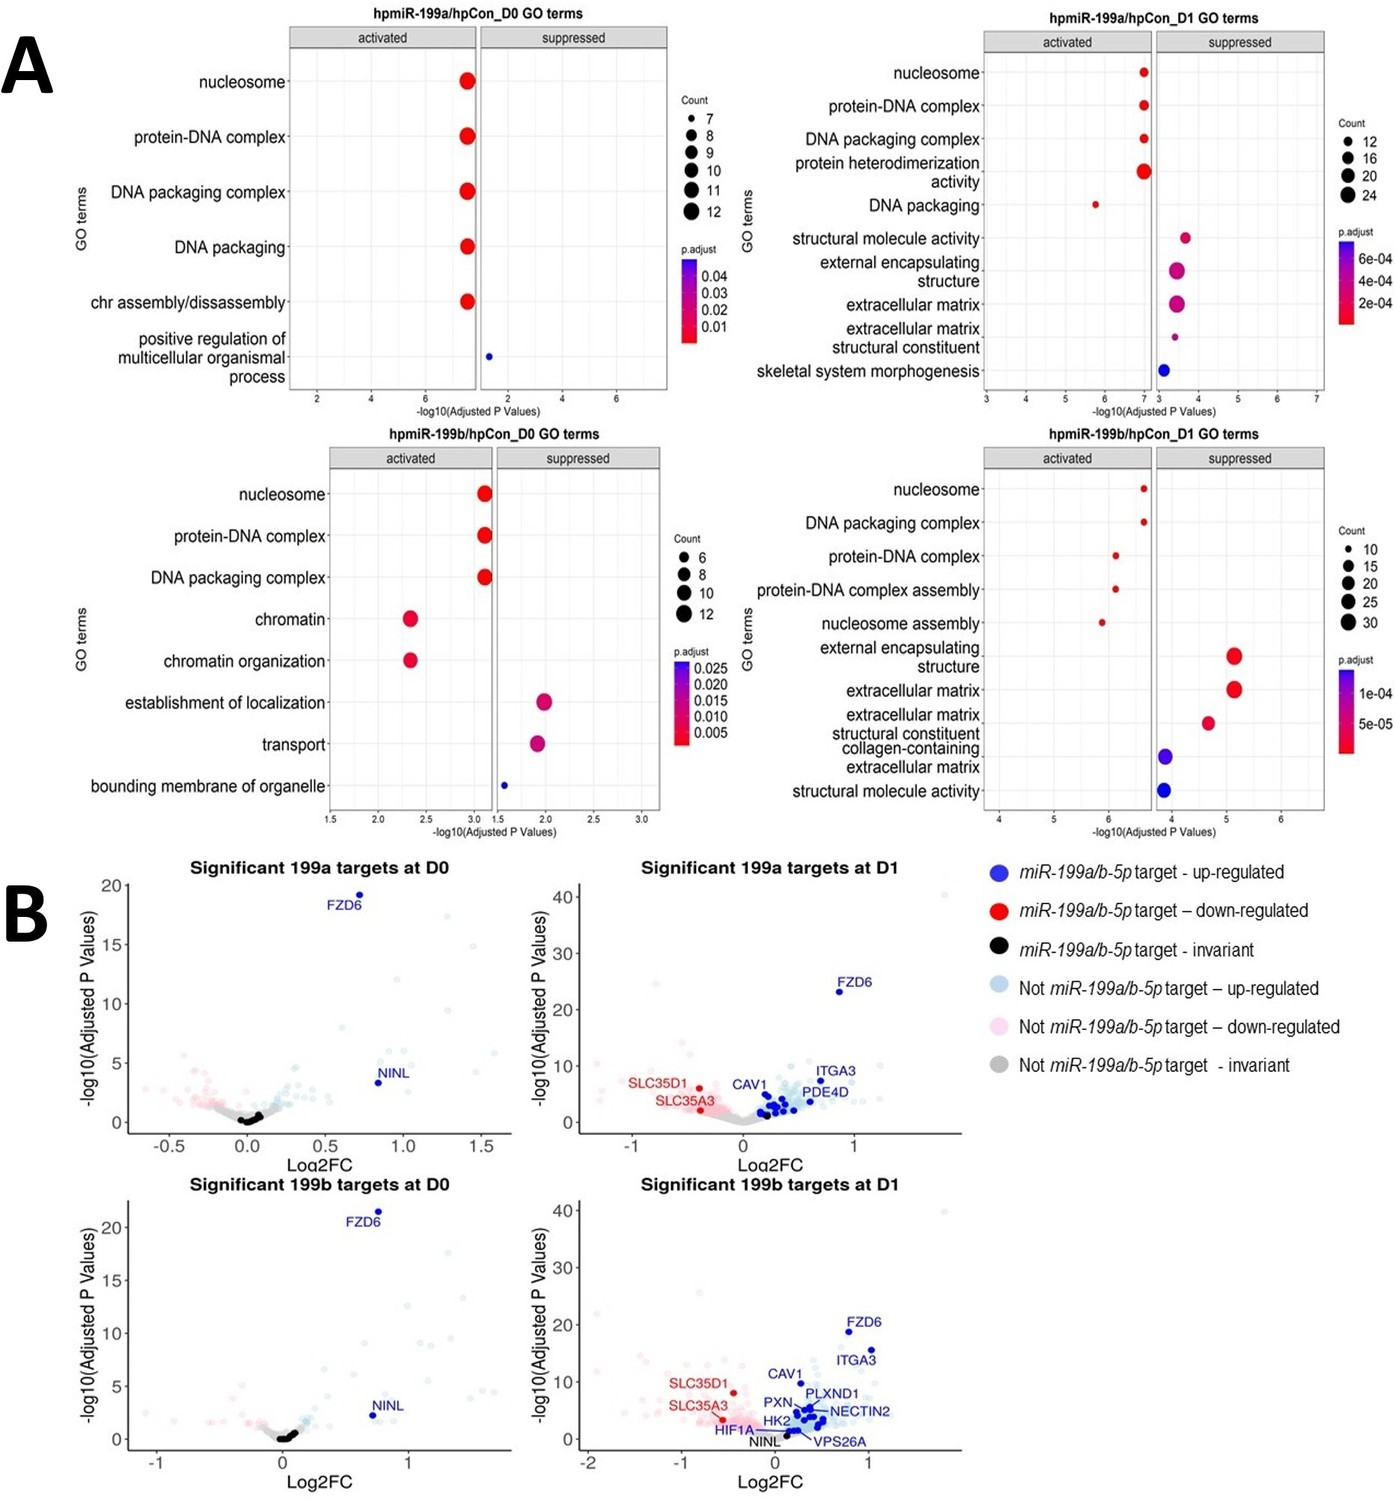
Identification of miR-199 targets during early chondrogenesis.
Results from RNAseq analysis of control miRNA, miR-199a-5p, and miR-199b-5p inhibition experiments. (A) Gene Ontology (GO) analysis for the significantly differentially expressed genes found from miR-199a-5p or miR-199b-5p inhibition at day 0 and day 1 of chondrogenesis. Up to five activated and five suppressed pathways are displayed for each contrast. All GO terms shown have an adjusted p-value of <0.05. Count size represents the genes found in a pathway and this determined the size of the circles. (B) Volcano plots to display gene expression changes following inhibition of miR-199a or miR-199b at day 0 (D0) or day 1 (D1). The miRNAtap-selected 21 miR-199a/b-5p targets are identified (and labelled, space permitting) in red or blue if up- or downregulated The cut-off for significance was an adjusted (BH) p-value of <0.05. miR-199a/b-5p targets were upregulated by miR-199a/b-5p inhibition.
Figure 3—figure supplement 1

The 21 genes found through our analysis are displayed using several metrics: adjusted p-values are denoted by the colour of the shapes, the shapes reflect the time the sample was taken, and the size of the shapes represents the mean count of the transcripts abundance.
Figure 4
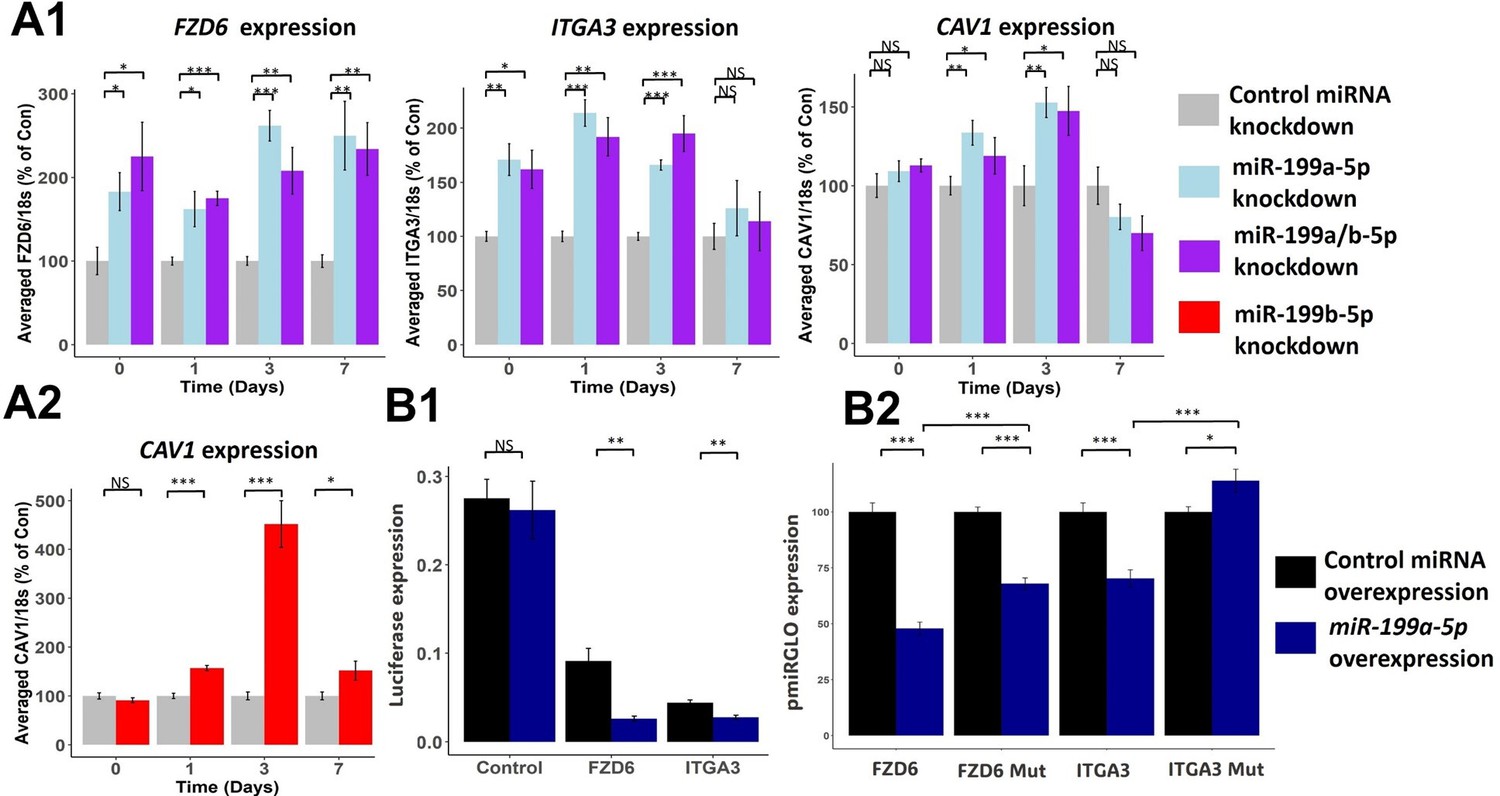
Effect of miR-199a/b-5p inhibition on putative miR-199 targets.
(A1–2) Mesenchymal stem cells (MSCs) were transfected for 24 hr with miR-199a-5p, miR-199a/b-5p, miR-199b-5p, or non-targeting miRNA control inhibitors prior to the induction of chondrogenesis. At days 0, 1, 3, and 7 after the initiation of chondrogenesis, RNA was extracted and (A1) FZD6, ITGA3, and CAV1 expression was measured after miR-199a-5p and miR-199a/b-5p inhibition, or (A2) CAV1 levels were also measured after miR-199b-5p inhibition. Gene expression was normalised to 18S. Presented as % of non-targeting control levels. (B1–2) Luciferase expression in SW1353 cells following co-transfection of miR-199a-5p or non-targeting control mimic and miR-199a-5p target 3′UTR reporter constructs for 24 hr. (B1) FZD6 and ITGA3 3′UTR-regulated expression normalised to renilla luciferase. (B2) Wildtype and mutant FZD6 and ITGA3 3′UTR-regulated expression normalised to renilla and presented as percentage of non-targeting control levels. Values shown are the mean ± SEM of data pooled from (A) three separate MSC donors (N=3), with 4–6 biological replicates per donor (n=4-6), or (B) three independent experiments (n=3). p-Values were calculated using paired two-tailed Student’s t-test, NS = not significant, *<0.05, **<0.01, ***<0.001.
Figure 5 with 1 supplement
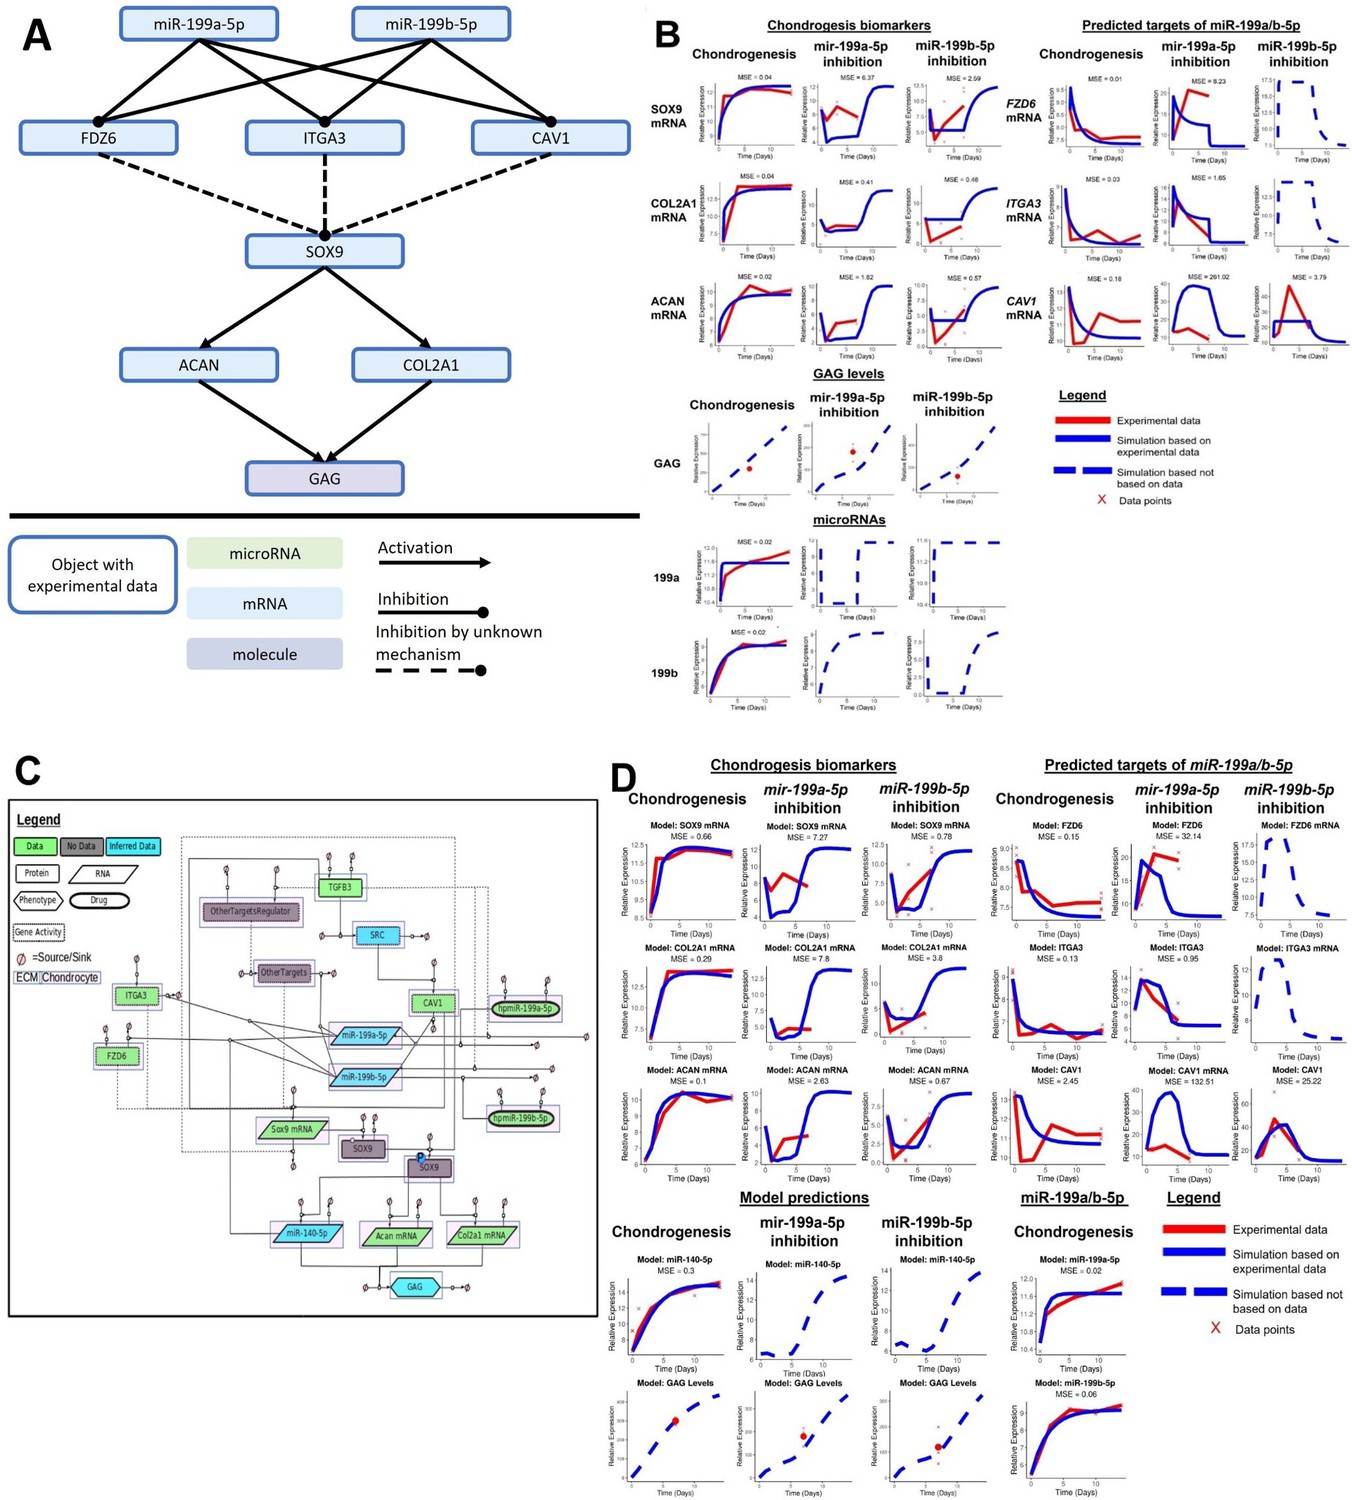
Initial kinetic modelling of miR-199a/b-5p regulation of chondrogenesis.
(A) Schematic of how miR-199a/b-5p modulation effects the predicted miR-199a/b-5p FZD6, ITGA3, and CAV1, and the chondrogenic biomarkers SOX9, COL2A1, ACAN, and GAG. (B) Simulations (blue lines) from the kinetic modelling were contrasted against the experimental data – if available (red line) and a mean squared error (MSE) score is provided in these cases. Alternatively, if no experimental data was available, a dashed blue line displays the predicted behaviour of the gene. If multiple measurements were available, they have been displayed using red crosses. (C) A more detailed model displaying how miR-199a/b-5p regulates chondrogenesis via FZD6, ITGA3, and CAV1 mRNAs, in GRN form. Here, information from the literature was added and miR-140-5p was added to the model. The GRN shown here is a minimalistic version of Figure 5—figure supplement 1. This was used to inform the topology of a kinetic model which aimed to explain how miR-199a-5p and miR-199b-5p act as pro-chondrogenic regulators by downregulating activity of FZD6, ITGA3, and CAV1 mRNAs. This GRN contained 18 species including two proteins (TGFB3, SOX9), one phospho-protein (phospho-SOX9), three mRNAs (SOX9, ACAN, COL2A1), three miRNAs (miR-140-5p, miR-199a-5p, miR-199b-5p), two drugs (hpmiR-199a-5p, hpmiR-199b-5p), six protein activity (SRC, CAV1, FZD6, ITGA3, OtherTargets, OtherTargetsRegulator), and one phenotype (GAG). Each species has a sink and a source. Species are also shaped based on their properties: Proteins are rectangles, RNAs are rhombus, phenotypes are hexagons, drugs are oval, and gene activity are rectangles with dotted lines. Species are also highlighted with a white box if they are found in the extracellular matrix (ECM) or pink if they are found within a chondrocyte. Edges between species are solid if there is literature/data supporting an interaction or dotted if there the interaction is hypothetical. Species are also colour coded: green if there is associated data, blue if there is some data and the rest has been inferred based on literature, or grey if there is no data associated with the species. (D) Simulations from modelling the more detailed miR-199a/b-5p chondrogenesis model. Notations follow (B).
Figure 5—figure supplement 1

GRN containing the broader scope of the biological system modelled.
This broader GRN contained 40 species including 12 proteins (TGFB3, SRC Kinase, CAV1, FZD6, ITGA3, SOX9, IL-1, NfkB, MMP13, ADAMTS5, SMAD2, SMAD3), 6 phospho-protein (phospho-SRC kinase, phospho-SOX9, phospho-CAV1, phospho-ROCK1, phospho-SMAD2, phospho-SMAD3), 2 RHOA states (GDP-RHOA, GTP-RHOA), 6 mRNAs (SOX9, ACAN, COL2A1, CAV1, FZD6, ITGA3), 3 miRNAs (miR-140-5p, miR-199a-5p, miR-199b-5p), and 6 phenotypes/ECM constructs (GAG, chondrogenesis, fibrillogenesis, ECM fibronectin, fibronectin-chondrocyte binding, fibronectin fragments). Each species as a sink and a source. Species are also shaped based on their properties: Proteins are rectangles, RNAs are rhombus, phenotypes are hexagons, and drugs are oval. Species are also highlighted with a white box if they are found in the ECM or pink if they are found within a chondrocyte. Species are also colour coded: green if there is associated data, blue if there is some data and the rest has been inferred based on literature, or grey if there is no data associated with the species.
Additional files
-
Supplementary file 1
A collection of seven tables which contain necessary information for this research.
(a) Frequency of significant pathways enriched across the chondrogenesis time course. (b) 100 most significantly differentially expressed genes from differential expression analysis which contested day 0 and day 1 chondrogenesis/non-chondrogenesis samples. (c) From the time-course chondrogenesis dataset, we view the log2fc values from 21 predicted 199a/b targets. (d) From two independent chondrogenesis datasets, we view the log2fc values from 21 predicted 199a/b targets. (e) Primers and probes used for the knockdown experiments. (f) Model details for the initial model, including species and ODEs. (g) Model details for the enhanced model, included species, and ODEs.
- https://cdn.elifesciences.org/articles/89701/elife-89701-supp1-v1.docx
-
MDAR checklist
- https://cdn.elifesciences.org/articles/89701/elife-89701-mdarchecklist1-v1.pdf
Download links
A two-part list of links to download the article, or parts of the article, in various formats.
Downloads (link to download the article as PDF)
Open citations (links to open the citations from this article in various online reference manager services)
Cite this article (links to download the citations from this article in formats compatible with various reference manager tools)
Systems analysis of miR-199a/b-5p and multiple miR-199a/b-5p targets during chondrogenesis
eLife 12:RP89701.
https://doi.org/10.7554/eLife.89701.4


