An anciently diverged family of RNA binding proteins maintain correct splicing of a class of ultra-long exons through cryptic splice site repression
- Biosciences Institute, Faculty of Medical Sciences, Newcastle University, United Kingdom
- Bioinformatics Support Unit, Faculty of Medical Sciences, Newcastle University, United Kingdom
- Department of Genetics, Perelman School of Medicine, University of Pennsylvania, United States
- School of Biosciences, University of Sheffield, United Kingdom
- School of Computing, Newcastle University, United Kingdom
Figures
Figure 1 with 1 supplement
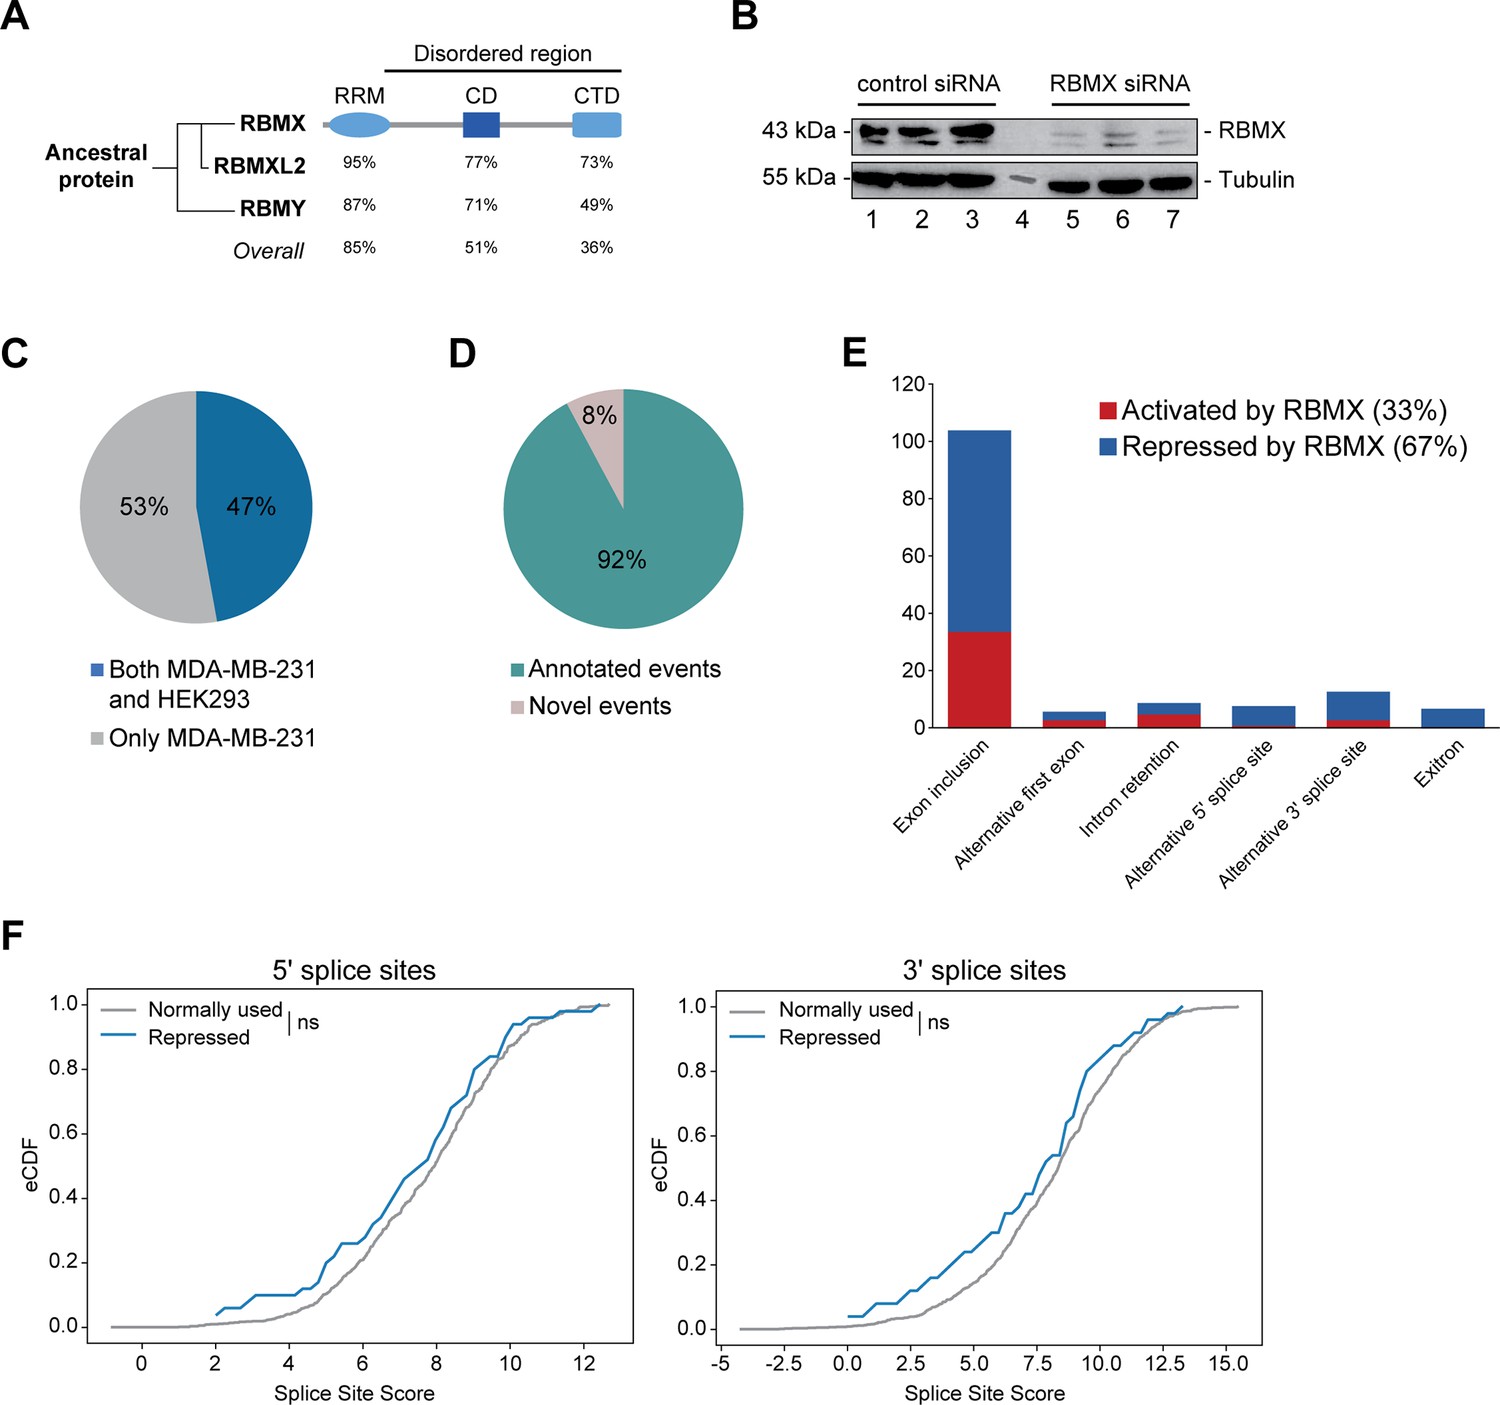
RBMX primarily operates as a splicing repressor in human somatic cells.
(A) Schematic structure of RBMX family proteins (left side, cladogram) and amino acid similarity of each domain between RBMX protein and two other members of this family, RBMXL2 and RBMY. RRM, RNA recognition motif; CD, central domain important for recognition of nascent transcripts and nuclear localisation; CTD, C-terminal domain, involved in RNA binding (Elliott et al., 2019). (B) Western blot analysis shows efficient siRNA-mediated depletion of RBMX from MDA-MB-231 cells (each lane contains biologically independent replicate, apart from lane 4 which contained size markers). (C) Pie chart showing the percentages of events controlled by RBMX in both MDA-MB-231 (this study) and HEK293 (Liu et al., 2017) cells. (D) Pie chart showing the percentages of events controlled by RBMX in both MDA-MB-231 and HEK293 cells that have been previously annotated (Refseq, Ensembl, Gencode), and those that are novel to this study. (E) Bar chart showing the different types of alternative splicing events controlled by RBMX protein in both HEK293 and MDA-MB-231 cells, summarising the proportion of splicing events that are activated by RBMX versus those that are repressed. (F) Splice site score analyses for 5ʹ (left panel) and 3ʹ (right panel) splice sites repressed by RBMX compared to RBMX non-responsive alternative splice sites. eCDF, empirical Cumulative Distribution Function. Two-sample KS test two-sided p-value = 0.41 and 0.33, respectively.
-
Figure 1—source data 1
List of splicing defects in MDA-MB-231 and HEK293 related to Figure 1C and Figure 1—figure supplement 1A.
- https://cdn.elifesciences.org/articles/89705/elife-89705-fig1-data1-v1.xlsx
Figure 1—figure supplement 1
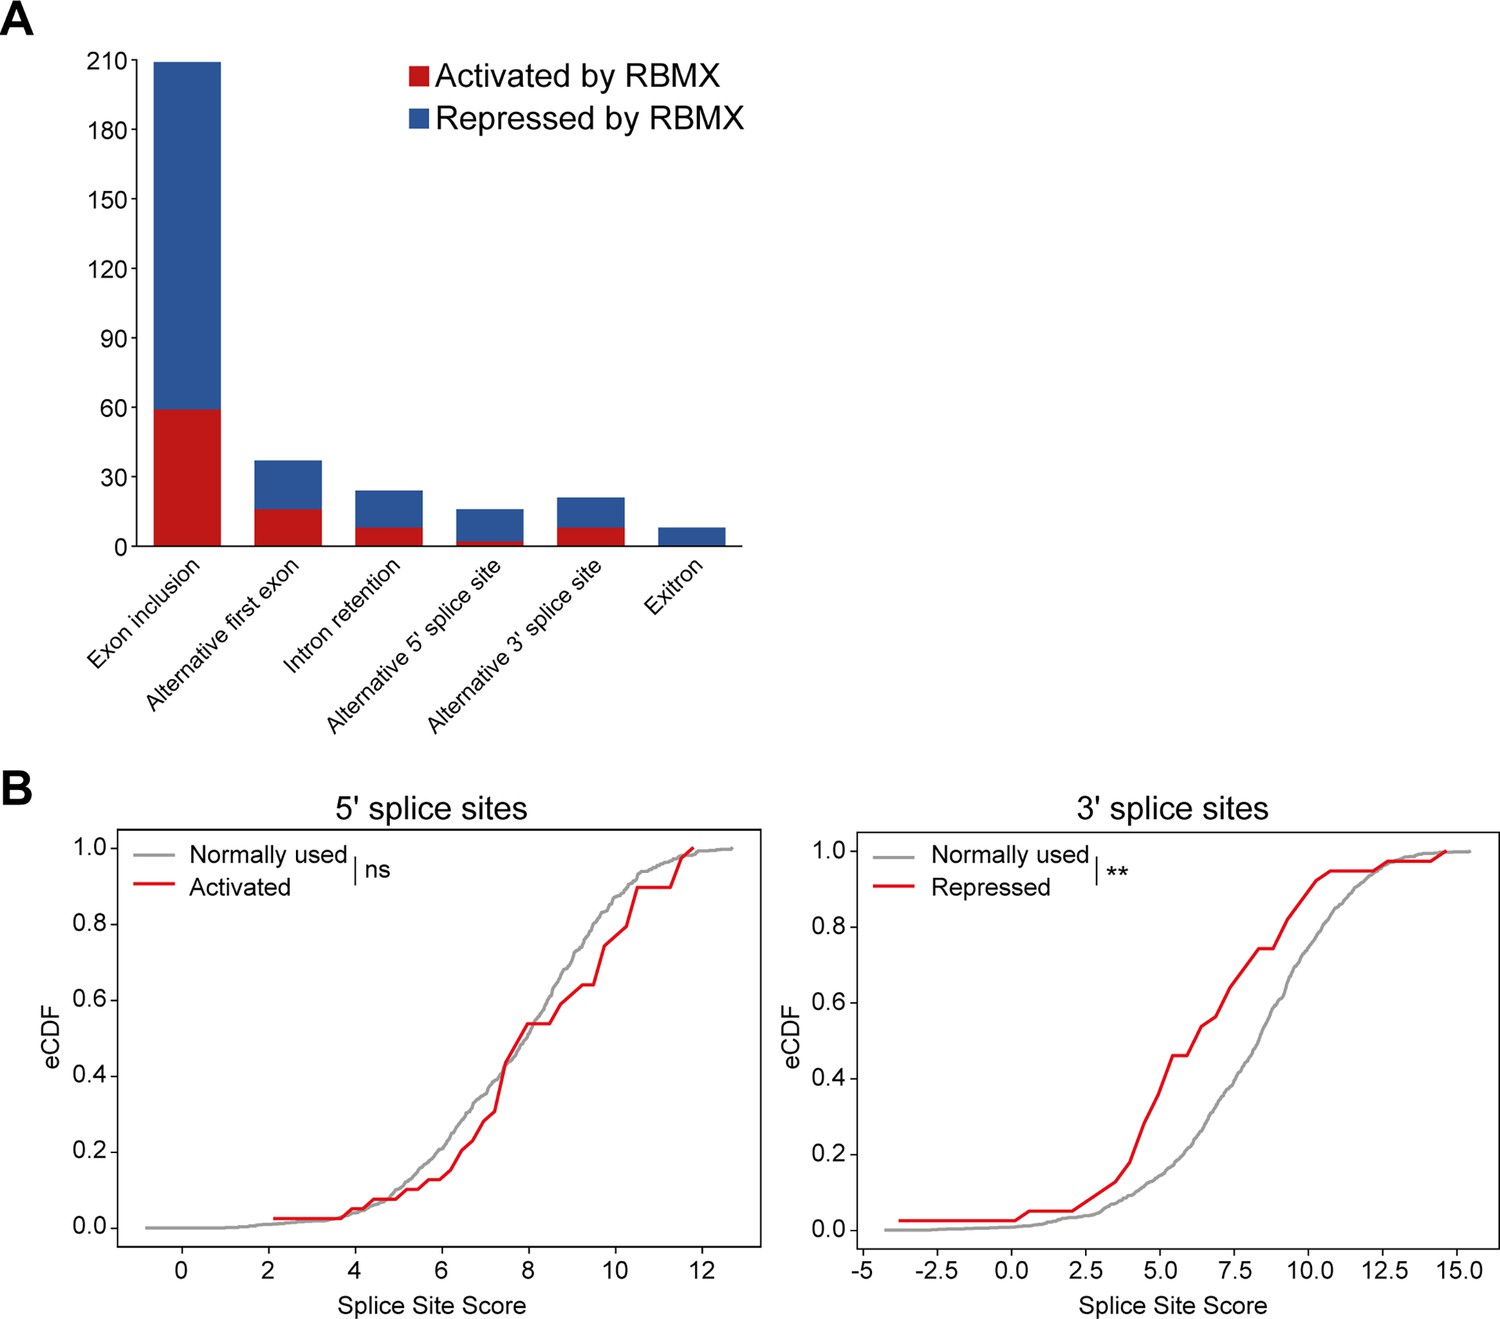
Splicing patterns controlled by RBMX within MDA-MB-231 cells and splice site strengths of exons activated by RBMX.
(A) Bar chart showing the different types of alternative splicing events controlled by RBMX protein in MDA-MB-231 cells, summarising the proportion of splicing events that are activated by RBMX versus those that are repressed. (B) Splice site score analyses for 5ʹ (left panel) and 3ʹ (right panel) splice sites activated by RBMX compared to RBMX their non-responsive alternative splice sites. eCDF, empirical Cumulative Distribution Function. Two-sample KS test two-sided p-value = 0.23 and 0.0007 (**), respectively.
Figure 2 with 1 supplement
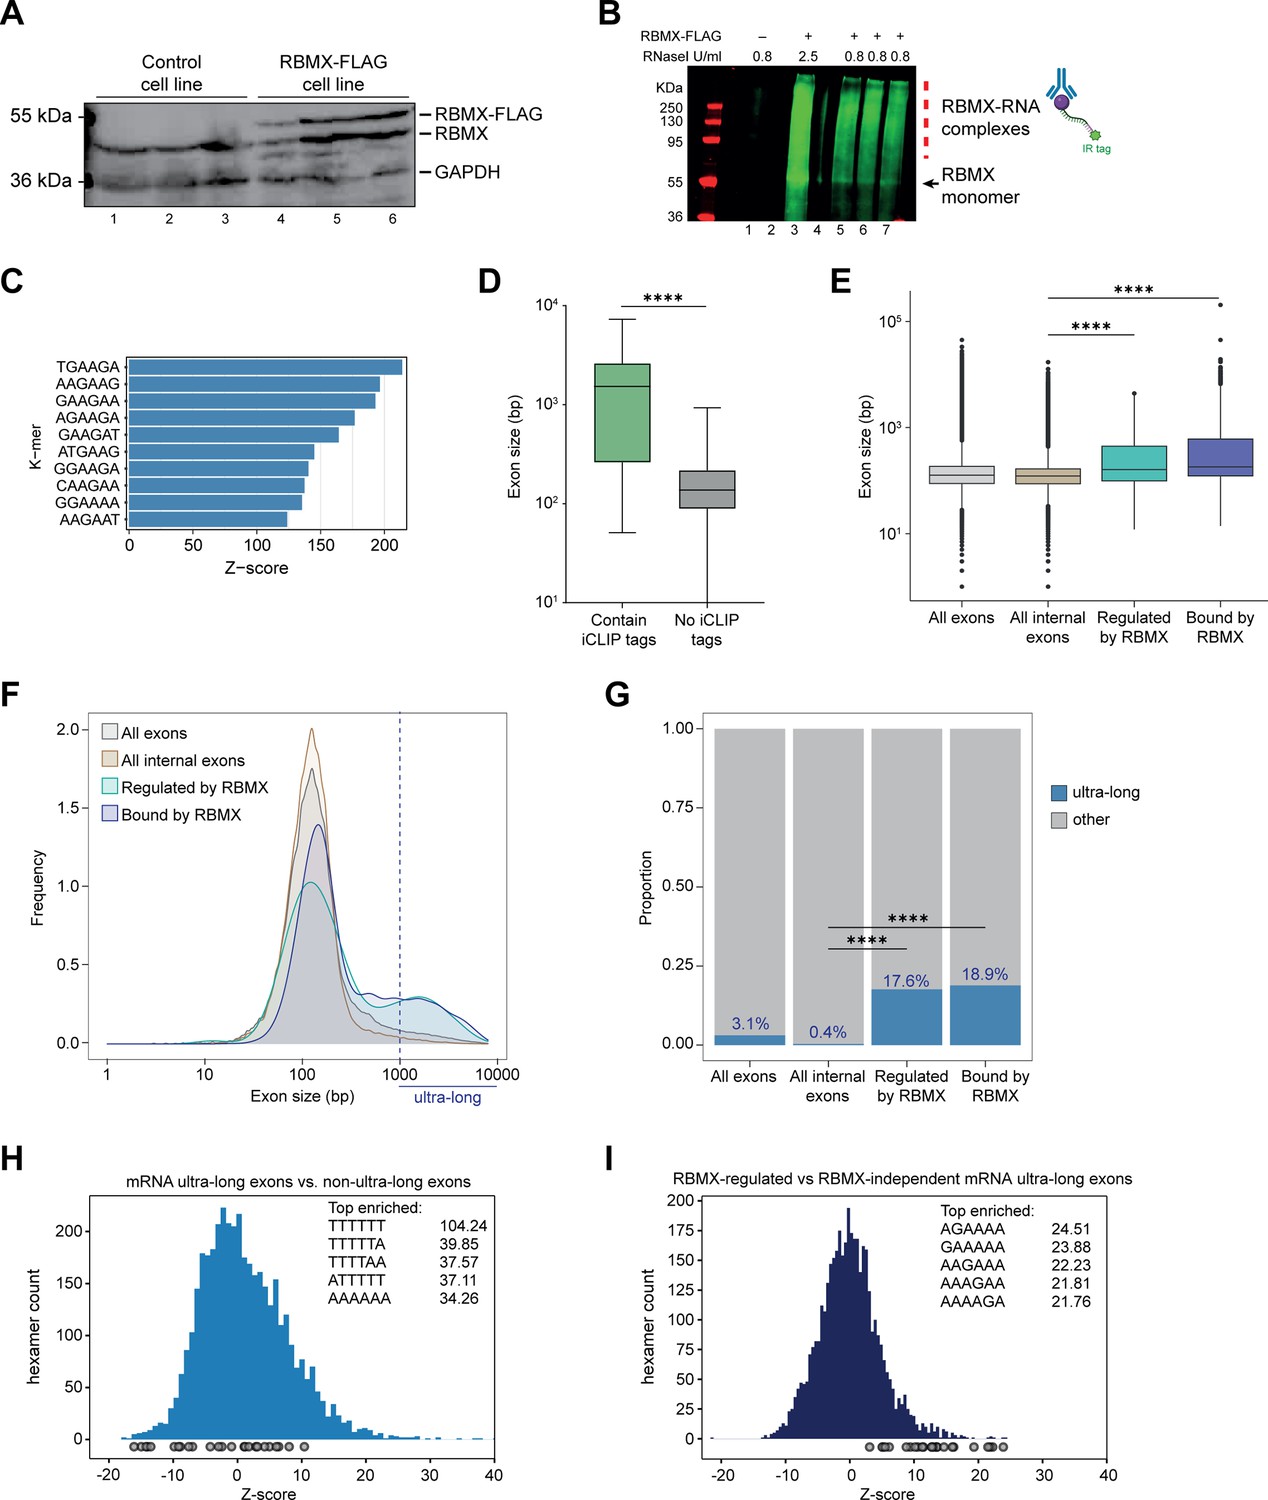
Splicing control and sites of RBMX protein-RNA interaction are enriched within long internal exons.
(A) Western blot showing levels of RBMX-FLAG protein, expressed after 24 hr treatment with tetracycline, compared to endogenous RBMX within HEK293 cells, both detected using α-RBMX antibody. α-GAPDH antibody was used as a loading control. Each lane corresponds to a biologically independent replicate sample. (B) RNAs cross-linked to RBMX-FLAG during individual nucleotide resolution crosslinking and immunoprecipitation (iCLIP) were detected through the infrared adaptor (RBMX-RNA complexes). Lane 1, anti-FLAG pull-down from crosslinked HEK293 control cells not expressing RBMX-FLAG proteins, treated with 0.8 U/ml RNaseI. Lane 3, RBMX-FLAG pull-down crosslinked to RNA, treated with 2.5 U/ml RNaseI. Lanes 5–7, RBMX-FLAG pull-down crosslinked to RNA, treated with 0.8 U/ml RNaseI. Samples in lanes 5–7 were used for iCLIP library preparation. Lanes 2 and 4 are empty. (C) K-mer analysis shows the top 10 enriched motifs within sequences surrounding RBMX iCLIP tags. (D) Boxplot analysis shows sizes of exons containing splicing events regulated by RBMX, grouped by whether they contain CLIP tags or not. ****, p<0.0001 (Mann-Whitney test). (E) Boxplot analysis shows the distribution of exon sizes relative to: all or internal exons contained in mRNA genes expressed in HEK293 cells (Liu et al., 2017); exons regulated by RBMX as identified by RNA-seq; exons containing RBMX binding sites as identified by iCLIP, listed independently of iCLIP tag density. Median sizes for each group are shown. ****, p<0.0001 (Wilcoxon rank test and Kruskal-Wallis test). (F) Distribution plot of exon sizes for the groups shown in (E). Note the increased accumulation of exons larger than 1000 bp (ultra-long exons) in RBMX-bound and regulated exons compared to all exons expressed in HEK293 (Liu et al., 2017). (G) Bar plot indicating the proportion of ultra-long exons in the groups shown in (E, F). ****, p<0.0001 (Chi-squared test). (H) Histogram of hexamer Z-scores for ultra-long exons (exceeding 1000 nt) versus non-ultra-long exons from Ensembl canonical mRNA transcripts. The top five enriched hexamers are shown with corresponding Z-scores. Grey dots indicate histogram bins containing one of the top 25 RBMX iCLIP hexamer motifs. (I) Similar analysis as in (H), but for ultra-long exons with evidence of RBMX binding or regulation versus RBMX-independent ultra-long exons.
-
Figure 2—source data 1
List of splicing defects with nearby RBMX CLIP tags from HEK293 cells related to Figure 2D and Figure 2—figure supplement 1C.
- https://cdn.elifesciences.org/articles/89705/elife-89705-fig2-data1-v1.xlsx
-
Figure 2—source data 2
List of exons analysed in Figure 2E–G.
- https://cdn.elifesciences.org/articles/89705/elife-89705-fig2-data2-v1.txt
Figure 2—figure supplement 1
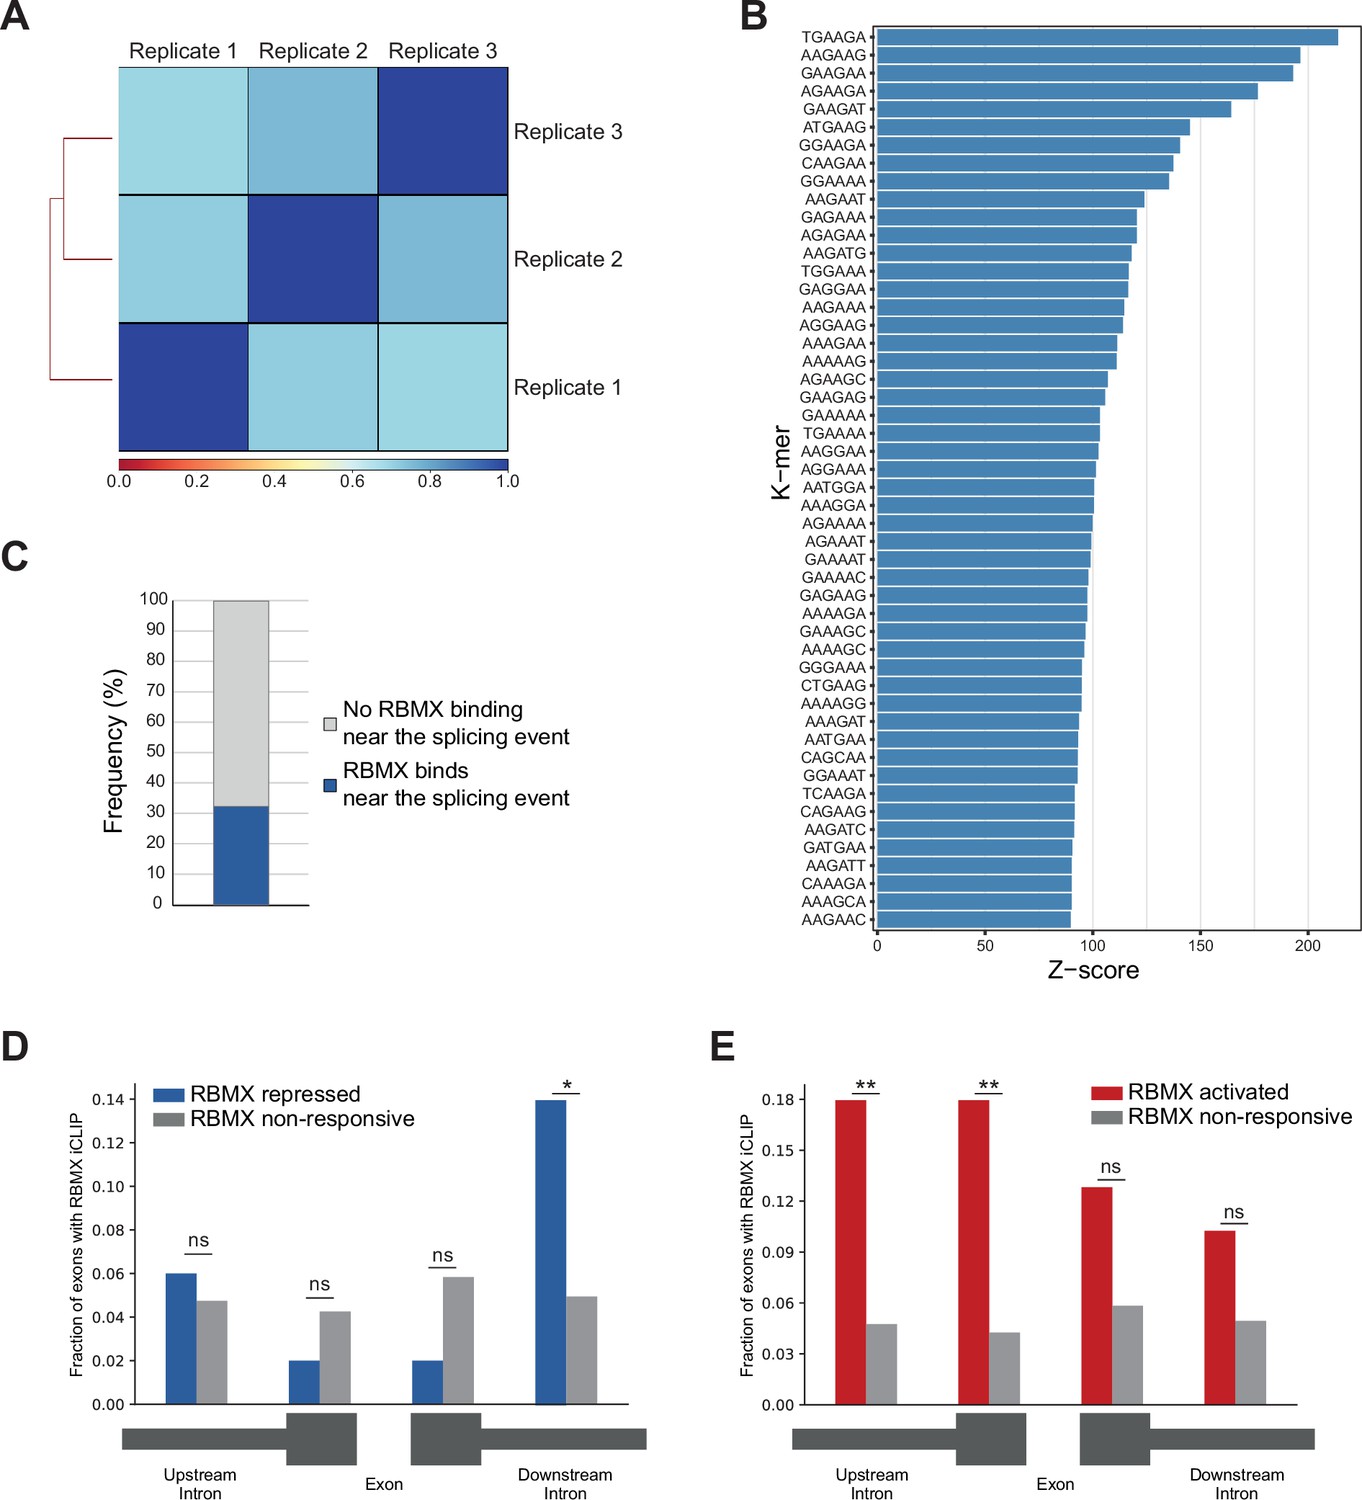
Further analysis of RBMX protein-RNA interactions.
(A) Correlation analysis between three replicates for RBMX-FLAG iCLIP. (B) K-mer analysis shows the top 50 enriched motifs within sequences surrounding RBMX individual nucleotide resolution crosslinking and immunoprecipitation (iCLIP) binding. (C) Barplot showing the percentage of exons regulated by RBMX that contain iCLIP tags. (D) Fraction of exons that were repressed by RBMX (blue) or independent (grey) that contained RBMX iCLIP tags in surrounding regions (below diagram). *p<0.05 (two-tailed Fisher’s exact test). (E) The same analyses as in (D) but for exons that were activated by RBMX (red). **p<0.01 (two-tailed Fisher’s exact test). For parts (D) and (E), the number of RBMX repressed exons was 50, the number of RBMX activated exons was 39, and the number of RBMX-unresponsive exons was 1011.
Figure 3 with 2 supplements
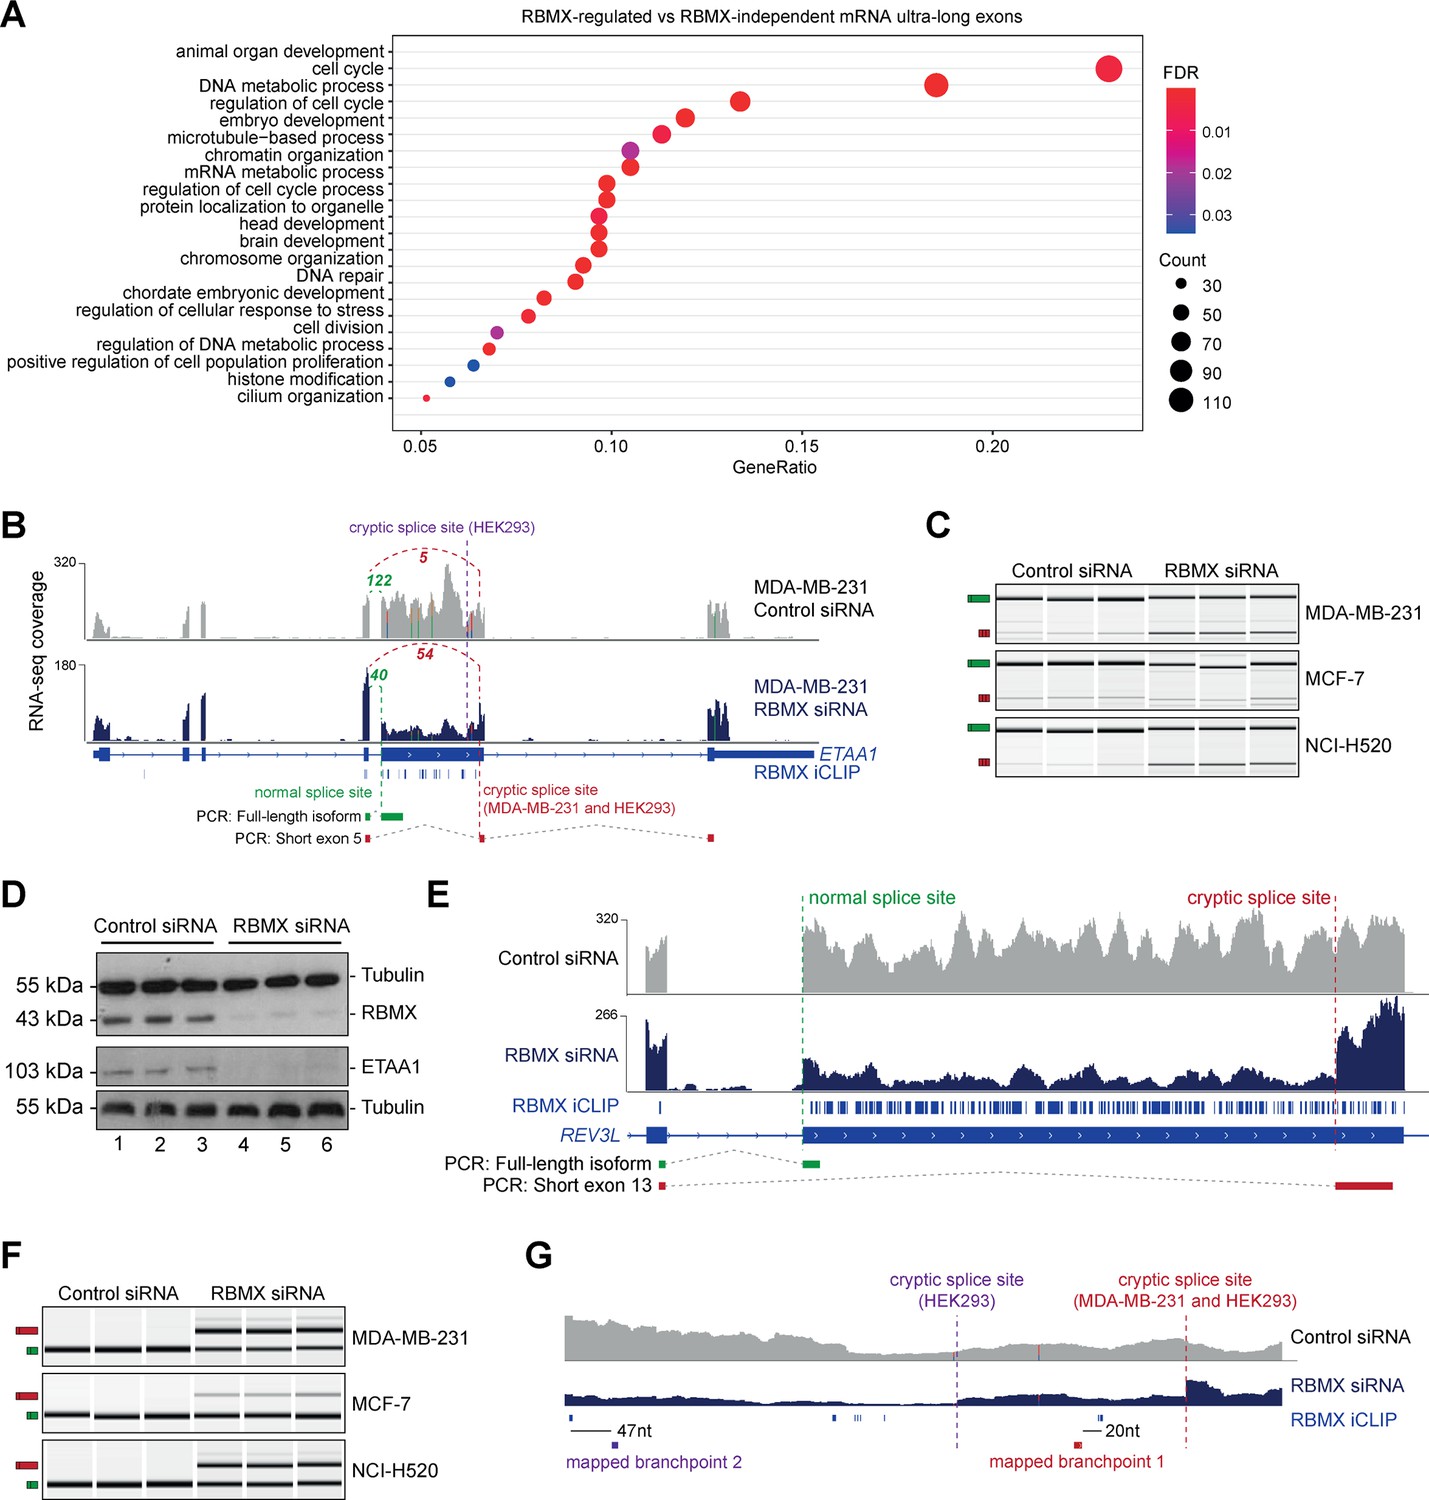
RBMX protein is important for full-length splicing inclusion of ultra-long exons involved in DNA repair and chromosome biology.
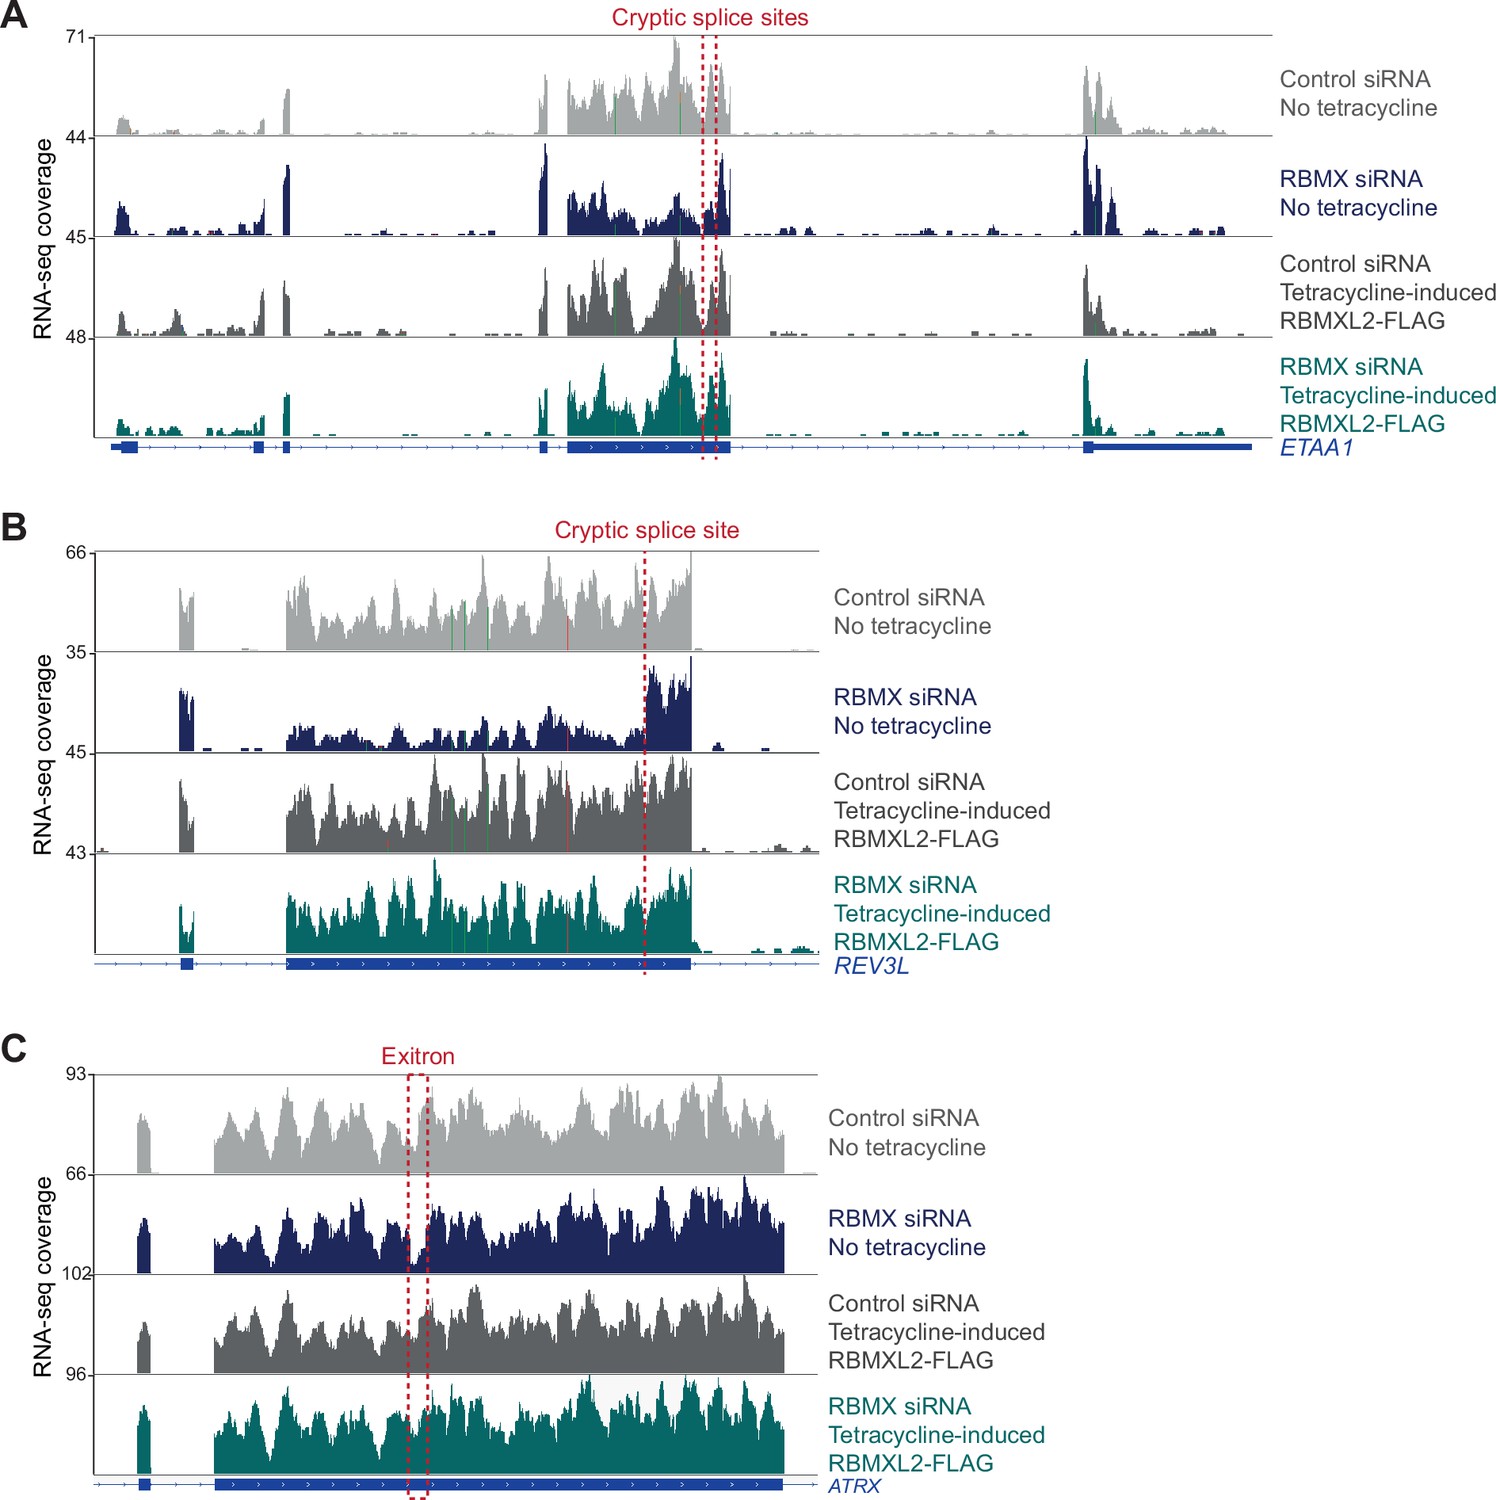
(A) Gene ontology analysis of genes with ultra-long exons regulated and bound by RBMX displaying significant gene ontology biological process (GOBP) terms containing at least 5% of the total gene list. FDR, False Discovery Rate. Count, number of genes in the GOBP group. GeneRatio, proportion of genes in the GOBP group relative to the full list of RBMX-regulated genes. (B) Snapshot of RNA-seq merged tracks from MDA-MB-231 cells and RBMX iCLIP tags from HEK293 cells from the IGV genome browser shows cryptic 3ʹ splice sites repressed by RBMX in ETAA1 exon 5. At the bottom, the schematic of PCR products identified by RT-PCR in (C). (C) RT-PCR analysis shows splicing inclusion of ETAA1 exon 5 upon siRNA-mediated depletion of RBMX in the indicated cell lines (separate lanes correspond to analysis of independent biological replicate samples). (D) Western blot analysis shows that ETAA1 protein expression is dependent on RBMX. Anti-Tubulin detection was used as loading control (separate lanes correspond to independent biological replicate samples). (E) Snapshot of RNA-seq merged tracks from MDA-MB-231 cells and RBMX iCLIP tags from HEK293 cells from the IGV genome browser shows RBMX represses a cryptic 3ʹ splice site within the ultra-long exon 13 of REV3L. At the bottom, the schematic of PCR products identified by RT-PCR in (F). (F) RT-PCR analysis shows splicing inclusion of REV3L exon 13 upon siRNA-mediated depletion of RBMX in the indicated cell lines (separate lanes correspond to the analysis of independent biological replicate samples). (G) Snapshot of RNA-seq merged tracks from MDA-MB-231 cells and RBMX iCLIP tags from HEK293 cells from IGV genome browser. The location of experimentally mapped branchpoints relative to RBMX binding is indicated.
-
Figure 3—source data 1
Gene ontology analyses related to Figure 3A and Figure 3—figure supplement 1A, B.
- https://cdn.elifesciences.org/articles/89705/elife-89705-fig3-data1-v1.xlsx
Figure 3—figure supplement 1
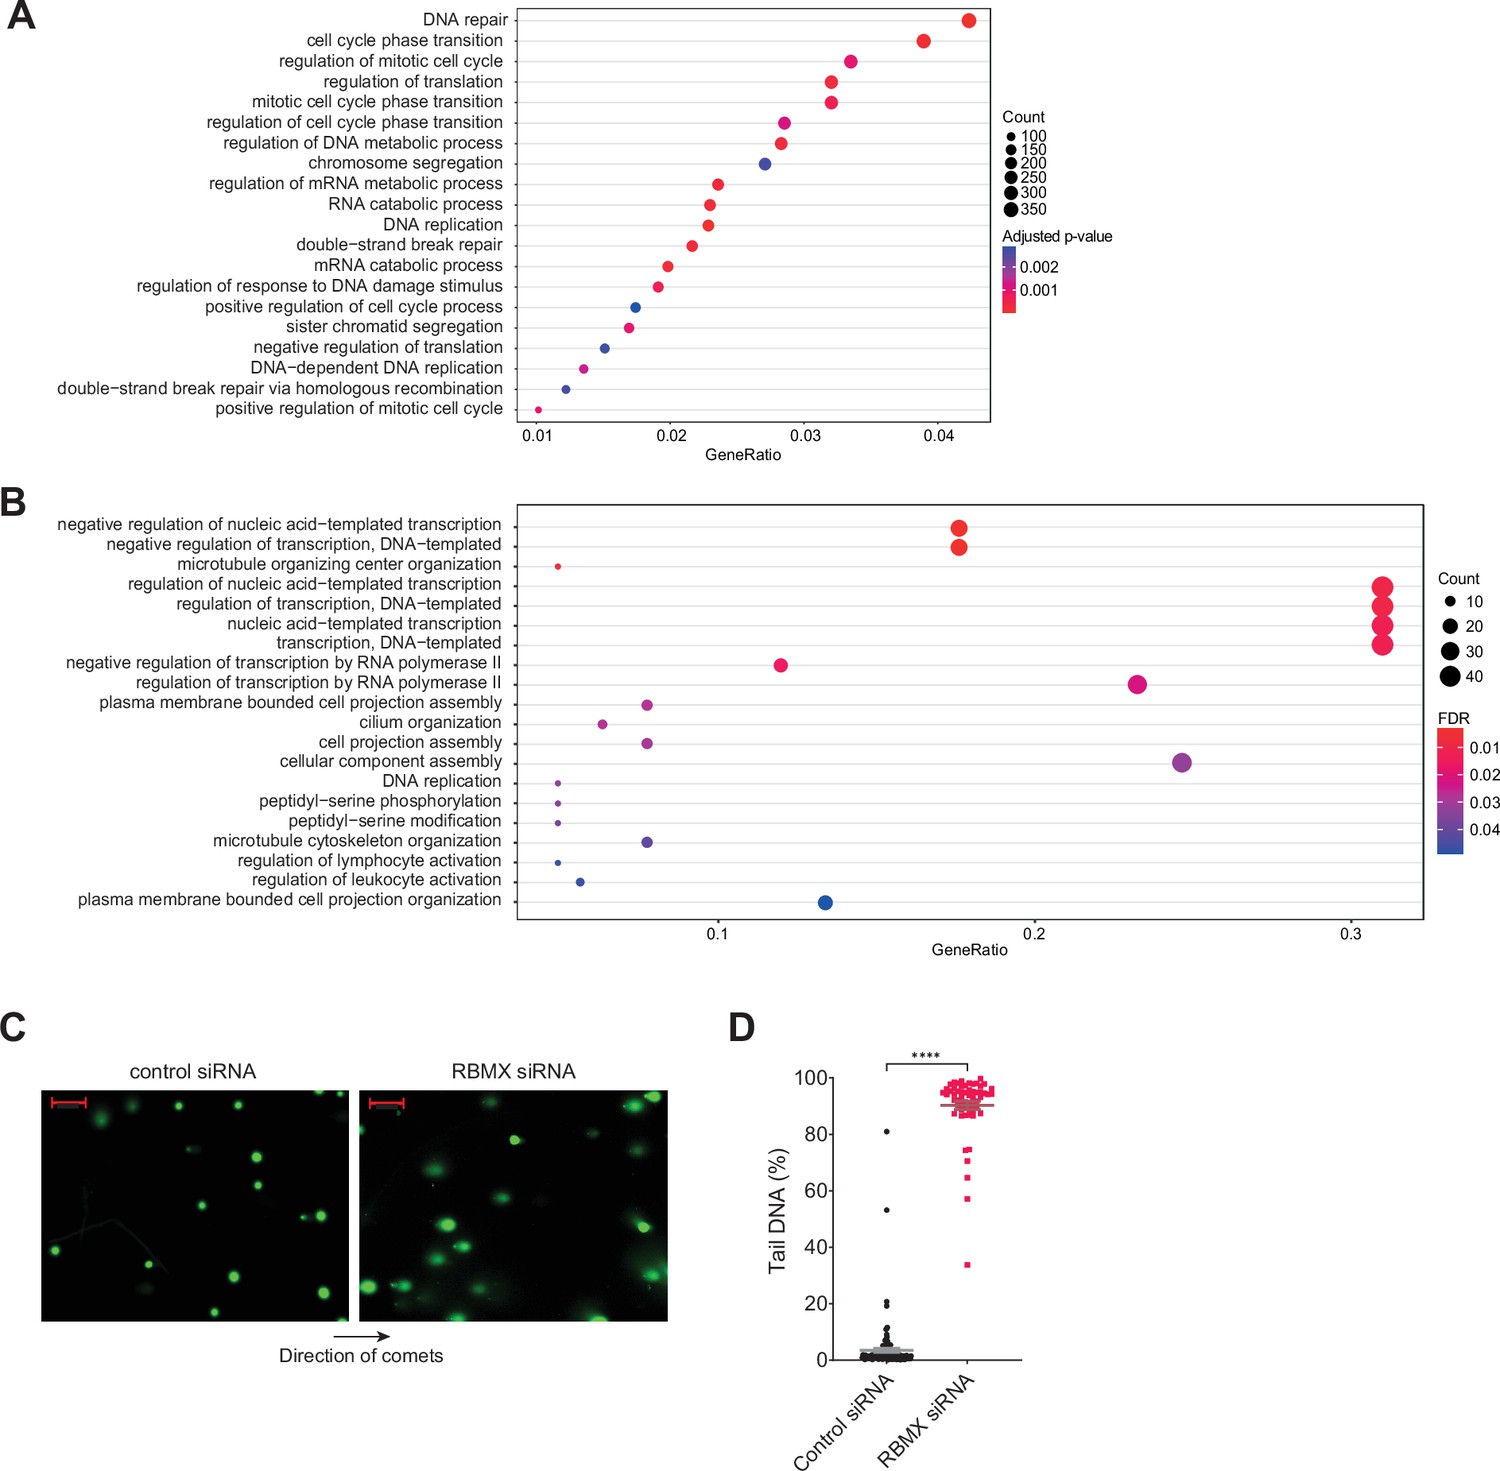
Further analysis of gene categories encoding mRNAs bound by RBMX and association with genome stability.
(A) Gene ontology analysis of genes bound by RBMX as identified by individual nucleotide resolution crosslinking and immunoprecipitation (iCLIP), displaying the top 20 significant gene ontology biological process (GOBP). Adjusted p-value were produced using the Benjamini-Hochberg method. Count, number of genes in the GOBP group. GeneRatio, proportion of genes in the GOBP group relative to the full list of RBMX-regulated genes. (B) Analysis as in (A) but relative to genes regulated by RBMX in both MDA-MB-231 (this study) and HEK293 (Liu et al., 2017) as identified by RNA-seq. GOBP terms containing at least 5% of the total gene list are shown. FDR, False Discovery Rate. (C) Comet assay shows increased formation of DNA breaks in U2-OS cells treated with RBMX siRNA. Direction of the comets is shown. Scale bars 200 µm. (D) Quantification of percentage of DNA in the tail of comets. n=58 cells in both conditions. ****p<0.0001 (Mann-Whitney test).
Figure 3—figure supplement 2
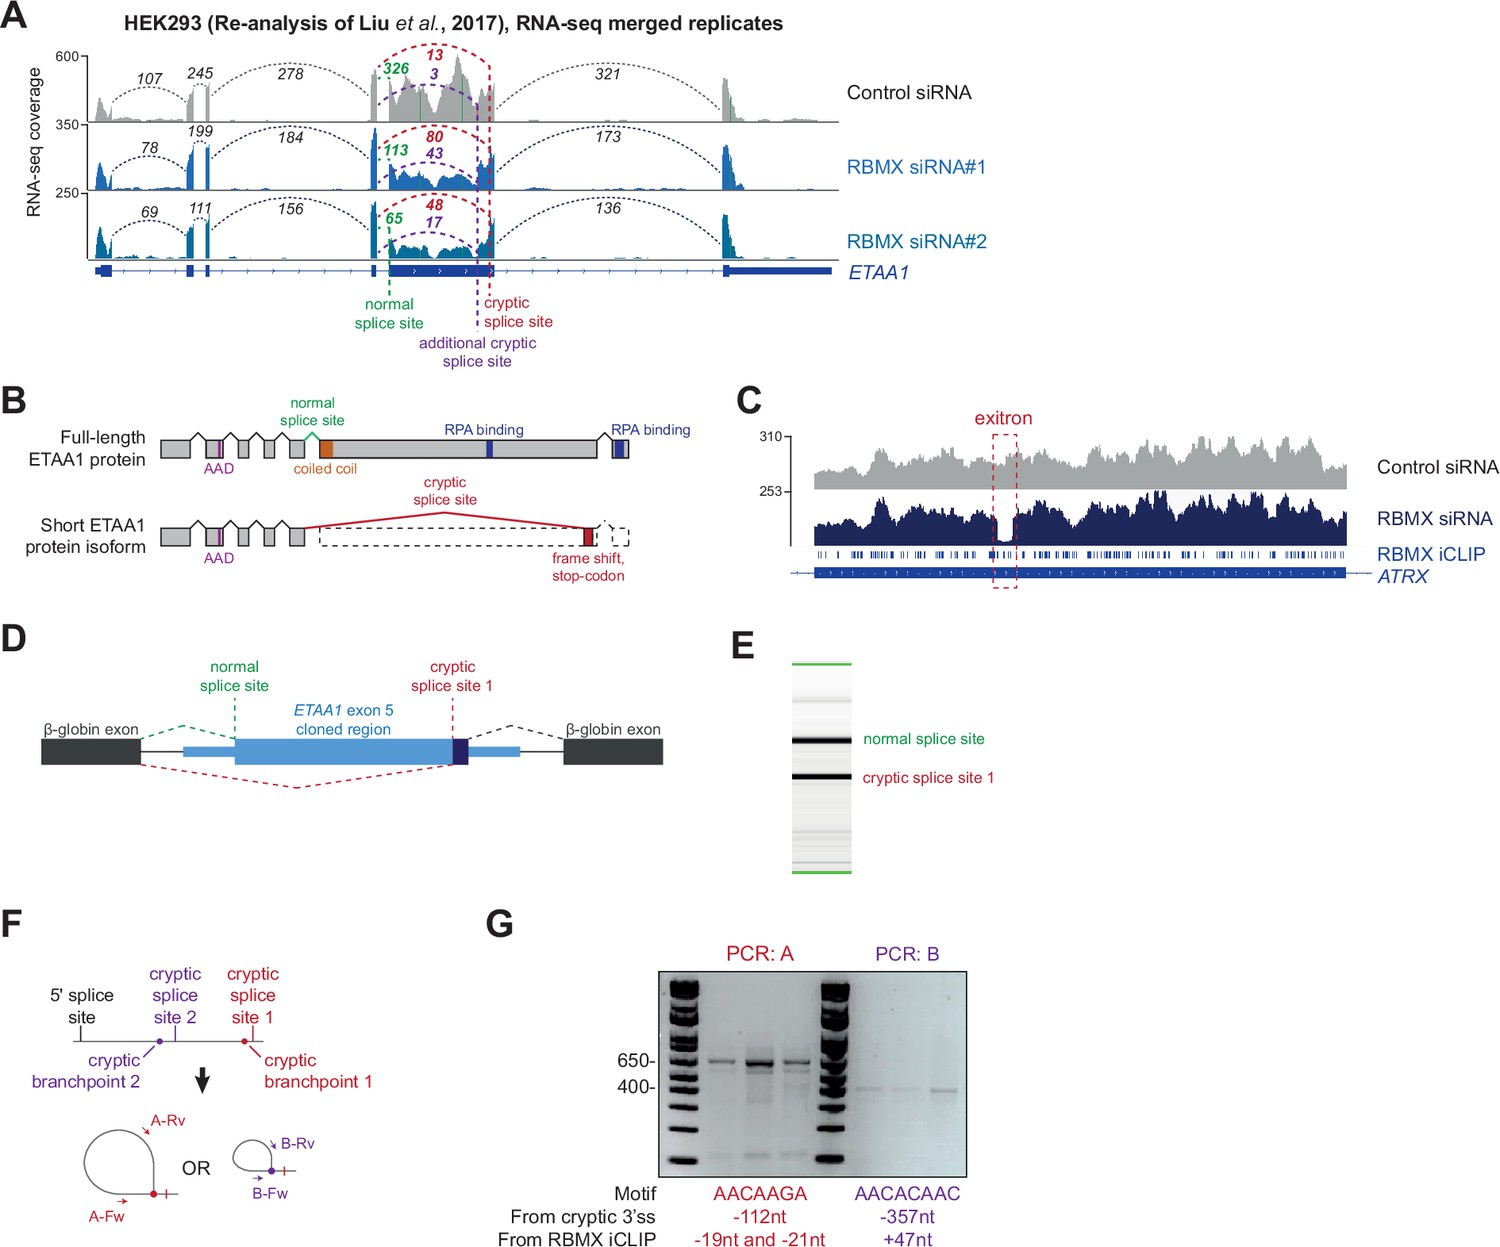
Further analysis of cryptic splicing patterns within the ETAA1 and ATRX mRNAs.
(A) Snapshot of RNA-seq merged tracks from HEK293 cells. Liu et al., 2017 from the IGV genome browser shows cryptic 3ʹ splice sites repressed by RBMX in ETAA1 exon 5. (B) Schematic of ETAA1 protein in normal conditions and expected ETAA1 protein in RBMX-depleted cells. (C) Snapshot of RNA-seq merged tracks from MDA-MB-231 cells and RBMX individual nucleotide resolution crosslinking and immunoprecipitation (iCLIP) tags from HEK293 cells from the IGV genome browser shows an exitron repressed by RBMX in ATRX exon 9. (D) Schematic representation of ETAA1 minigene cloned within pXJ41. (E) Example RT-PCR from ETAA1 minigene shows detection of both the normal and cryptic version of exon 5. (F) Schematic of RT-PCR assay to detect branchpoints used during cryptic splicing of ETAA1 exon 5. (G) RT-PCR analysis for mapping branchpoints used during ETAA1 cryptic splicing (see Figure 3G). The distance from the relative cryptic splice site and from the RBMX binding site as defined by iCLIP is indicated.
Figure 4 with 2 supplements
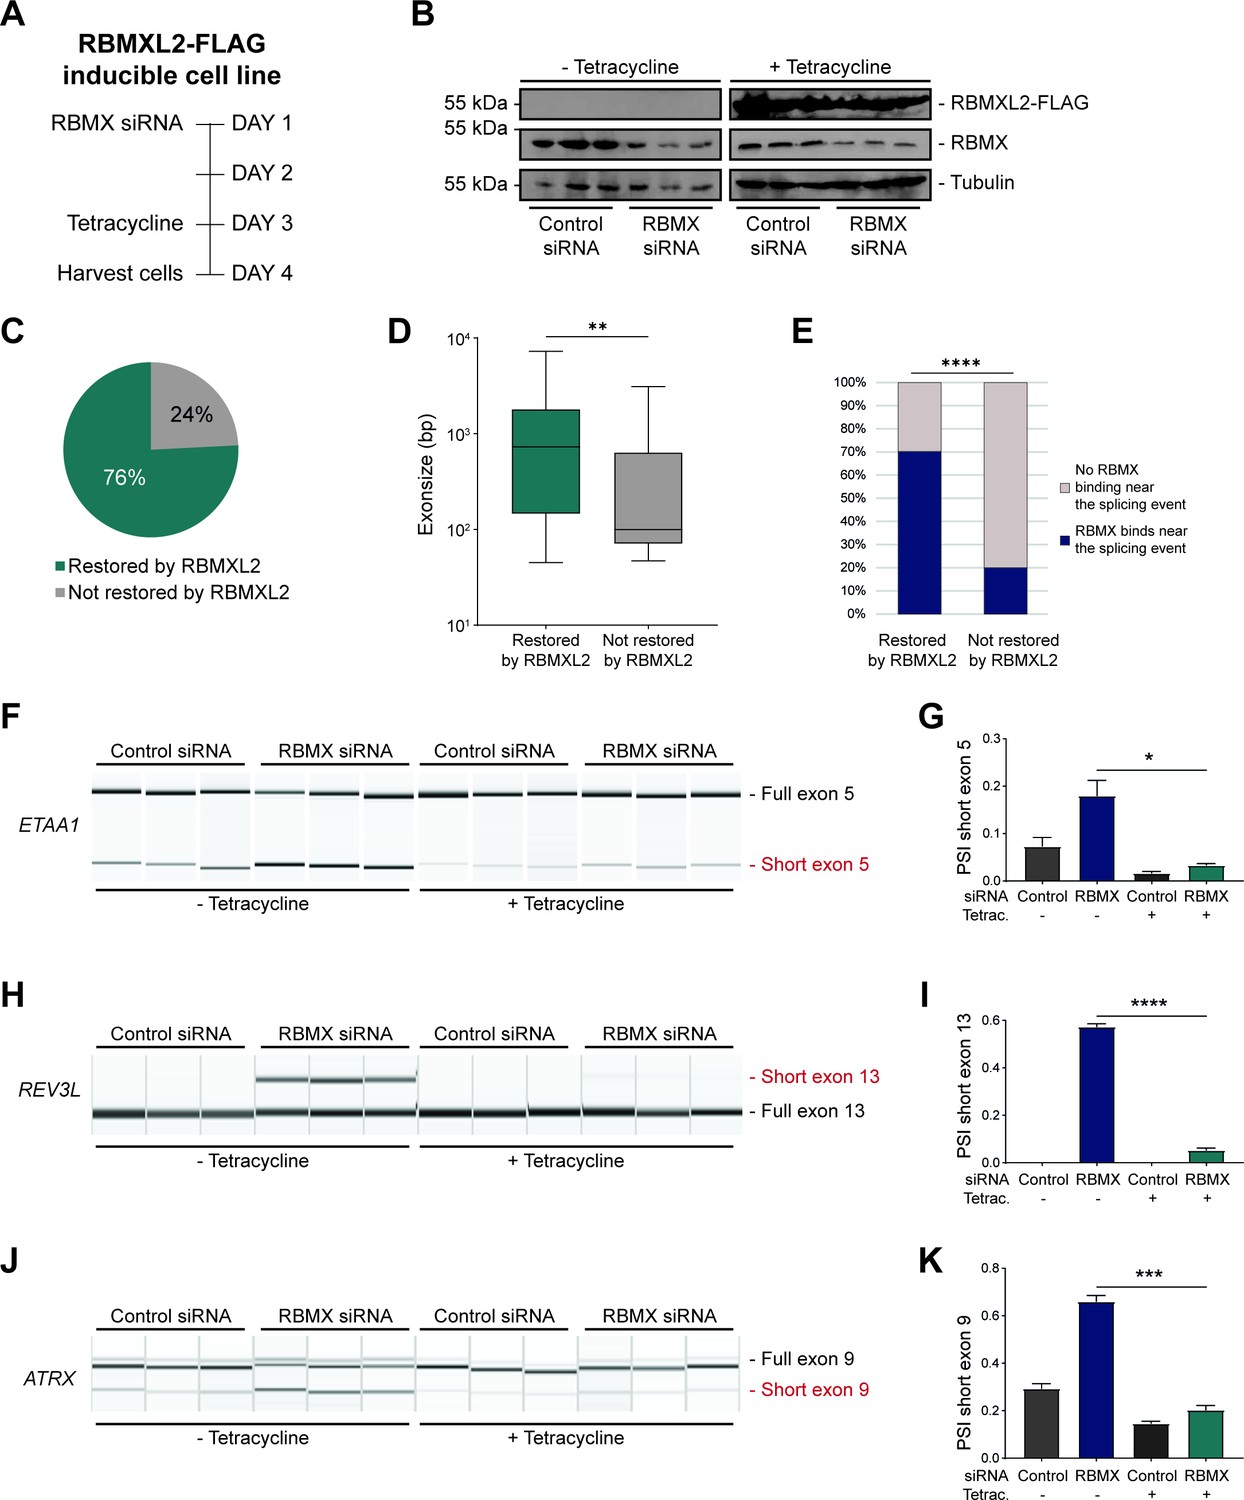
RBMXL2 can replace the activity of RBMX in ensuring proper splicing inclusion of ultra-long exons.
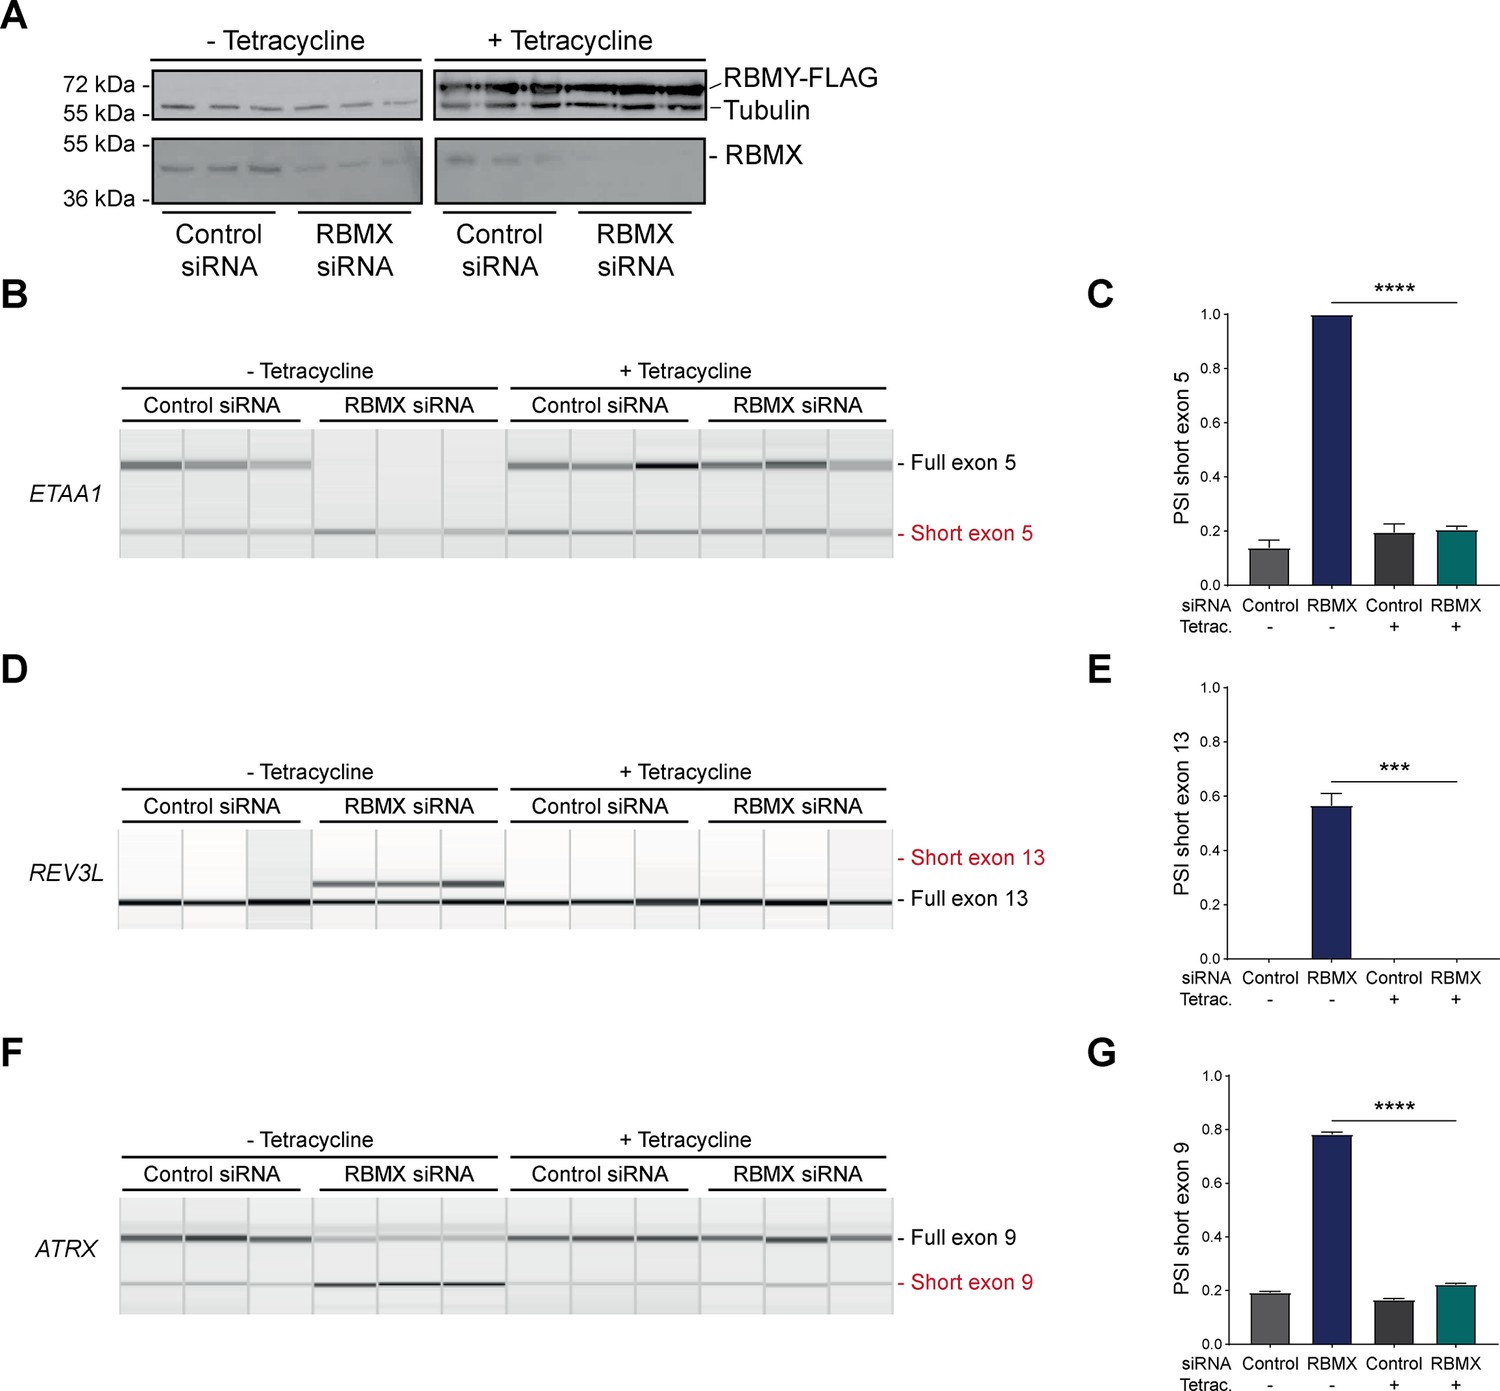
(A) Schematic of the time-course experiment used to analyse human RBMXL2 function in RBMX-depleted HEK293 cells. All conditions were repeated in biological triplicates. (B) Western blot analysis shows that RBMXL2-FLAG protein is stably expressed in HEK293 cells after 24 hr of tetracycline induction, and RBMX protein is successfully depleted after 72 hr of siRNA treatment. Separate lanes correspond to independent biological replicate samples. (C) Pie chart showing the percentage of splicing events detected by RNA-seq that were defective in RBMX-depleted cells and restored by overexpression of RBMXL2. (D) Boxplot analysis shows the distribution of exon sizes relative to exons undergoing defective splicing in RBMX-depleted cells, grouped by whether splicing patters were restored by RBMXL2 overexpression. **p<0.01 (Mann-Whitney test). (E) Bar plot analysis shows the proportion of exons containing RBMX individual nucleotide resolution crosslinking and immunoprecipitation (iCLIP) tags, grouped by whether splicing patterns were restored by RBMXL2 overexpression. ****p<0.0001 (Chi-squared test). (F, H, J) Capillary gel electrophoretograms show RNA processing patterns of endogenous ultra-long exons within ETAA1, REV3L, and ATRX controlled by RBMX and RBMXL2 analysed using isoform-specific RT-PCR. Separate lanes correspond to the analysis of independent biological replicate samples. (G, I, K) Bar charts showing percentage splicing inclusion (PSI) of cryptic isoforms from the endogenous ETAA1, REV3L, and ATRX genes under the different experimental conditions, measured in experiments in (F), (H) and (J), respectively. p-values were calculated using an unpaired t-test. * p< 0.05; ***p< 0.001; ****p<0.0001, using n=3 biological replicates for each condition as shown in capillary gel electrophoretograms.
-
Figure 4—source data 1
List of splicing defects restored by overexpression of RBMXL2 related to Figure 4C.
- https://cdn.elifesciences.org/articles/89705/elife-89705-fig4-data1-v1.xlsx
Figure 4—figure supplement 1
RBMXL2 can replace the activity of RBMX in ensuring proper splicing inclusion of ultra-long exons.
(A–C) Snapshot of RNA-seq merged tracks from HEK293 cells from the IGV genome browser shows tetracycline-induced expression of RBMXL2 restores correct splicing patterns within ETAA1 exon 5 (A), REV3L exon 13 (B), and ATRX exon 9 (C). Location of the splicing defects in RBMX-depleted cells is shown with red dotted lines.
Figure 4—figure supplement 2
RBMY can replace the activity of RBMX in ensuring proper splicing inclusion of ultra-long exons.
(A) Western blot analysis shows that human RBMY-FLAG protein is stably expressed in HEK293 cells after 24 hr of tetracycline induction, and RBMX protein is successfully depleted after 72 hr of siRNA treatment. All conditions were repeated in biological triplicate. (B, D, F) Capillary gel electrophoretograms show RNA processing patterns of endogenous ultra-long exons within ETAA1, REV3L, and ATRX controlled by RBMX and RBMY analysed using isoform-specific RT-PCR. Separate lanes correspond to the analysis of independent biological replicate samples. (C, E, G) Bar charts showing percentage splicing inclusion (PSI) of cryptic isoforms from the endogenous ETAA1, REV3L, and ATRX genes under the different experimental conditions, measured in experiments in (B), (D), and (F) respectively. p-values were calculated using an unpaired t-test. ***p<0.001; ****p<0.0001, for n=3 biological replicates as shown in capillary gel electrophoretograms.
Figure 5
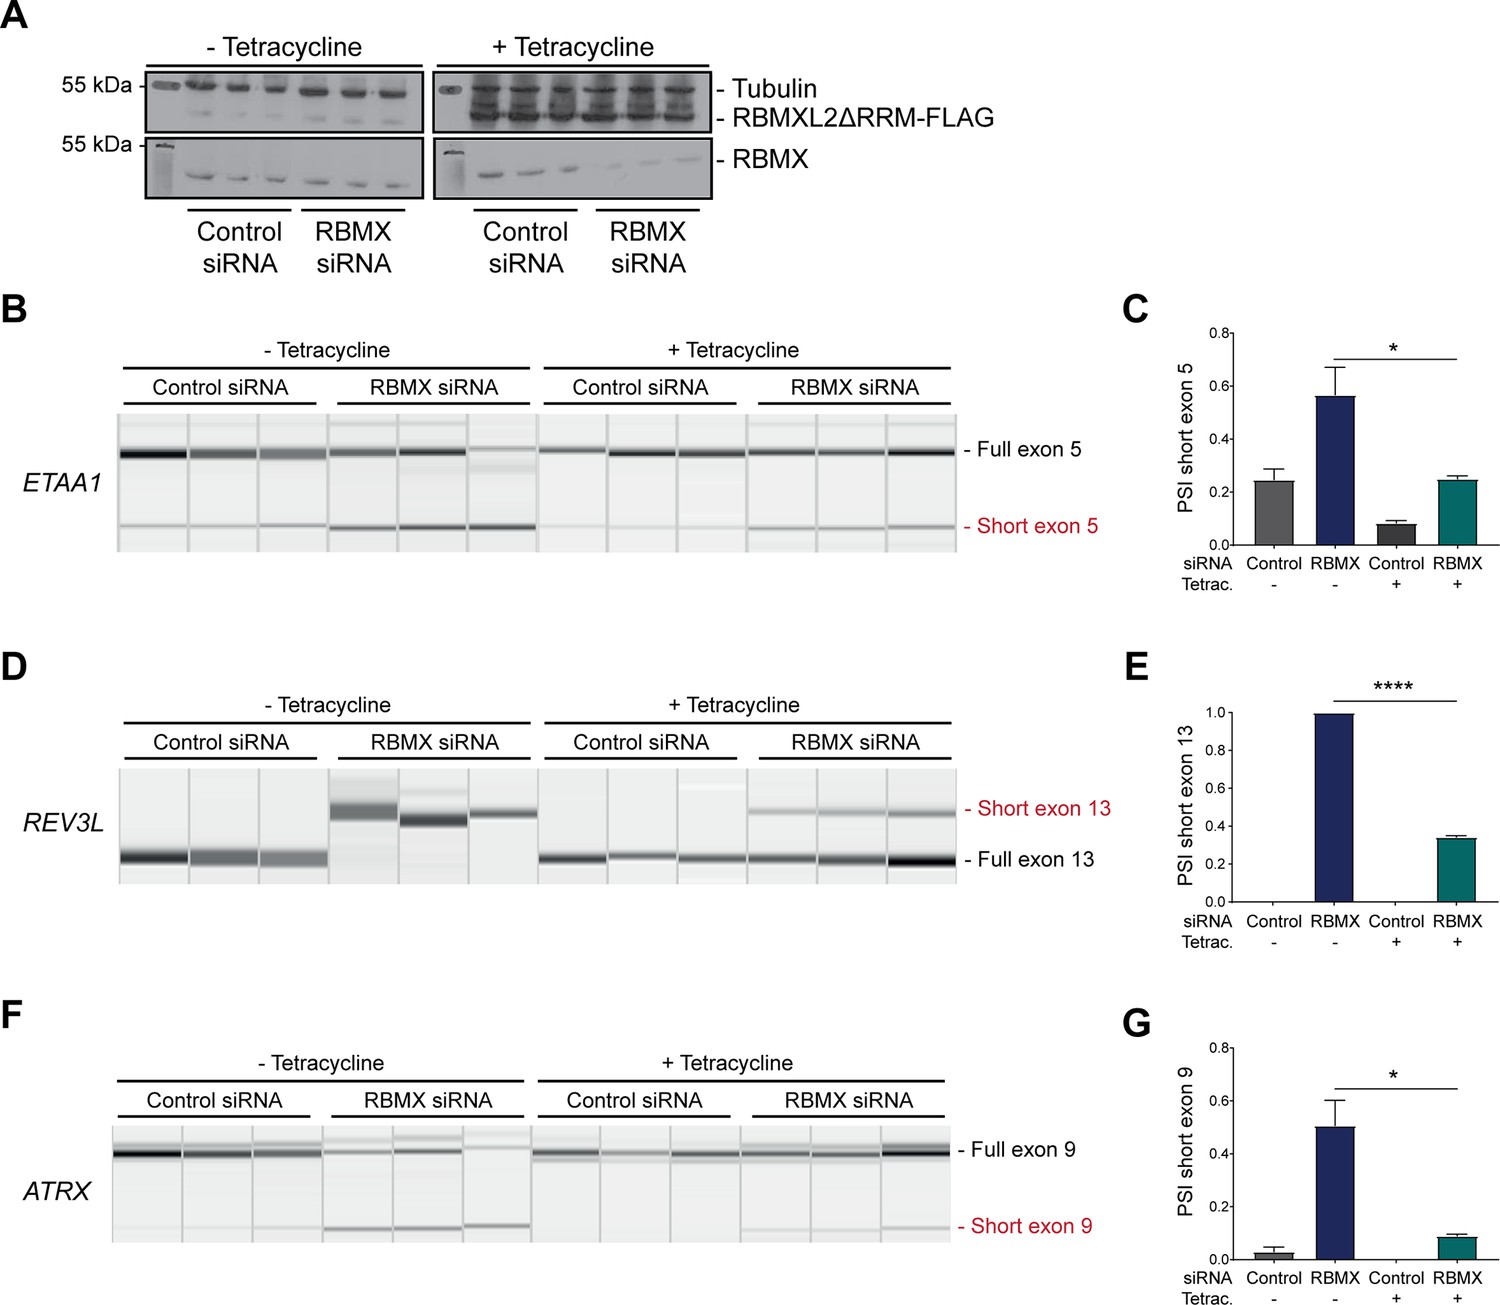
The disordered domain of RBMXL2 is required to mediate splicing control of ultra-long exons in HEK293 cells.
(A) Western blot analysis shows that RBMXL2ΔRRM-FLAG protein is stably expressed in HEK293 cells after 24 hr of tetracycline induction, and RBMX protein is successfully depleted after 72 hr of siRNA treatment. Separate lanes correspond to the analysis of independent biological replicate samples. (B, D, F) Capillary gel electrophoretograms show RNA processing patterns of endogenous ultra-long exons within ETAA1, REV3L, and ATRX analysed using isoform-specific RT-PCR. Separate lanes correspond to the analysis of independent biological replicate samples. (C, E, G) Bar charts showing percentage splicing inclusion (PSI) of cryptic isoforms from the endogenous ETAA1, REV3L, and ATRX genes under the different experimental conditions, measured in experiments in (B), (D), and (F), respectively. p-values were calculated using an unpaired t-test. ****p<0.0001, using biologically independent sampleas.
Figure 6
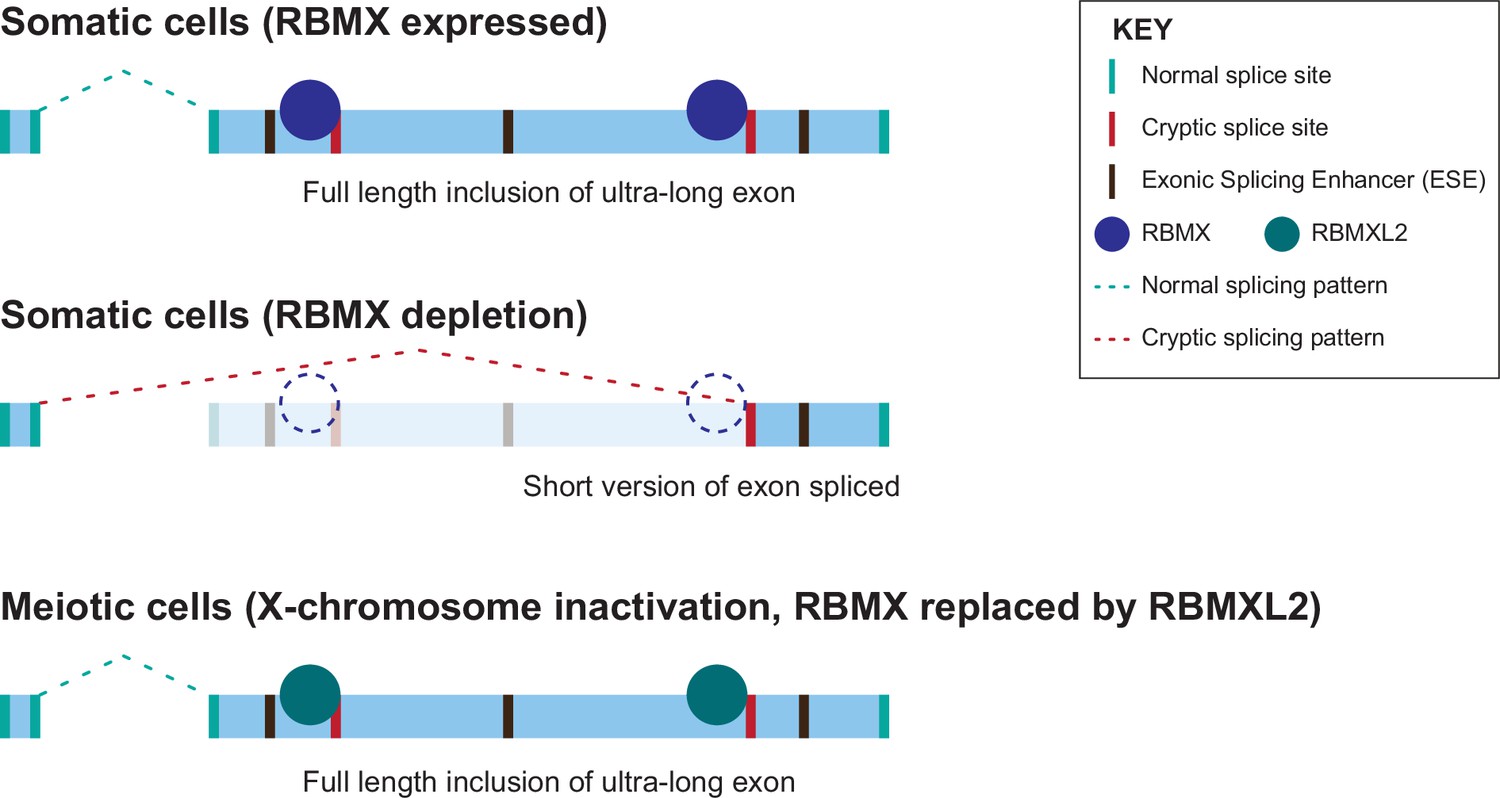
Model of cryptic splice site repression within ultra-long exons by RBMX family proteins.
Ultra-long exons may be intrinsically fragile as they could contain cryptic splice sites within an environment rich in exonic splicing enhancers (ESEs). RBMX protein binding within ultra-long exons may directly block access of spliceosome components to cryptic splice sites, and depletion of RBMX from somatic cells activates the selection of cryptic splice sites. This means a shorter version of the originally ultra-long exon is included, that fits more easily with exon definition rules normally followed for median-size exons. During meiosis, the lack of RBMX caused by X chromosome inactivation is compensated by the expression of RBMXL2 protein.
Tables
Key resources table
| Reagent type (species) or resource | Designation | Source or reference | Identifiers | Additional information |
|---|---|---|---|---|
| Gene (Homo sapiens) | RBMX | GenBank | NCBI Gene: 27316 Ensembl: ENSG00000147274 | |
| Gene (Homo sapiens) | RBMXL2 | GenBank | NCBI Gene: 27288 Ensembl: ENSG00000170748 | |
| Gene (Homo sapiens) | RBMY/ RBMY1A1 | GenBank | NCBI Gene: 5940 Ensembl: ENSG00000234414 | |
| Gene (Homo sapiens) | ETAA1 | GenBank | NCBI Gene: 54465 Ensembl: ENSG00000143971 | |
| Gene (Homo sapiens) | REV3L | GenBank | NCBI Gene: 5980 Ensembl: ENSG00000009413 | |
| Gene (Homo sapiens) | ATRX | GenBank | NCBI Gene: 546 Ensembl: ENSG00000085224 | |
| Cell line (Homo sapiens) | MDA-MB-231 | ATCC | HTB-26 | |
| Cell line (Homo sapiens) | MCF7 | ATCC | HTB-22 | |
| Cell line (Homo sapiens) | U-2 OS | ATCC | HTB-96 | |
| Cell line (Homo sapiens) | NCI-H520 | ATCC | HTB-182 | |
| Cell line (Homo sapiens) | Flp-In–293 Flp-In. T-REx.-293 Cell Line | Thermofisher | R78007 | Used to make stable over-expressing cells. |
| Cell line (Homo sapiens) | Flp-In–293 FLAG-RBMX | This study | Used to express tagged RBMX protein in human cells. Available from Elliott lab. | |
| Cell line (Homo sapiens) | Flp-In–293 FLAG-RBMXL2 | This study | Used to express tagged RBMXL2 protein in human cells. Available from Elliott lab. | |
| Cell line (Homo sapiens) | Flp-In–293 FLAG-RBMY | This study | Used to express tagged RBMY protein in human cells. Available from Elliott lab. | |
| Cell line (Homo sapiens) | Flp-In–293 FLAG- RBMXL2ΔRRM | This study | Used to express tagged RBMX protein without the RRM in human cells. Available from Elliott lab. | |
| Chemical compound | Tetracycline | Sigma-Aldrich | T7660 | |
| Recombinant DNA reagent | pOG44 (plasmid) | Thermofisher Scientific | Expresses Flp recombinase. | |
| Recombinant DNA reagent | FLAG-pcDNA5 (plasmid) | Thermofisher Scientific | Expression of constructs in the stable Cell lines was induced by treatment with 1 µg/ml tetracycline for 24 hr. | |
| Recombinant DNA reagent | pXJ41 (miniGene plasmid) | Bourgeois et al., 1999 | ||
| Sequence-based reagent | siRNAs | IDT | hs.Ri.RBMX.13.1, hs.Ri.RBMX.13.2 | |
| Antibody | anti-FLAG mouse monoclonal antibody | Sigma-Aldrich | Cat# F1804 RRID:AB_262044 | CLIP (5 μg), WB (1:2000) |
| Antibody | Normal mouse IgG (mouse antibody) | Santa Cruz Biotechnology | Cat# sc-2025 RRID:AB_737182 | CLIP: 5 μg |
| Antibody | Anti-RBMX (rabbit polyclonal antibody) | Cell Signalling Technology | Cat# D7C2V RRID:AB_2798614 | WB (1:1000) |
| Antibody | Anti-ETAA1 (rabbit polyclonal antibody) | Sigma-Aldrich | Cat# HPA035048 RRID:AB_10670300 | WB (1:1000) |
| Antibody | Anti-alpha tubulin (rabbit polyclonal antibody) | Abcam | Cat# ab18251 RRID:AB_2210057 | WB (1:2000) |
| Antibody | Anti-GAPDH (mouse monoclonal antibody) | Abcepta | Cat# P04406 | WB (1:2000) |
| Commercial assay or kit | RNeasy Plus Mini Kit | Qiagen | Cat#74134 | |
| Commercial assay or kit | Comet Assay Kit | Abcam | ab238544 | |
| Software, algorithm | Fastqc | https://anaconda.org/ | See: Andrews, 2010 | |
| Software, algorithm | STAR | https://anaconda.org/ | v.2.4.2 | See: Dobin et al., 2013 |
| Software, algorithm | Salmon | https://anaconda.org/ | v.0.9.1 | See: Patro et al., 2017 |
| Software, algorithm | Hisat2 | https://anaconda.org/ | v.2.2.1 | See: Kim et al., 2015 |
| Software, algorithm | Samtools | https://anaconda.org/ | v.1.14 | See: Li et al., 2009 |
| Software, algorithm | MAJIQ | https://anaconda.org/ | See Vaquero-Garcia et al., 2016 | |
| Software, algorithm | SUPPA2 | https://anaconda.org/ | See: Trincado et al., 2018 | |
| Software, algorithm | iCLIPlib | Github, https://github.com/sudlab/iCLIPlib, copy archived at Sudbery et al., 2022. | ||
| Software, algorithm | iMAPS | https://imaps.goodwright.com/ | ||
| Software, algorithm | R/RStudio | Cran | v.3.5.1 | |
| Software, algorithm | DESeq2 | https://bioconductor.org/ | v.1.16.1 | See: Love et al., 2014 |
| Software, algorithm | biomaRt | https://bioconductor.org/ | v.2.52.0 | See: Durinck et al., 2005 |
| Software, algorithm | clusterProfiler::enrichGO | https://bioconductor.org/ | v.4.4.4 | See: Yu et al., 2012 |
| Software, algorithm | Revigo | https://bioconductor.org/ | See: Supek et al., 2011 | |
| Software, algorithm | ggplot2 | https://bioconductor.org/ | v.3.3.6 | See: Wickham, 2016 |
| Software, algorithm | ChIPseeker | https://bioconductor.org/ | v.1.32.0 | See: Yu et al., 2015 |
| Software, algorithm | Pseudorank | https://bioconductor.org/ | v.1.0.1 | See: Happ et al., 2020 |
| Software, algorithm | Integrative Genomics Viewer | https://igv.org/ | See: Robinson et al., 2011 | |
| Software, algorithm | GraphPad Prism | https://www.graphpad.com | v.9.5.0 | |
| Software, algorithm | MedCalc | https://medcalc.org/ | 20.218 |
Additional files
Download links
A two-part list of links to download the article, or parts of the article, in various formats.
Downloads (link to download the article as PDF)
Open citations (links to open the citations from this article in various online reference manager services)
Cite this article (links to download the citations from this article in formats compatible with various reference manager tools)
An anciently diverged family of RNA binding proteins maintain correct splicing of a class of ultra-long exons through cryptic splice site repression
eLife 12:RP89705.
https://doi.org/10.7554/eLife.89705.3


