Fine-tuning spatial-temporal dynamics and surface receptor expression support plasma cell-intrinsic longevity
- Department of Pathology, Albert Einstein College of Medicine, United States
- Department of Genetics, Albert Einstein College of Medicine, United States
- Department of Microbiology and Immunology, Albert Einstein College of Medicine, United States
- Department of System and Computational Biology, Albert Einstein College of Medicine, United States
- Department of Applied Mathematics and Statistics, Stony Brook University, United States
Figures
Figure 1 with 1 supplement
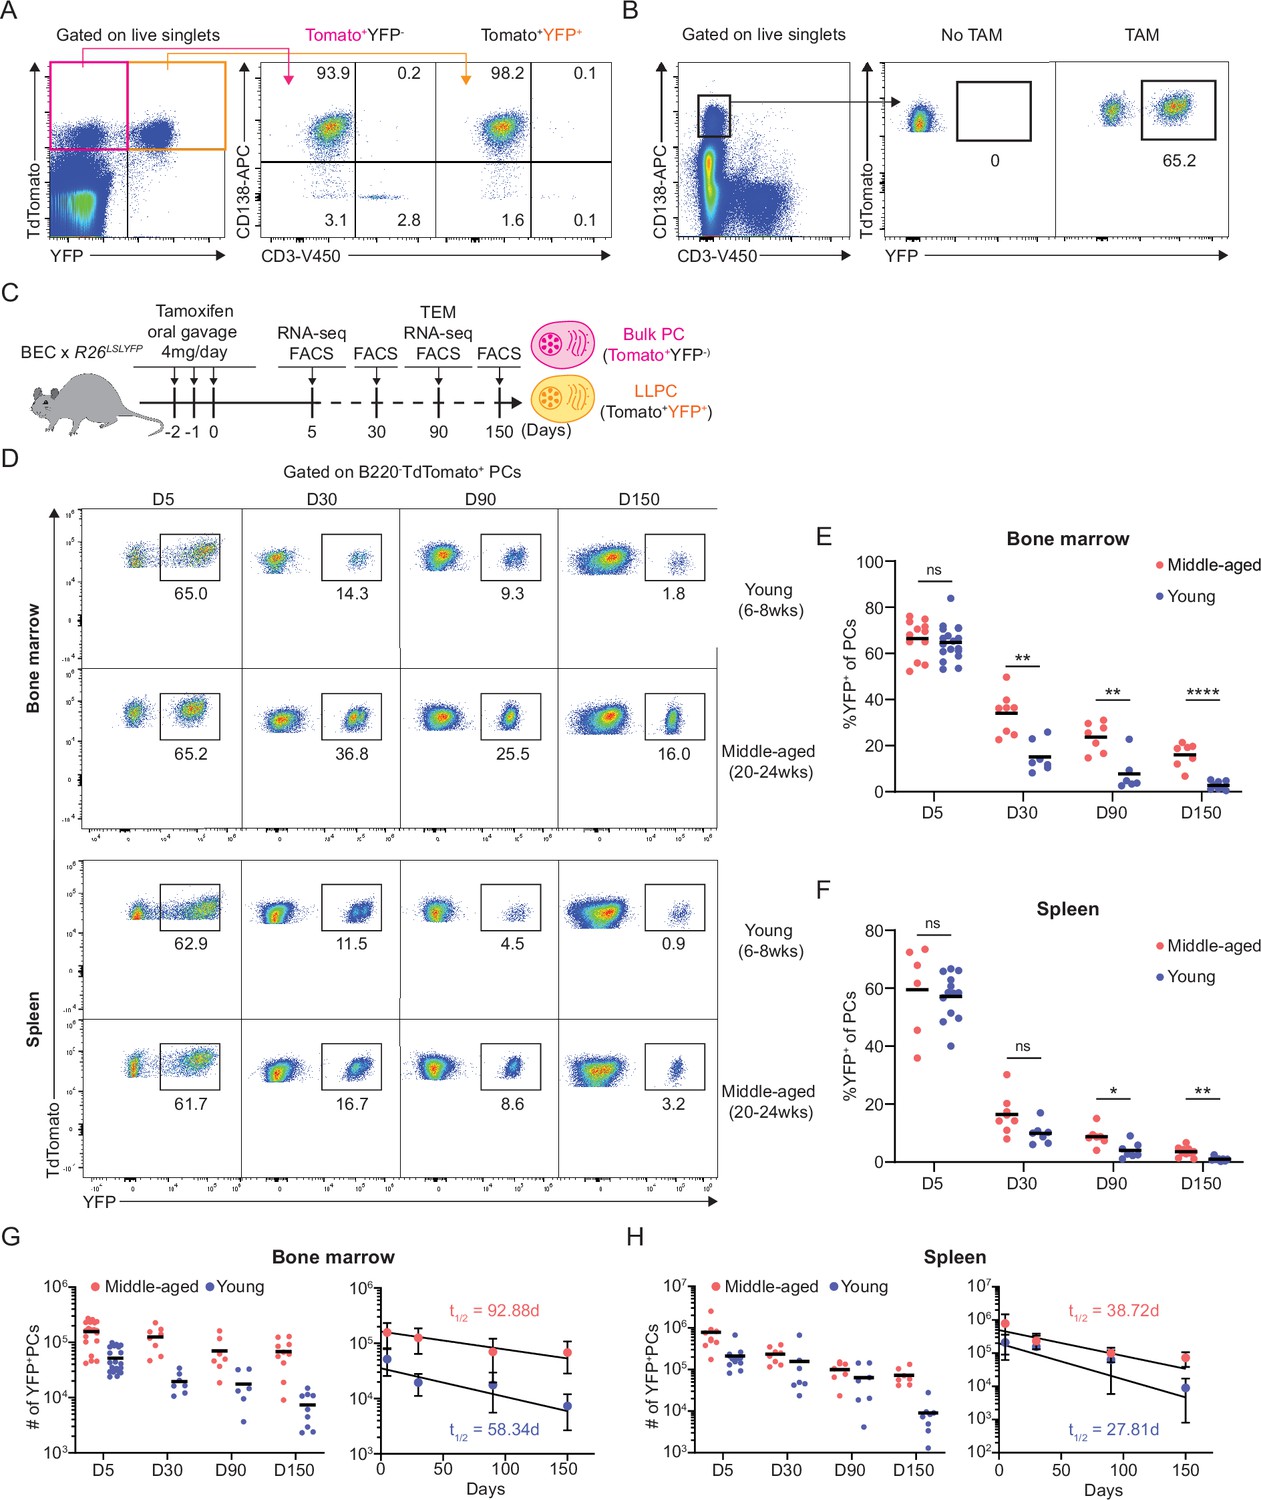
Plasma cell (PC) turnover rate decreases with mouse age.
(A) PC purity of TdTomato+YFP- and TdTomato+YFP+ cells in BEC-YFP mouse at day 5 post tamoxifen treatment. (B) Percentage of YFP+ PCs in BEC-YFP mouse in the absence of tamoxifen treatment or treated for 3 consecutive days and analyzed 5 days after the last treatment. (C) Experimental setup for measuring homeostatic PC turnover rate in young and middle-aged mice by timestamping at days 5, 30, 90, and 150 after oral gavage tamoxifen treatment, accompanied by transcriptional profiling using bulk RNA-seq at days 5 and 90 and morphological characterization using transmission electron microscopy at day 90. (D) FACS pseudo color plots showing decay kinetics of percentage of TdTomato+YFP+ in total B220-TdTomato+ PCs remaining in the bone marrow (BM) (upper panel) and spleen (lower panel) in young and middle-aged mice, quantified in (E) for BM and (F) for spleen. (G, H) Absolute numbers (left panel) and half-lives (t1/2) (right panel) of TdTomato+YFP+ PCs in the BM (H) and spleen (I) in young and middle-aged mice. Curve fitting and t1/2 calculations were conducted by using absolute numbers fitted in a one-phase decay model. All bars show mean (E–H) or mean ± SD (G, H). *, p<0.05; **, p<0.01; ****, p<0.0001; ns, non-significant by unpaired Student’s t test. All graphs show pooled data from at least two independent experiments (E, n=6–18; F, n=7–13; G, n=6–21; H, n=7–13). BEC, Blimp1-ERT2-Cre-TdTomato.
Figure 1—figure supplement 1
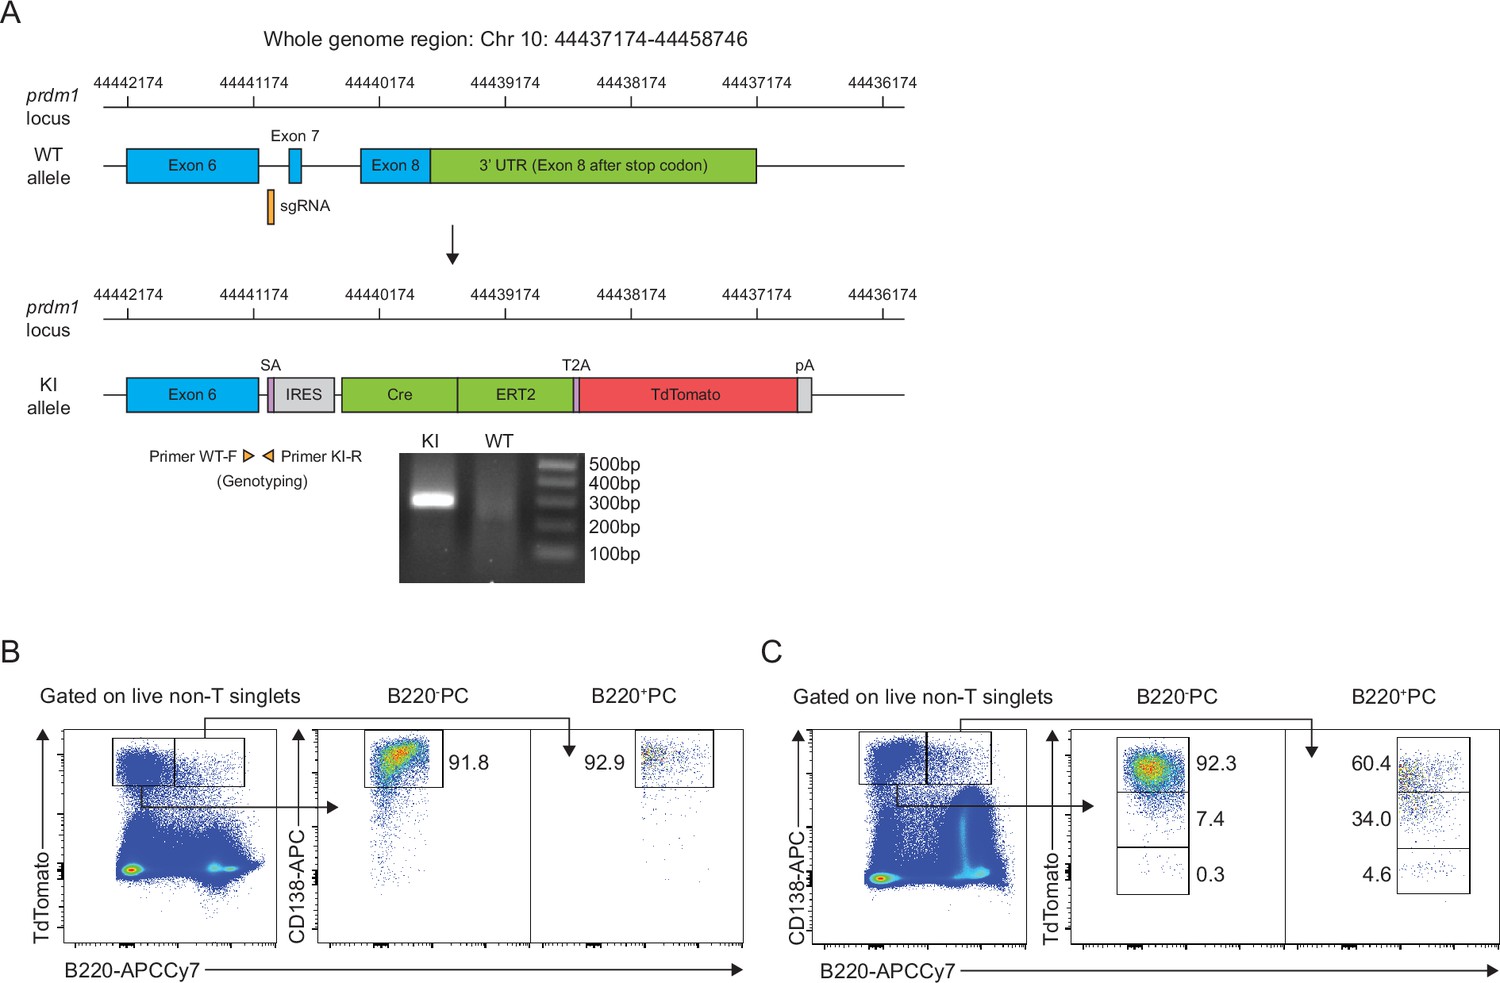
Development of Blimp1-ERT2-Cre-TdTomato (BEC) mice and validation of the fidelity of fluorescent reporter.
(A) Schematic of the CRISPR-Cas9 knock-in strategy to create the BEC allele, with approximate positions of and single guide RNA and genotyping primers shown. Examples of 2% agarose gel electrophoresis showing the PCR product at 277 bp in size using the genotyping primers amplified in the mutant allele compared to that in the wildtype allele. (B) Flow cytometry gating of ASCs using Tomato and B220 expression illustrating the specificity of fluorescent TdTomato reporter under the endogenous prdm1 promoter. (C) Flow cytometry ASC gating using CD138 and B220 reveals that most ASCs are Tomato positive.
-
Figure 1—figure supplement 1—source data 1
Agarose Gel of PCR product from genomic tail DNA for genotyping mice expressing the BEC allele.
- https://cdn.elifesciences.org/articles/89712/elife-89712-fig1-figsupp1-data1-v1.tiff
Figure 2 with 1 supplement
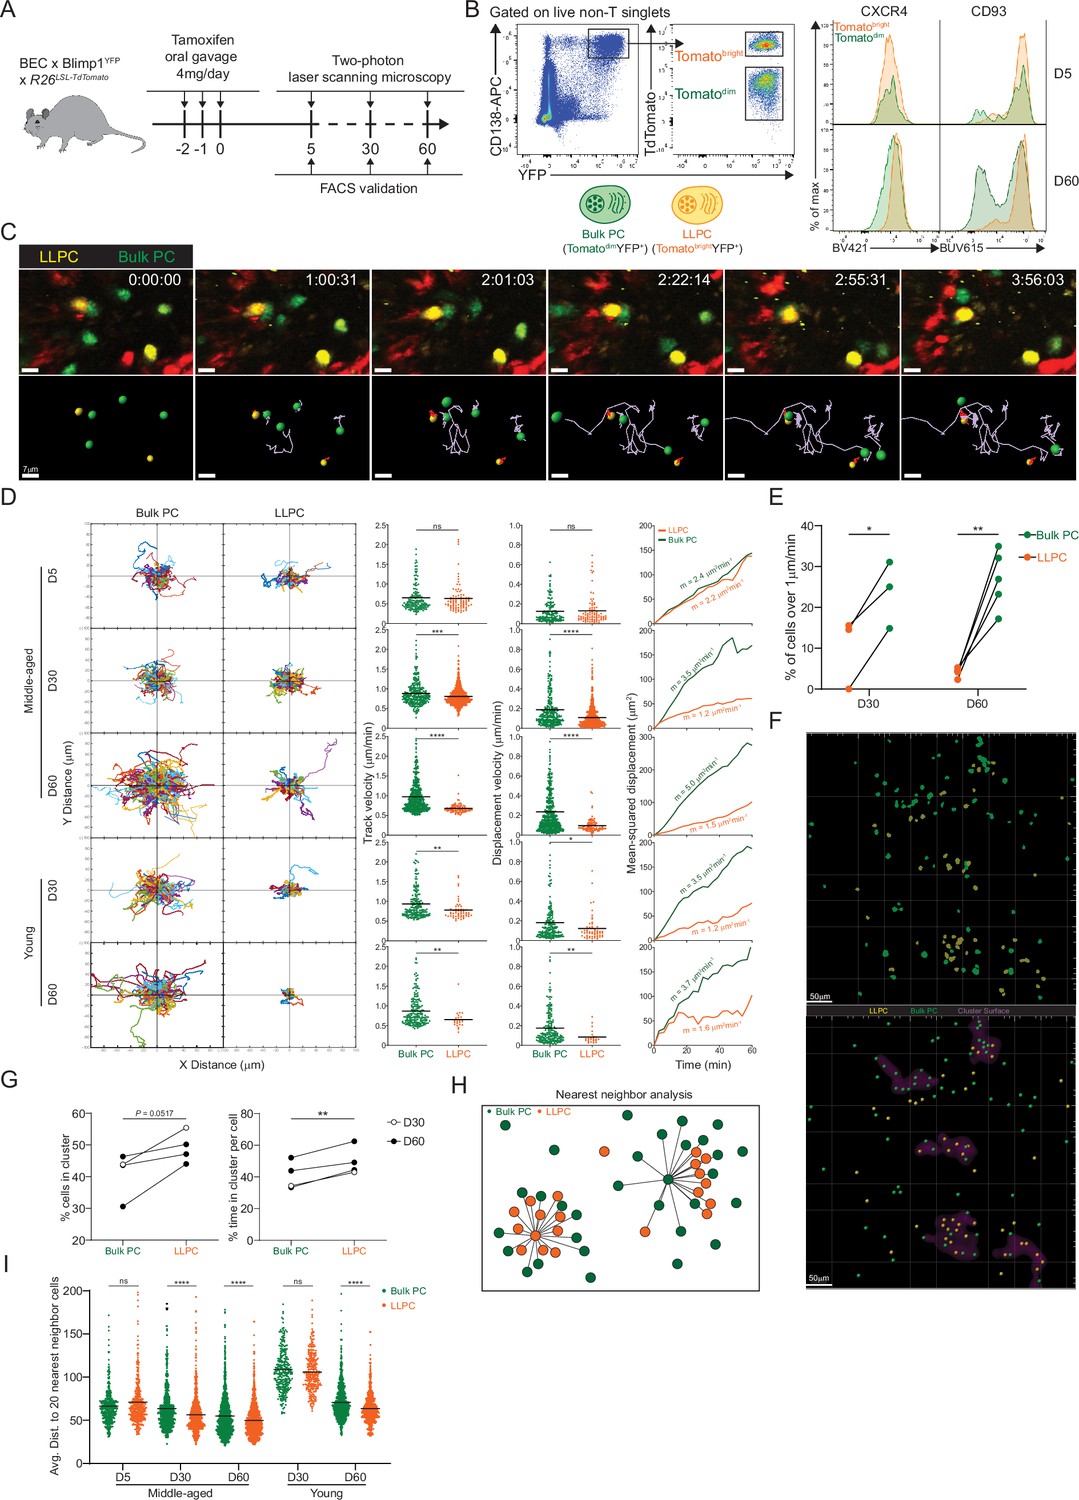
Bone marrow (BM) long-lived plasma cells (LLPCs) display cell-intrinsic arrest and clustering.
(A) Experimental setup for intratibial two-photon intravital imaging of both TdTomatodimYFP+ bulk plasma cells (PCs) and TdTomatobrightYFP+ LLPCs in the same young or middle-aged mouse by timestamping at days 5, 30, and 60 after oral gavage tamoxifen treatment. (B) FACS gating strategy (left panel) for TdTomatodimYFP+ bulk PCs and TdTomatobrightYFP+ LLPCs after intravital imaging and surface CXCR4 and CD93 expression (right panel) on TdTomatodimYFP+ bulk PCs compared to TdTomatobrightYFP+ LLPCs at day 5 (control timepoint) and day 60 post tamoxifen treatment. (C) Time-lapse images highlighting the cell migration trajectories of four bulk PCs (green spot with light purple tracks) and two LLPCs (yellow spots with red tracks) in a small region of BM parenchyma. Scale bars, 7 μm. (D) Individual cell tracks of total bulk PCs or LLPCs plotted at a common origin (left panel) in young and middle-aged mice at days 5, 30, and 60 post tamoxifen treatment. Comparison of total bulk PCs and LLPCs track velocity (middle left panel), track displacement velocity (middle right panel), and mean-squared displacement (right panel) in young and middle-aged mice at days 5, 30, and 60 post tamoxifen treatment. (E) Fractions of fast-moving cells (track velocity >1 μm/min) in bulk PCs compared to LLPCs at days 30 and 60 post tamoxifen treatment. Data were pooled from young and middle-aged mice for each timepoint. (F) Representative intravital 3D flattened image of masked intensity channels of bulk PCs (green) and LLPCs (yellow) (upper panel) and PC spots (bulk PCs in green and LLPCs in yellow) and cluster surfaces (purple) (lower panel) identified for analysis in (G). Scale bars, 50 μm. (G) Average percentage of bulk PCs compared to LLPCs staying inside cluster surface over time (left panel). Average time of individual bulk PCs spent inside cluster surface compared to that of LLPCs (right panel). (H) Depiction of nearest neighbor analysis for cell-cell distance (lines) in 3D (collapsed in 2D) between bulk PCs (green) and total PCs (green and orange), or between LLPCs (orange) and total PCs (green and orange), which is quantified in (I) for an average distance between bulk PCs or LLPCs and their 20 nearest neighbor cells (total PCs combining bulk PCs and LLPCs). Each symbol represents one randomly picked cell per subset, and data were pooled from at least two mice. All bars show mean (D, I). *, p<0.05; **, p<0.01; ***, p<0.001; ****, p<0.0001; exact p-values; ns, non-significant by Mann-Whitney U test (D), Kruskal-Wallis test with Dunn’s test for multiple comparisons (I), or paired Student’s t test (E, G). All graphs show pooled data from at least two independent experiments (E, n=3–5; G, n=4).
Figure 2—video 1
Maturation-dependent long-lived plasma cell (LLPC) motility by two-photon intravital imaging in the bone marrow.
Left side, intravital two-photon 3D time-lapse of plasma cells (PCs) in the tibia, of Blimp1-YFP Blimp1-ERT2-Cre-TdTomato (BEC) Rosa26LSL-TdTomato mice, on day 60 post TAM. YFP+ bulk PCs (green), Tomatobright YFP+ LLPCs (yellow). In red are non-specific TdTomato expression from the Rosa26 promoter. Right side, raw movie processed and analysis of bulk PCs (green) and LLPCs (yellow) cell tracks. Scale bar, 50 μm.
Figure 3 with 2 supplements
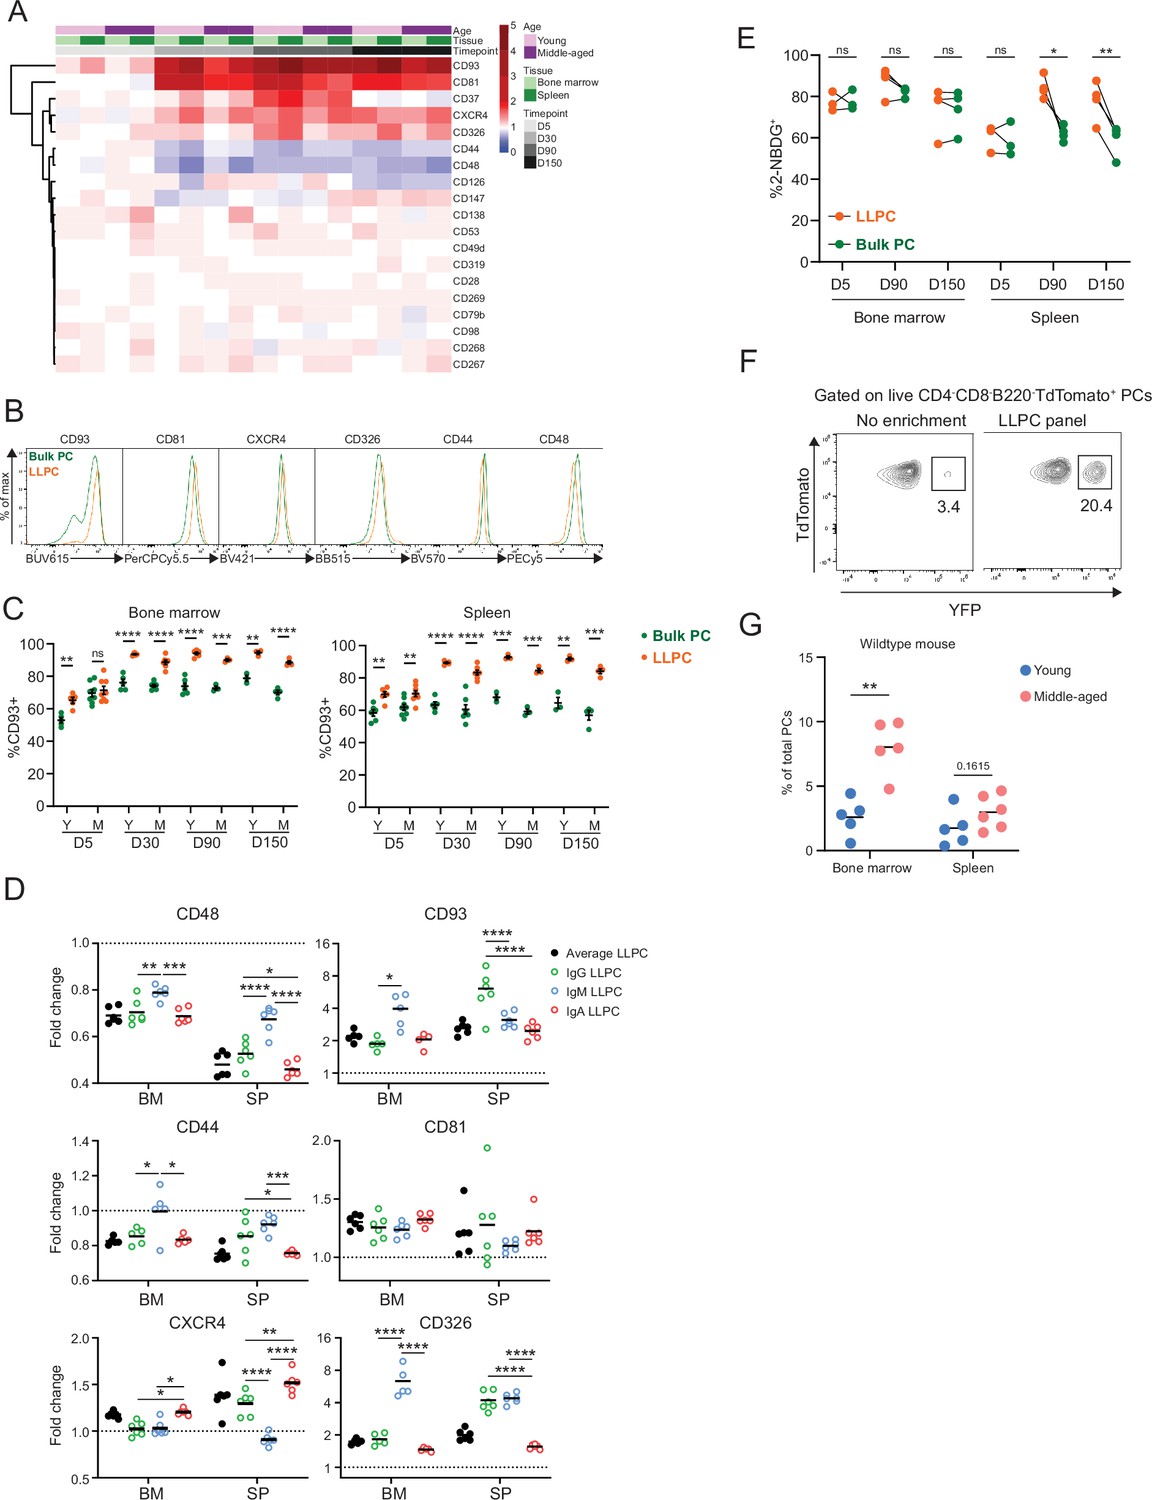
Differentially expressed surface receptors accompany long-lived plasma cell (LLPC) maturation.
(A) Heatmap depicting average fold changes of surface marker expression level (gMFI) on TdTomato+YFP+ LLPCs and TdTomato+YFP- bulk plasma cells (PCs) from three to four mice per unit at indicated timepoints post tamoxifen treatment in the bone marrow and spleen of young and middle-aged mice. Color scale showing fold increase in red, fold decrease in blue, or no difference in white. (B) Overlay histograms comparing the expression level of differentially expressed surface markers on TdTomato+YFP- bulk PCs to TdTomato+YFP+ LLPCs at day 90 post tamoxifen treatment. (C) Percentage of CD93+ cells on TdTomato+YFP+ LLPCs relative to TdTomato+YFP- bulk PCs in individual mouse at indicated timepoints post tamoxifen treatment in the bone marrow (left panel) and spleen (right panel) of young and middle-aged mice. (D) The fold change of the expression level (gMFI) of differentially expressed surface markers of isotype-specific or total TdTomato+YFP+ LLPCs relative to matching isotype TdTomato+YFP- bulk PCs in individual mouse at day 90 post tamoxifen treatment in young BEC-YFP mice. (E) Analysis of 2NBDG+ population within LLPC and bulk PC subsets at indicated timepoints. (F) Percentage of TdTomato+YFP+ LLPCs pre and post enrichment using a combination of six antibody panel of differentially expressed surface markers identified in (B). No enrichment represents the percentage of TdTomato+YFP+ LLPCs at day 90 post tamoxifen in young mice. (G) Percentage of quasi-LLPCs in total PCs identified using six-marker antibody panel in young and middle-aged mice at steady state. All bars show mean ± SEM (C–E). *, p<0.05; **, p<0.01; ***, p<0.001; ****, p<0.0001; ns, non-significant by unpaired Student’s t test. All graphs show pooled data from at least two independent experiments (A, C–E, n=3–7; G, n=5–6 mice). BEC, Blimp1-ERT2-Cre-TdTomato.
Figure 3—figure supplement 1
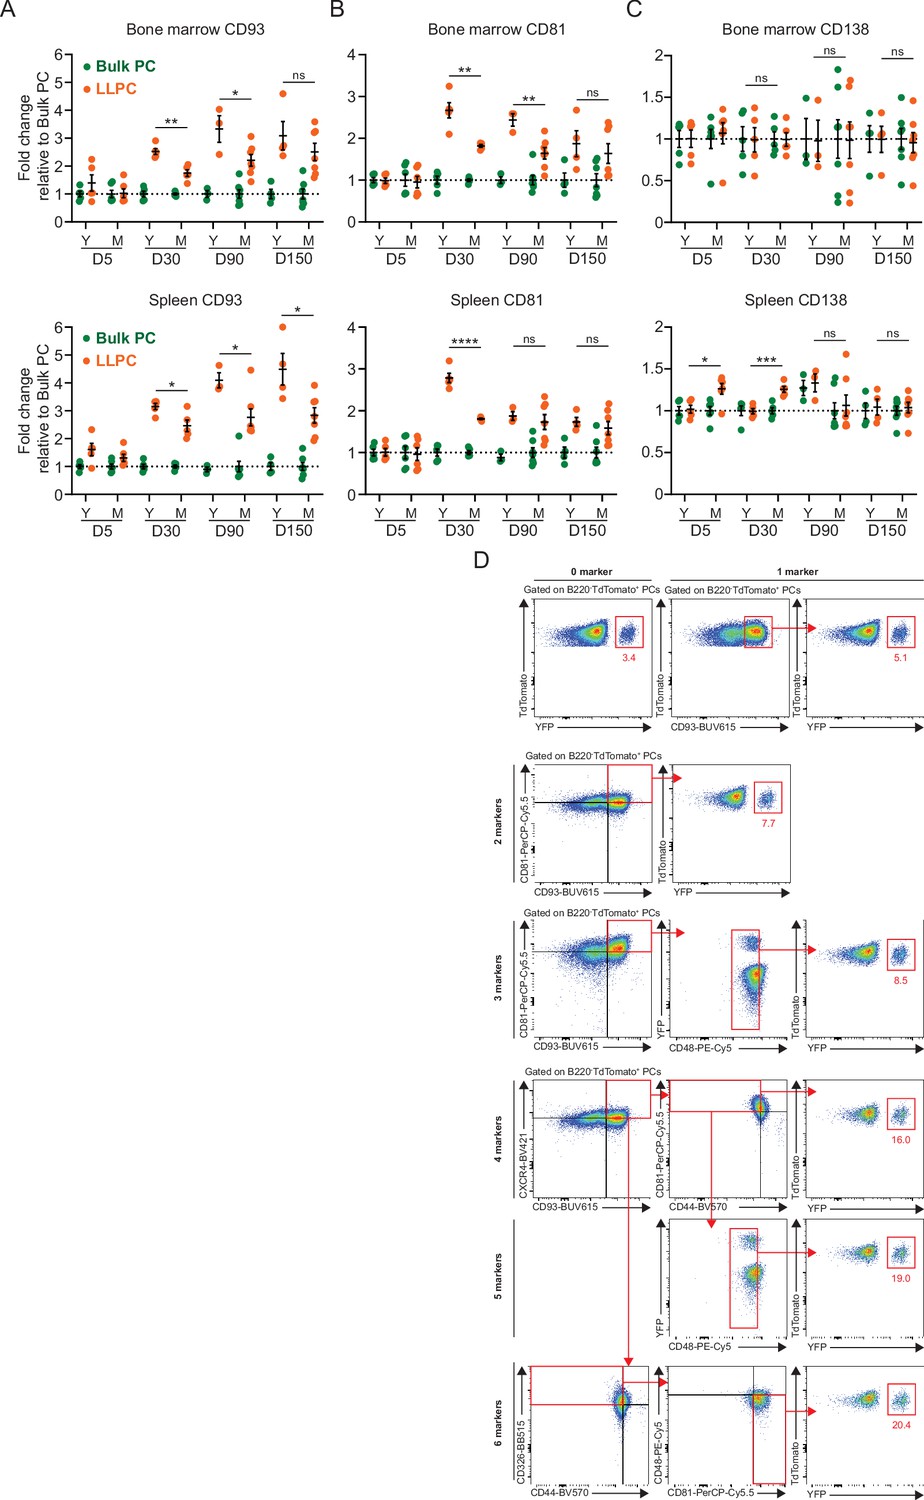
Long-lived plasma cell (LLPC) enrichment by a multiplexed antibody panel.
(A–C) The fold change of the expression level (gMFI) of surface markers (CD93 (A), CD81 (B), CD138 (C)) on TdTomato+YFP+ LLPCs relative to TdTomato+YFP bulk plasma cells (PCs) in individual mouse at indicated timepoints post tamoxifen treatment in the bone marrow (upper panel) and spleen (lower panel) of young and middle-aged mice. (D) FACS gating strategy for LLPC enrichment using a combination of one to six markers (one example per each number of markers used) in the bone marrow of BEC-YFP mouse at day 90 post tamoxifen treatment. Numbers represent the percentage of YFP+ PCs in total PCs. All bars show mean ± SEM (A–C). *, p<0.05; **, p<0.01; ***, p<0.001; ****, p<0.0001; ns, non-significant by unpaired Student’s t test. All graphs show pooled data from at least two independent experiments (A–C, n=3–7). BEC, Blimp1-ERT2-Cre-TdTomato.
Figure 3—figure supplement 2
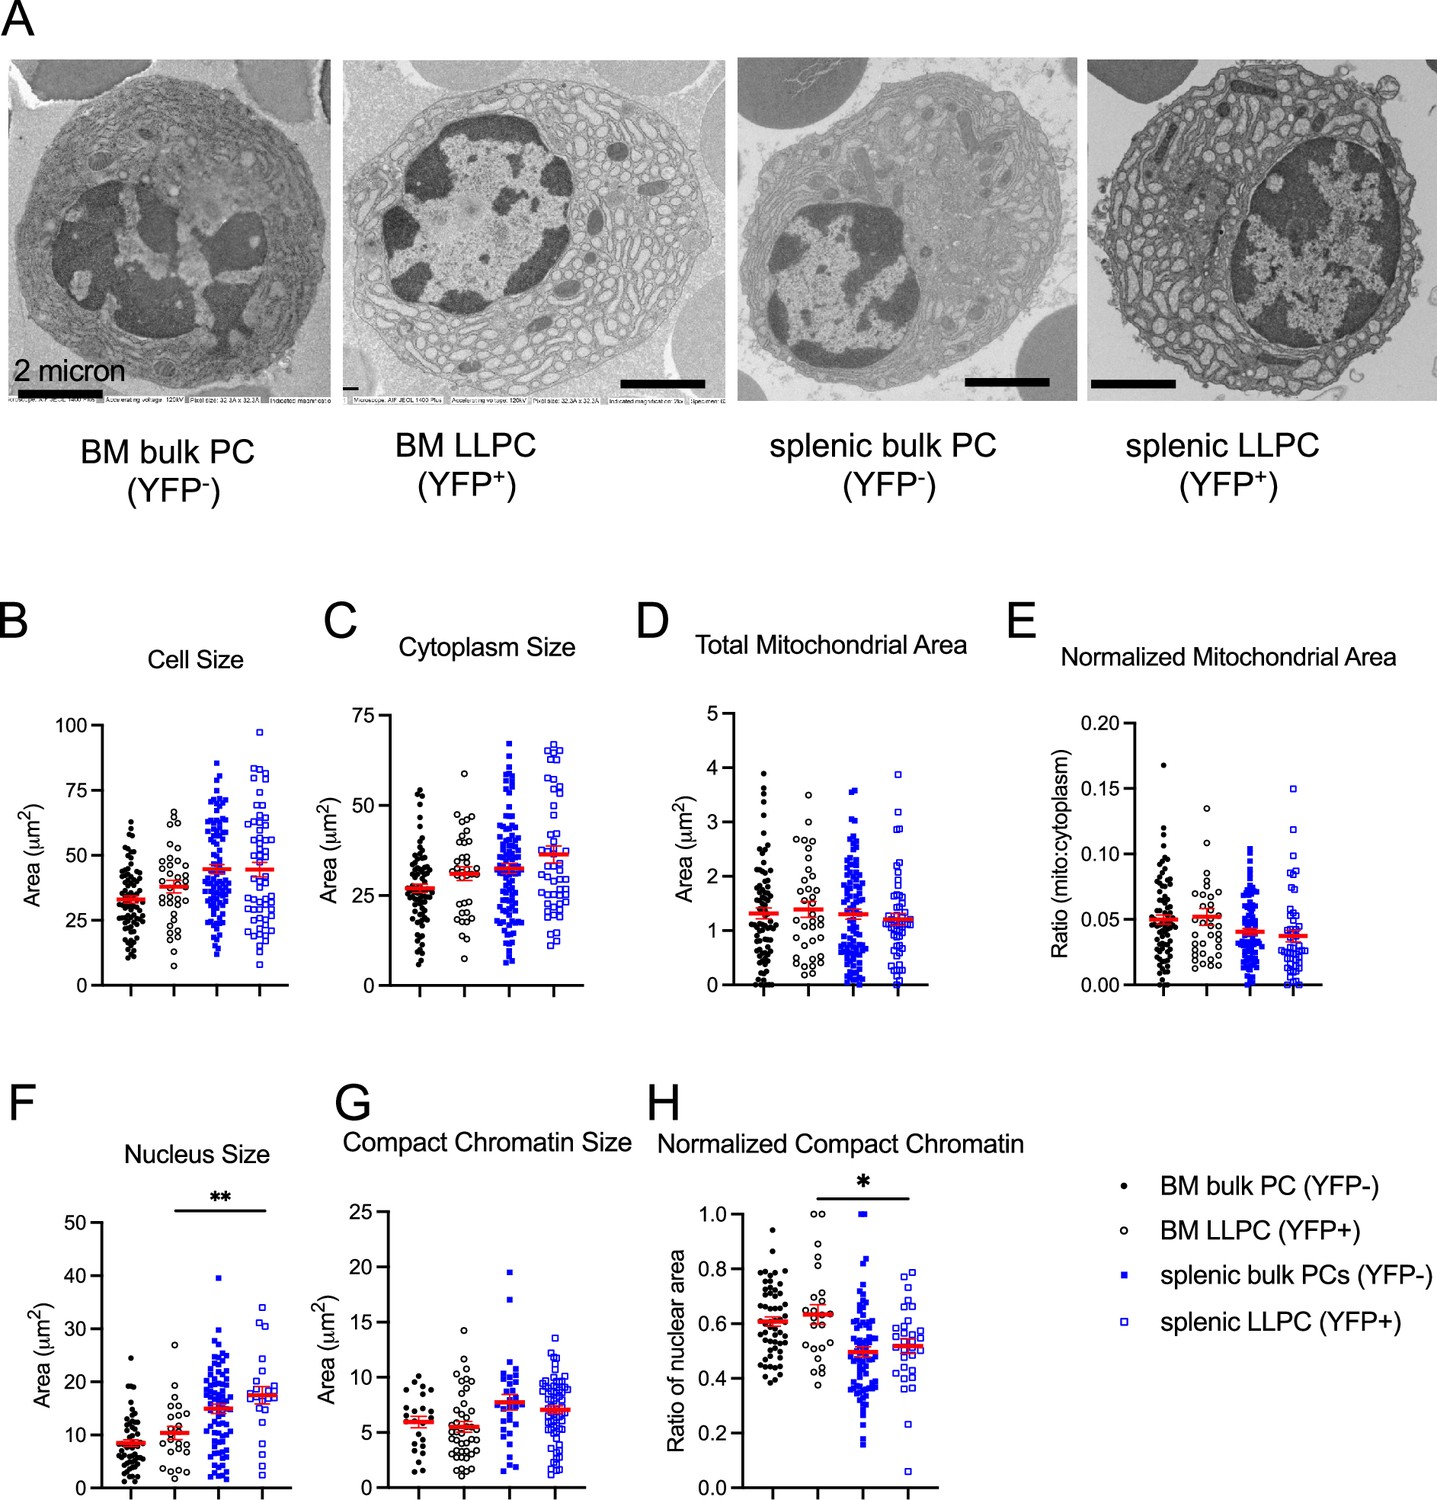
Transmission electron microscopy of long-lived plasma cells (LLPCs).
(A) Examples of transmission electron microscopy images in LLPCs and bulk plasma cells (PCs) at day 90 post tamoxifen treatment. Scale bars, 2 μm. (B–H) Quantification of cell size (B), cytoplasm size (C), total mitochondrial area (D), normalized mitochondrial area (E), nucleus size (F), compact chromatin size (G), and normalized compact chromatin (H) in LLPCs and bulk PCs in the bone marrow and spleen. All bars show mean ± SEM. *, p<0.05; **, p<0.01 by unpaired unpaired Student’s t test. All data are pooled data from two to three independent experiments (B, n=36–93; C, n=36–99; D–E, n=36–91; F, n=23–77; G, n=24–69; H, n=24–75).
Figure 4 with 1 supplement
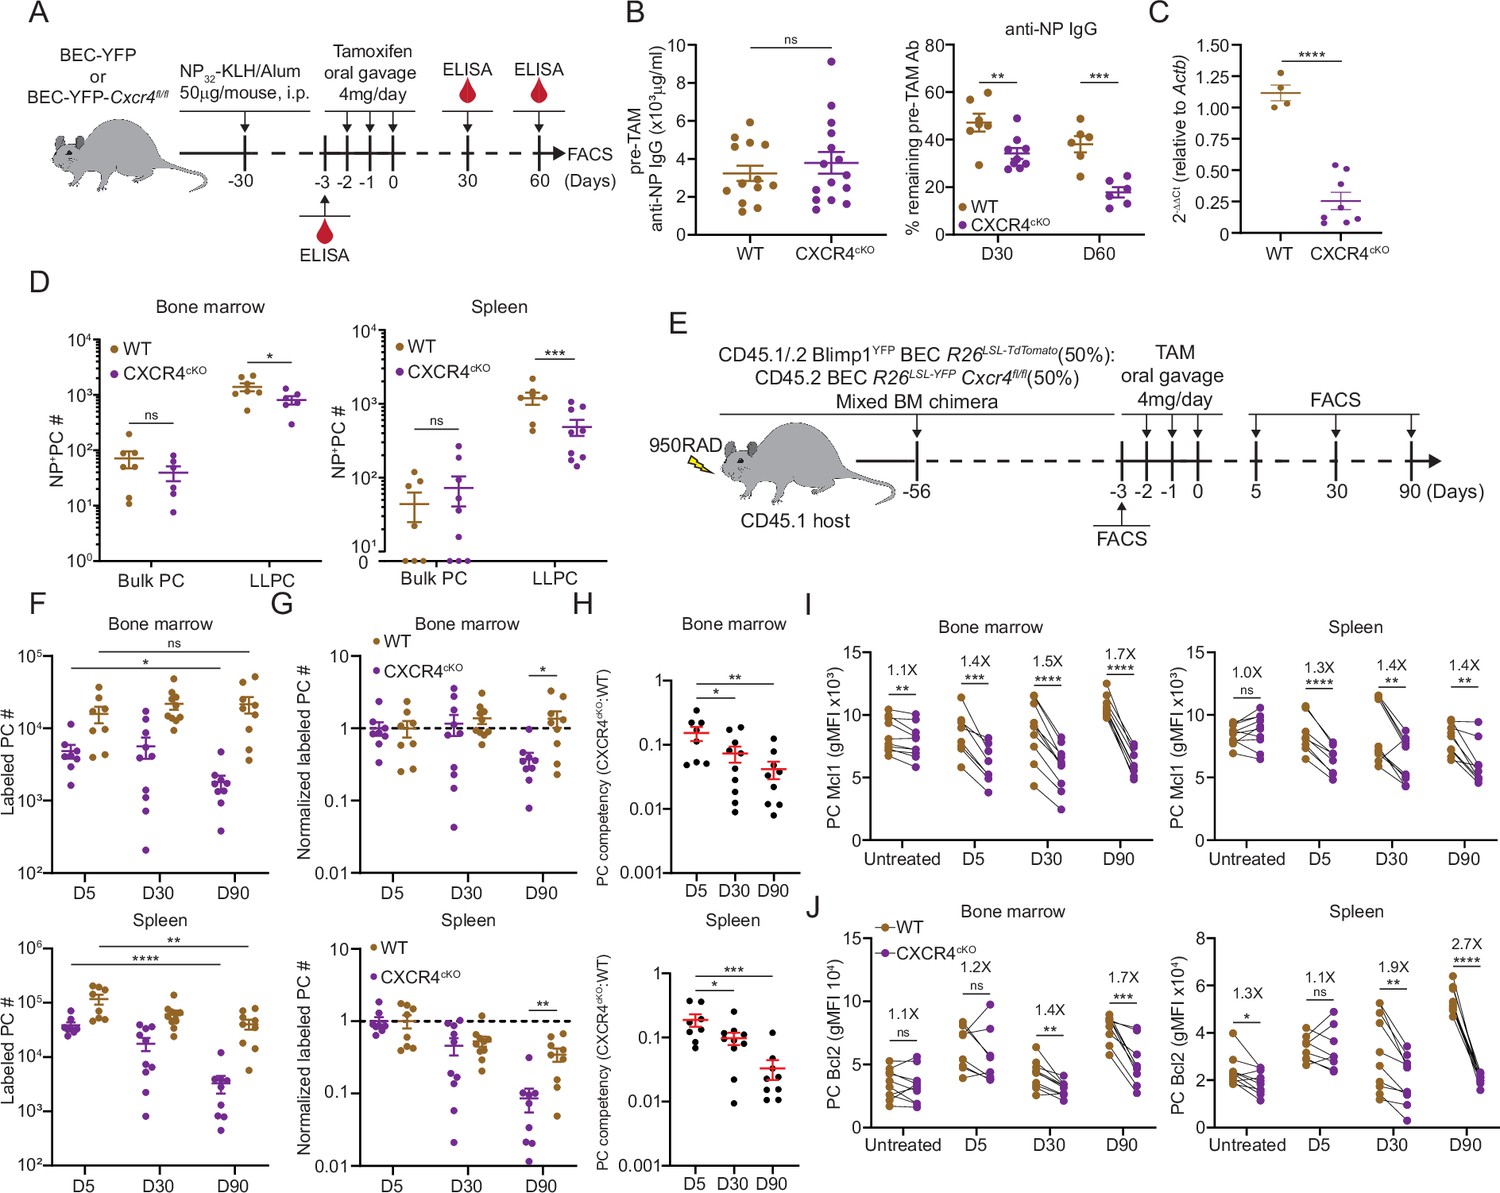
CXCR4 controls durable humoral response by promoting plasma cell (PC) survival.
(A) Experimental setup for examining the role of CXCR4 in sustaining antigen-specific antibody responses using an NP-KLH/alum immunization model. i.p., intraperitoneal. (B) Anti-NP antibody titer in wildtype (WT) or CXCR4cKO mice before tamoxifen treatment at day 30 post immunization (left panel) and the remaining percentage of pretreat anti-NP antibody at indicated timepoints post tamoxifen treatment (right panel). (C) Fold change of FACS-purified YFP+ PCs Cxcr4 mRNA level in WT or CXCR4cKO mice, normalized to Actb levels in WT mice. (D) Absolute numbers of NP-specific bulk PCs and long-lived plasma cells (LLPCs) in the bone marrow (BM) (left panel) and spleen (right panel) of WT and CXCR4cKO mice. (E) Experimental setup for generating mixed BM chimera reconstituted with WT and CXCR4cKO donors. (F) Absolute number of (YFP+) labeled BM and spleen PCs at indicated timepoints post tamoxifen treatment (G) normalized labeled PC numbers shown in (F) (relative to day 5 post tamoxifen treatment). (H) PC competitive competency (right panel) at indicated timepoints determined by normalizing the CXCR4cKO:WT ratio in the BM labeled PC compartment to that of total splenic B cell compartment (upper panels) or the CXCR4cKO:WT ratio in the splenic labeled PC compartment to that of total splenic B cell compartment (lower panels). (I, J) Mcl1 (I) and Bcl2 (J) intracytoplasmic expression (by gMFI) of WT or CXCR4cKO labeled PC compartment at indicated timepoints in the BM (left panel) and spleen (right panel). Fold changes of WT over CXCR4cKO labeled PCs in Mcl1 and Bcl2 expression level are indicated above the statistical significance symbol. All bars show mean ± SEM. Each symbol in all plots represents one mouse. *, p<0.05; **, p<0.01; ***, p<0.001; ****, p<0.0001; ns, non-significant by unpaired Student’s t test (B, C, D, F–G, L, and M), paired Student’s t test (I, J) or one-way ANOVA with multiple comparison correction using the Holm-Šídák test (H). All graphs show pooled data from two independent experiments (B, n=13–15 (left), n=6–9 (right); C, n=4–8; D, n=6–9; F–H, n=8–10; I, n=8–10; J, n=8–10).
Figure 4—figure supplement 1
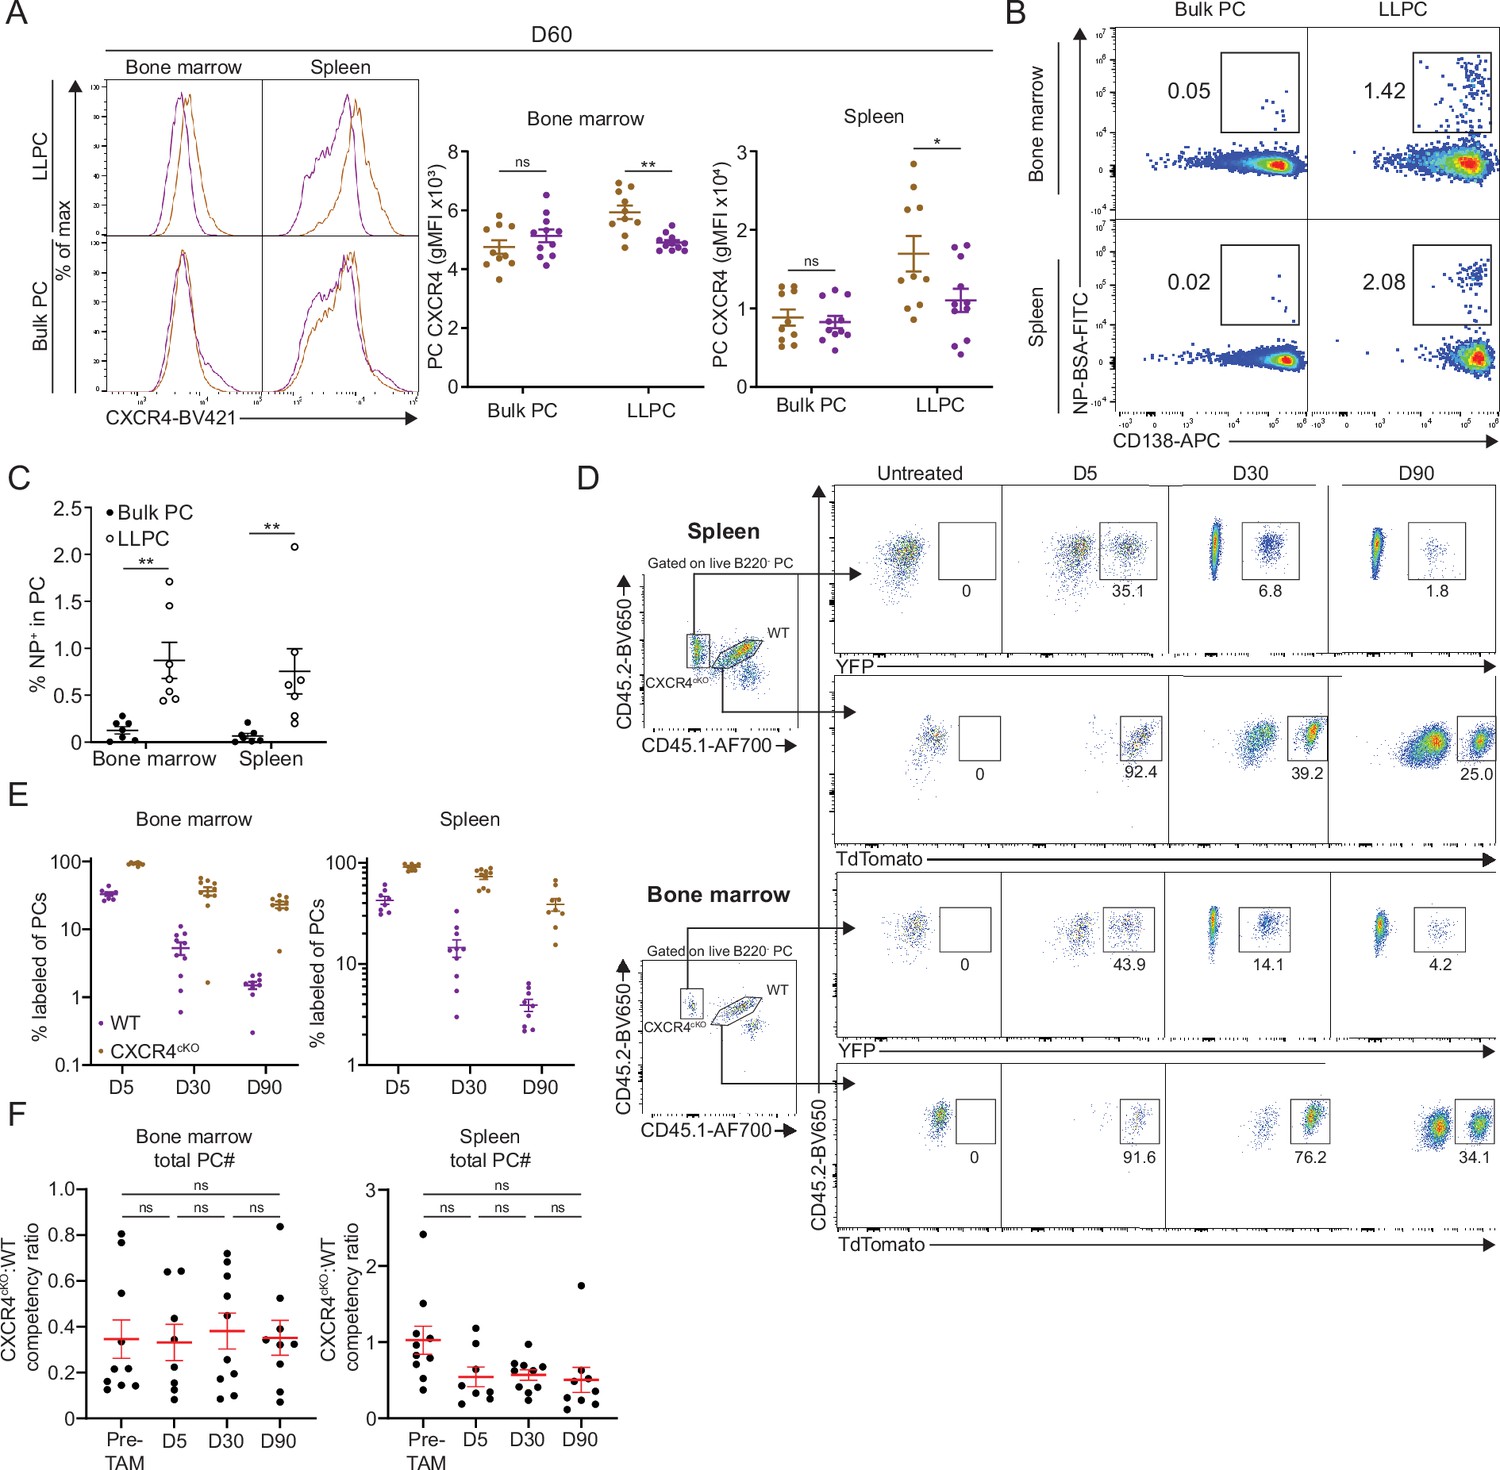
CXCR4 controls durable humoral response by promoting plasma cell (PC) survival and retention in the bone marrow (BM).
(A) Overlayed histograms (left panel) of the distribution of CXCR4 expression level in bulk PCs and long-lived plasma cells (LLPCs) in the BM and spleen at day 60 post tamoxifen treatment, which is quantified on the right panel. (B) FACS pseudo color plot showing the percentage of NP-specific PCs in LLPCs or bulk PCs in the BM and spleen, which is quantified in (C). (D) FACS plot showing the gating strategy for each PC compartment and the percentage of labeled PCs at indicated timepoints post tamoxifen treatment in the spleen (upper panel) and BM (lower panel), which is quantified in (E). (F) PC competitive competency at indicated timepoints determined by normalizing the CXCR4cKO:WT ratio in the BM total PC compartment to that of total splenic B cell compartment (left panel) or the CXCR4cKO:WT ratio in the spleen total PC compartment to that of total splenic B cell compartment (right panel). All bars show mean ± SEM. *, p<0.05; **, p<0.01; ns, non-significant by unpaired Student’s t test (A, C) or one-way ANOVA with multiple comparison correction using the Holm-Šídák test (F). Each symbol in all plots represents one mouse. All data are pooled data from two independent experiments (A, n=10–11; C, n=7; E, F, n=8–10).
Figure 5
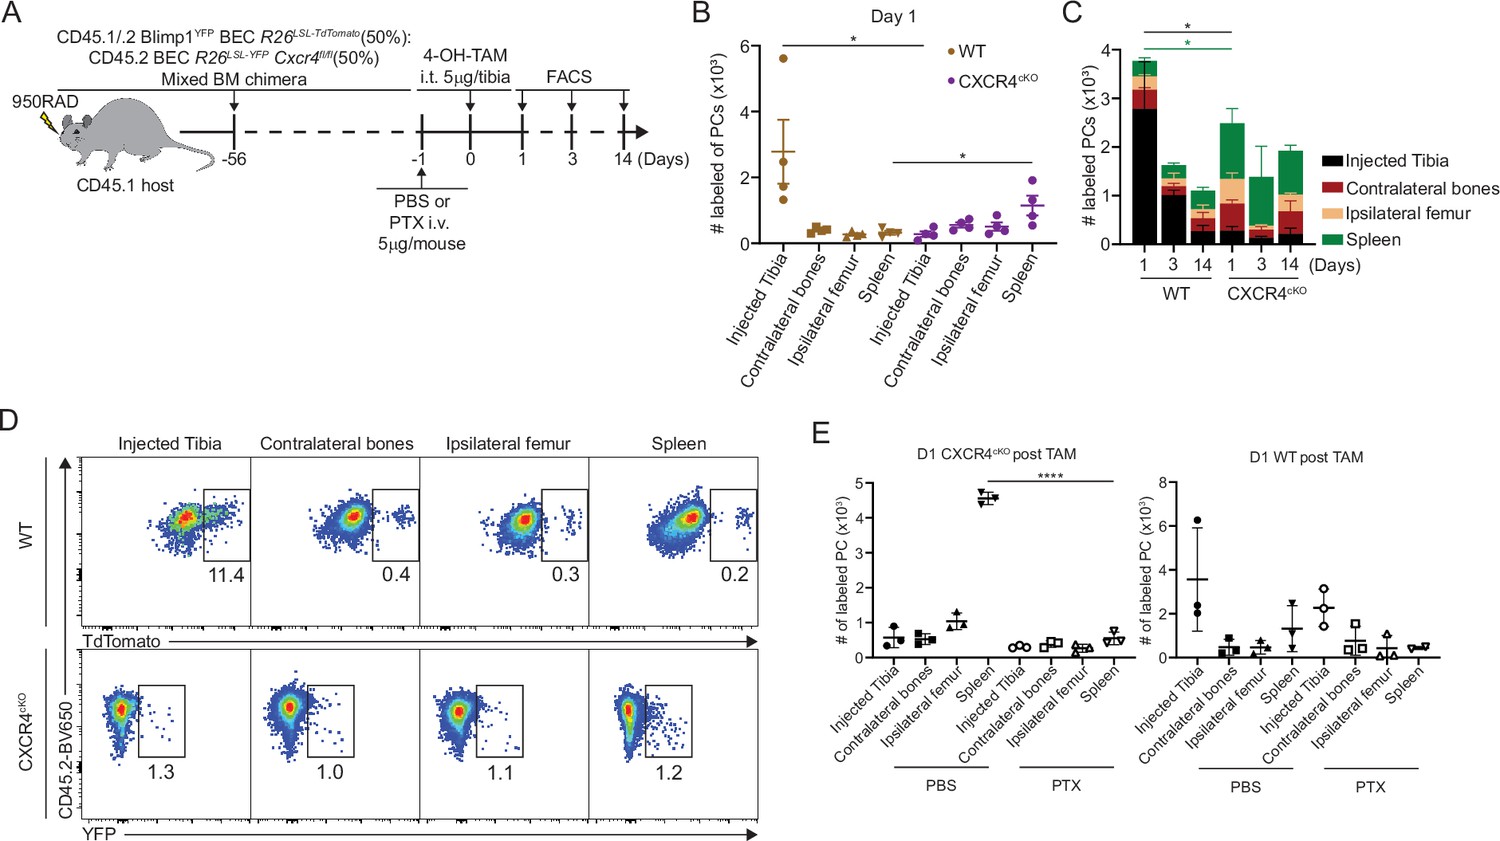
CXCR4 retains plasma cells (PCs) in the bone marrow (BM).
(A) Experimental setup for intratibial injection into WT:CXCR4cKO mixed BM chimera in the presence or absence of pertussis toxin (PTX) treatment. (B) Absolute number of labeled WT or CXCR4cKO PC in injected tibia and distal organs/tissues at day 1 post 4-hydroxy-tamoxifen (4-OH-TAM) injection. (C) Distribution of absolute numbers of labeled WT or CXCR4cKO PCs in injected tibia and distal organs/tissues. (D) FACS pseudo color plot showing the percentage of labeled PCs in injected tibia and other distal organs/tissues at day 1 post intratibial injection. (E) Absolute number of labeled CXCR4cKO (left panel) or WT (right panel) PCs in injected tibia and distal organs/tissues at day 1 post 4-OH-TAM injection in the presence or absence of PTX. All bars show mean ± SEM. Each symbol in all plots represents one mouse. *, p<0.05; ****, p<0.0001; ns, non-significant by unpaired Student’s t test (E), paired Student’s t test (B), or one-way ANOVA with multiple comparison correction using the Holm-Šídák test (E). All graphs show pooled data from two independent experiments (B, n=4; E, n=3).
Figure 6
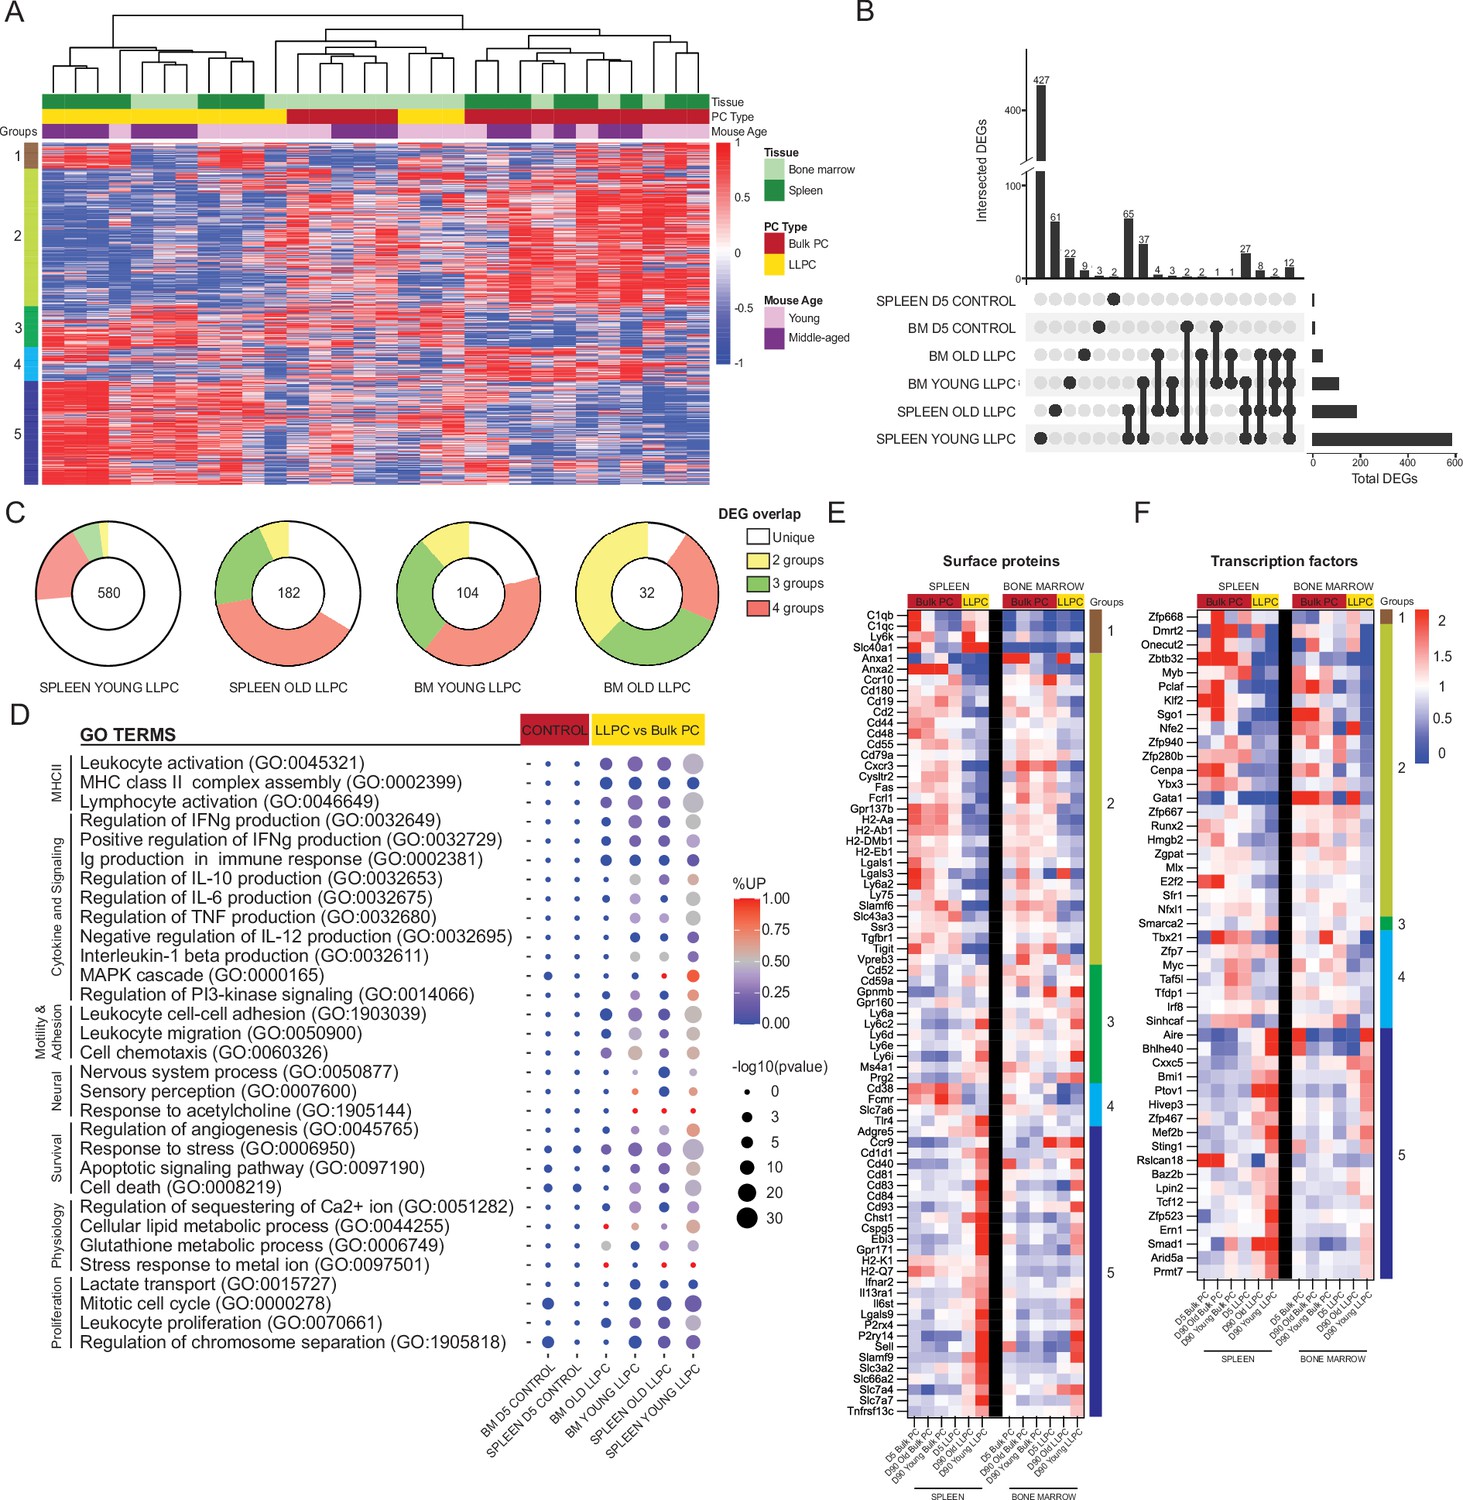
Shared transcriptional program accompanies bone marrow (BM) and splenic long-lived plasma cell (LLPC) specification.
(A) Heatmap depicting unsupervised clustering of total differentially expressed genes (DEGs, padj-value<0.05) between TdTomato+YFP- bulk plasma cells (PCs) to TdTomato+YFP+ LLPCs across tissue types (bone marrow and spleen) and mouse ages (young and middle-aged) at day 90 post tamoxifen treatment, with no cut-off for fold change and transcripts per million reads (TPM). Color scale represents z-score for normalization per gene (row). Total DEGs were separated in five color-coded clusters. (B) UpSet plot visualizing total number of DEGs in each pair-wise comparison (single node) and intersections (connecting nodes) between DEGs among different pair-wise comparisons. (C) Pie charts showing the fractions of the DEGs that are unique in one pair-wise comparison group or shared by two to four groups of pair-wise comparisons. Numbers in the center of each chart represent the total number of DEGs in each indicated pair-wise comparison group. (D) Bubble plots showing selected gene ontology terms (GO terms) enrichment comparing LLPCs groups (highlighted in yellow) and day 5 control groups bulk PCs (highlighted in red) based on previously identified DEGs in (A). Color scale bar showing the percentage of DEGs upregulated per GO term in each pair-wise comparison group (red, >50% upregulated DEGs; blue, <50% upregulated DEGs). Circle size represents the significance of the enrichment based on the -log10(p-value). (E, F) Heatmap of all DEGs encoding surface proteins (E) or transcription factors (F) between LLPC groups and bulk PC groups in both the spleen (left) and the bone marrow (right), which are further separated by gene clusters identified in (A).
-
Figure 6—source data 1
Excel spreadsheet listing differentially expressed genes (DEGs) and cluster heading shown in Figure 6A.
- https://cdn.elifesciences.org/articles/89712/elife-89712-fig6-data1-v1.xlsx
Figure 7 with 1 supplement
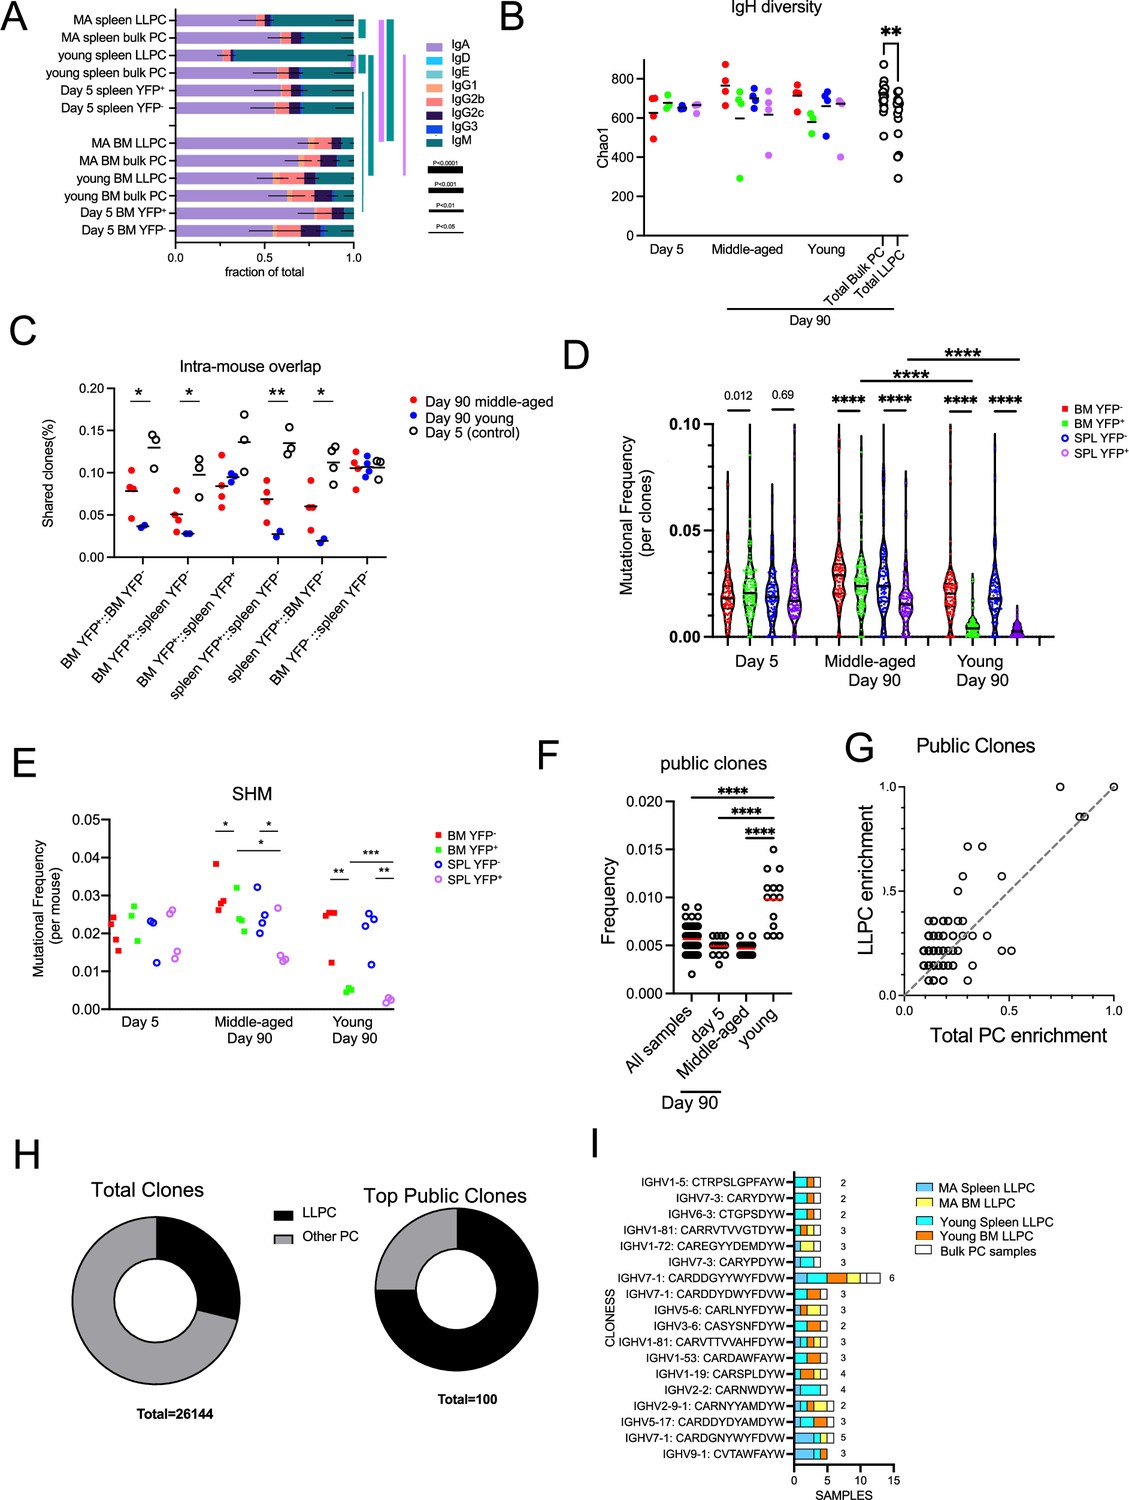
Long-lived plasma cell (LLPC) receptors have reduced BCR diversity but enriched in public clones.
(A) Stacked bar plots showing isotype gene usage (the fraction of isotypes in total mapped complete clones per group) in LLPCs and bulk plasma cells (PCs) at days 5 and 90 post tamoxifen treatment across tissue types (spleen and bone marrow [BM]) and mouse ages (young and middle-aged). Line thickness represents the statistical significance based on p-value thresholds. Line color represents the comparisons of color-coded isotypes between groups. (B) BCR repertoire diversity of LLPCs and bulk PCs at indicated timepoints across tissue types (spleen and BM) and mouse ages (young and middle-aged), estimated by Chao1 richness index for the abundance of unique clones in a repertoire per group. Each symbol represents one mouse, and pooled bulk PC samples comparing pooled LLPC samples at day 90 post tamoxifen treatment were shown on the right in black. (C) The percentage of clones shared by indicated PC subsets within the same mouse (intra-mouse). X axis format (A, B) reflects samples A and B used for comparison. (D) Violin plots comparing the distribution of somatic mutation frequencies per specific V region (across all clones) in YFP- bulk PCs and YFP+ LLPCs at indicated timepoints in young and middle-aged mice. Each symbol represents one clone, and multiple samples were pooled from each group. (E) Average mutation frequencies of all clones in (D) for each PC subset in indicated tissues in young and middle-aged mice. Each symbol represents one mouse. (F) The percentage of clones shared by all samples, day 5 samples, middle-aged mice samples, and young samples. Each symbol represents one sample (e.g. BM YFP+ sample, BM YFP- sample, etc.). (G) Frequency of top 100 most abundant public clones in all PC samples compared to that in LLPC samples. Clones showing no preference for LLPC samples over total samples are distributed on the diagonal line in the plot. Each symbol represents a clone. (H) Pie charts showing the fraction of total clones or top 100 most abundant public clones in LLPCs compared to other PCs. (I) Stacked bar plots showing the distribution of sample types (in tissues and age of mice) per most frequent public clone in LLPCs. Number on the right of each stacked bar represents the number of mice. *, p<0.05; **, p<0.01; ***, p<0.001; ****, p<0.0001; exact p-values for non-significance by unpaired Student’s t test.
Figure 7—figure supplement 1
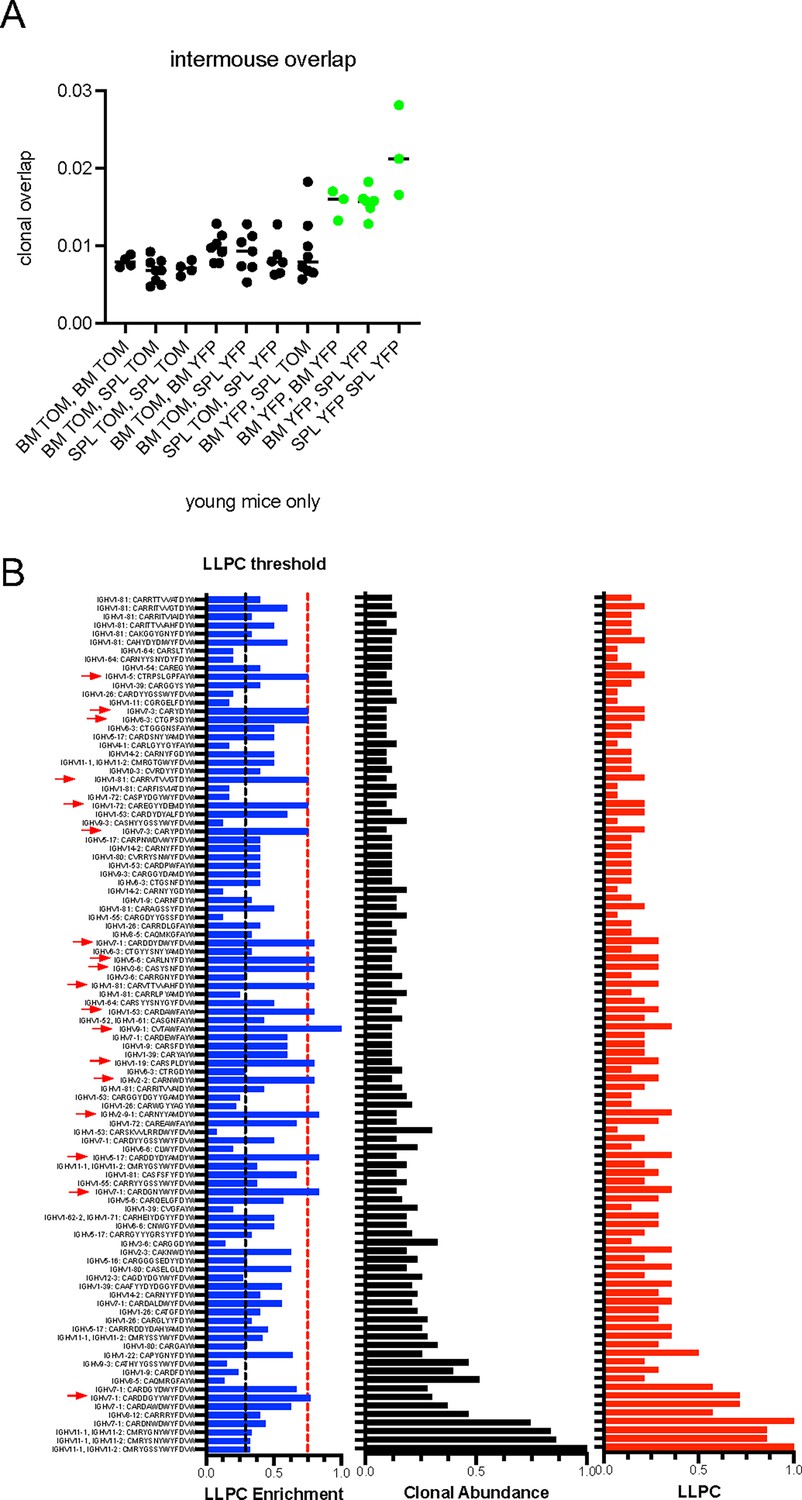
Analysis of public clones in plasma cell (PC) samples.
(A) Analysis of inter-mouse clonal overlap frequencies (%), comparing each sample from young mice (i) to all other samples within groups from the remaining samples (ii). X axis labels are formatted as such (i, ii). (B) Top public clones are analyzed for their abundance (0–1, where 1 indicates found in all samples) in all PC samples (black bars), long-lived plasma cell (LLPC) samples (red bars), and in blue, LLPC enrichment (ratio of LLPC abundance/PC abundance). Arrows indicate clones with over 75% enrichment (above red dotted line), and black dotted line indicates over-represented in LLPC samples.
Additional files
Download links
A two-part list of links to download the article, or parts of the article, in various formats.
Downloads (link to download the article as PDF)
Open citations (links to open the citations from this article in various online reference manager services)
Cite this article (links to download the citations from this article in formats compatible with various reference manager tools)
Fine-tuning spatial-temporal dynamics and surface receptor expression support plasma cell-intrinsic longevity
eLife 12:RP89712.
https://doi.org/10.7554/eLife.89712.3


