Complexes of vertebrate TMC1/2 and CIB2/3 proteins form hair-cell mechanotransduction cation channels
- Department of Otorhinolaryngology - Head & Neck Surgery, University of Maryland School of Medicine, United States
- Department of Chemistry and Biochemistry, The Ohio State University, United States
- Biophysics Graduate Program, The Ohio State University, United States
- Section on Sensory Cell Development and Function, National Institute on Deafness and Other Communication Disorders, National Institutes of Health, United States
- Department of Physiology, McGill University, Canada
- Ohio State Biochemistry Program, The Ohio State University, United States
- Departments of Otolaryngology and Neurology, F.M. Kirby Neurobiology Center, Boston Children’s Hospital, Harvard Medical School, United States
- Department of Biomedical Engineering, McGill University, Canada
- Departments of Biomedical Engineering, Neuroscience, and Otolaryngology and Head and Neck Surgery, Johns Hopkins University School of Medicine, United States
- Department of Biochemistry and Molecular Biology, University of Maryland School of Medicine, United States
- Department of Ophthalmology and Visual Sciences, University of Maryland School of Medicine, United States
Figures
Figure 1
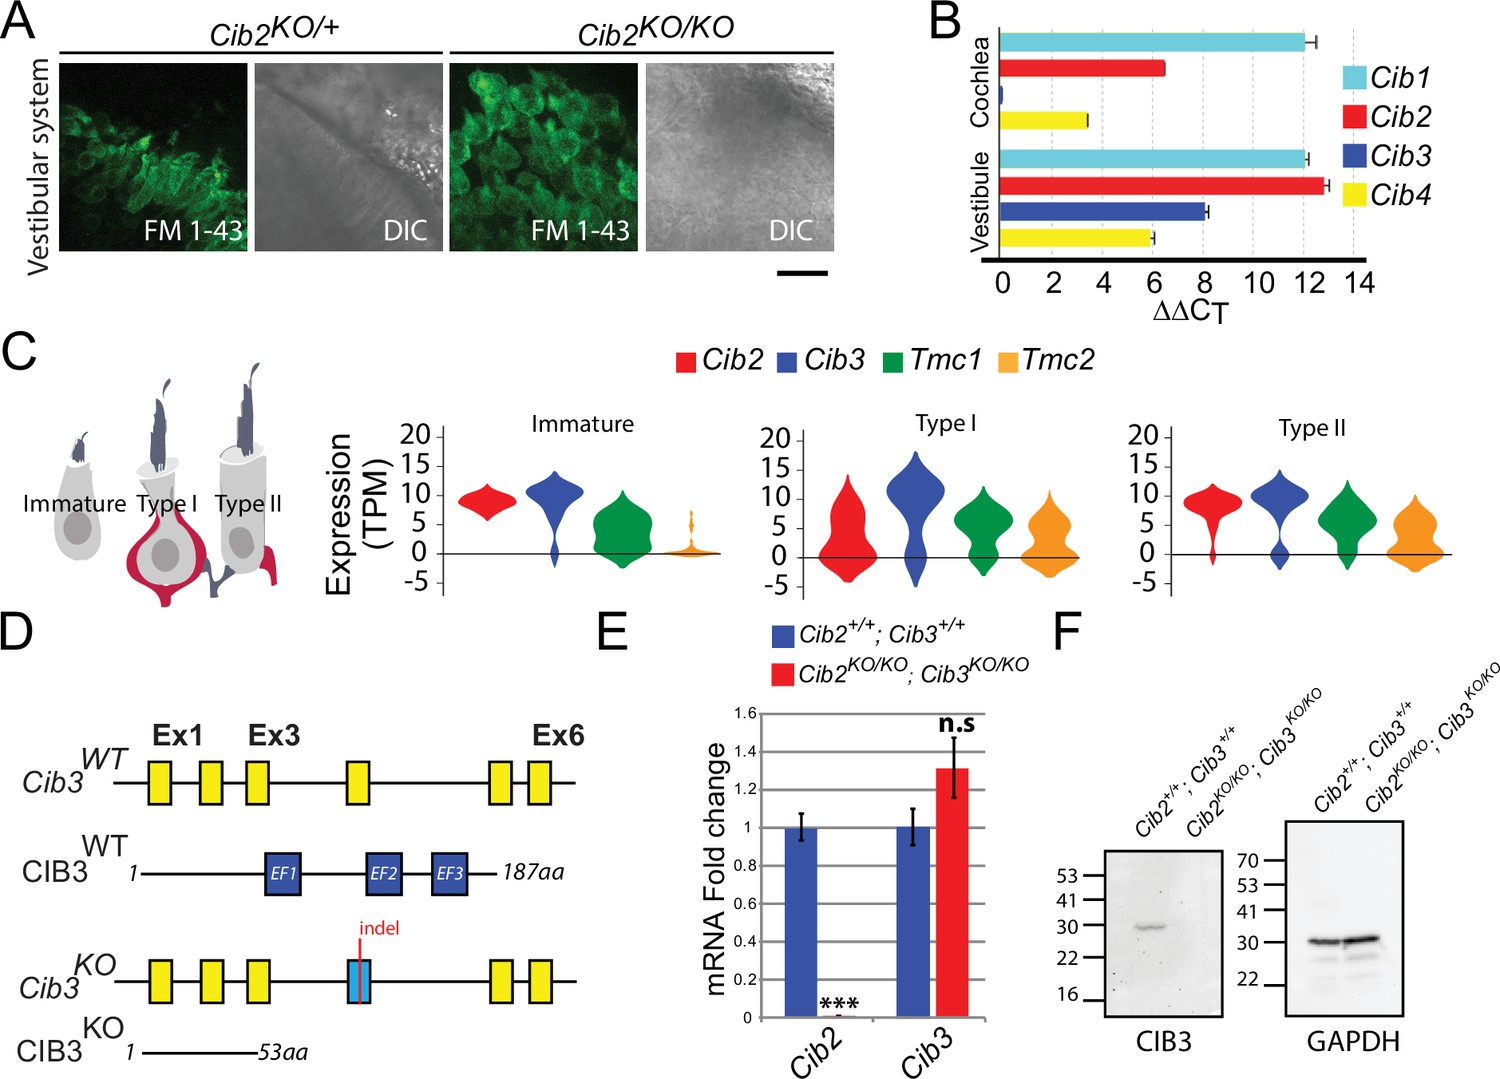
Expression of Cib genes in the mouse inner ear and generation of Cib3 knockout mice.
(A) Maximum intensity projections of Z-stacks of confocal fluorescent images and corresponding DIC images of Cib2KO/+ and Cib2KO/KO cultured vestibular end organ explants imaged after exposure to 3 μM of FM 1–43 for 10 s. The samples were dissected at P5 and kept 2 d in vitro (P5 + 2 div). Scale bar: 20 µm. (B) Real-time quantitative RT–PCR analysis of mRNA levels in the cochlear and vestibular sensory epithelia at P12 revealed different expressions of Cib1, Cib2, Cib3, and Cib4 in the auditory and vestibular end organs. (C) Violin plots generated by gEAR portal showing the expression levels of Cib2, Cib3, Tmc1, and Tmc2 by scRNA-seq in immature, type I, and type II utricular vestibular hair cells. TPM: transcript per million. (D) Gene structure of the wild-type and Cib3KO alleles. Exons are shown in yellow. Indel in exon 4 leads to a nonsense mutation and a premature stop at the protein level (p.Asp54*) (E) Real-time quantitative RT–PCR analysis using cDNA from brain tissue of Cib2;Cib3 mutant mice was used to analyze the expression of Cib2 and Cib3. Contrary to Cib2 mRNA, Cib3 mRNA appears to be stable in the Cib2KO/KO;Cib3KO/KO mice and does not go through nonsense-mediated decay process. The relative expression of Cib2 and Cib3 members were normalized against hprt. Asterisks indicate statistical significance: ***p<0.001 (Student’s t-test). n.s.: not significant. Error bars represent SEM. (F) Western Blot analysis on Cib2;Cib3 mouse heart tissue was performed using CIB3 antibody. No CIB3 protein was detected in the Cib2KO/KO;Cib3KO/KO mice, validating our mouse model. GAPDH detection was used as a loading control.
-
Figure 1—source data 1
Raw data for plots of cib2 and cib3 expression; original image for western blot gel.
- https://cdn.elifesciences.org/articles/89719/elife-89719-fig1-data1-v1.zip
Figure 2
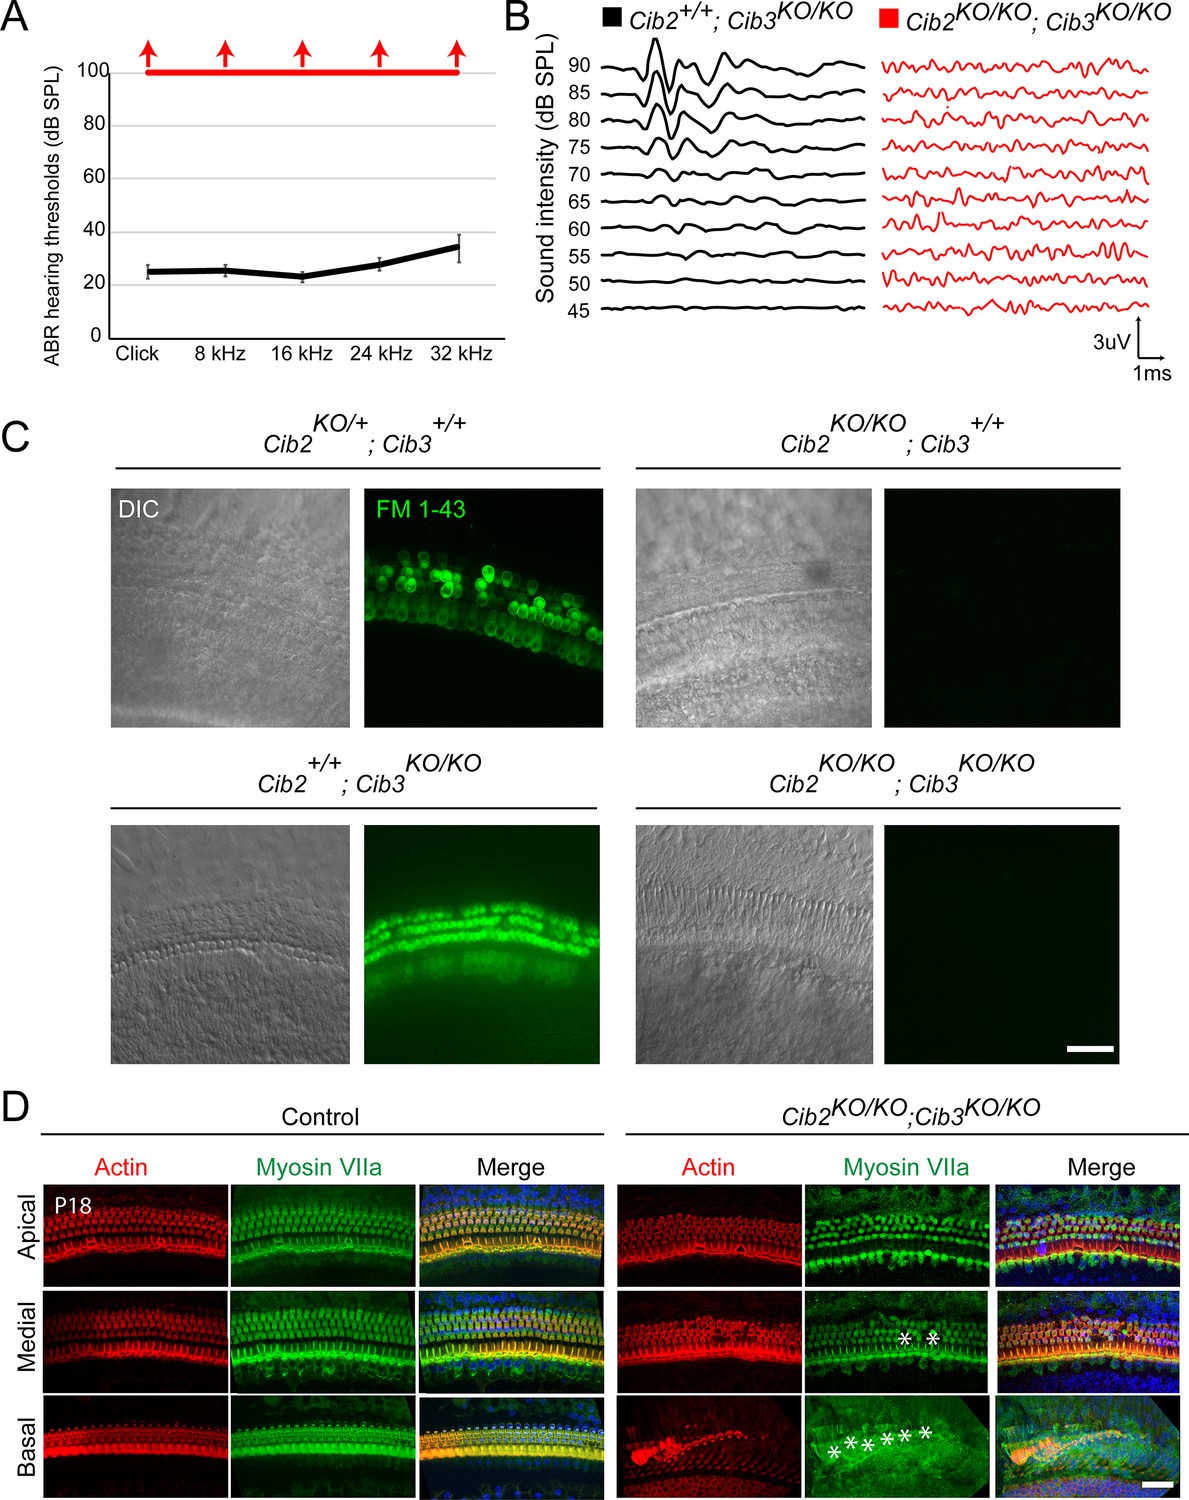
CIB2/3 double mutant mice have profound hearing loss.
(A) Auditory-evoked brainstem response (ABR) thresholds to broadband clicks and tone-pips with frequencies of 8 kHz, 16 kHz, 24 kHz, and 32 kHz in Cib2+/+;Cib3KO/KO (black; n=5) and Cib2KO/KO;Cib3KO/KO (red, n=5) mice at P16. The same animals were tested with clicks and tone pips. (B) ABR pure tone traces of P32 Cib2+/+;Cib3KO/KO (black) and Cib2KO/KO;Cib3KO/KO (red) mice measured at 32 kHz. Hearing thresholds are in Decibels (dB SPL). (C) Maximum intensity projections of Z-stacks of confocal fluorescent images (right) and corresponding DIC images (left) of Cib2KO/+;Cib3+/+, Cib2KO/KO;Cib3+/+, Cib2+/+;Cib3KO/KO and Cib2KO/KO;Cib3KO/KO cultured organ of Corti explants imaged after exposure to 3 μM of FM 1–43 for 10 s. The samples were dissected at P5 and kept 2 d in vitro (P5 + 2 div). Scale bar: 20 µm. (D) Maximum intensity projections of confocal Z-stacks of apical, medial, and basal turns of organ of Corti of control and Cib2KO/KO;Cib3KO/KO mice immunostained with an anti-myosin VIIa antibody (green) and counterstained with phalloidin (red) at P18. Asterisks indicate hair cell loss. Scale bar: 10 µm.
-
Figure 2—source data 1
Raw data for ABR plots.
- https://cdn.elifesciences.org/articles/89719/elife-89719-fig2-data1-v1.zip
Figure 3
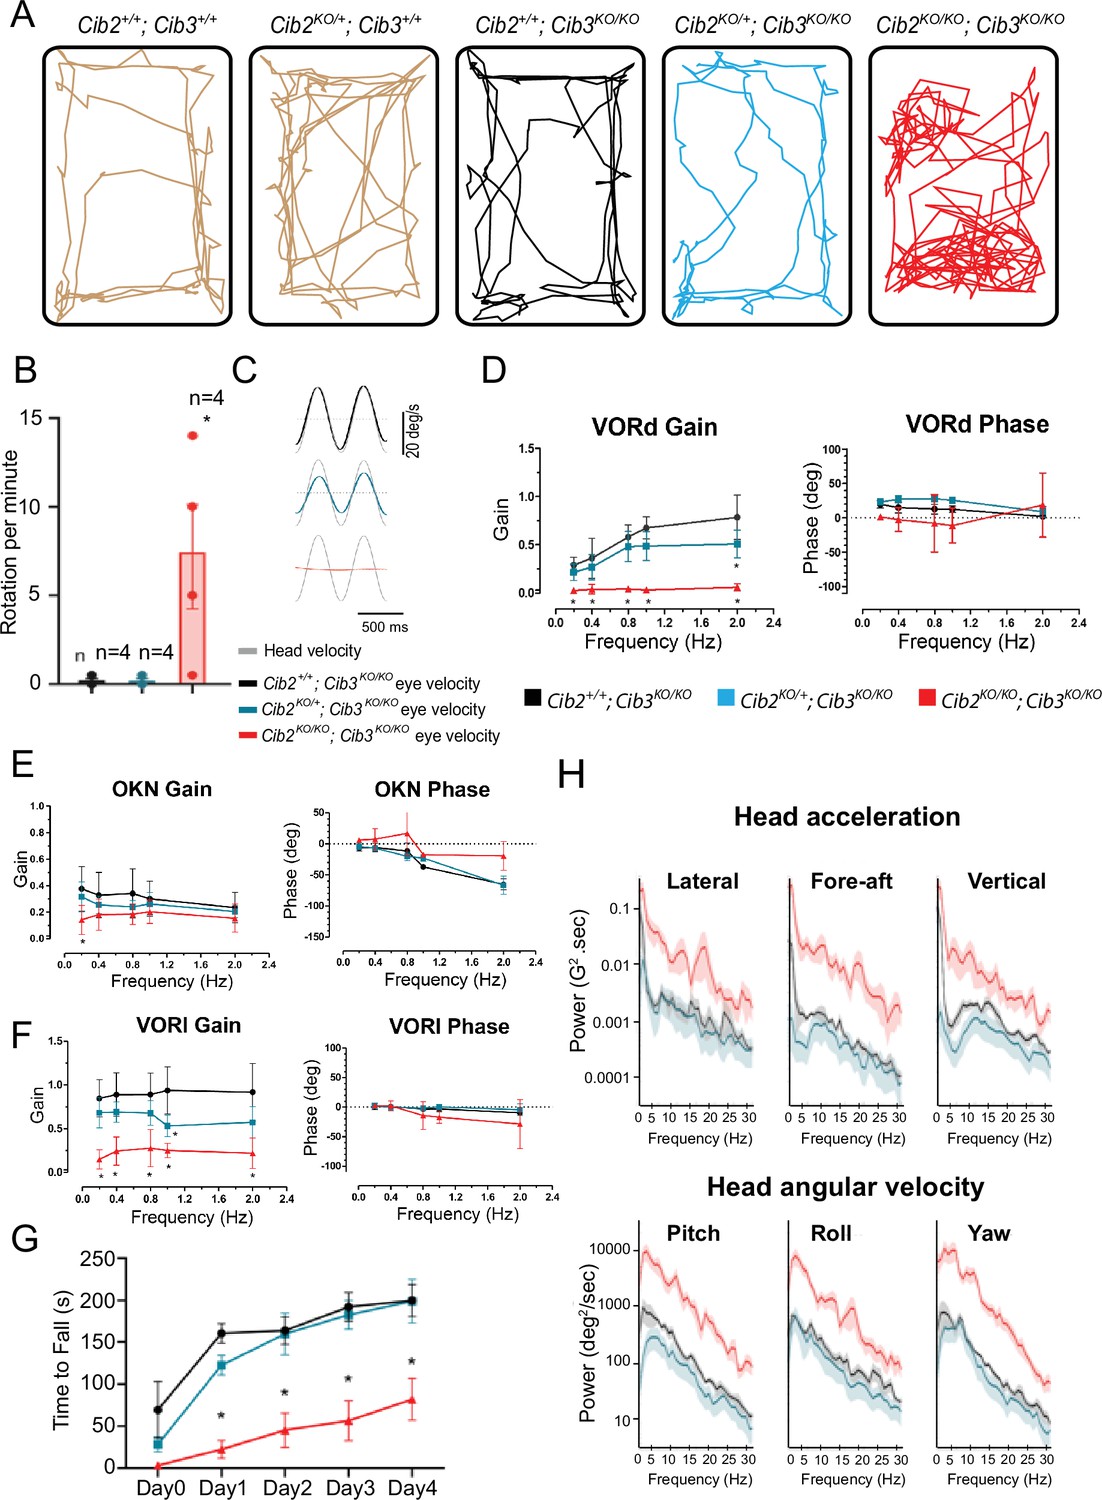
CIB2/3 double mutant mice have vestibular dysfunction.
(A) Traces showing the open-field exploratory behavior of P60 Cib2+/+;Cib3+/+, Cib2KO/+;Cib3+/+, Cib2+/+;Cib3KO/KO, Cib2KO/+;Cib3KO/KO and Cib2KO/KO;Cib3KO/KO mutant mice. (B) Quantification of the number of rotations in 120 s (mean ± SEM), showing that, unlike Cib2+/+;Cib3KO/KO, and Cib2KO/+;Cib3KO/KO mice, Cib2KO/KO;Cib3KO/KO mutant mice display a circling behavior and a vestibular defect (t‐test) (n=4 for each genotype). (C) Examples of head-velocity (gray) and resultant eye-velocity traces evoked during VORd testing. Note, that the eye movement is compensatory, and the trace has been inverted to facilitate comparison with head velocity. (D) VORd gain and phase (mean ± SD) plotted as a function of frequency for Cib2+/+;Cib3KO/KO (n=4), Cib2KO/+;Cib3KO/KO (n=5), Cib2KO/KO;Cib3KO/KO (n=4). (E) OKN gain and phase (mean ± SD) plotted as a function of frequency for Cib2+/+; Cib3KO/KO (n=4), Cib2KO/+;Cib3KO/KO (n=5), Cib2KO/KO;Cib3KO/KO (n=4). (F) VORl gain and phase (mean ± SD) plotted as a function of frequency for Cib2+/+;Cib3KO/KO (n=4), Cib2KO/+;Cib3KO/KO (n=5), Cib2KO/KO;Cib3KO/KO (n=4). Comparisons made with two-way ANOVA followed by Bonferroni post-hoc test for (B,D-F); *p<0.05. (G) Quantification of the time mice remained on the rotating rod with increasing acceleration (mean ± SEM). Comparisons made with two-way ANOVA followed by Bonferroni post-hoc test ; *p<0.002. (Cib2+/+;Cib3KO/KO (n=6), Cib2KO/+;Cib3KO/KO (n=6), Cib2KO/KO;Cib3KO/KO (n=6)). (H) Comparison of power spectra density of head movements in translational axes (top) and rotational axes (bottom) between wild type (Cib2+/+;Cib3KO/KO, black), heterozygous mutants (Cib2KO/+;Cib3KO/KO, blue), and homozygous mutants (Cib2KO/KO;Cib3KO/KO, red). The double knockout Cib2KO/KO;Cib3KO/KO exhibit significantly higher power than Cib2+/+;Cib3KO/KO and Cib2KO/+;Cib3KO/KO across all frequencies (0–30 Hz), in all six translational and rotational axes.
-
Figure 3—source data 1
Raw data for plots of rotations, VORd, OKN, VORl, and time to fall; matlab code to convert and plot head movement data.
- https://cdn.elifesciences.org/articles/89719/elife-89719-fig3-data1-v1.zip
Figure 4
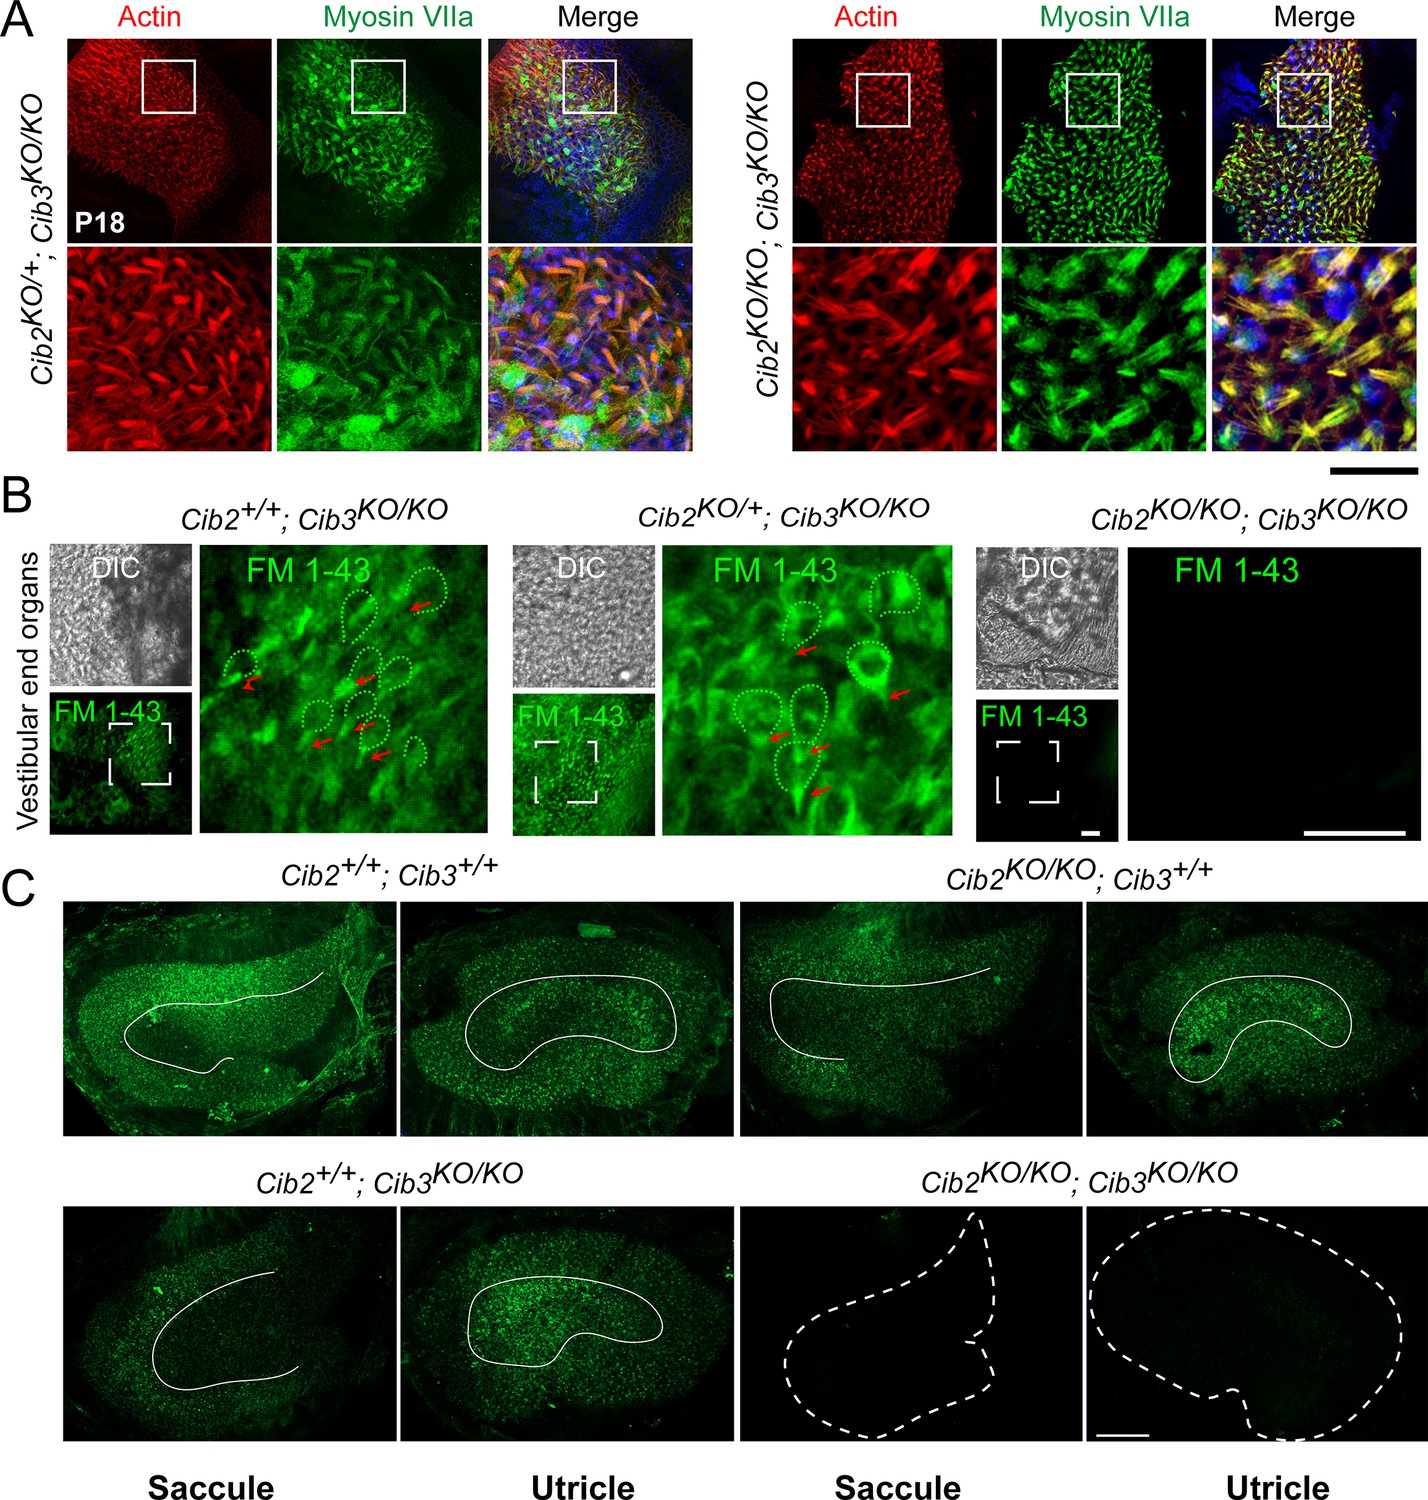
Vestibular hair cells do not have functional mechano-electrical transduction (MET) channels at rest in CIB2/3 double mutant mice.
(A) Maximum intensity projections of confocal Z-stacks of the vestibular end organs of P18 Cib2KO/+;Cib3KO/KO and Cib2KO/KO;Cib3KO/KO mutant mice immunostained with myosin VIIa antibody (green) and counterstained with phalloidin (red) and DAPI (blue). Scale bar = 50 µm. (B) Adult vestibular end organs of Cib2+/+;Cib3KO/KO, Cib2KO/+;Cib3KO/KO, and Cib2KO/KO;Cib3KO/KO mutant mice imaged after exposure to 3 μM of FM 1–43 for 10 s. Vestibular hair cell bodies (green dotted lines), and stereocilia bundles (red arrows) are shown. Scale bar: 100 µm. (C) FM 1–43 FX (fixable form) labeling of saccules and utricles by IP injection at P60. Obvious reduction in signal in Cib2KO/KO;Cib3KO/KO, and subtle extrastriolar reduction in Cib2+/+;Cib3KO/KO mice was observed. Extrastriolar regions are delimited with white lines. Scale bar = 100 µm.
Figure 5 with 2 supplements
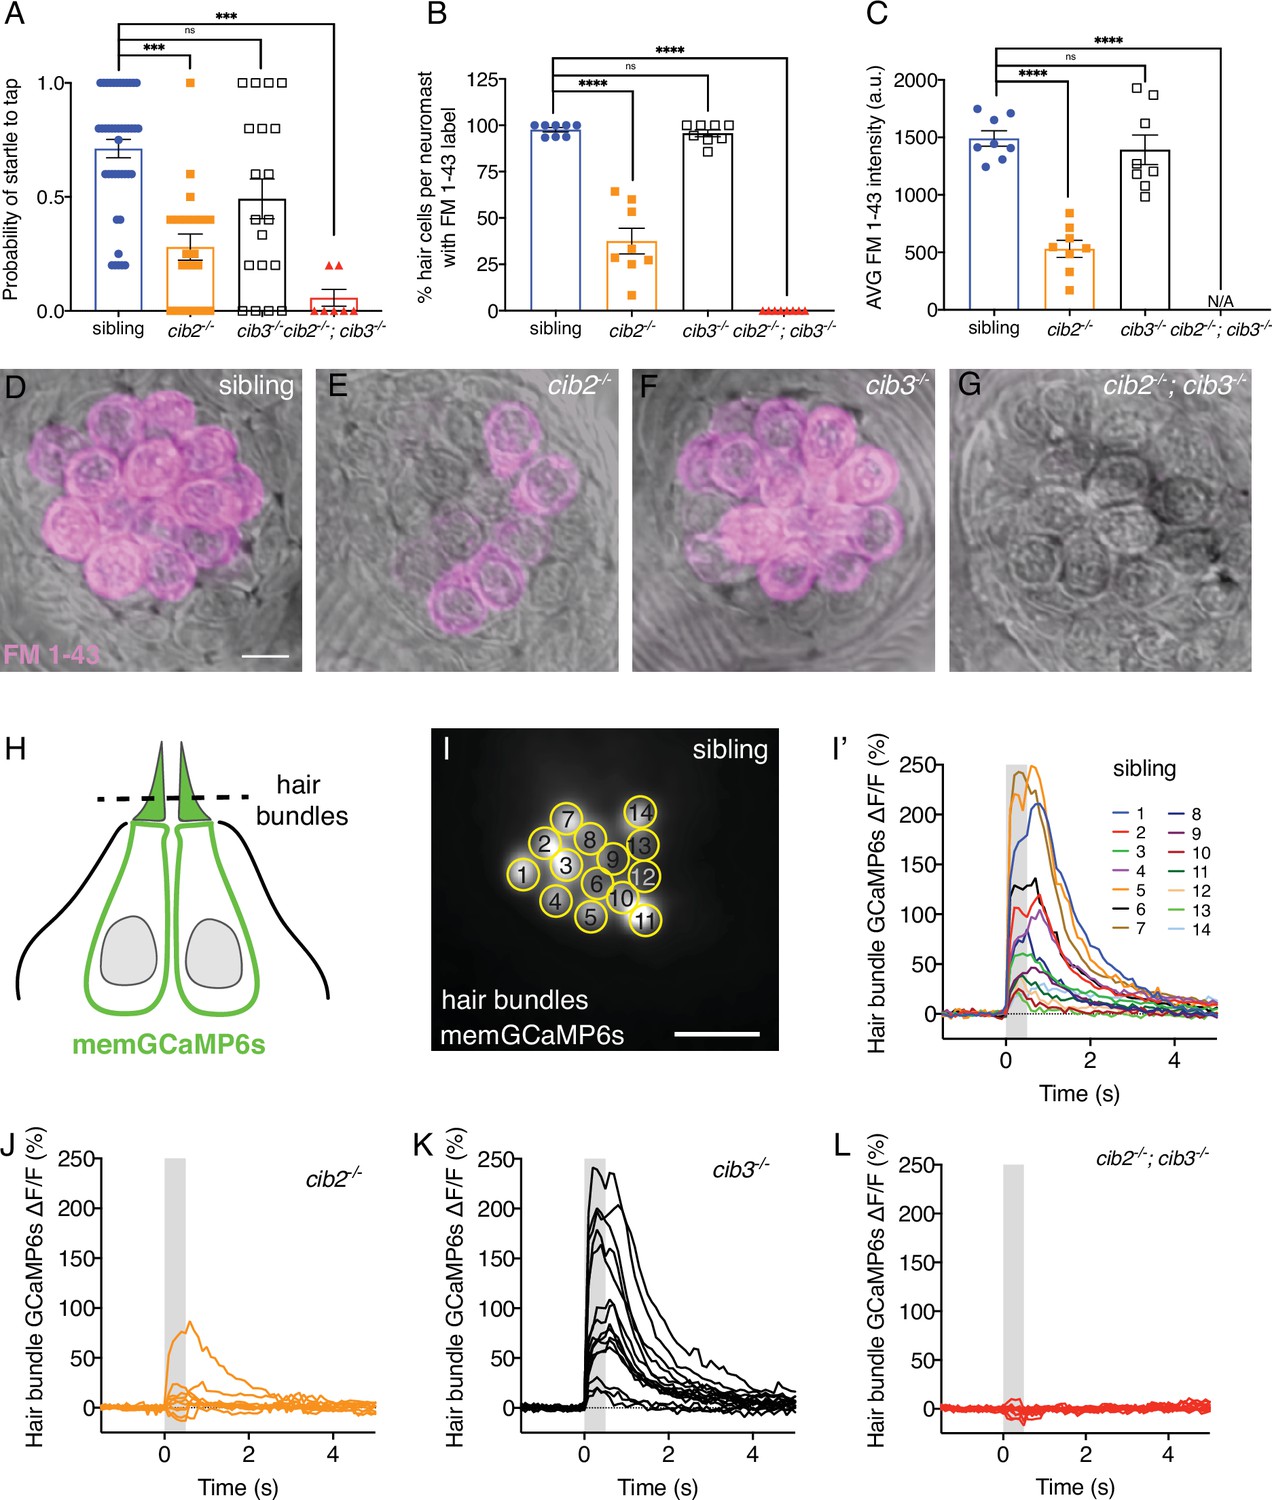
Both Cib2 and Cib3 are required in zebrafish for acoustic startle and mechano-electrical transduction (MET) function.
(A) Compared to controls (siblings) cib3 mutants have a normal acoustic startle response. Cib2;cib3 double mutants completely lack an acoustic startle response, while cib2 mutants have a reduced probability to startle compared to controls (n=43 sibling, 20 cib2, 19 cib3, and 7 cib2;cib3 animals). (B) Compared to controls cib3 mutants have a normal % of hair cells that label with FM 1–43 per neuromast. In cib2;cib3 mutants no hair cells label with FM 1–43, and in cib2 mutants a significantly reduced % of hair cells label with FM 1–43 per neuromast. (C) The average intensity of FM 1–43 labeling in cib3 mutant hair cells is similar to controls. In contrast, in cib2 mutants, hair cells that label with FM 1–43, have a significantly reduced intensity compared to controls (n=8 neuromasts per genotype in B and C). (D–G) Representative neuromasts labeled with FM 1–43 for each genotype. FM 1–43 label is overlaid onto laser scanning DIC images. (H) Schematic showing the localization of membrane-localized GCaMP6s (memGCaMP6s); the indicator used to measure Ca2+ influx into lateral-line hair bundles. The plane used for Ca2+ imaging and to determine if a hair cell is mechanosensitive is indicated by the dashed line. (I-I’) Representative example of a hair bundle imaging plane (I), along with the resulting Ca2+ responses (I’) from hair bundles from a control neuromast. The ROIs used to measure Ca2+ signals in each hair bundle are indicated in (I). (J–L) Representative examples of Ca2+ responses from neuromasts in cib2 (J), cib3 (K), and cib2;cib3 mutants (L). FM 1–43 imaging and behavior were performed at 5 dpf. Ca2+ imaging was performed at 5 or 6 dpf. A Kruskal-Wallis test was used in A; A one-way ANOVA was used in B and C. The scale bar in D and I=5 µm.
Figure 5—figure supplement 1
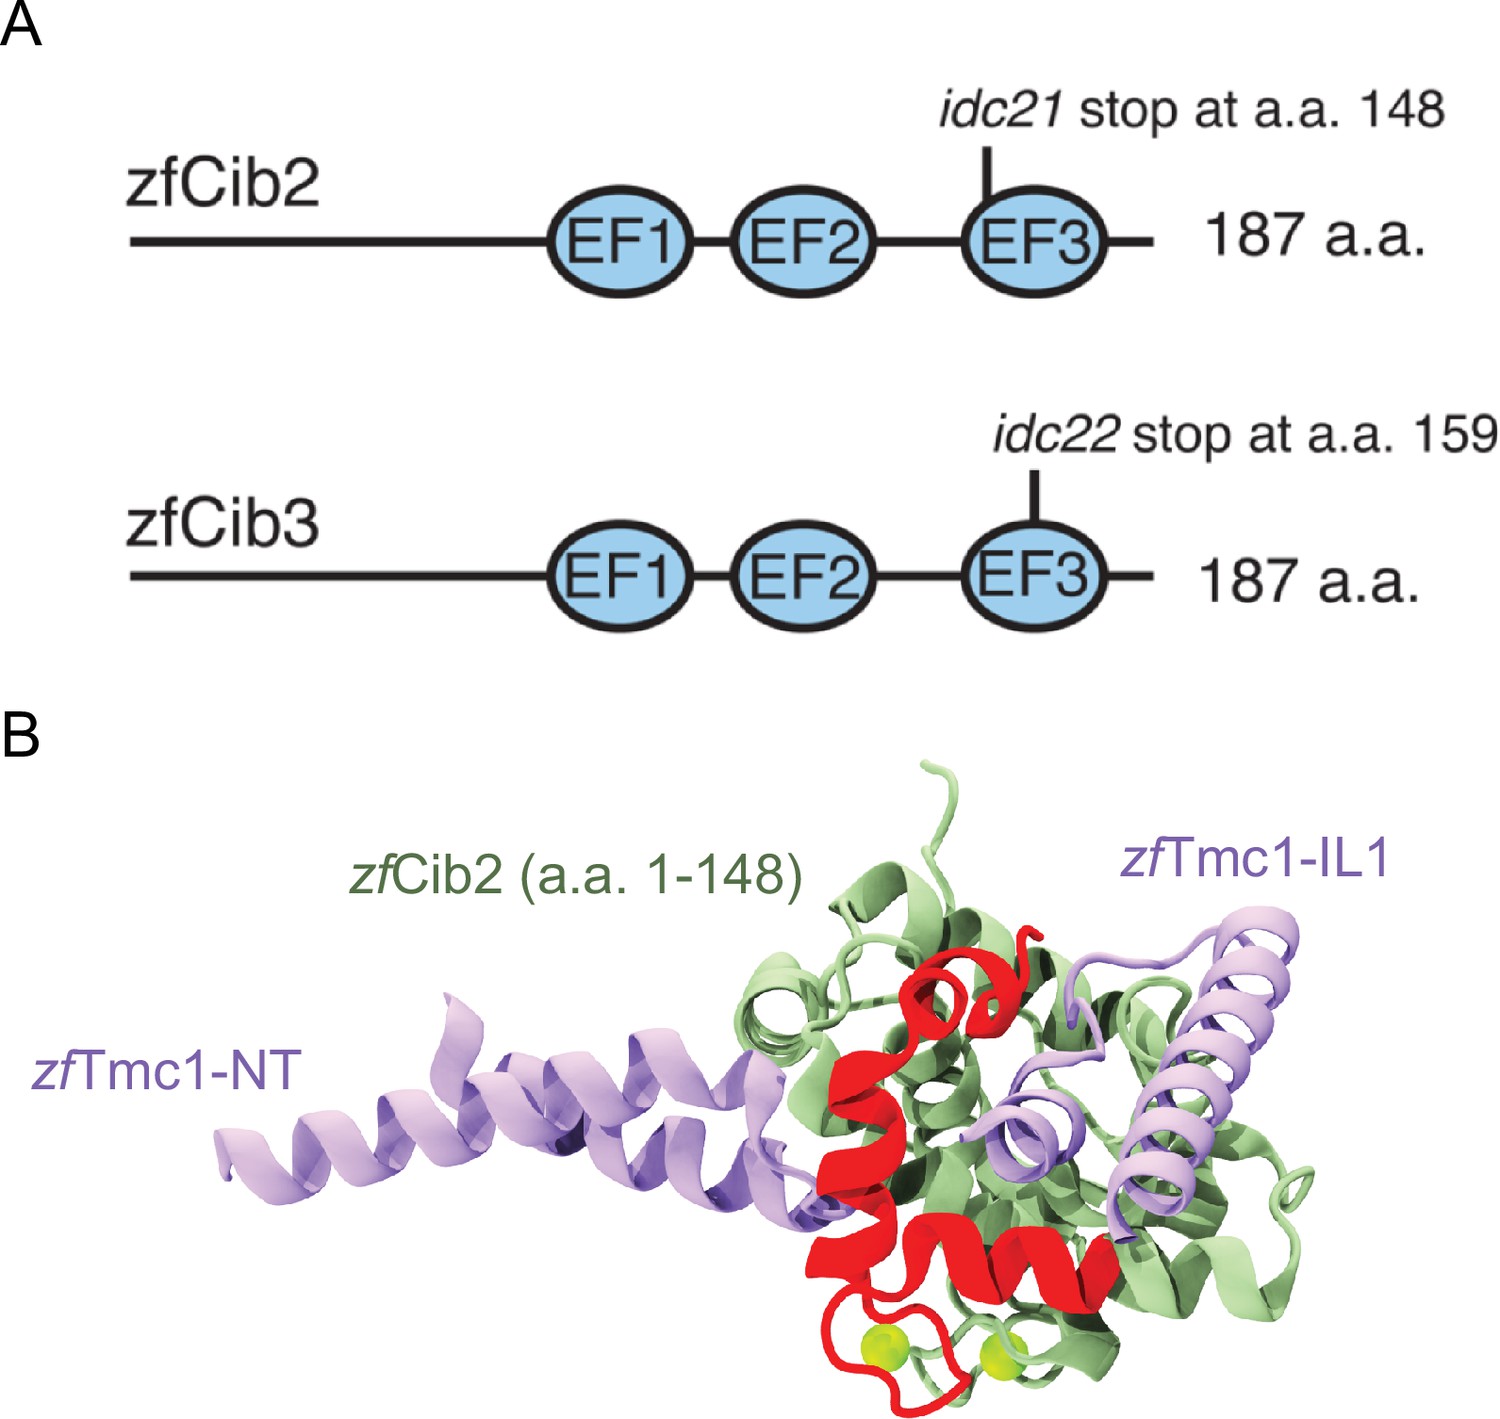
Summary of zebrafish cib2 and cib3 alleles used in study.
(A) Both the zebrafish Cib2 and Cib3 proteins are 187 amino acids (a.a.) in length. We selected alleles of cib2 and cib3 that result in stop codons in the third EF-hand domain. In cib2idc21 mutants a stop codon occurs at a.a. 148. In cib3idc22 mutants a stop codon occurs at a.a. 159. (B) AF2 model showing zebrafish Tmc1-NT/IL1 (light purple), zebrafish Cib2 a.a. 1–148 (light green), and zebrafish Cib2 a.a. 149–187 (red). Position of Ca2+ ions (green spheres) were obtained via superposition of human CIB2 with zebrafish Cib2.
Figure 5—figure supplement 2
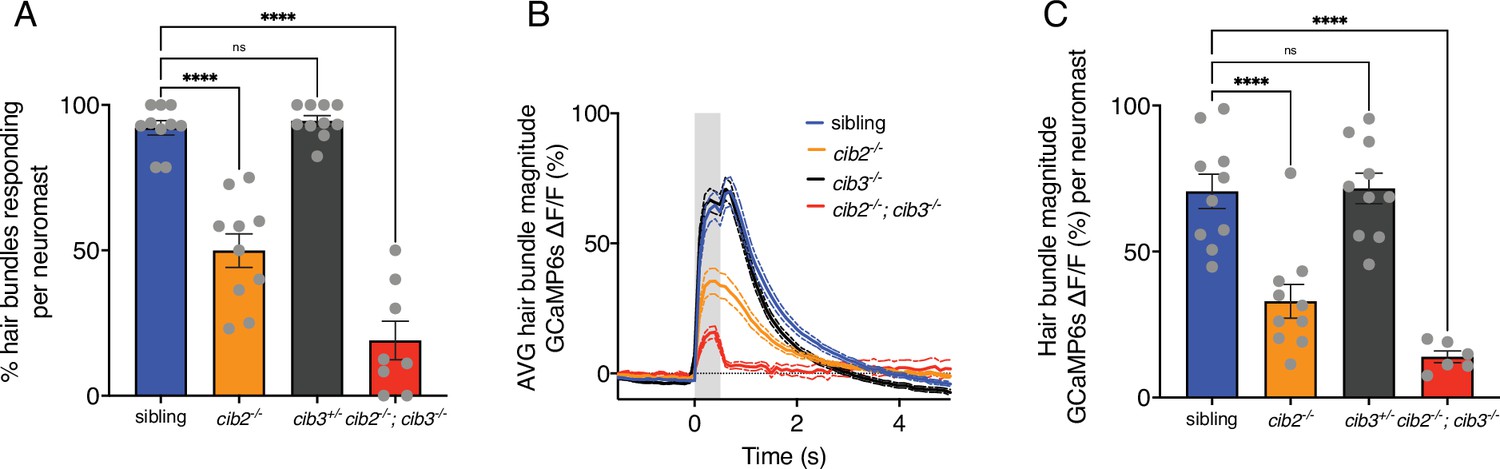
Summary of mechanosensitive calcium responses in zebrafish.
(A) Compared to controls, cib3 mutants have a normal % of hair cells with mechanosensitive calcium responses per neuromast. In cib2;cib3 mutants very few hair cells are mechanosensitive, and in cib2 mutants there is a significantly reduced % of hair cells that are mechanosensitive per neuromast (n=10 neuromasts for sibling, cib2, and cib3 mutants, and eight neuromasts in cib2;cib3 mutants). (B) Of the mechanosensitive hair bundles in (A), the average mechanosensitive calcium response is plotted for each genotype. (C) Of the mechanosensitive hair bundles in (A) the average response per neuromast is represented in a dot plot. Calcium imaging was performed at 5 or 6 dpf. A one-way ANOVA was used in (A and C).
Figure 6
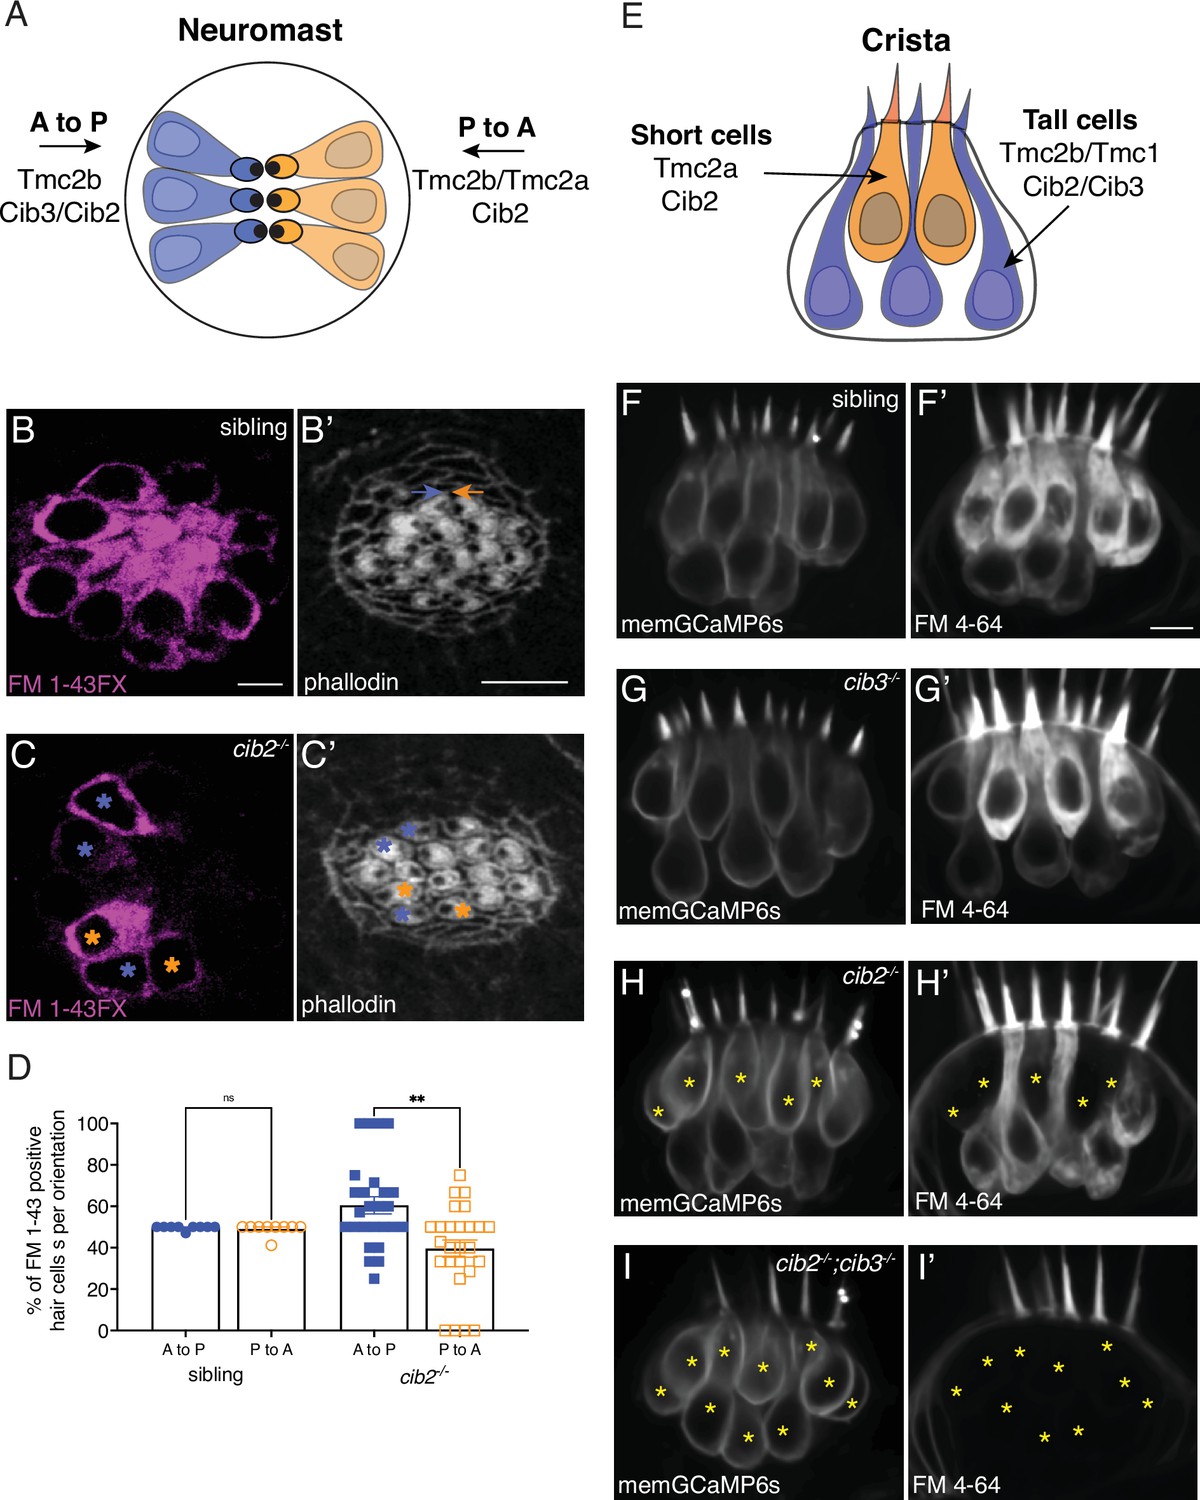
Cib2 is required in specific subsets of hair cells in the zebrafish posterior lateral line (pLL) and inner ear.
(A) Overview of Tmc requirements in pLL hair cells. Hair cells that sense posterior flow (orange) rely on Tmc2b, while hair cells that sense anterior flow (blue) can rely on Tmc2b and/or Tmc2a for mechanosensitive function. (B-C’) FM 1–43 FX labeling in pLL neuromasts from sibling control (B) and cib2 mutants (C). The residual cells in cib2 mutants rely on Cib3 for mechanosensitive function. Phalloidin label can be used to link FM 1–43 FX label to the orientation of pLL hair cells (C,C’; see colored asterisks). In B’, orange and blue arrows rest above hair cells that are oriented to respond to anterior and posterior flow, respectively. (D) Quantification reveals that a similar percentage of anterior and posterior responsive pLL hair cells label with FM 1–43 FX in sibling controls (posterior flow: 49.7%, anterior flow: 49.2%, n=9 neuromasts). In contrast, in cib2 mutants, a significantly higher percentage of posterior responsive pLL hair cells label with FM 1–43 FX in cib2 mutants (posterior flow: 60.5%, anterior flow: 39.5%, n=26 neuromasts). (E) Overview of Tmc and Cib requirements in the hair cells of zebrafish cristae. Short teardrop-shaped cells rely primarily on Tmc2a, while tall gourd-shaped cells rely primarily on Tmc2b and Tmc1. (F-I’) Medial cristae for each genotype. MemGCaMP6s labels all hair cells, while FM 4–64 labels hair cells with intact mechanosensitive function. In siblings and cib3 mutants, both teardrop and gourd cells label with FM 4–64 (F-F’, G-G’). In cib2;cib3 double mutants, no hair cells label with FM 4–64 (asterisks) (I-I’). In cib2 mutants many short cells fail to label with FM 4–64 (asterisks) (H-H’), (n=13 double het sibling, 7 cib3, 14 cib2, and 4 double mutant crista). All images were acquired at 5 dpf. A Kruskal-Wallis test was used in D; p<0.01. The scale bars in B, B’, and F’=5 µm.
Figure 7 with 7 supplements
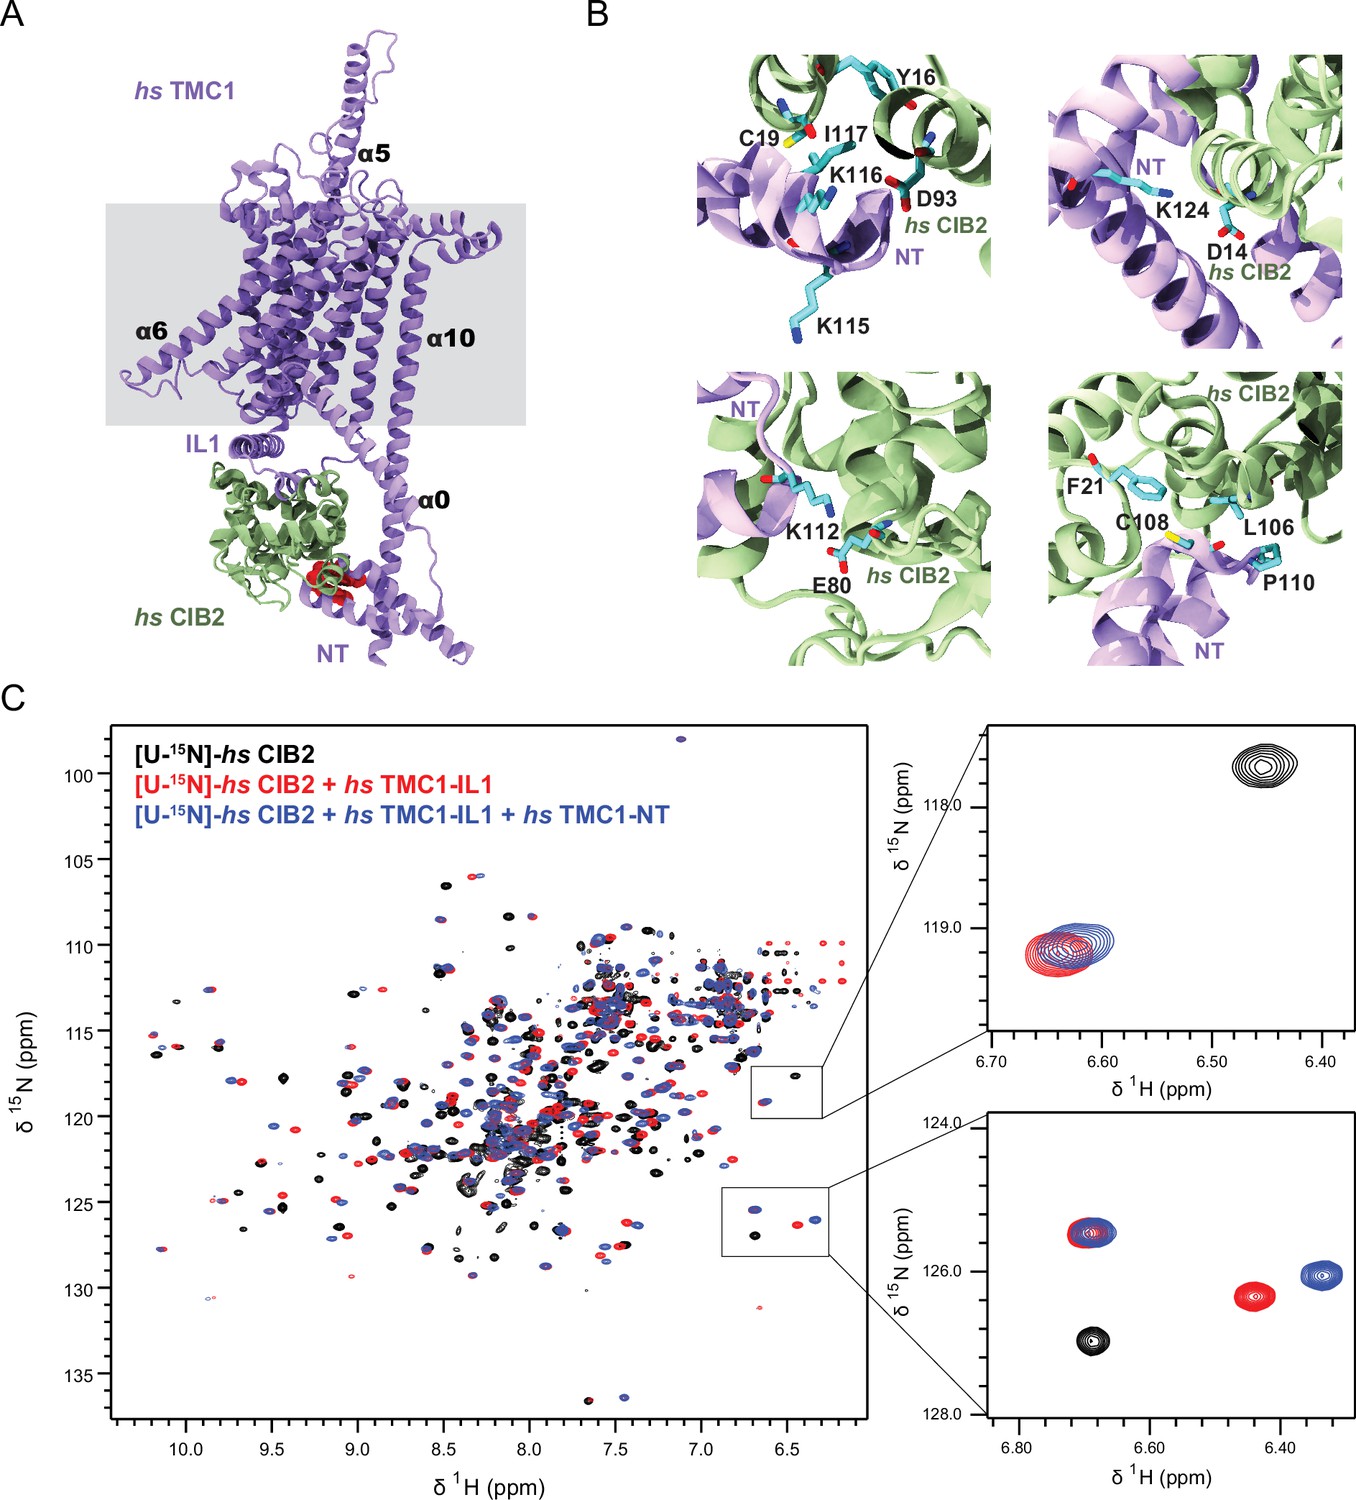
AF2 predictions and nuclear magnetic resonance (NMR) data support a clamp-like model for the human TMC1 and CIB2 complex.
(A) AF2 model of hs TMC1 in complex with hs CIB2. Side view of monomeric hs TMC1 (light purple) in complex with hs CIB2 (light sea green). N-terminal residues of TMC1 known to interact with CIB2 are in red. (B) Top left panel shows residues at the hs TMC1-NT fragment (115-117) shown to weaken interaction with CIB2 upon mutation (Liang et al., 2021) at the interface with CIB2. Additional panels show details of contacts between TMC1 and CIB2 with formation of K124:D14 and K112:E80 salt bridges, as well as hydrophobic interactions. (C) Overlay of 1H-15N TROSY-HSQC spectra of hs [U-15N]-CIB2 (black) alone and bound to either only hs TMC1-IL (red) or both hs TMC1-IL and hs TMC1-NT (blue). NMR data were obtained in the presence of 3 mM CaCl2. These data are also shown in Figure 7—figure supplement 6.
-
Figure 7—source data 1
TMC sequence alignment.
- https://cdn.elifesciences.org/articles/89719/elife-89719-fig7-data1-v1.pdf
Figure 7—figure supplement 1
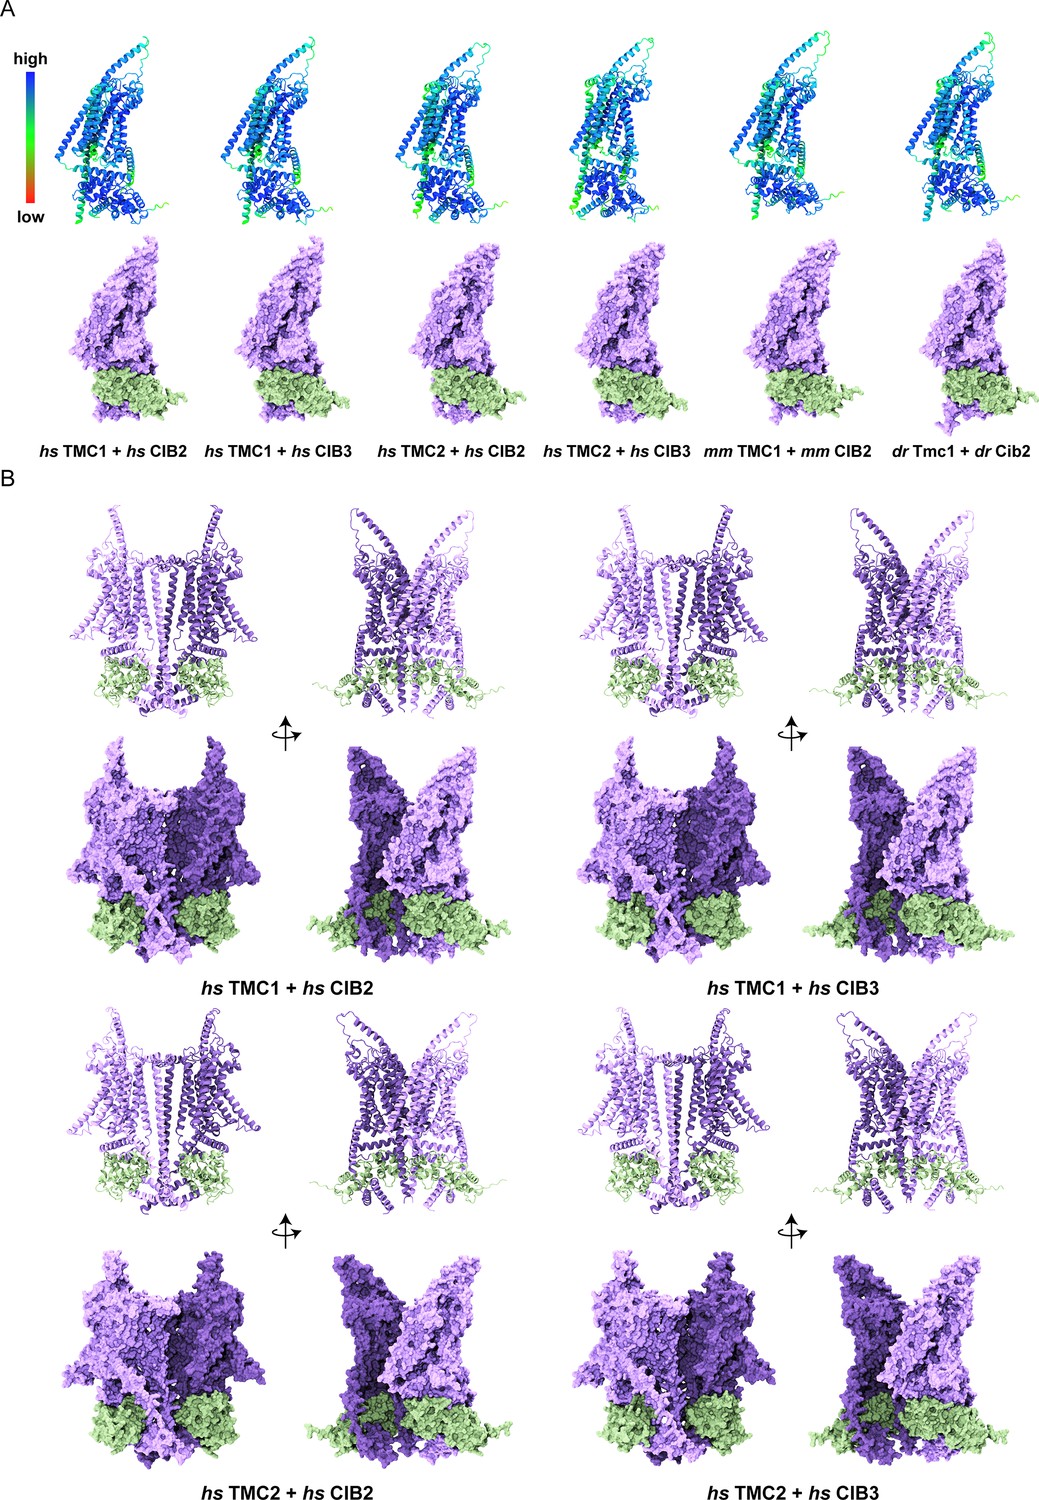
Overview of TMC1/2 and CIB2/3 AF2 models.
(A) Human (Homo sapiens, hs), mouse (Mus musculus, mm), and zebrafish (Danio rerio, dr) models colored based on confidence scores are shown in the top row. Same models for TMC1/2 (light purple) and CIB2/3 (light sea green) are shown in surface representation on the bottom row. (B) Side views of homodimers of hs TMC1/2 (monomer A, light purple; monomer B, dark purple) in complex with hs CIB2/3 (light sea green) shown in ribbon and surface representation.
Figure 7—figure supplement 2
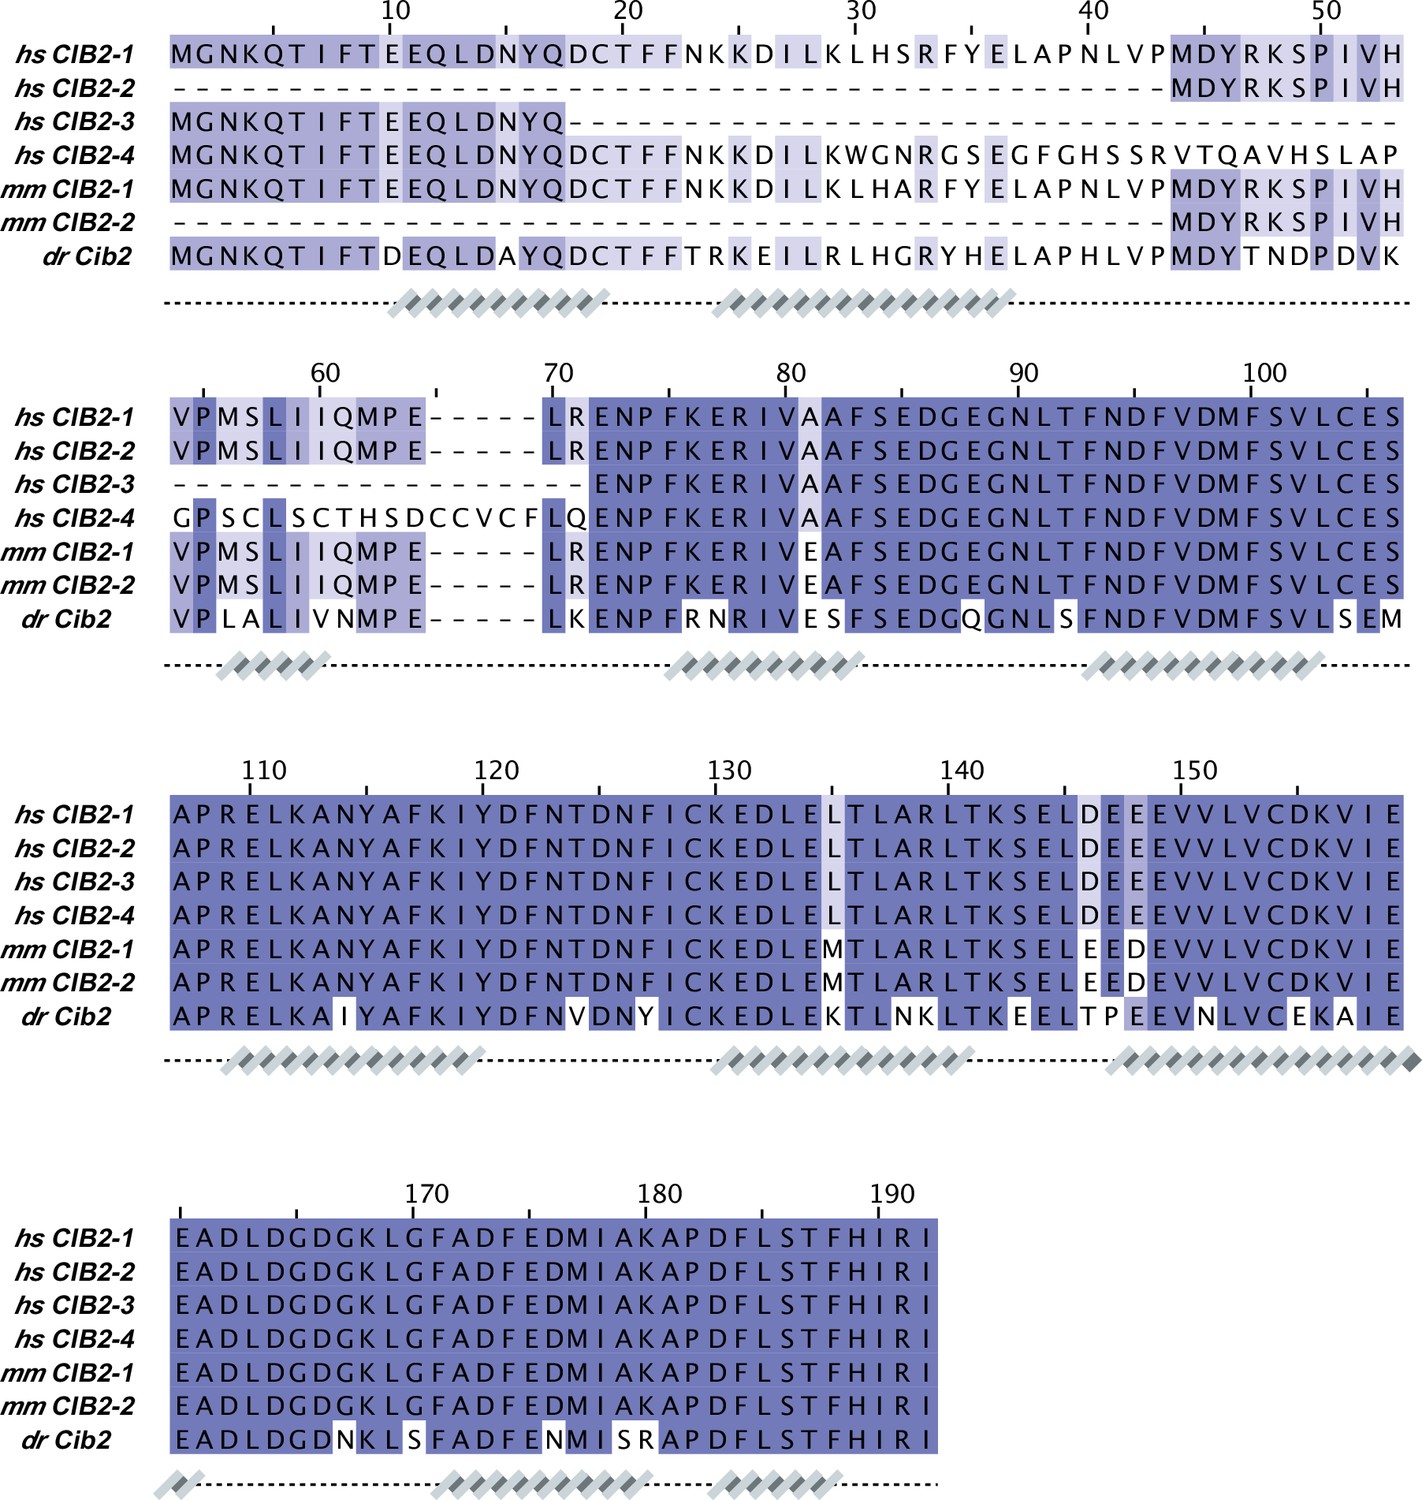
CIB2 sequence alignment.
Protein sequences correspond to: hs CIB2-1 (NCBI ID: NP_006374.1), hs CIB2-2 (NCBI ID: NP_001258817.1), hs CIB2-3 (NCBI ID: NP_001258818.1), hs CIB2-4 (NCBI ID: NP_001288153.1), mm CIB2-1 (NCBI ID: NP_062660.1), mm CIB2-2 (NCBI ID: XP_036011040.1), and dr Cib2 (NCBI ID: NP_957000.1). Secondary structures underneath the sequences are based on an AF2 model of hs CIB2.
Figure 7—figure supplement 3
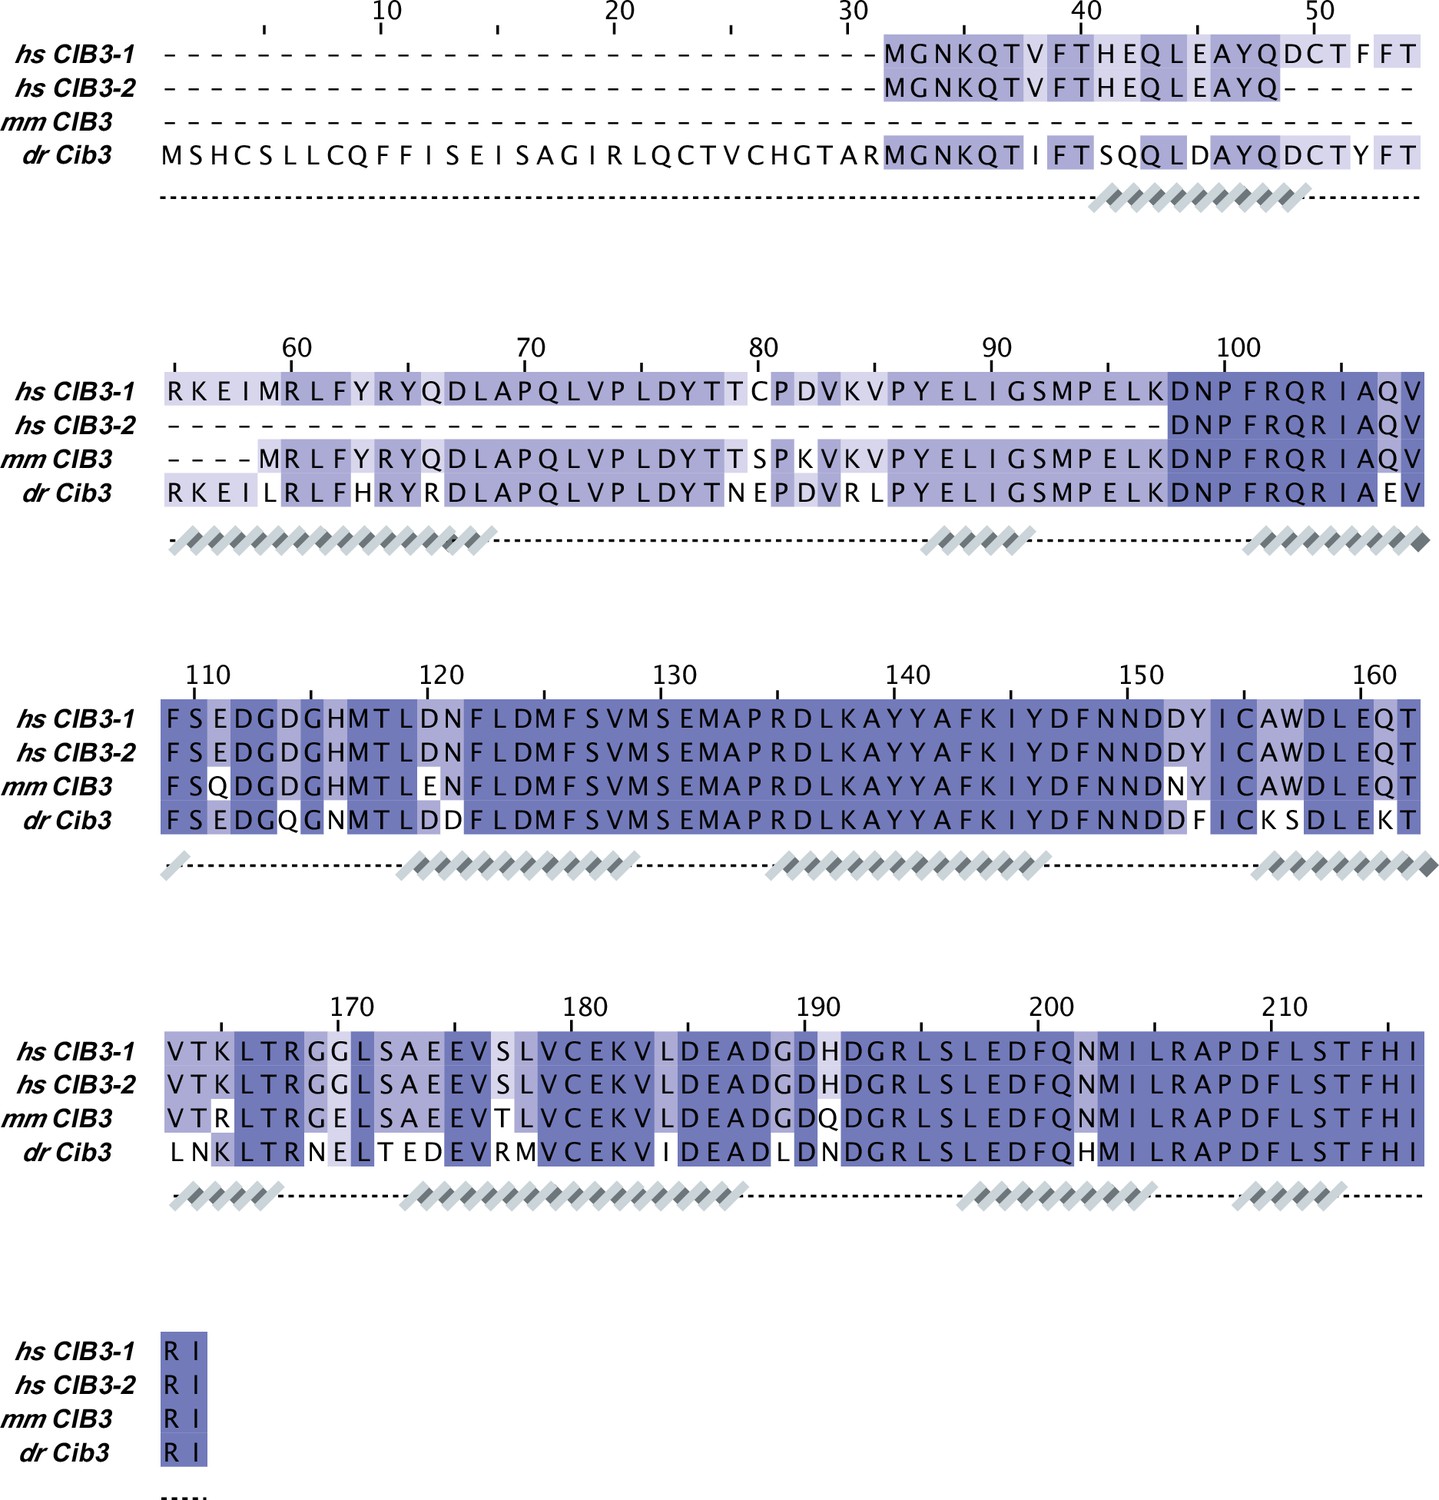
CIB3 sequence alignment.
Protein sequences correspond to: hs CIB3-1 (NCBI ID: NP_473454.1), hs CIB3-2 (NCBI ID: NP_001287851.1), mm CIB3 (NCBI ID: NP_001074281.1), and dr Cib3 (NCBI ID: XP_003198013.2). Secondary structures underneath the sequences are based on an AF2 model of hs CIB3.
Figure 7—figure supplement 4
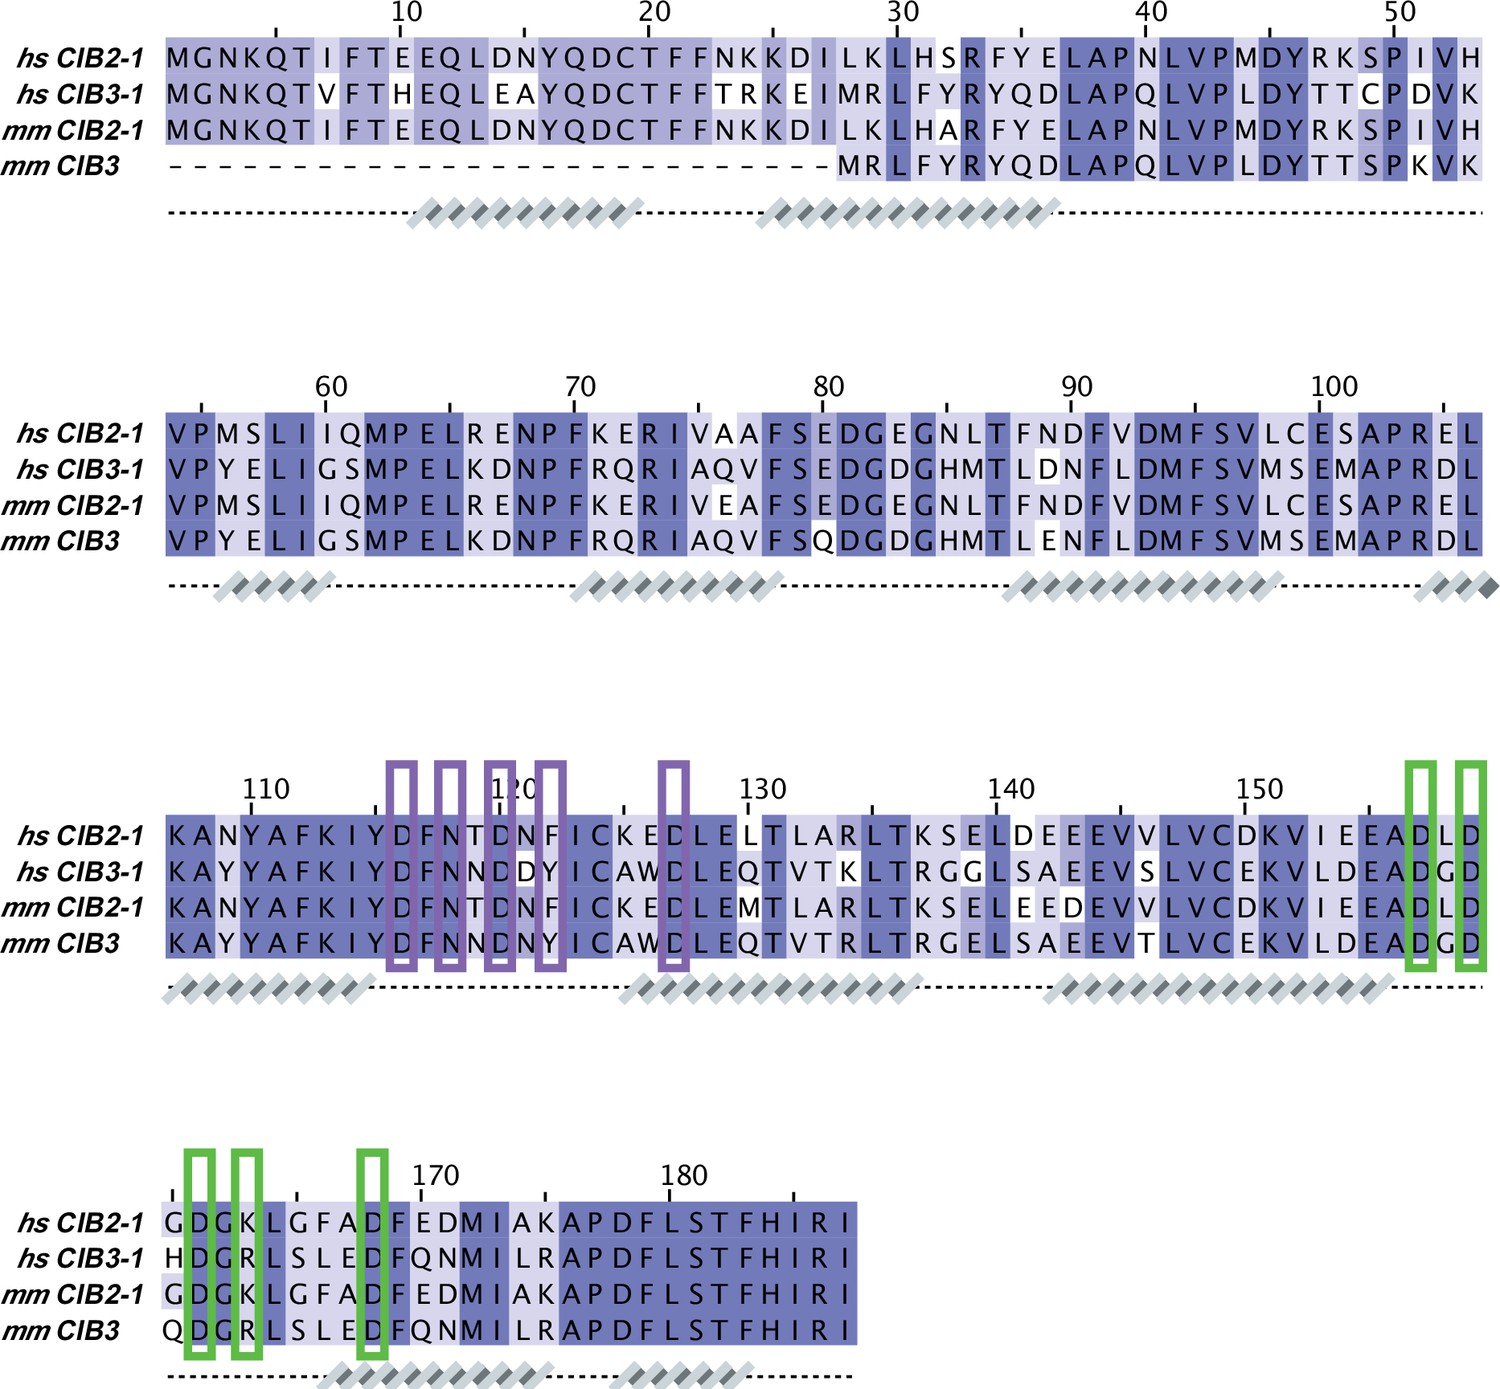
CIB sequence alignment.
Protein sequences correspond to: hs CIB2-1 (NCBI ID: NP_006374.1), hs CIB3-1 (NCBI ID: NP_473454.1), mm CIB2-1 (NCBI ID: NP_062660.1), and mm CIB3 (NCBI ID: NP_001074281.1). Secondary structures underneath the sequences are based on AF2 models of hs CIB2/3. Cation-coordinating CIB residues were based on the X-ray crystal structure of hs CIB3 in complex with mm TMC1-IL1 bound to 2 Mg2+ (PDB code: 6WUD; purple brackets for Mg2+ bound to EF3 and green brackets for Mg2+ bound to EF4).
Figure 7—figure supplement 5
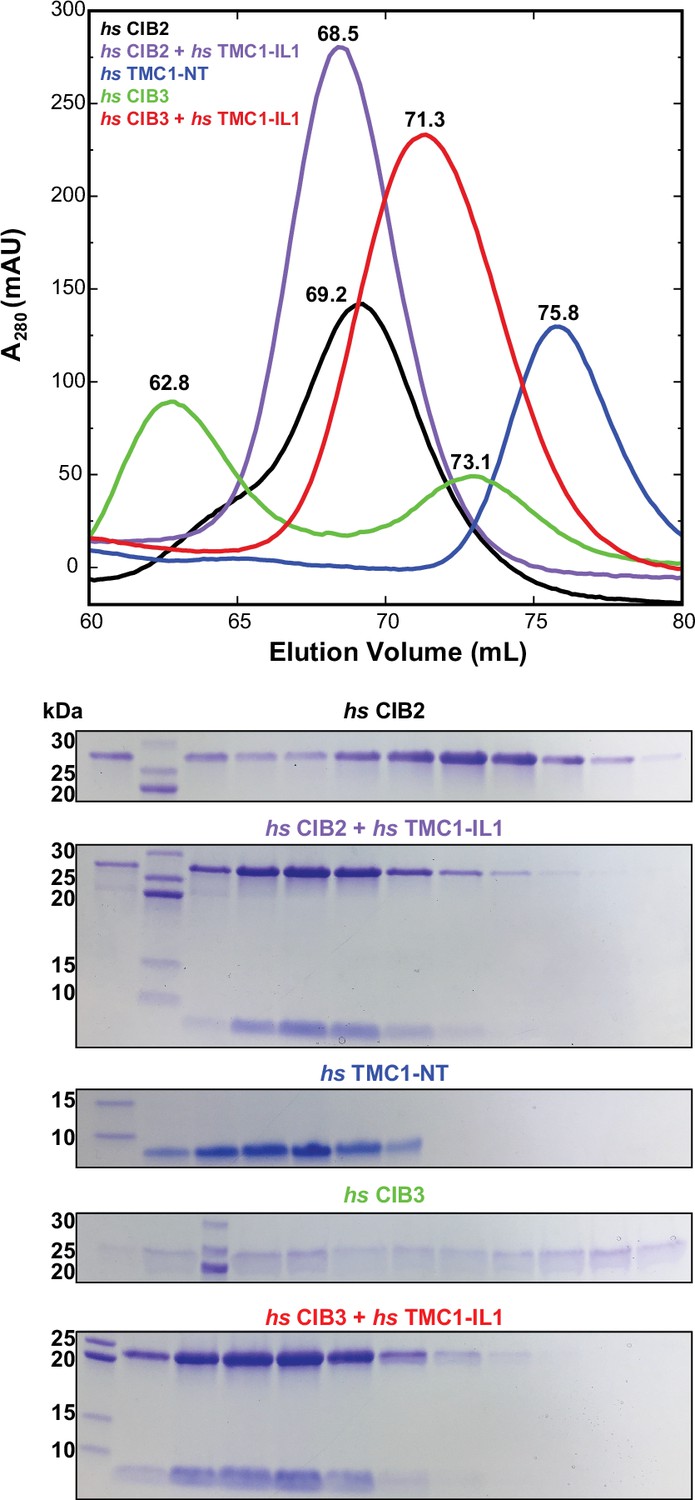
Size exclusion chromatography (SEC) of hs CIB2 and hs CIB3 either refolded alone or co-refolded with hs TMC1-IL1, and hs TMC1-NT.
Representative traces for hs CIB2 (black), hs CIB3 (green), hs CIB2 + hs TMC1-IL1 (violet), hs CIB3 + hs TMC1-IL1 (red) and hs TMC1-NT (blue). Traces for hs CIB2, hs CIB2 + hs TMC1-IL1, hs CIB3 + hs TMC1-IL1, and hs TMC1-NT show peaks at 69.2 mL, 68.5 mL, 71.3 mL, and 75.8 mL, respectively. Trace for hs CIB3 showed two peaks at 62.8 mL and 73.1 mL. Experiments were performed using a Superdex S75 16/600 column in the presence of 3 mM CaCl2. Coomassie-stained SDS-PAGE analyses of representative eluted fractions are shown below the chromatogram.
-
Figure 7—figure supplement 5—source data 1
Original SDS-PAGE gels and raw data for SEC plots.
- https://cdn.elifesciences.org/articles/89719/elife-89719-fig7-figsupp5-data1-v1.zip
Figure 7—figure supplement 6
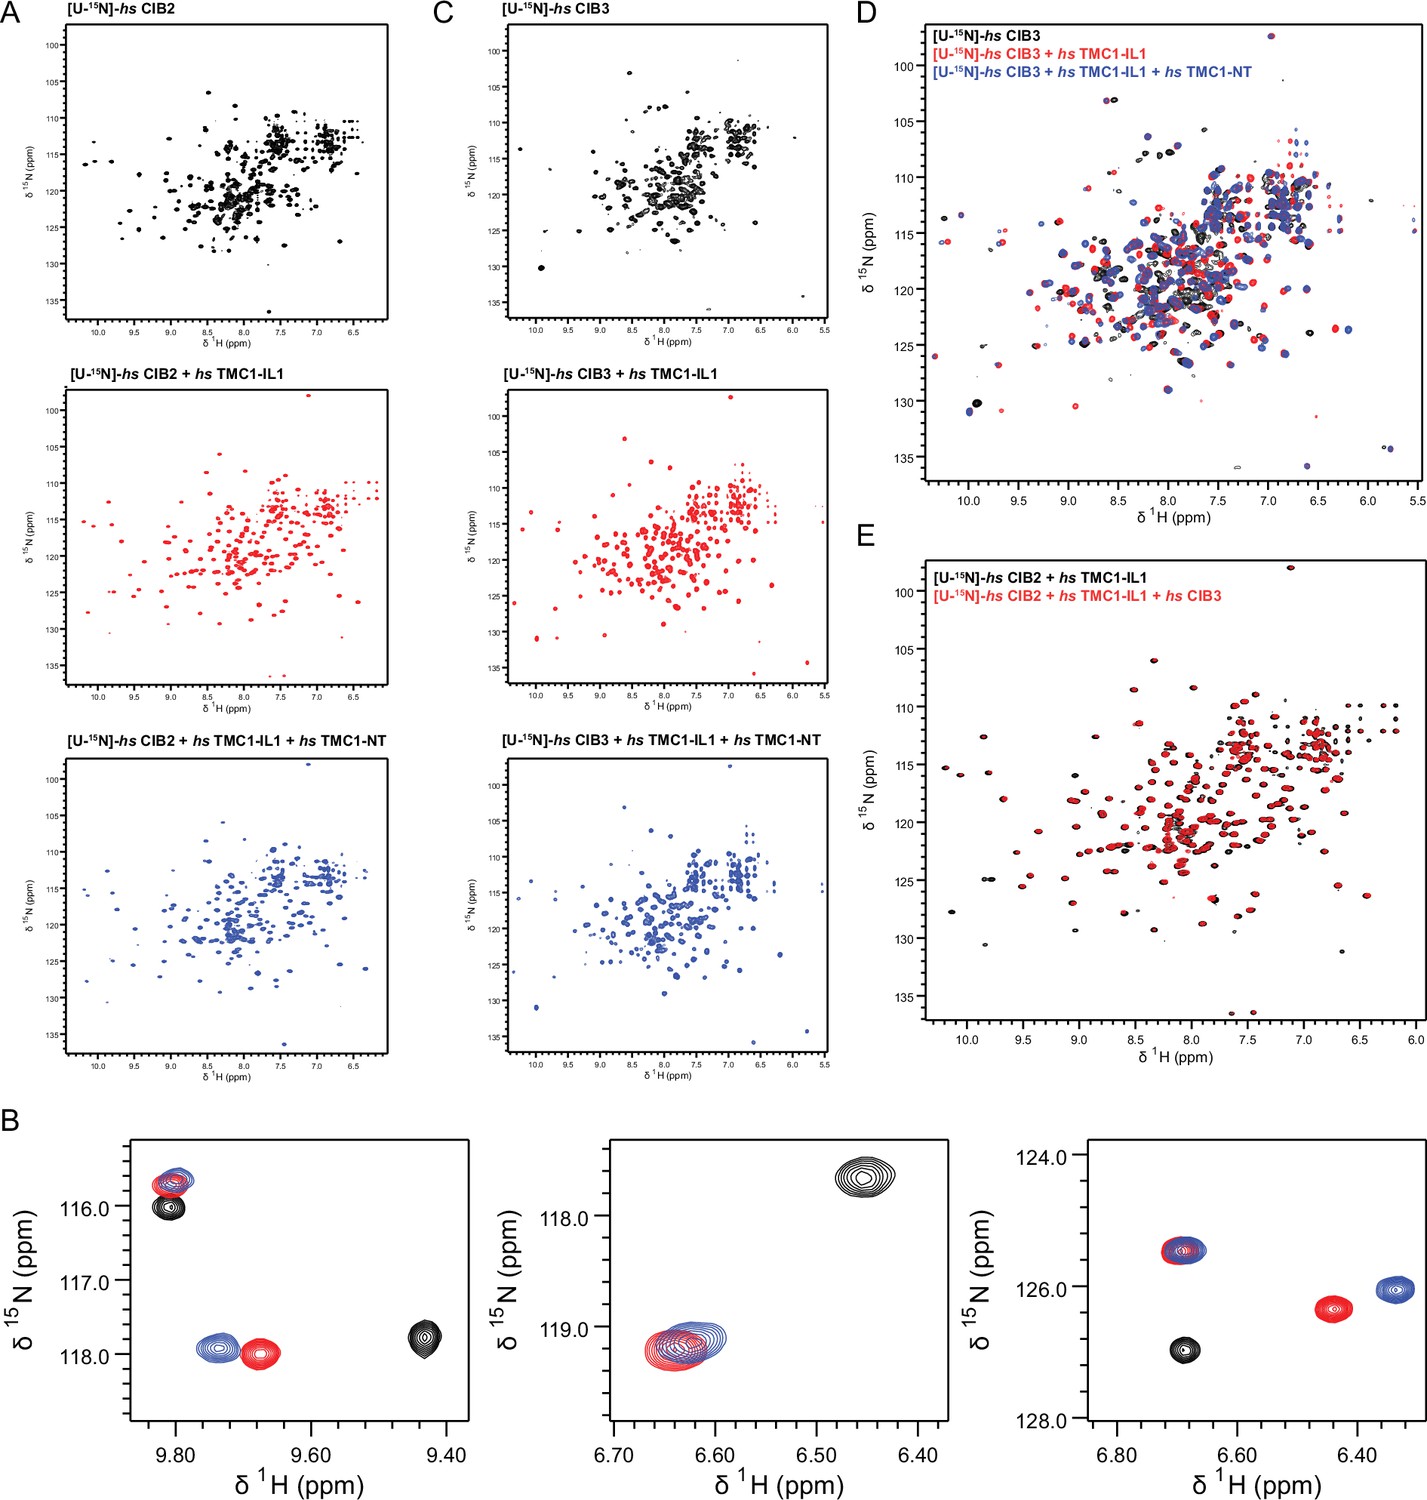
1H-15N TROSY-HSQC spectra of (A) hs CIB2, hs CIB2 + hs TMC1-IL1, and hs CIB2 + hs TMC1-IL1+ hs TMC1-NT individually (overlayed in Figure 7C).
(B) Zoomed in spectra highlighting peak shifts that correspond to hs TMC1-IL1 and subsequent hs TMC1-NT-binding. (C,D) Spectra of hs CIB3, hs CIB3 + hs TMC1-IL1, hs CIB3 + hs TMC1-IL1+ hs TMC1-NT individually and overlayed, respectively. (E) Overlayed spectra of hs CIB2 + hs TMC1-IL1 and hs CIB2 + hs TMC1-IL1+ hs CIB3. Nuclear magnetic resonance (NMR) data were obtained in the presence of 3 mM CaCl2. Some of these data are also shown in Figure 7.
Figure 7—video 1
Overview of hs TMC1 (light and dark purple) in complex with hs CIB2 (light sea green)-Ca2+ (green spheres).
K+ ions (pink) were shown to be permeating the pore region between α4 and α6. Water molecules, lipids, and protein side chains were omitted for clarity.
Figure 8 with 6 supplements
Simulations of AF2 predictions show that human TMC1 and CIB2 complexes form cation channels.
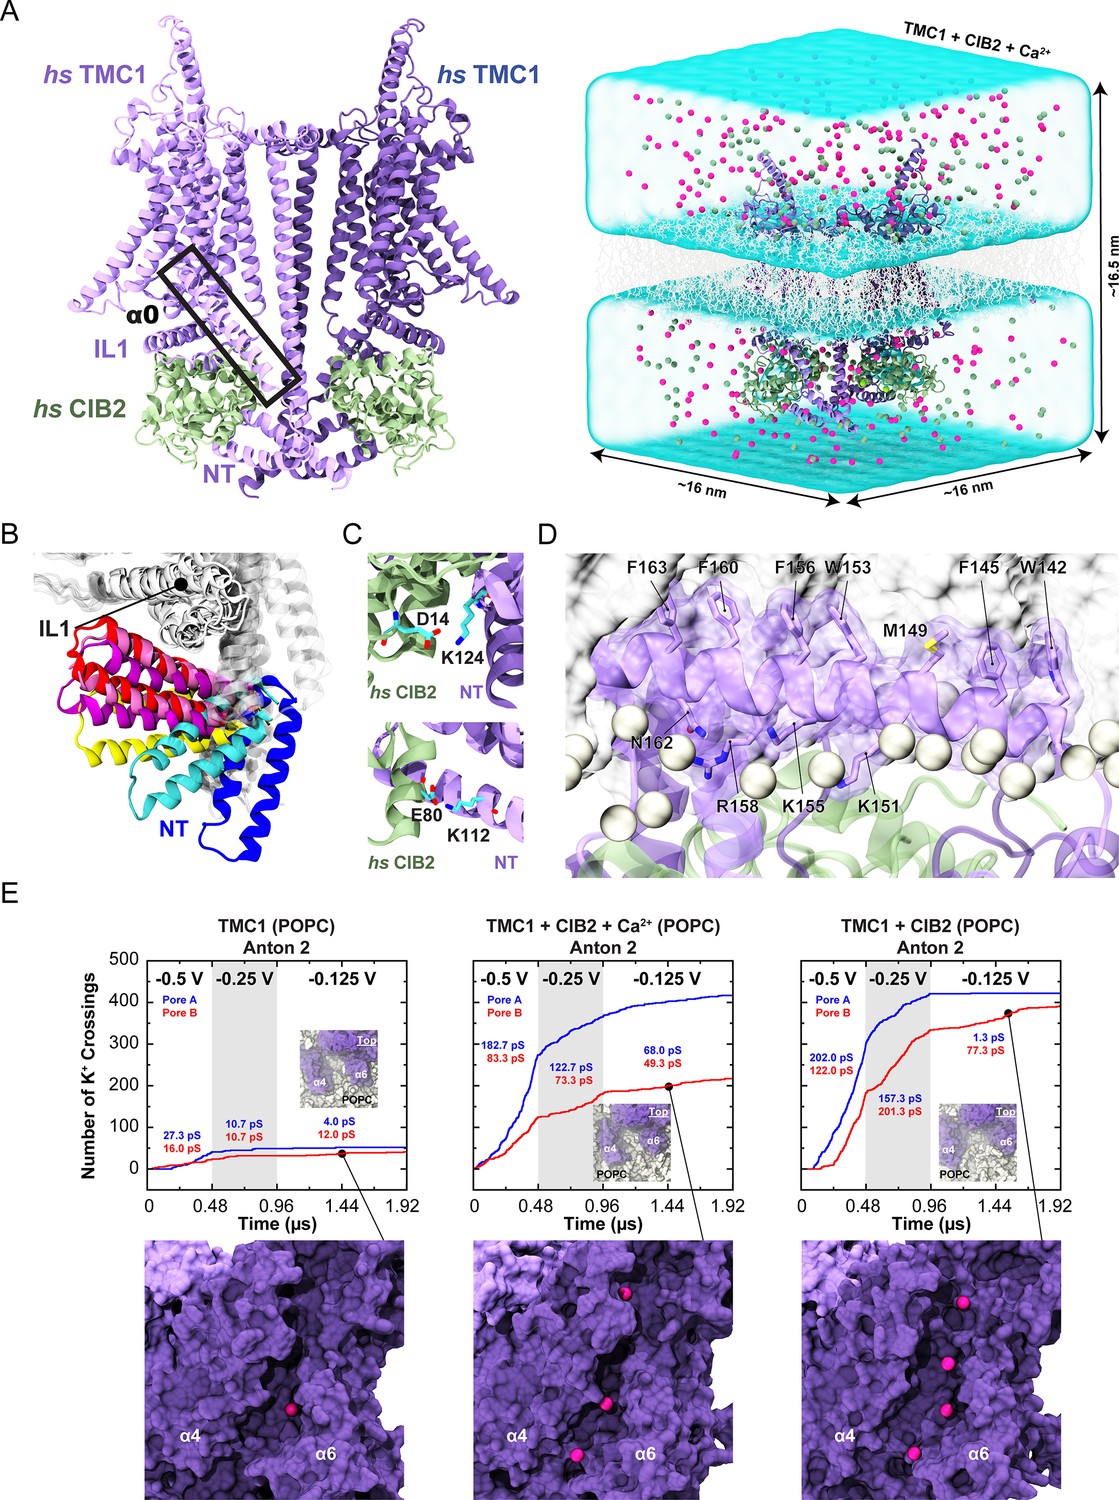
(A) Left: AF2 model of the dimeric hs TMC1 + hs CIB2 complex. Right: A complete simulation system of hs TMC1 in complex with hs CIB2-Ca2+ is shown in surface representation. hs TMC1 is shown in light (monomer A) and dark (monomer B) purple, hs CIB2 in light sea green, water in transparent light blue, lipid membrane in gray lines, and K+ and Cl- ions are shown as pink and green spheres, respectively. (B) The hs TMC1-NT domain explores diverse conformational space in the absence of CIB during equilibrium simulations (S3a). (C) Salt bridges K124:D14 and K112:E80 remain throughout equilibrium simulations. (D) Snapshot of amphipathic helix α0 inserting into the lipid bilayer (S4c). (E) Number of K+ crossings as a function of time for pores A and B of hs TMC1, hs TMC1 + hs CIB2 + Ca2+, and hs TMC1 + hs CIB2 in a POPC bilayer at –0.5 V, –0.25 V, and –0.125 V. Insets show top views of pore region with TMC1 (dark purple) and lipids (light gray) in surface representation (protein and lipids partially excluded for clarity). Representative images of K+ permeating the pore region between α4 and α6 of hs TMC1 are shown with protein in surface representation and ions as pink spheres. Conductance values calculated for K+ crossings. Plots are concatenated from Figure 8—figure supplement 4.
-
Figure 8—source data 1
Summary of simulations.
- https://cdn.elifesciences.org/articles/89719/elife-89719-fig8-data1-v1.pdf
-
Figure 8—source data 2
Ion conduction.
- https://cdn.elifesciences.org/articles/89719/elife-89719-fig8-data2-v1.pdf
Figure 8—figure supplement 1
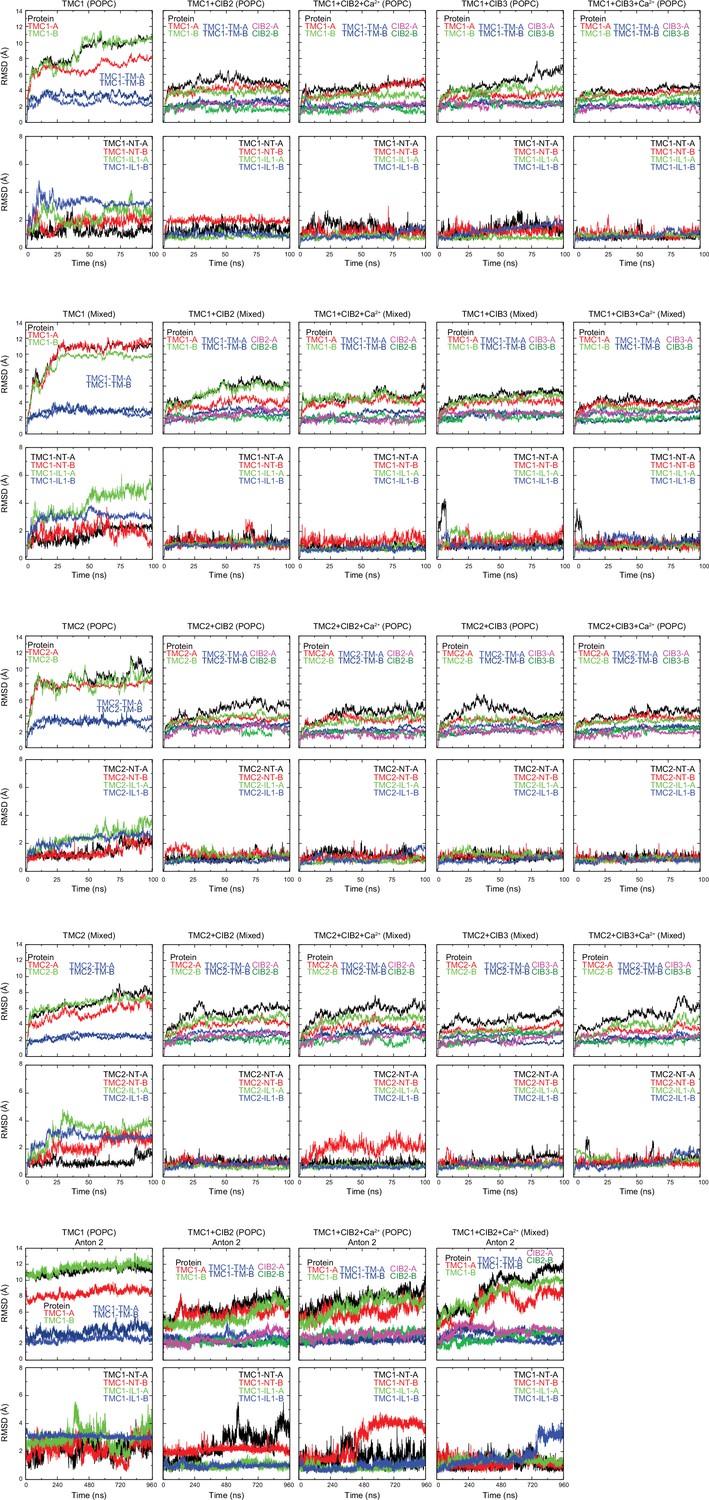
Stability of TMC + CIB complexes, monomers, and subdomains.
RMSDs of the full protein (ALL), TMC monomers A and B (TMC1/2 A and TMC1/2-B), transmembrane helices of TMC monomers A and B (TMC1/2-TM-A and TMC1/2-TM-B), and CIB monomers are shown on top for each simulated system as labeled. RMSDs for TMC-NT and -IL1 fragments are shown on bottom plots. RMSD values were calculated for Cα atoms after alignment to the initial frame of each trajectory. For Anton 2 trajectories, RMSD values were calculated for Cα atoms after alignment to the initial frame of their respective NAMD trajectory.
-
Figure 8—figure supplement 1—source data 1
Raw data for RMSD plots.
- https://cdn.elifesciences.org/articles/89719/elife-89719-fig8-figsupp1-data1-v1.zip
Figure 8—figure supplement 2
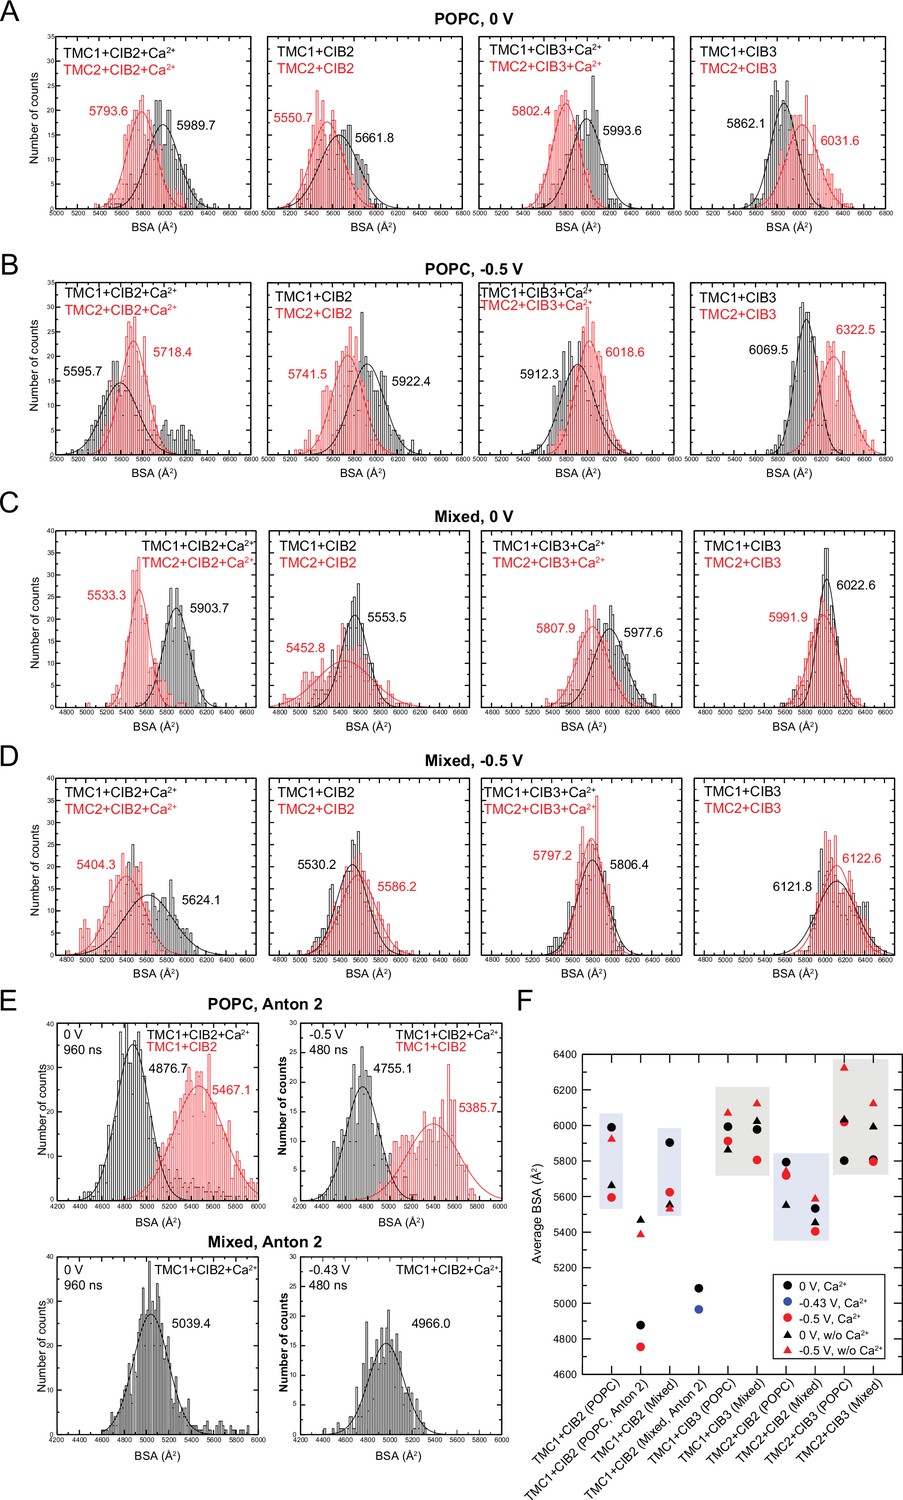
Buried surface area (BSA) in hs TMC1/2 and hs CIB2/3 complexes.
(A) Histogram plots for BSA values computed for POPC systems during equilibrium simulations (10–100 ns). (B) Histogram plots for BSA values computed for POPC systems during simulations at –0.5 V (100–200 ns). (C) Histogram plots for BSA values computed for mixed membrane systems during equilibrium simulations (10–100 ns). (D) Histogram plots for BSA values computed for mixed membrane systems during simulations at –0.5 V (100–200 ns). (E) Histogram plots for BSA values computed for POPC and mixed membrane systems during Anton 2 simulations at 0 V (0–960 ns), –0.43 V (240–720 ns for mixed system), and –0.5 V (and 960–1440 ns for POPC systems). BSA count distributions for all plots were fitted to a normal distribution with mean BSA values labeled with corresponding colors. (F) Summary of mean BSA values.
-
Figure 8—figure supplement 2—source data 1
Raw data for BSA in hs TMC1/2 and hs CIB2/3 complexes.
- https://cdn.elifesciences.org/articles/89719/elife-89719-fig8-figsupp2-data1-v1.zip
Figure 8—figure supplement 3
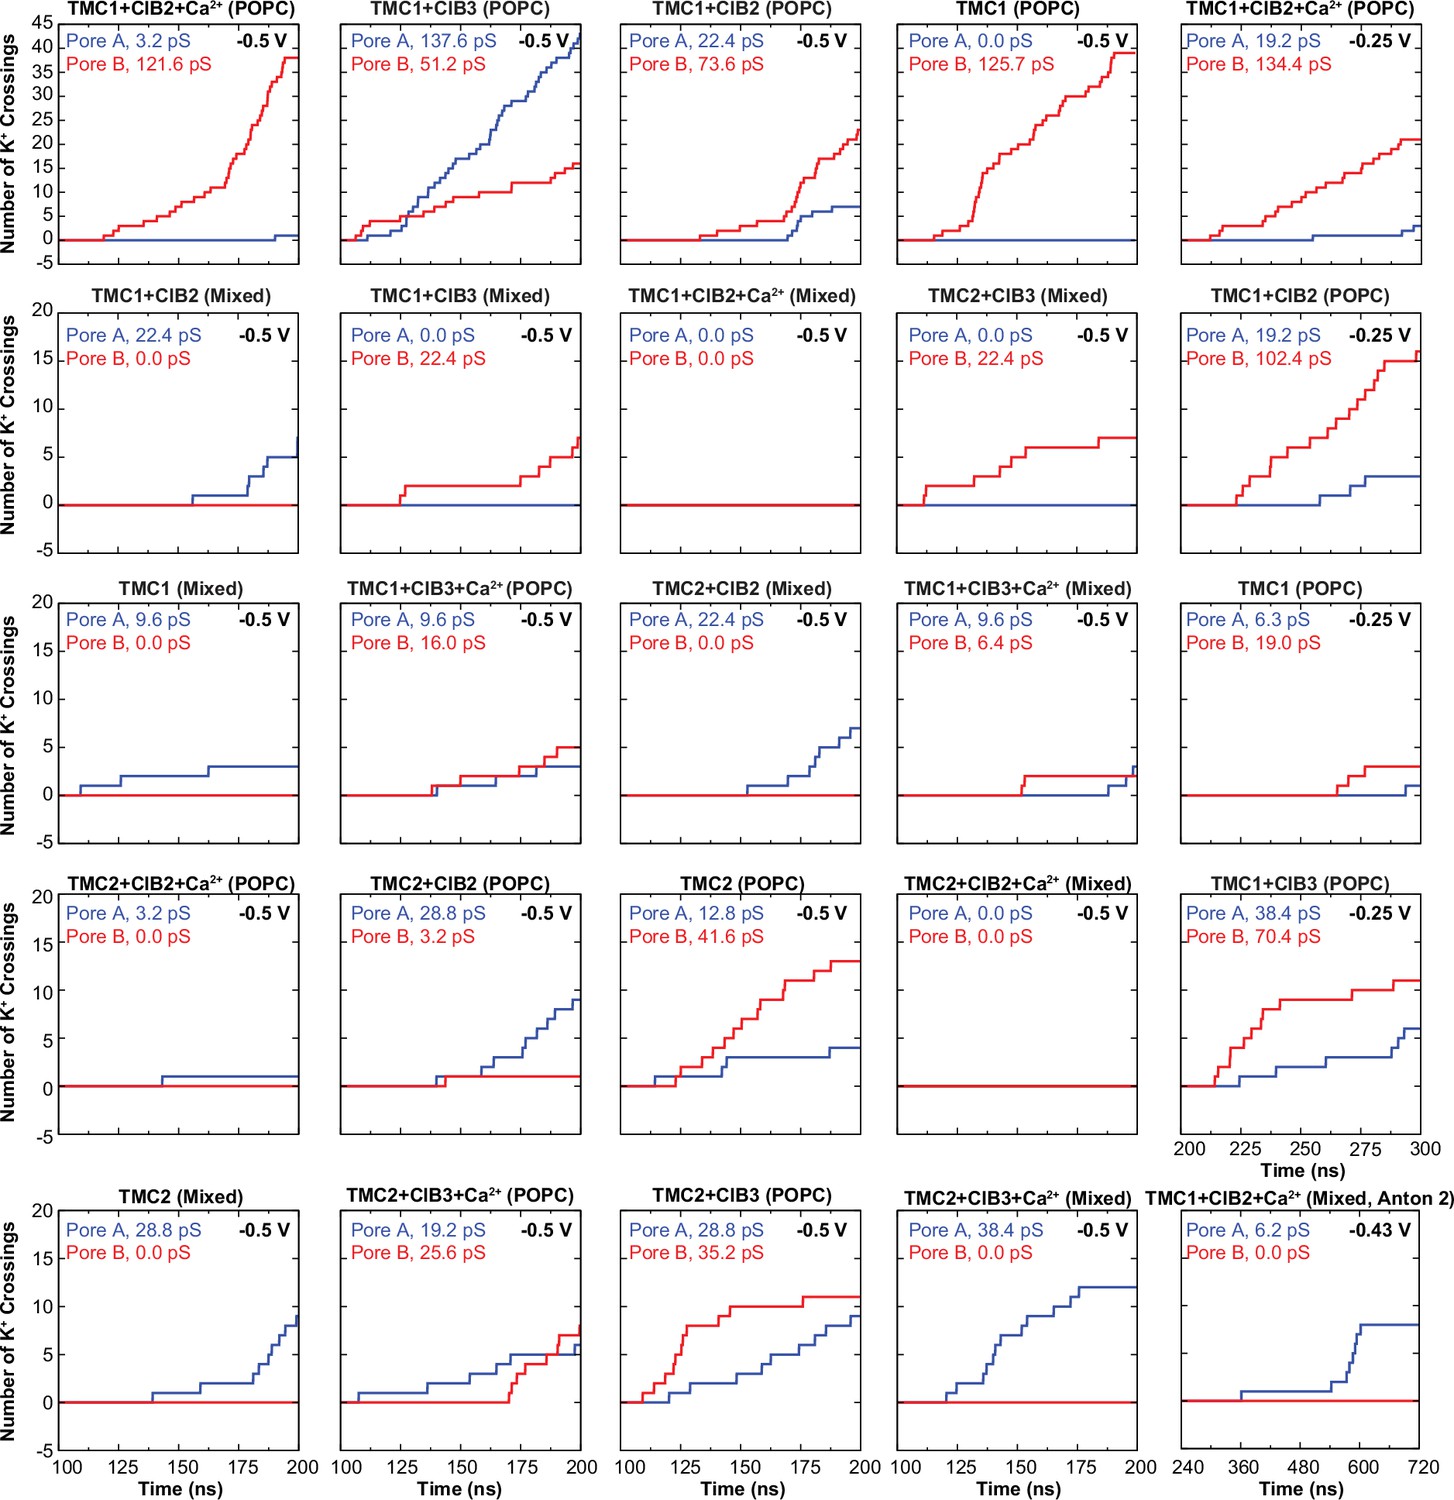
Number of K+ crossings as a function of time for pores A and B of hs TMC1 and hs TMC2.
Plots for systems simulated at –0.5 V are shown to start after 100 ns of equilibration and lasting 100 ns of simulation (200 ns total). Plots for systems simulated at –0.25 V are shown to start after 100 ns of equilibration +100 ns of simulation at –0.5 V (200 ns) and lasting 100 ns (300 ns total). Plot for system simulated in Anton 2 shown to start after 240 ns of equilibration +480 ns of simulation at –0.43 V (720 ns total). Conductance values calculated for K+ crossings.
-
Figure 8—figure supplement 3—source data 1
Raw data for number of K+ crossings as a function of time for pores A and B of hs TMC1 and hs TMC2.
- https://cdn.elifesciences.org/articles/89719/elife-89719-fig8-figsupp3-data1-v1.zip
Figure 8—figure supplement 4
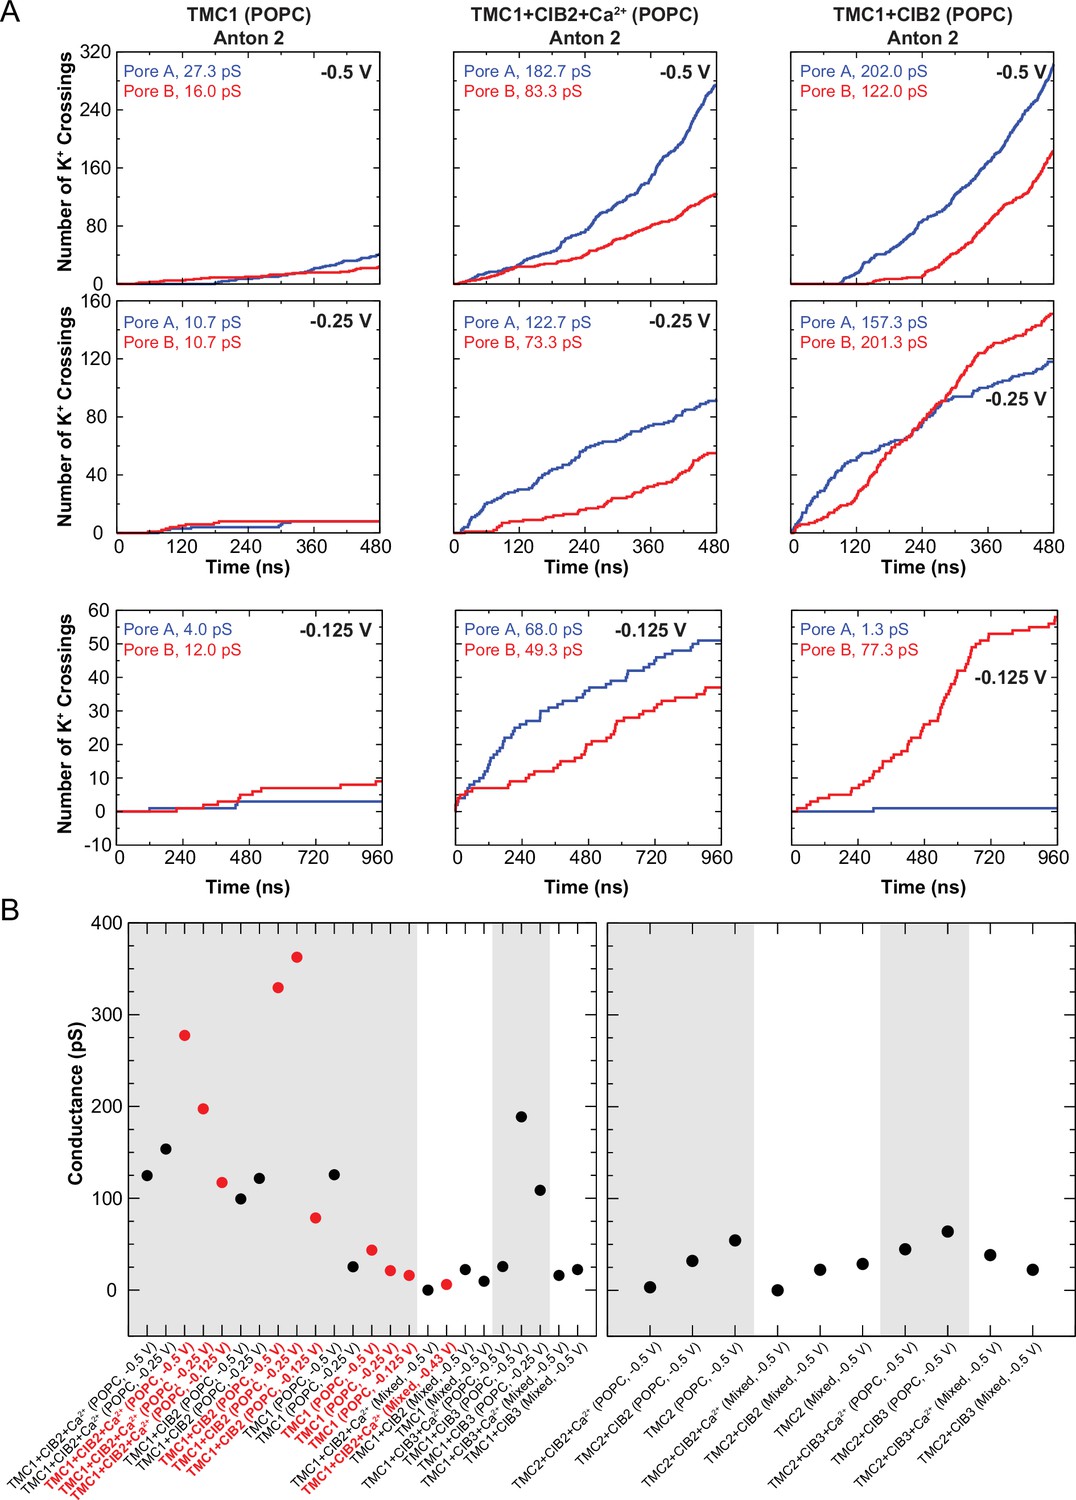
Conduction events in long timescale simulations and summary of predicted conductance values.
(A) Number of K+ crossings as a function of time for pores A and B of hs TMC1 simulated in Anton 2. Plots are concatenated in Figure 8E. (B) Summary of predicted conductance values obtained from all simulations of TMC1 (left) and TMC2 (right). Gray shadow denotes POPC systems. Red circles are for Anton 2 simulations. Conductance values for each system were plotted as a sum of both pores. Conductance values calculated for K+ crossings.
-
Figure 8—figure supplement 4—source data 1
Raw data for conduction events in long timescale simulations and summary of predicted conductance values.
- https://cdn.elifesciences.org/articles/89719/elife-89719-fig8-figsupp4-data1-v1.zip
Figure 8—figure supplement 5
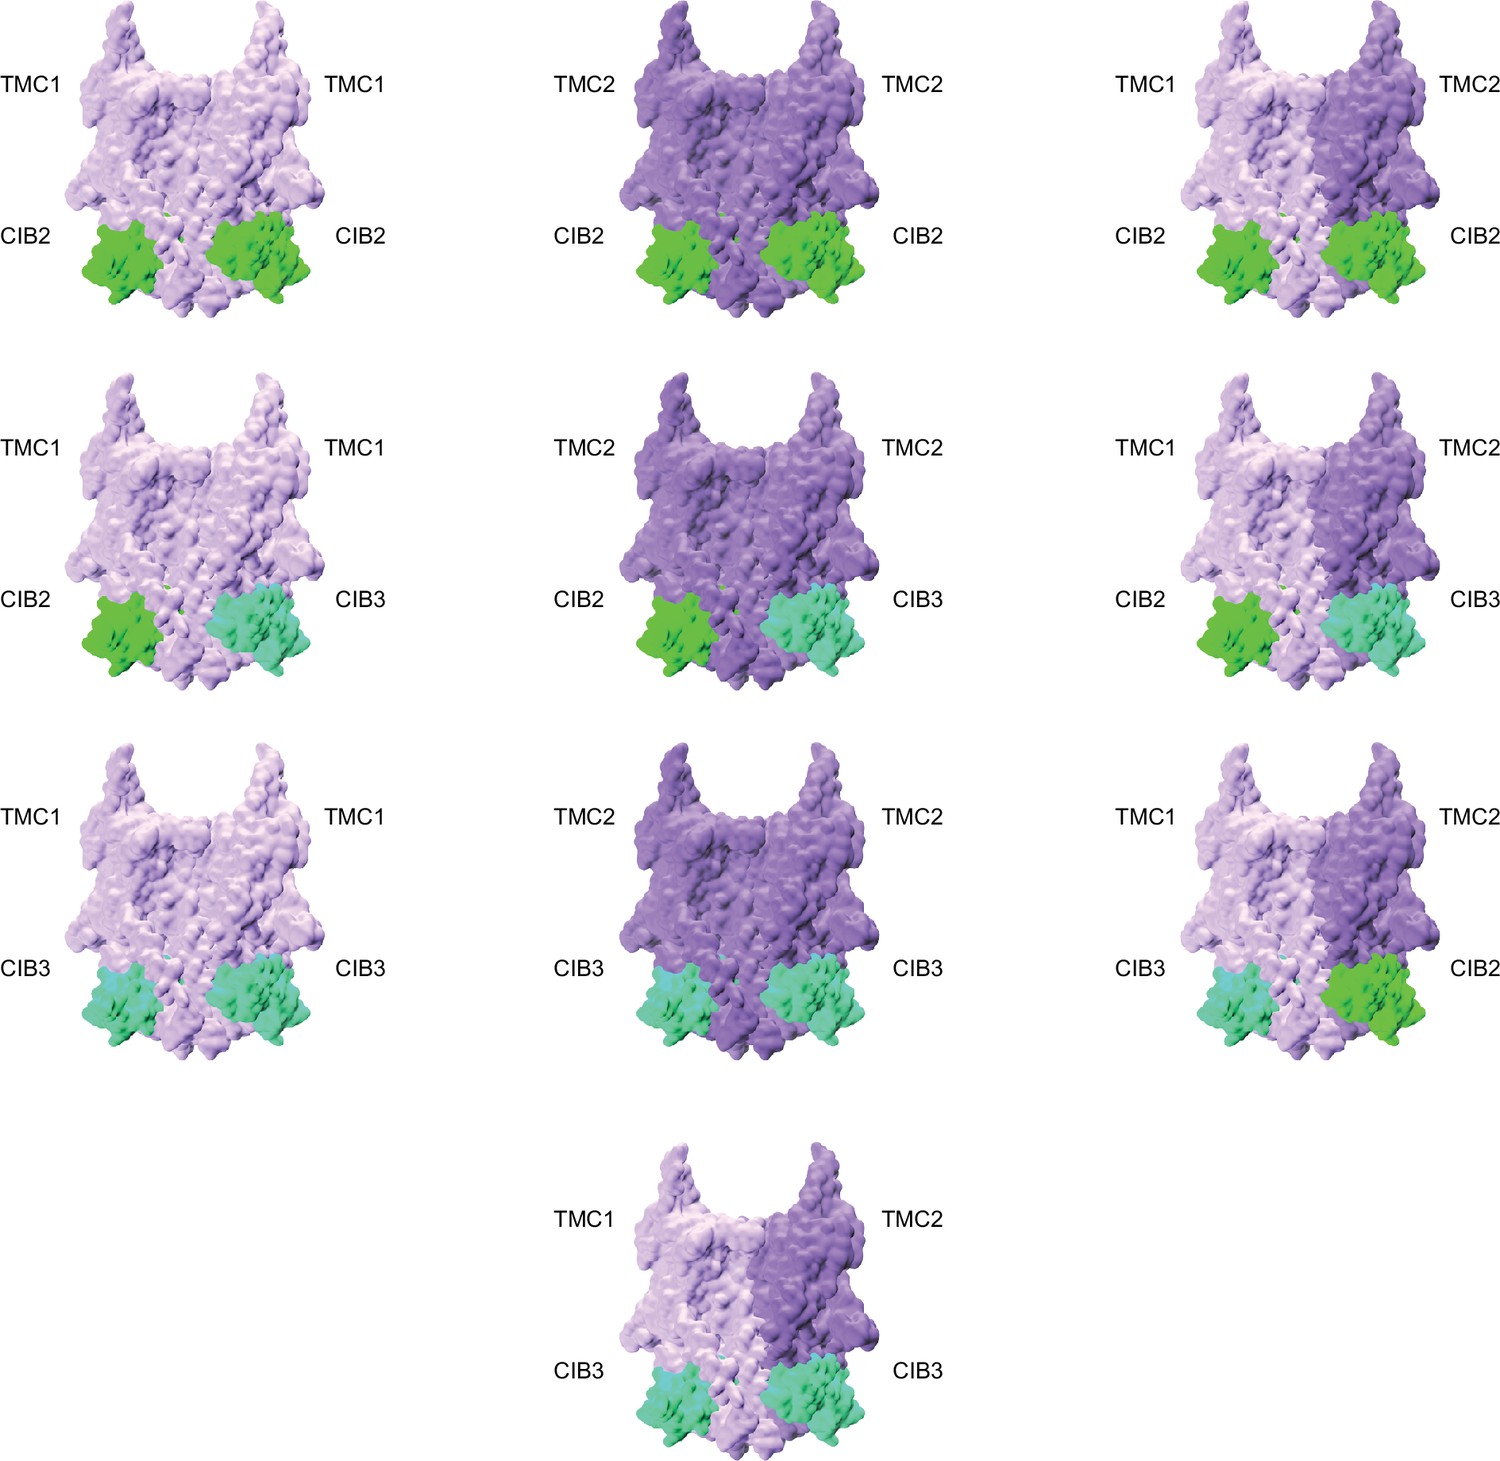
Possible combinations of TMC1, TMC2, CIB2, and CIB3 complexes.
Figure 8—video 1
Side view of the hs TMC1 channel pore during a trajectory at –0.5 V (monomer B).
K+ (pink) are seen permeating the pore from one side (S1b); hs TMC1 (monomer B) is shown in dark purple and hs CIB2 is shown in light sea green. Water molecules, lipids, hs TMC1 (monomer A), and protein side chains were omitted for clarity.
Author response image 1

Superposition of CALM-1 structure blue; Jeong et al., 2022) and AlphaFold 2 model of CIB2 (red).
Calcium ions are shown as green spheres.
Tables
Key resources table
| Reagent type (species) or resource | Designation | Source or reference | Identifiers | Additional information |
|---|---|---|---|---|
| Antibody | Goat anti-Mouse polyclonal IgG (H+L) Highly Cross-Adsorbed Secondary Antibody, Alexa Fluor 568 | Thermo Fisher Scientific | Cat#A-11031; RRID:AB_144696 | Dilution, 1:1000 |
| Antibody | Goat anti-Mouse polyclonal IgG (H+L) Secondary Antibody, Alexa Fluor 488 | Thermo Fisher Scientific | A32723 | Dilution, 1:1000 |
| Antibody | Goat anti-Rabbit polyclonal IgG (H+L) Highly Cross-Adsorbed Secondary Antibody, Alexa Fluor 488 | Thermo Fisher Scientific | Cat#A-11034; RRID:AB_2576217 | Dilution, 1:1000 |
| Antibody | Goat anti-rabbit polyclonal IgG (H+L) Secondary Antibody, Alexa Fluor 568 | Thermo Fisher Scientific | A-11011 | Dilution, 1:1000 |
| Antibody | Mouse monoclonal anti-FLAG M2 | Sigma-Aldrich | Cat#F3165; RRID:AB_25959 | Dilution, 1:1000 |
| Antibody | Mouse monoclonal anti-FLAG M2-HRP | Thermo Fisher Scientific | Cat#A8592; RRID:AB_439702 | Dilution, 1:200 |
| Antibody | Mouse monoclonal anti-V5 | Thermo Fisher Scientific | Cat# R960-25; RRID:AB_2556564 | Dilution, 1:200 |
| Antibody | Mouse monoclonal anti-V5-HRP | Thermo Fisher Scientific | Cat#R961-25; RRID:AB_2556565 | Dilution, 1:5000 |
| Antibody | Mouse monoclonal GAPDH | Santa Cruz | sc-32233 | Dilution, 1:1000 |
| Antibody | Rabbit polyclonal anti-CIB3 | Sigma | SAB2103524 | 1 µg/mL |
| Antibody | Rabbit polyclonal anti-GFP | Invitrogen | A-11122 | Dilution, 1:1000 |
| Antibody | Rabbit polyclonal anti-GFP-HRP | Thermo Fisher Scientific | Cat#A10260; RRID:AB_2534022 | Dilution, 1:500 |
| Antibody | Rabbit polyclonal anti-Myosin VIIa | Proteus Biosciences | #25–6790 | Dilution, 1:500 and 1:1000 |
| Antibody | Rabbit polyclonal anti-V5 | Abcam | Cat#ab9116; RRID:AB_307024 | Dilution, 1:1000 |
| Chemical compound, drug | FM 1–43 FX | Thermo Fisher Scientific | F35355 | |
| Chemical compound, drug | FM 1–43 | Thermo Fisher Scientific | T3163 | |
| Chemical compound, drug | FM 4–64 | Thermo Fisher Scientific | T13320 | |
| Chemical compound, drug | Alexa Fluor 488 Phalloidin | Thermo Fisher Scientific | A12379 | |
| Chemical compound, drug | Alexa Fluor 633 Phalloidin | Thermo Fisher Scientific | A22284 | |
| Chemical compound, drug | 16% Paraformaldehyde | Electron Microscopy Sciences | 50-980-487 | |
| Chemical compound, drug | Triton X-100 | Polysciences | 04605–250 | |
| Chemical compound, drug | DAPI (4',6-Diamidino-2-Phenylindole, Dihydrochloride) | Invitrogen | D1306 | |
| Chemical compound, drug | Protease inhibitor mixture | Roche | 11697498001 | |
| Chemical compound, drug | Protein A–Sepharose CL-4 | Thermo Fisher Scientific | 101042 | |
| Chemical compound, drug | Polyethylenimine | Polysciences | 23966 | |
| Commercial assay or kit | 4–20% Tris-Glycine gel | Novex | XV04205PK20 | |
| Commercial assay or kit | SMARTScribe Reverse Transcriptase kit | Clontech | 639537 | |
| Commercial assay or kit | SYBRgreen technology | Qiagen | 330503 | |
| Commercial assay or kit | Amersham ECL Prime Western Blotting Detection Reagent | GE Healthcare | RPN2236 | |
| Commercial assay or kit | QIAshredder | Qiagen | Cat#79656 | |
| Commercial assay or kit | Trans-Blot Turbo Transfer System | Bio-Rad | Cat#1704156 | |
| Commercial assay or kit | Trans-Blot Turbo Midi PVDF Transfer Packs | Bio-Rad | Cat#1704157 | |
| Commercial assay or kit | 4–20% Mini-PROTEAN TGX Stain-Free Protein Gels | Bio-Rad | Cat#4568094 | |
| Commercial assay or kit | 4–20% Criterion TGX Stain-Free Protein Gel | Bio-Rad | Cat#5678094 | |
| Commercial assay or kit | GFP-Trap Magnetic Agarose | Chromotek | Cat#gtma-20 | |
| Commercial assay or kit | Anti-v5 agarose affinity gel | Sigma-Aldrich | Cat#A7345 | |
| Commercial assay or kit | Anti-FLAG M2 Magnetic Beads | Sigma-Aldrich | Cat#M8823 | |
| Commercial assay or kit | Nunc Lab-Tek chambered coverglass | Thermo Fisher Scientific | Cat#155411PK | |
| Commercial assay or kit | Lipofectamine 3000 Transfection Reagent | Thermo Fisher Scientific | Cat#L3000015 | |
| Strain, strain background (mouse) | Cib2tm1a | EUCOMM | ||
| Strain, strain background (mouse) | Cib3KO | This study | N/A | |
| Strain, strain background (zebrafish) | cib2idc21 zebrafish | This study | ZDB-ALT-221219–2 | |
| Strain, strain background (zebrafish) | cib3idc22 zebrafish | This study | ZDB-ALT-221219–3 | |
| Strain, strain background (zebrafish) | Tg(myo6b:GCaMP6s-CAAX)idc1 zebrafish | Sheets et al., 2017 | ZDB-ALT-170113–3 |
Additional files
Download links
A two-part list of links to download the article, or parts of the article, in various formats.
Downloads (link to download the article as PDF)
Open citations (links to open the citations from this article in various online reference manager services)
Cite this article (links to download the citations from this article in formats compatible with various reference manager tools)
Complexes of vertebrate TMC1/2 and CIB2/3 proteins form hair-cell mechanotransduction cation channels
eLife 12:RP89719.
https://doi.org/10.7554/eLife.89719.3


