PSTPIP2 ameliorates aristolochic acid nephropathy by suppressing interleukin-19-mediated neutrophil extracellular trap formation
- Inflammation and Immune Mediated Diseases Laboratory of Anhui Province, Anhui Institute of Innovative Drugs, School of Pharmacy, Anhui Medical University, China
Figures
Figure 1 with 1 supplement
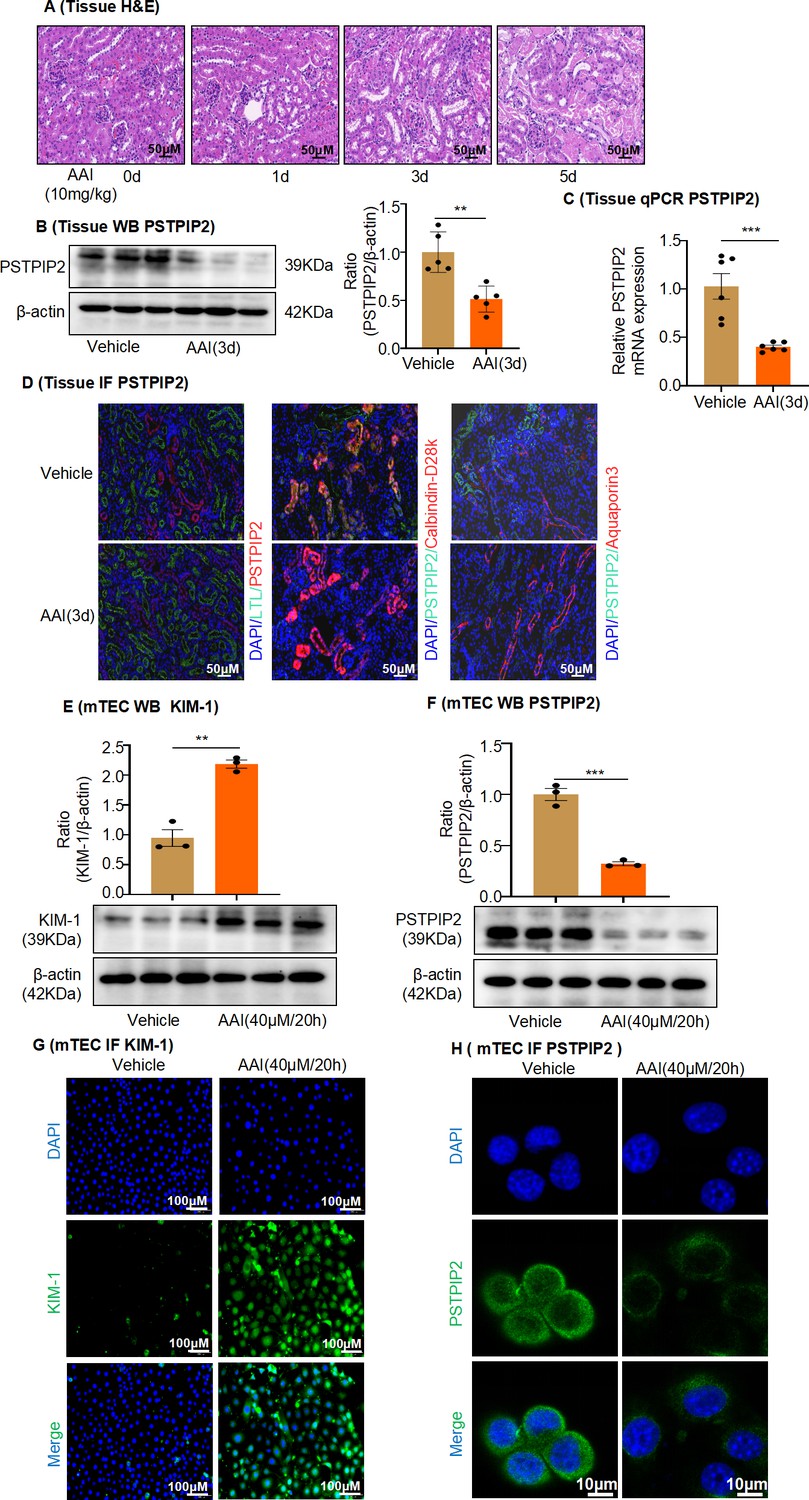
PSTPIP2 expression was decreased in the aristolochic acid I (AAI)-induced acute aristolochic acid nephropathy model in vivo and injured mouse renal tubular epithelial cells (mRTECs) in vitro.
(A) Representative H&E-stained images of kidney sections. Kidneys were isolated on day 0, 1, 3, and 5 after AAI treatment (n = 6 per group). Scale bar, 50 μm. (B) Western blotting analysis of PSTPIP2 expression in kidney tissue lysates, which were isolated on day 3 after AAI treatment. β-Actin was used as a loading control. Quantification of the PSTPIP2/β-actin ratio (n = 5 per group). (C) Real-time PCR analysis of PSTPIP2 expression in kidney tissue, which were isolated on day 3 after AAI treatment. β-Actin was used as a loading control (n = 6 per group). (D) Immunofluorescence (IF) staining of PSTPIP2, lotus tetragonolobus lectin (LTL) (a proximal tubule marker), calbindin D28k (a distal tubule marker), and aquaporin-3 (a collecting duct marker) in kidney tissues. DAPI was used for nuclear staining (n = 6 per group). Scale bar, 50 μm. (E) Protein levels of kidney injury molecule-1 (KIM-1) in mRTECs treated with AAI (40 μM/20 hr) based on western blotting. Quantification of the KIM-1/β-actin ratio (n = 3). (F) Protein levels of PSTPIP2 in mRTECs treated with AAI (40 μM/20 hr) analyzed by western blotting. Quantification of the PSTPIP2/β-actin ratio (n = 3). (G) Protein levels of KIM-1 in mRTECs treated with AAI (40 μM/20 hr) analyzed by IF (n = 3). Scale bar, 100 μm. (H) Protein levels of PSTPIP2 in mRTECs treated with AAI (40 μM/20 hr) analyzed by IF (n = 3). Scale bar, 10 μm. Data are presented as the mean ± SEM of 3–6 biological replicates per condition. Each dot represents a sample. Significant differences were determined by an independent sample t-test (B, C, E, F). *p<0.05, **p<0.01, ***p<0.001, ns: nonsignificant.
-
Figure 1—source data 1
Data represented by each point in Figure 1B, C, E, and F.
- https://cdn.elifesciences.org/articles/89740/elife-89740-fig1-data1-v2.zip
-
Figure 1—source data 2
Uncropped western blots for Figure 1B, E, and F.
- https://cdn.elifesciences.org/articles/89740/elife-89740-fig1-data2-v2.zip
Figure 1—figure supplement 1
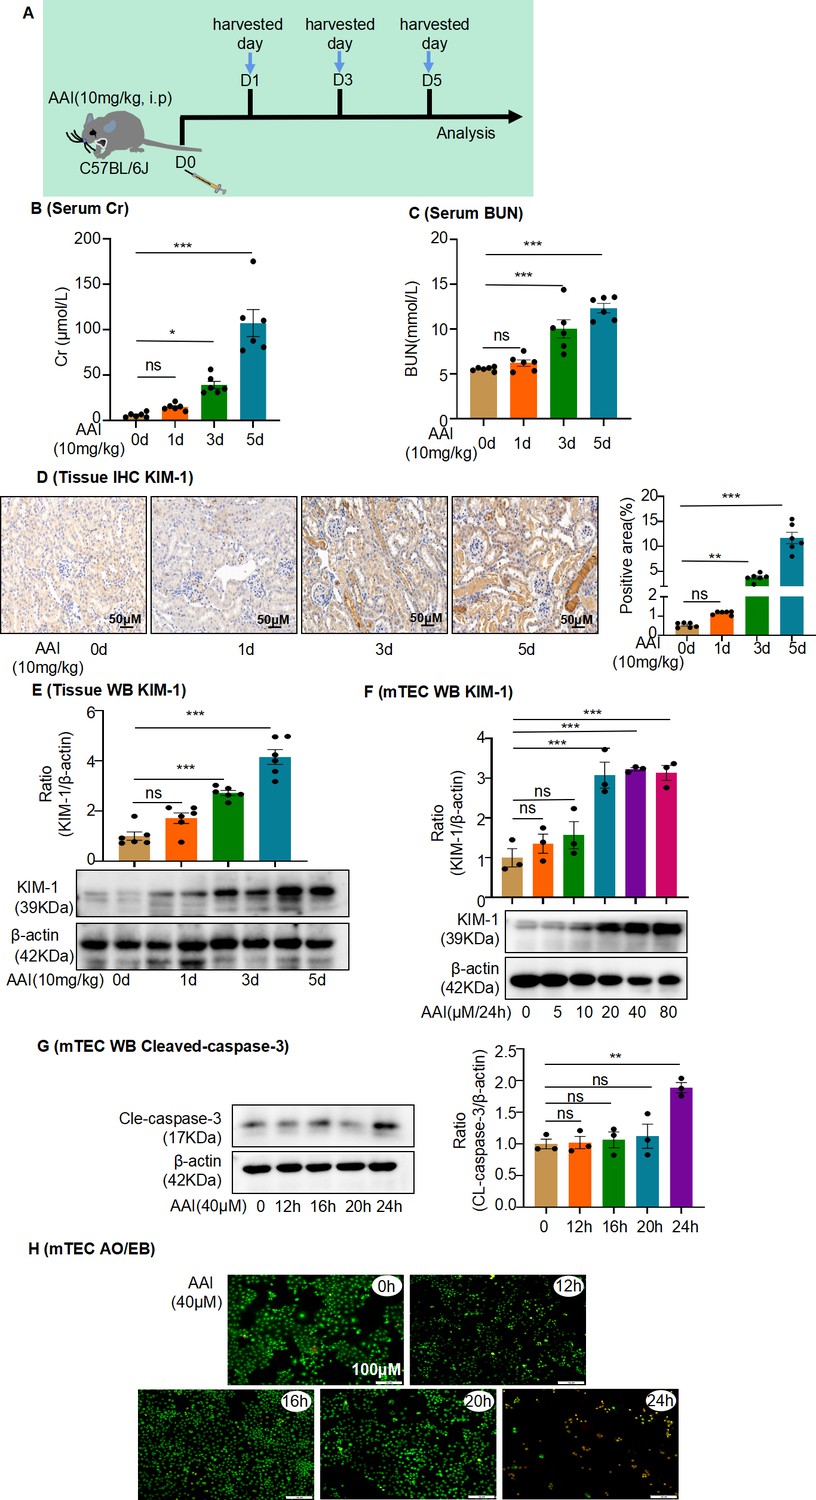
Aristolochic acid I (AAI)-induced acute aristolochic acid nephropathy (AAN) in vivo model and mouse renal tubular epithelial cell (mRTEC) injury in vitro model.
(A) Establishment of AAI-induced acute AAN mouse model (n = 6 per group). (B) Serum creatinine (Cr) assay at various times after AAI treatment (n = 6). (C) Blood urea nitrogen (BUN) assay at various times after AAI treatment (n = 6). (D) Immunohistochemistry of kidney injury molecule-1 (KIM-1) in different groups of kidney tissues. Positively stained areas were measured using Image-Pro Plus 6.0 (Media Cybernetics, Inc, Rockville, MD) (n = 6). Scale bar, 50 μm. (E) Protein level of KIM-1 assessed by western blotting at various times after AAI treatment (n = 6). (F) Protein level of KIM-1 after treatment with different AAI concentrations (n = 3). (G) Level of cleaved caspase-3 at different times after AAI (40 μM) treatment (n = 3). (H) Apoptosis was assessed by acridine orange–ethidium bromide staining (n = 3). Scale bar, 100 μm. Data are presented as the mean ± SEM of 3–6 biological replicates per condition. Each dot represents a sample. Significant differences were determined by an independent sample t-test and one-way ANOVA followed by Tukey’s post hoc test. *p<0.05, **p<0.01, ***p<0.001, ns: nonsignificant.
-
Figure 1—figure supplement 1—source data 1
Data represented by each point in Figure 1—figure supplement 1B–G.
- https://cdn.elifesciences.org/articles/89740/elife-89740-fig1-figsupp1-data1-v2.zip
-
Figure 1—figure supplement 1—source data 2
Uncropped western blots for Figure 1—figure supplement 1E–G.
- https://cdn.elifesciences.org/articles/89740/elife-89740-fig1-figsupp1-data2-v2.zip
Figure 2 with 1 supplement
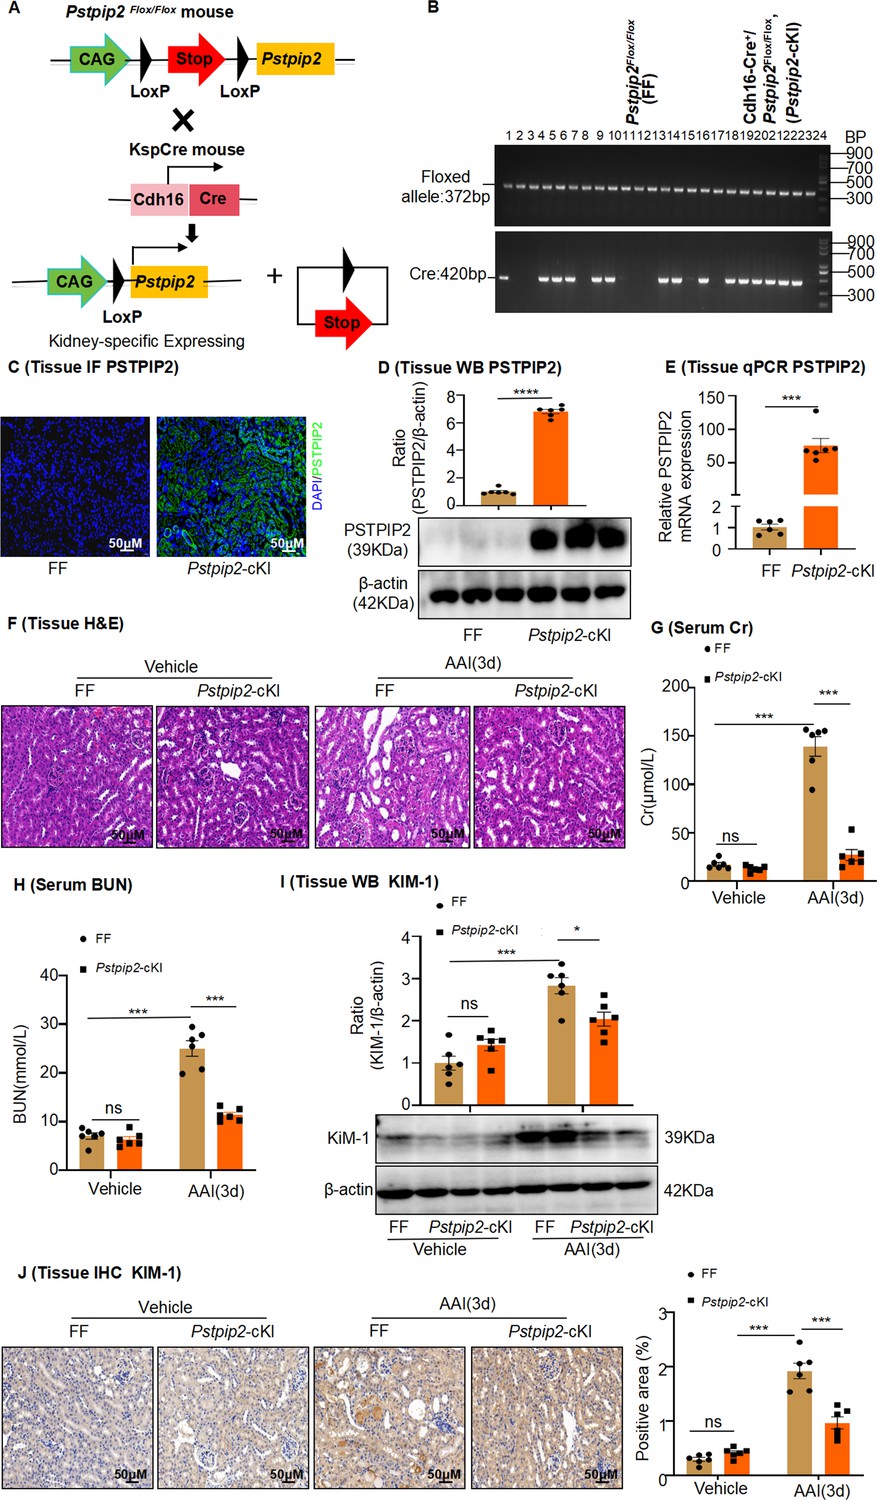
Pstpip2-cKI attenuates aristolochic acid I (AAI)-induced kidney damage.
(A) Scheme illustrating the genetic approach for generating Pstpip2 conditional knock-in (cKI) mice. (B) Genotypes of Pstpip2-cKI mice were confirmed using PCR. The floxed allele showed a 372-bp-sized band, and the Cre allele was 420 bp; 15 Cdh16-Cre+/ Pstpip2Flox/Flox (or Pstpip2-cKI) mice (#1, #4–6, #8, #9, #13, #14, #16, #18–23) and 9 Pstpip2Flox/Flox (or FF) mice (#2, #3, #7, #10–12, #15, #17, #24) are shown (n = 24). (C) Immunofluorescence (IF) staining of Pstpip2 in FF (n = 6) and Pstpip2-cKI (n = 6) mice. Scale bar, 50 μm. (D) Protein level of Pstpip2 in FF (n = 6) and Pstpip2-cKI (n = 6) mice assessed by western blotting. (E) mRNA level of Pstpip2 in FF (n = 6) and Pstpip2-cKI (n = 6) mice assessed by real-time PCR. (F) H&E staining of kidneys from FF (n = 6) and Pstpip2-cKI (n = 6) mice treated with AAI. Scale bar, 50 μm. (G, H) Serum creatinine (Cr) and blood urea nitrogen (BUN) assay. Serum Cr and BUN showed that Pstpip2 overexpression prevented renal dysfunction in AAI-induced nephropathy (n = 6 per group). (I) Expression of kidney injury molecule-1 (KIM-1) protein in kidney tissues from FF and Pstpip2-cKI mice treated with vehicle and AAI examined by western blotting (n = 6 per group). (J) Representative immunohistochemical (IHC) staining and KIM-1 levels in kidney tissues (n = 6 per group). Scale bar, 50 μm. Data are presented as the mean ± SEM of six biological replicates per condition. Each dot represents a sample. Significant differences were determined by an independent sample t-test (D, E) and one-way ANOVA followed by Tukey’s post hoc test (G–J). *p<0.05, **p<0.01, ***p<0.001, ns: non-significant.
-
Figure 2—source data 1
Data represented by each point in Figure 2D, E, G, H, I, and J.
- https://cdn.elifesciences.org/articles/89740/elife-89740-fig2-data1-v2.zip
-
Figure 2—source data 2
Uncropped western blots and gel electrophoresis for Figure 2B, D, and I.
- https://cdn.elifesciences.org/articles/89740/elife-89740-fig2-data2-v2.zip
Figure 2—figure supplement 1
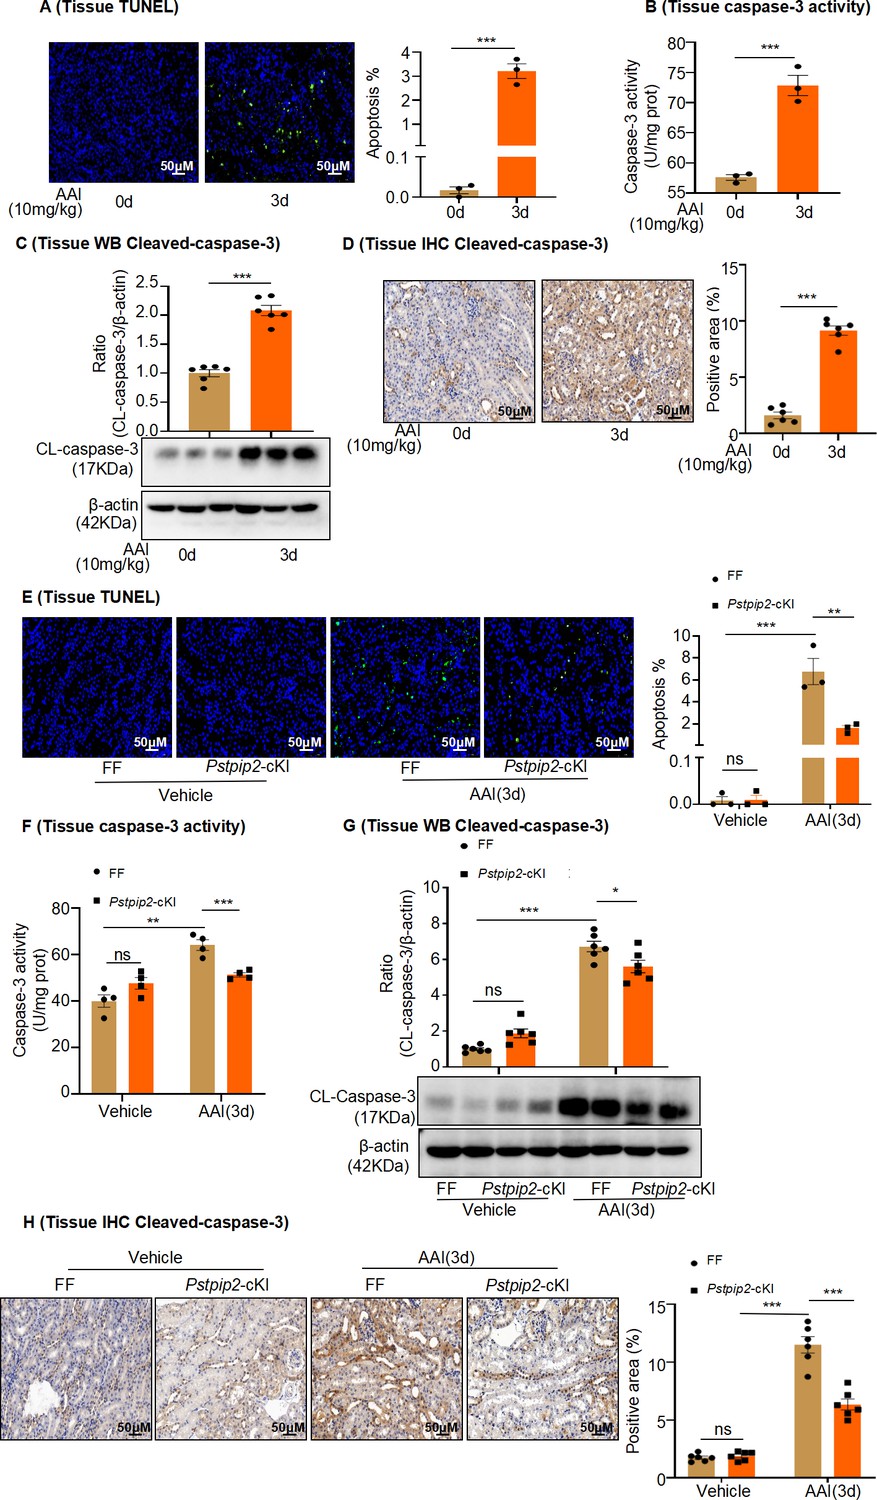
Pstpip2-cKI reduced aristolochic acid I (AAI)-induced kidney apoptosis.
(A) TUNEL staining of kidney sections after AAI treatment for 3 d and quantification (n = 3). Scale bar, 50 μm. (B) Caspase-3 activity in kidney tissues quantified after AAI treatment for 3 d (n = 3). (C) Protein levels of cleaved caspase-3 assessed by western blotting after AAI treatment for 3 d (n = 6). (D) Immunohistochemical (IHC) analysis and quantification of cleaved caspase-3 in kidney tissues after AAI treatment for 3 d (n = 6). Scale bar, 50 μm. (E) TUNEL staining of kidney sections from Pstpip2Flox/Flox (FF) and Pstpip2-cKI mice treated with AAI and quantification (n = 3). Scale bar, 50 μm. (F) Quantification of caspase-3 activity in kidney tissues from FF and Pstpip2-cKI mice treated with AAI (n = 4). (G) Protein level of cleaved caspase-3 assessed by western blotting (n = 6). (H) IHC analysis and quantification of cleaved caspase-3 in kidney tissues from FF and Pstpip2-cKI mice treated with AAI (n = 6). Scale bar, 50 μm. Data are presented as the mean ± SEM of 3–6 biological replicates per condition. Each dot represents a sample. Significant differences were determined by an independent sample t-test and one-way ANOVA followed by Tukey’s post hoc test. *p<0.05, **p<0.01, ***p<0.001, ns: nonsignificant.
-
Figure 2—figure supplement 1—source data 1
Data represented by each point in Figure 2—figure supplement 1A–H.
- https://cdn.elifesciences.org/articles/89740/elife-89740-fig2-figsupp1-data1-v2.zip
-
Figure 2—figure supplement 1—source data 2
Uncropped western blots for Figure 2—figure supplement 1C and G.
- https://cdn.elifesciences.org/articles/89740/elife-89740-fig2-figsupp1-data2-v2.zip
Figure 3
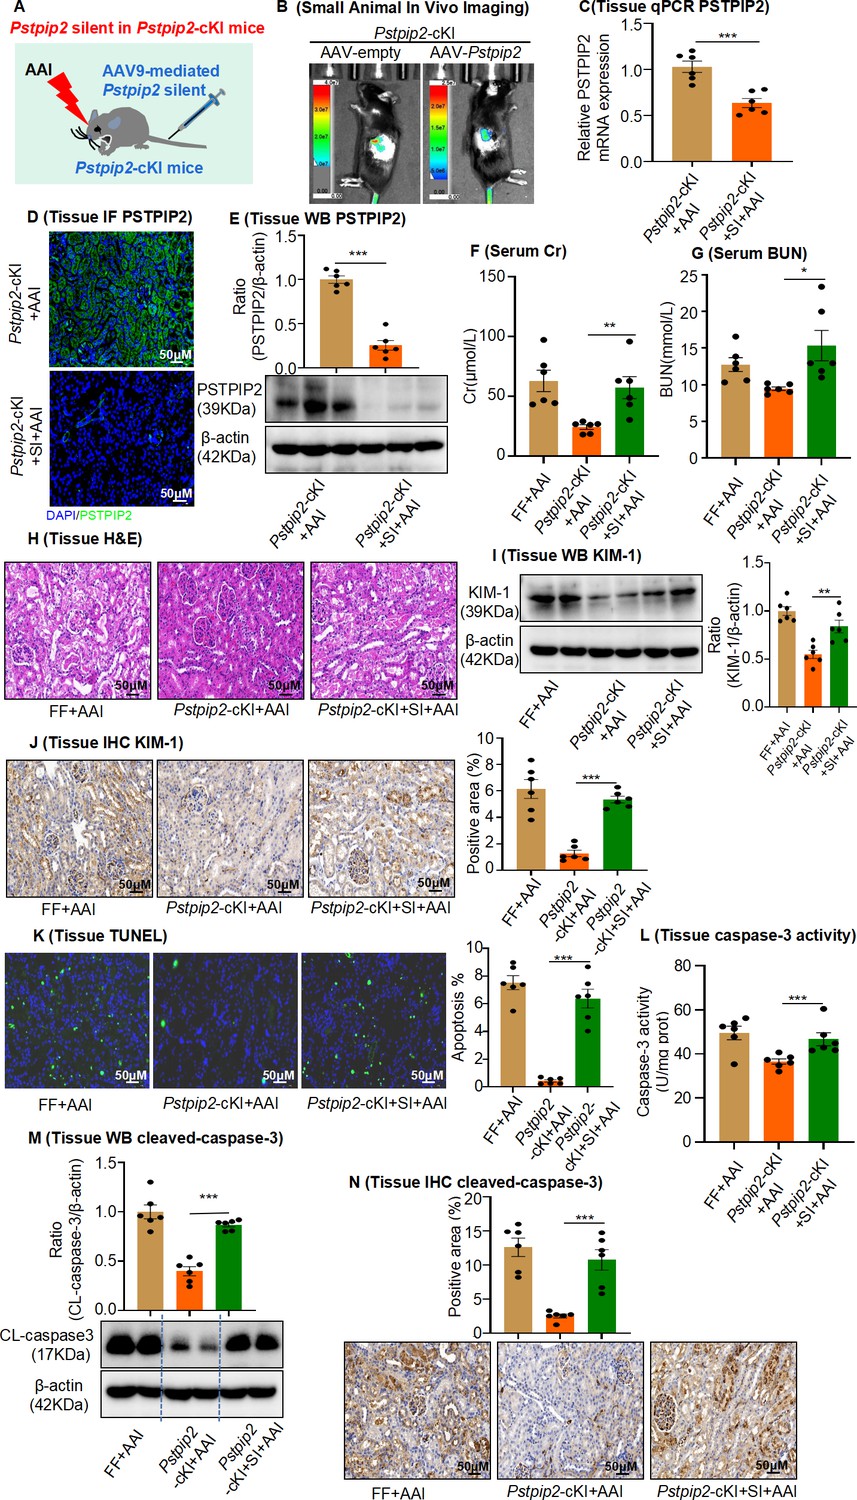
AAV9-mediated Pstpip2 reduction re-induces renal injury and kidney apoptosis in Pstpip2-cKI mice.
(A) Scheme illustrating the rescue experiment in Pstpip2-cKI mice. (B) Fluorescence-labeled AAV9–PSTPIP2 was localized in the kidney. (C) Real-time PCR analysis of PSTPIP2 in kidney tissues (n = 6 per group). (D) Immunofluorescence (IF) of PSTPIP2 in kidney tissues (n = 6 per group). Scale bar, 50 μm. (E) Western blot analyses of PSTPIP2 (n = 6 per group). PSTPIP2 levels were successfully reduced in Pstpip2-cKI mice. (F, G) Serum creatinine (Cr) and blood urea nitrogen (BUN) assay. Serum Cr and BUN levels showed that silencing PSTPIP2 can aggravate kidney damage in Pstpip2-cKI mice treated with aristolochic acid I (AAI) (n = 6 per group). (H) Representative H&E-stained images of kidney tissues (n = 6 per group). Scale bar, 50 μm. (I) Western blot analysis of KIM-1. Quantification of the KIM-1/β-actin ratio (n = 6). (J) Immunohistochemistry (IHC) and kidney injury molecule-1 (KIM-1) levels in kidney tissues (n = 6 per group). Scale bar, 50 μm. (K) TUNEL staining and analysis of kidney sections (n = 6 per group). Scale bar, 50 μm. The results showed that silencing PSTPIP2 can aggravate renal apoptosis in Pstpip2-cKI mice treated with AAI. (L) Detection of caspase-3 activity in kidney tissues (n = 6 per group). (M) Western blot analysis of cleaved caspase-3. Quantification of the cleaved caspase-3/β-actin ratio (n = 6). (N) IHC and cleaved caspase-3 levels in kidney tissues. Scale bar, 50 μm (n = 6 per group). Data are presented as the mean ± SEM of six biological replicates per condition. Each dot represents a sample. Significant differences were determined by an independent sample t-test. *p<0.05, **p<0.01, ***p<0.001, ns: nonsignificant.
-
Figure 3—source data 1
Data represented by each point in Figure 3C, E –G, I–N.
- https://cdn.elifesciences.org/articles/89740/elife-89740-fig3-data1-v2.zip
-
Figure 3—source data 2
Uncropped western blots for Figure 3E, I, and M.
- https://cdn.elifesciences.org/articles/89740/elife-89740-fig3-data2-v2.zip
Figure 4 with 2 supplements
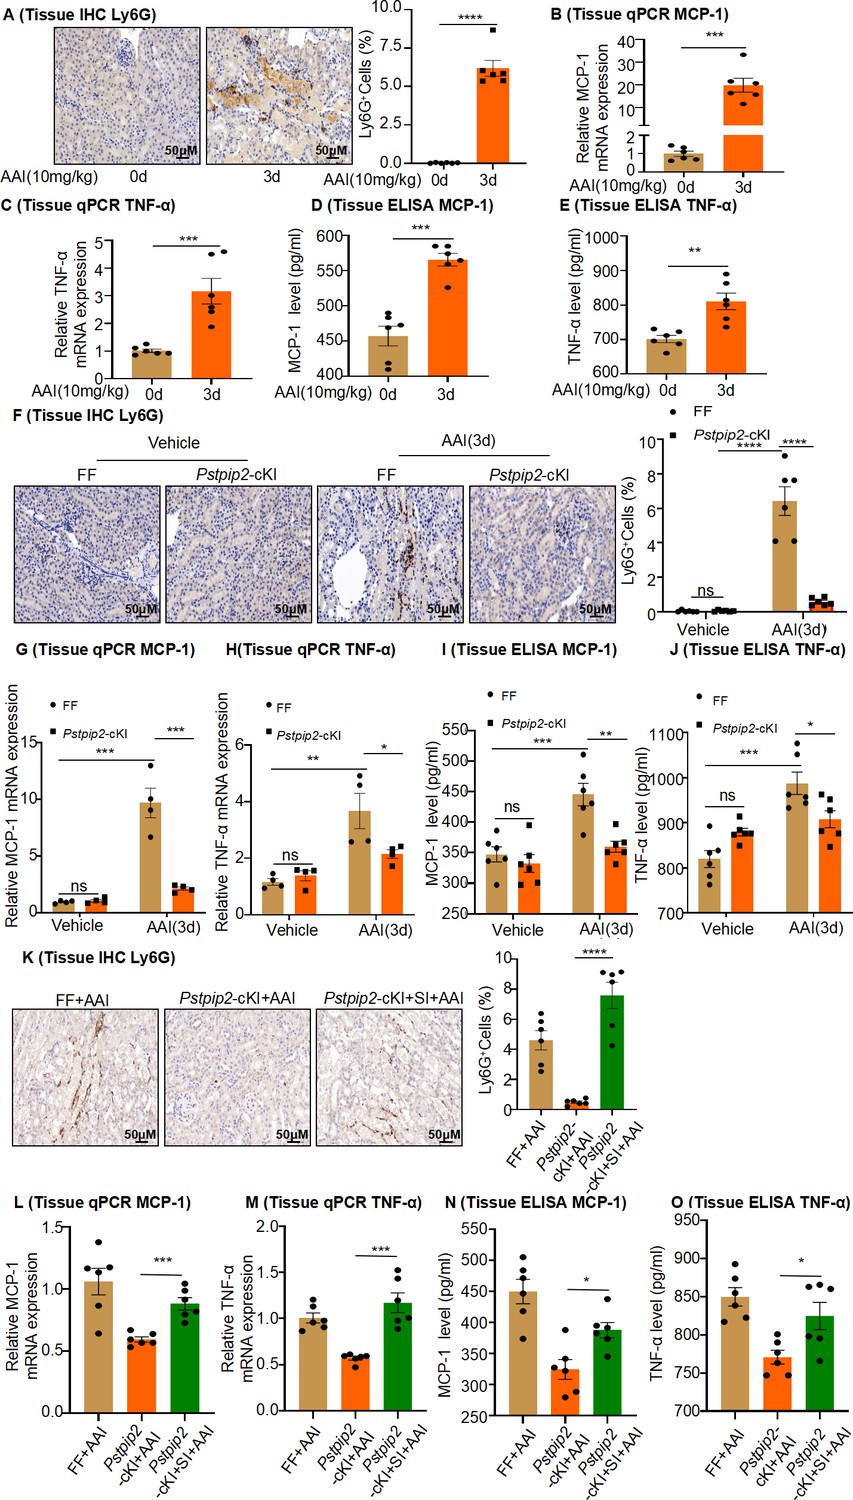
Changes in renal Pstpip2 expression affect neutrophil infiltration and inflammatory factor production in mice with aristolochic acid I (AAI)-induced acute renal injury.
(A) Representative images of immunohistochemistry (IHC) staining with Ly6G+. Scale bar, 50 μm. Quantification of the percentage of Ly6G+ neutrophil infiltration. n = 6. (B, C) mRNA level of renal tissue monocyte chemoattractant protein-1 (MCP-1) and tumor necrosis factor-α (TNF-α) assessed by real-time PCR (n = 6 per group). (D, E) Protein level of renal tissue MCP-1 and TNF-α assessed by ELISA (n = 6 per group). (F) Representative IHC staining images of kidney sections, showing the expression of Ly6G. Kidneys were isolated from Pstpip2Flox/Flox and Pstpip2-cKI mice on day 3 after AAI treatment. Scale bar, 50 μm. Quantification of the percentage of Ly6G+ neutrophil infiltration (n = 6 per group). (G, H) Relative mRNA levels of MCP-1 and TNF-α in renal tissue determined by real-time PCR (n = 4 per group). (I, J) Protein level of renal tissue MCP-1 and TNF-α assessed by ELISA (n = 6 per group). The results showed that overexpression of PSTPIP2 in the kidneys can reduce renal inflammation in mice treated with AAI. (K) Representative IHC staining images of kidney sections, showing the expression of Ly6G. Kidneys were isolated from Pstpip2Flox/Flox, Pstpip2-cKI, and Pstpip2-cKI-silenced mice on day 3 after AAI treatment. Scale bar, 50 μm. Quantification of the percentage of Ly6G+ neutrophil infiltration (n = 6 per group). (L, M) Relative mRNA levels of MCP-1 and TNF-α in renal tissue determined by real-time PCR (n = 6 per group). (N, O) Protein level of renal tissue MCP-1 and TNF-α assessed by ELISA (n = 6 per group). The results showed that silencing PSTPIP2 can aggravate renal inflammation in Pstpip2-cKI mice treated with AAI (n = 6 per group). Data are presented as the mean ± SEM of four to six biological replicates per condition. Each dot represents a sample. Significant differences were determined by an independent sample t-test (B–E and K–O) and one-way ANOVA followed by Tukey’s post hoc test (F–J). *p<0.05, **p<0.01, ***p<0.001, ns: nonsignificant.
-
Figure 4—source data 1
Data represented by each point in Figure 4A–O.
- https://cdn.elifesciences.org/articles/89740/elife-89740-fig4-data1-v2.zip
Figure 4—figure supplement 1
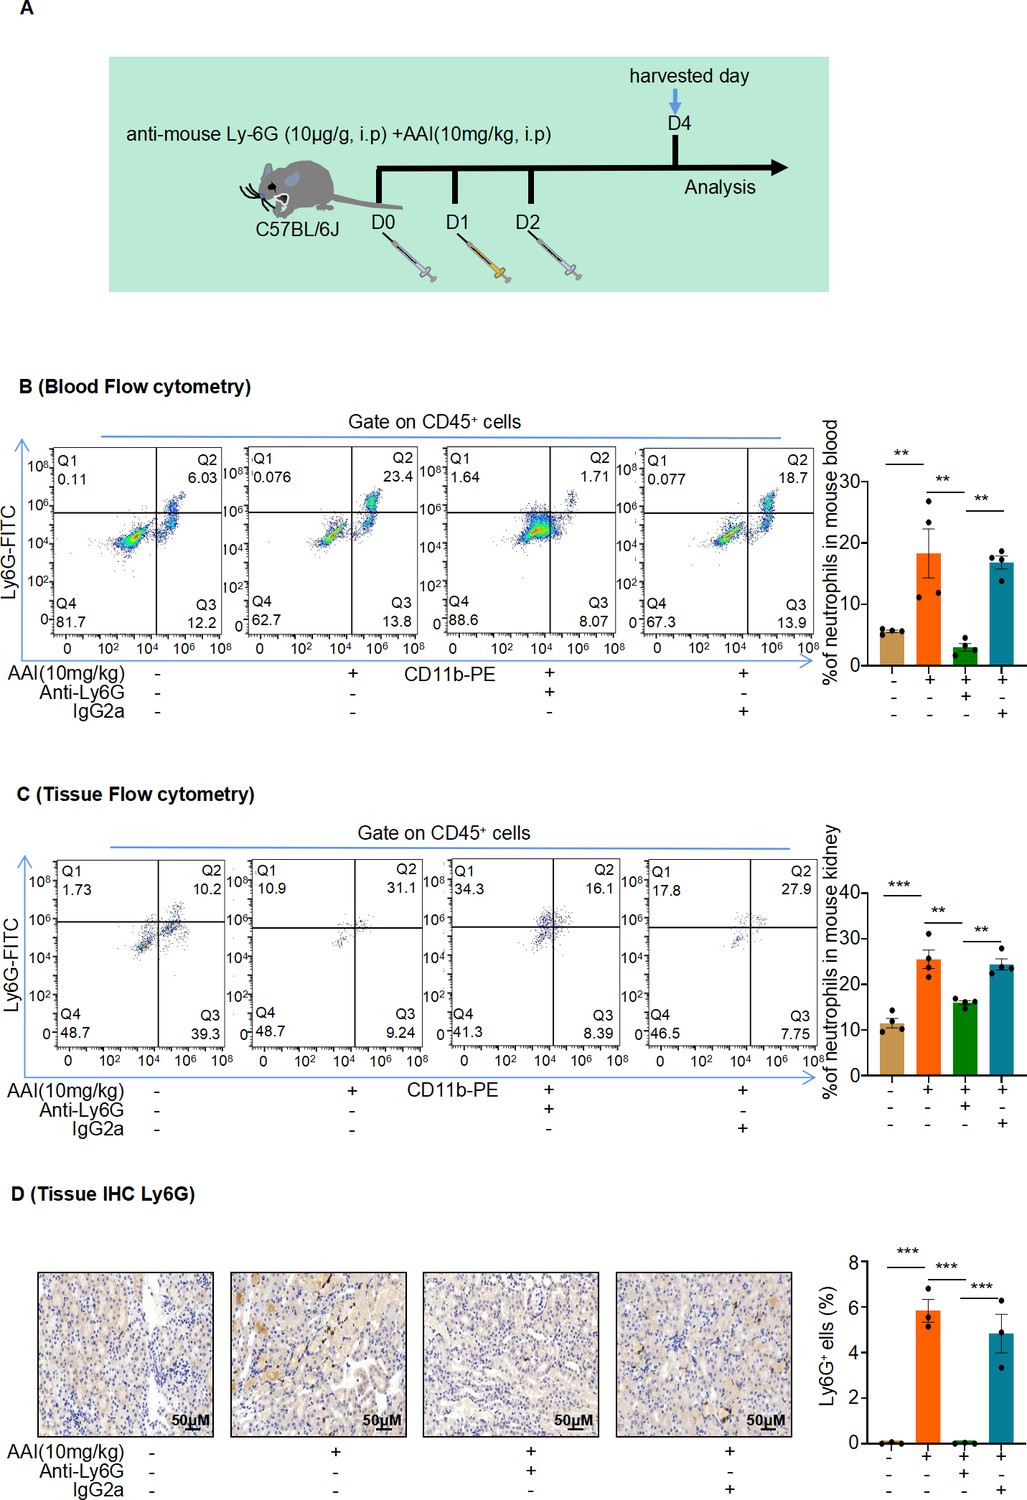
Mice were pretreated with anti-mouse Ly6G or IgG control antibody followed by aristolochic acid I (AAI) treatment.
(A) Schematic of intraperitoneal (IP) injection of anti-mouse Ly6G neutralizing antibody or IgG control antibody; purified anti-mouse Ly6G (10 µg/g mouse), and IgG control antibody (10 µg/g mouse) was administered daily one day before and after IP AAI injection. (B, C) Flow cytometry was used to evaluate Ly6G+ neutrophil infiltration in the blood and renal samples. Representative images of flow cytometry analysis are shown in (B) and (C) (n = 4 per group). (D) Representative images of immunohistochemistry (IHC) staining of Ly6G. Scale bar, 50 μm. Quantification of the percentage of Ly6G+ neutrophil infiltration (n = 3 per group). Data are presented as the mean ± SEM of 3–4 biological replicates per condition. Each dot represents a sample. Significant differences were determined by one-way ANOVA followed by Tukey’s post hoc test. **p<0.01, ***p<0.001.
-
Figure 4—figure supplement 1—source data 1
Data represented by each point in Figure 4—figure supplement 1B–D.
- https://cdn.elifesciences.org/articles/89740/elife-89740-fig4-figsupp1-data1-v2.zip
Figure 4—figure supplement 2
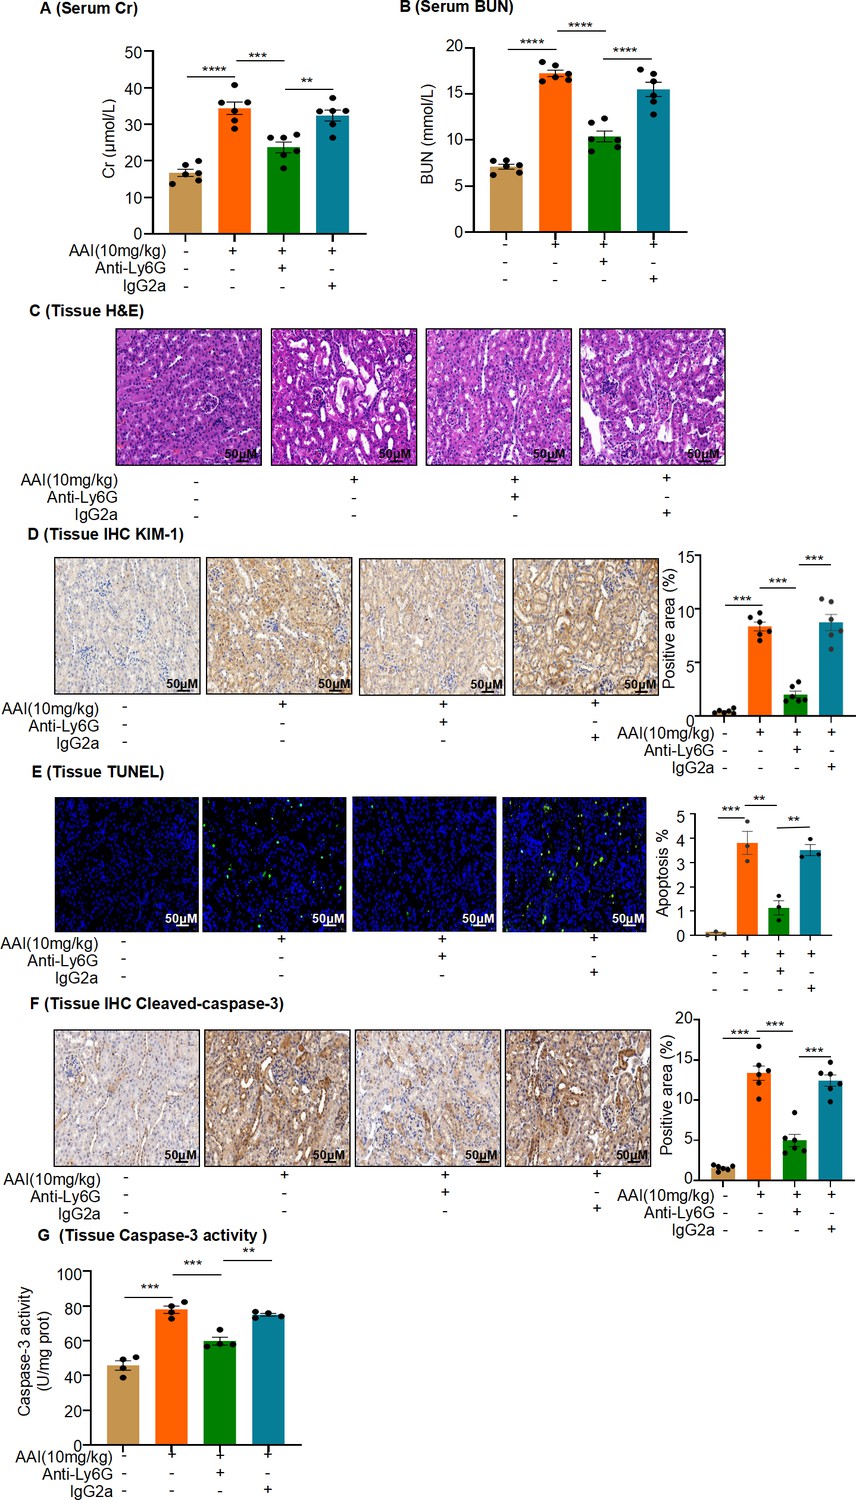
In vivo neutrophil depletion attenuates aristolochic acid I (AAI)-induced kidney damage in mice.
(A, B) Serum creatinine (Cr) and blood urea nitrogen (BUN) assay of mice pretreated with anti-mouse Ly6G or IgG control antibody, followed by AAI treatment (n = 6 per group). (C) Representative H&E-staining images of kidney tissues (n = 6 per group). Scale bar, 50 μm. (D) Immunohistochemistry (IHC) staining and quantification of kidney injury molecule-1 (KIM-1) in kidney tissues (n = 6 per group). Scale bar, 50 μm. (E) TUNEL staining and quantification in kidney sections (n = 3 per group). Scale bar, 50 μm. (F) IHC staining and quantification of cleaved caspase-3 in kidney tissues. Scale bar, 50 μm (n = 6 per group). (G) Detection of caspase-3 activity in kidney tissues (n = 4 per group). Data are presented as the mean ± SEM of 3–6 biological replicates per condition. Each dot represents a sample. Significant differences were determined by one-way ANOVA followed by Tukey’s post hoc test. **p<0.01, ***p<0.001, ****p<0.0001.
-
Figure 4—figure supplement 2—source data 1
Data represented by each point in Figure 4—figure supplement 2A, B, and D–G.
- https://cdn.elifesciences.org/articles/89740/elife-89740-fig4-figsupp2-data1-v2.zip
Figure 5 with 4 supplements
Pstpip2 conditional knock-in in the kidney significantly decreased neutrophil extracellular trap (NET) formation.
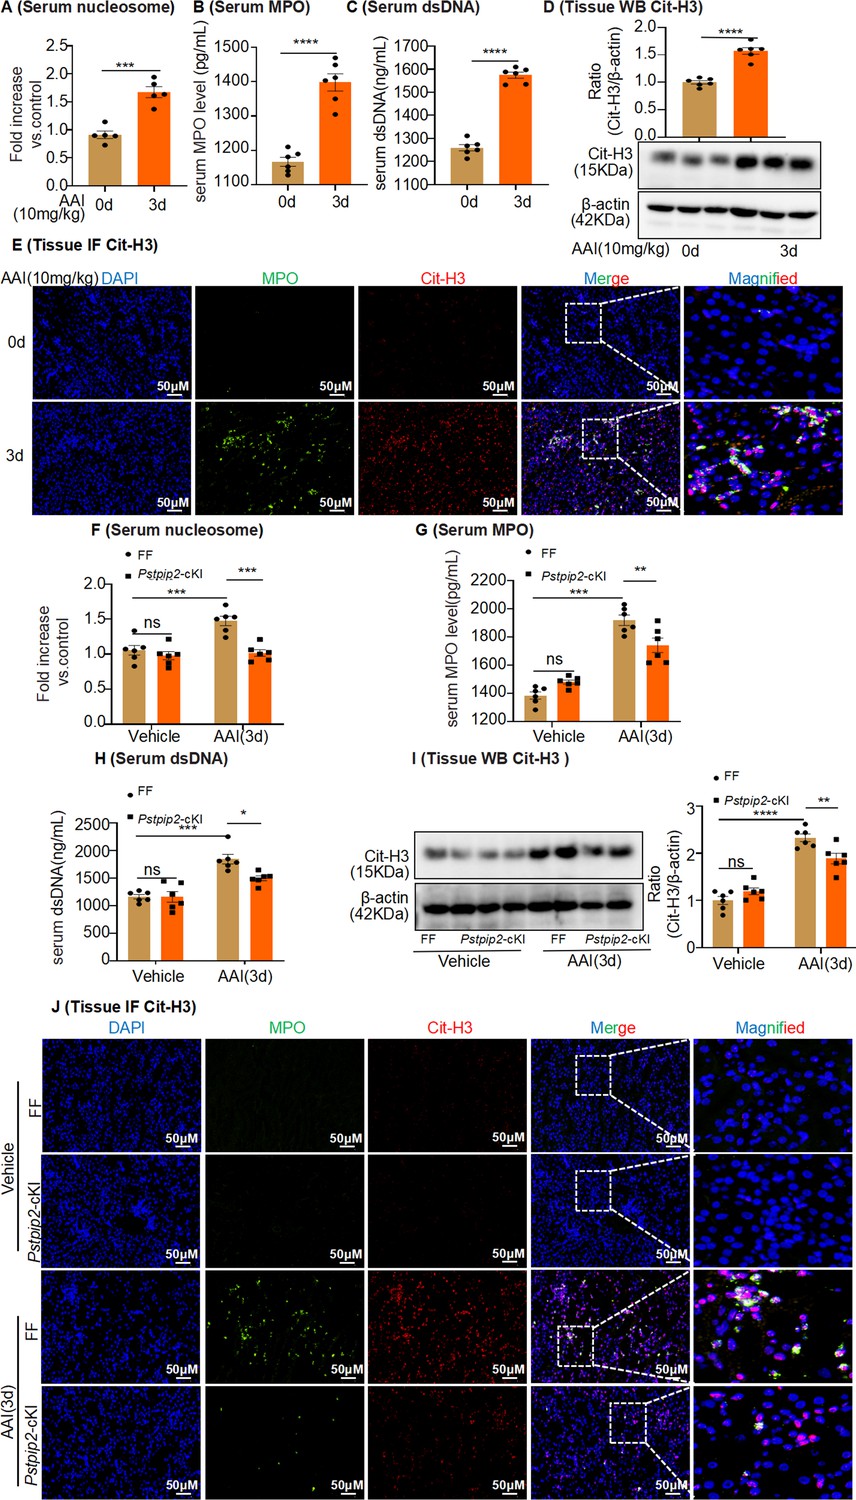
(A) Serum nucleosome level after aristolochic acid I (AAI) treatment for 3 d (n = 5). (B, C) Serum myeloperoxidase (MPO) and dsDNA level after AAI treatment for 3 d (n = 6). (D) Protein level of citrullinated histone 3 (Cit-H3) assessed by western blotting after AAI treatment for 3 d (n = 6). (E) Immunofluorescent (IF) staining revealed increased co-localization of MPO (green) and Cit-H3 (red) after AAI treatment for 3 d (n = 6). Scale bar, 50 μm. (F) Serum nucleosome level of Pstpip2Flox/Flox and Pstpip2-cKI mice treated with AAI (n = 6 per group). (G, H) Serum MPO and dsDNA level of Pstpip2Flox/Flox and Pstpip2-cKI mice treated with AAI (n = 6 per group). (I) Western blot analysis of Cit-H3. Quantification of the Cit-H3/β-actin ratio (n = 6 per group). (J) Representative IF staining images of kidney sections, showing the expression of Cit-H3 (red) and MPO (green). Kidneys were isolated from Pstpip2Flox/Flox and Pstpip2-cKI mice on day 3 after AAI treatment (n = 6 per group). Scale bar, 50 μm. Data are presented as the mean ± SEM of six biological replicates per condition. Each dot represents a sample. Significant differences were determined by an independent sample t-test (A–D) and one-way ANOVA followed by Tukey’s post hoc test (F–I). *p<0.05, **p<0.01, ***p<0.001, ****p<0.0001, ns: nonsignificant.
-
Figure 5—source data 1
Data represented by each point in Figure 5A–D and F–I.
- https://cdn.elifesciences.org/articles/89740/elife-89740-fig5-data1-v2.zip
-
Figure 5—source data 2
Uncropped western blots for Figure 5D and I.
- https://cdn.elifesciences.org/articles/89740/elife-89740-fig5-data2-v2.zip
Figure 5—figure supplement 1
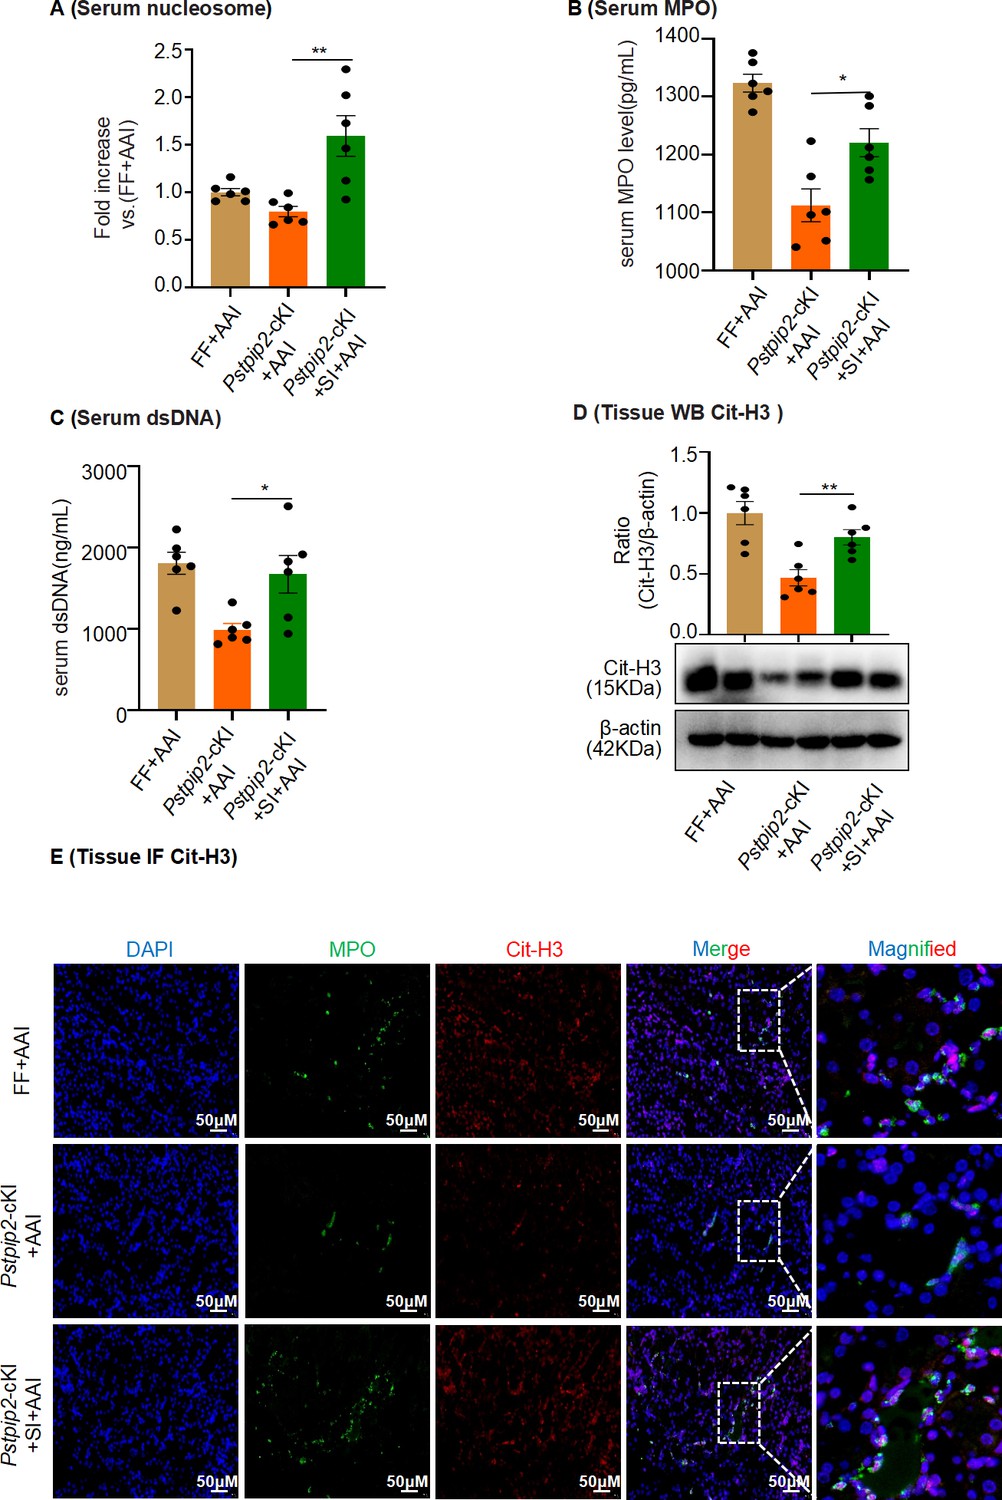
AAV9-mediated Pstpip2 restoration re-induces neutrophil extracellular trap (NET) formation in Pstpip2-cKI mice.
(A) Serum nucleosome level (n = 6 per group). (B) Serum myeloperoxidase (MPO) level (n = 6 per group). (C) Serum dsDNA level (n = 6 per group). (D) Protein level of citrullinated histone 3 (Cit-H3) assessed by western blotting (n = 6 per group). (E) Immunofluorescence staining revealed increased colocalization of MPO (green) and Cit-H3 (red, n = 6 per group). Scale bar, 50 μm. Data are presented as the mean ± SEM of six biological replicates per condition. Each dot represents a sample. Significant differences were determined by an independent sample t-test and one-way ANOVA followed by Tukey’s post hoc test. *p<0.05, **p<0.01.
-
Figure 5—figure supplement 1—source data 1
Data represented by each point in Figure 5—figure supplement 1A–D.
- https://cdn.elifesciences.org/articles/89740/elife-89740-fig5-figsupp1-data1-v2.zip
-
Figure 5—figure supplement 1—source data 2
Uncropped western blots for Figure 5—figure supplement 1D.
- https://cdn.elifesciences.org/articles/89740/elife-89740-fig5-figsupp1-data2-v2.zip
Figure 5—figure supplement 2
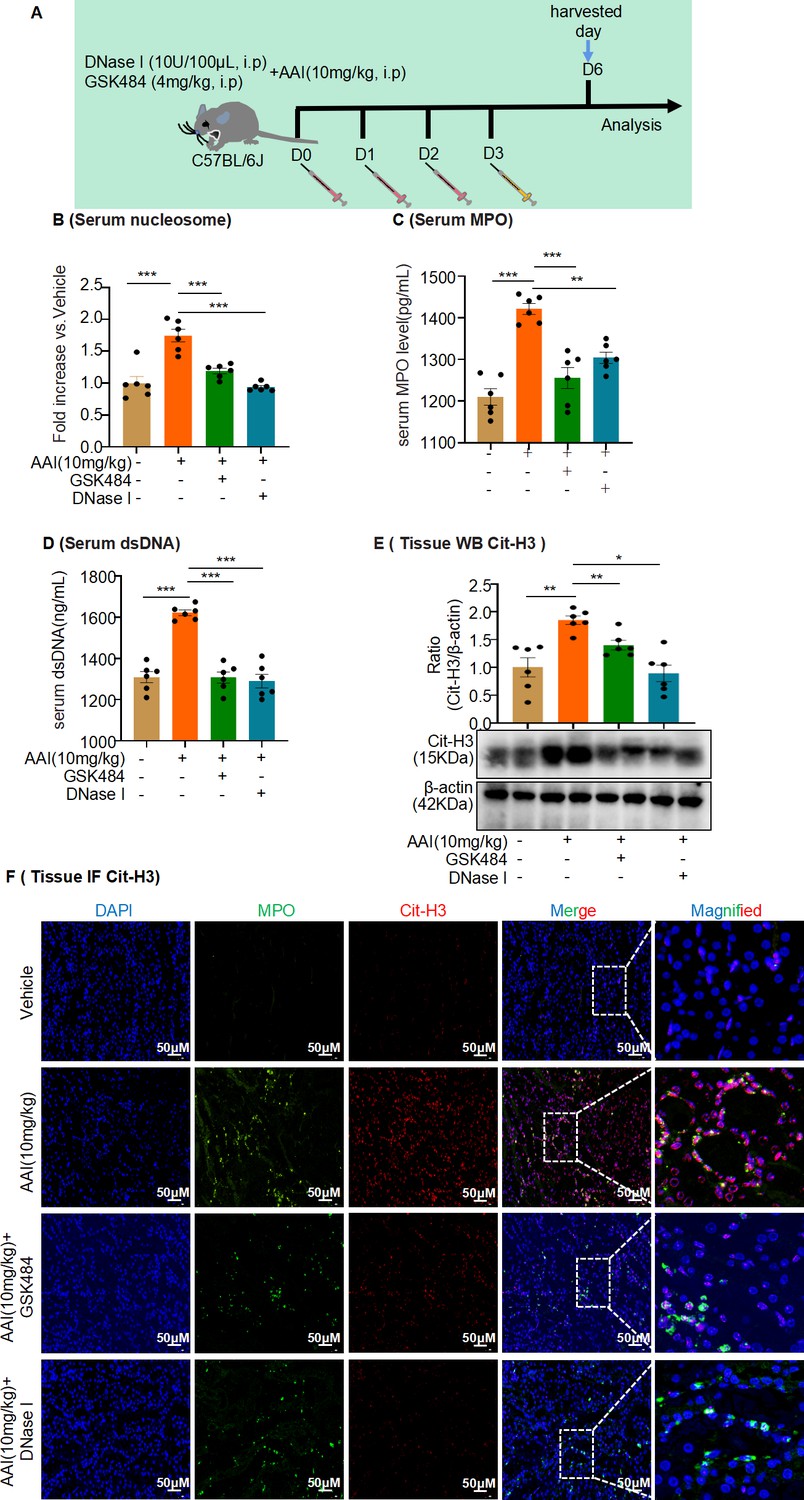
Neutrophil extracellular trap (NET) formation inhibitor, GSK484, or DNase I inhibited formation of NETs in aristolochic acid I (AAI)-treated mice.
(A) Schematic of GSK484 or DNase I injection in mice experiments. DNase I (10 U/100 μL, 0.9% NaCl) or GSK484 (4 mg/kg) was administered daily for 3 d before AAI treatment. (B, C) Serum nucleosome and myeloperoxidase (MPO) level assessed after treatment with AAI and co-treatment with GSK484 or DNase I (n = 6 per group). (D) Serum dsDNA level assessed after treatment with AAI and co-treatment with GSK484 or DNase I (n = 6 per group). (E) Protein level of citrullinated histone 3 (Cit-H3) assessed by western blotting (n = 6 per group). (F) Representative IF staining images of kidney sections, showing the expression of Cit-H3 (red) and MPO (green, n = 6 per group). Scale bar, 50 μm. Data are presented as the mean ± SEM of six biological replicates per condition. Each dot represents a sample. Significant differences were determined by an independent sample t-test and one-way ANOVA followed by Tukey’s post hoc test. *p<0.05, **p<0.01, ***p<0.001.
-
Figure 5—figure supplement 2—source data 1
Data represented by each point in Figure 5—figure supplement 2B–E.
- https://cdn.elifesciences.org/articles/89740/elife-89740-fig5-figsupp2-data1-v2.zip
-
Figure 5—figure supplement 2—source data 2
Uncropped western blots for Figure 5—figure supplement 2E.
- https://cdn.elifesciences.org/articles/89740/elife-89740-fig5-figsupp2-data2-v2.zip
Figure 5—figure supplement 3
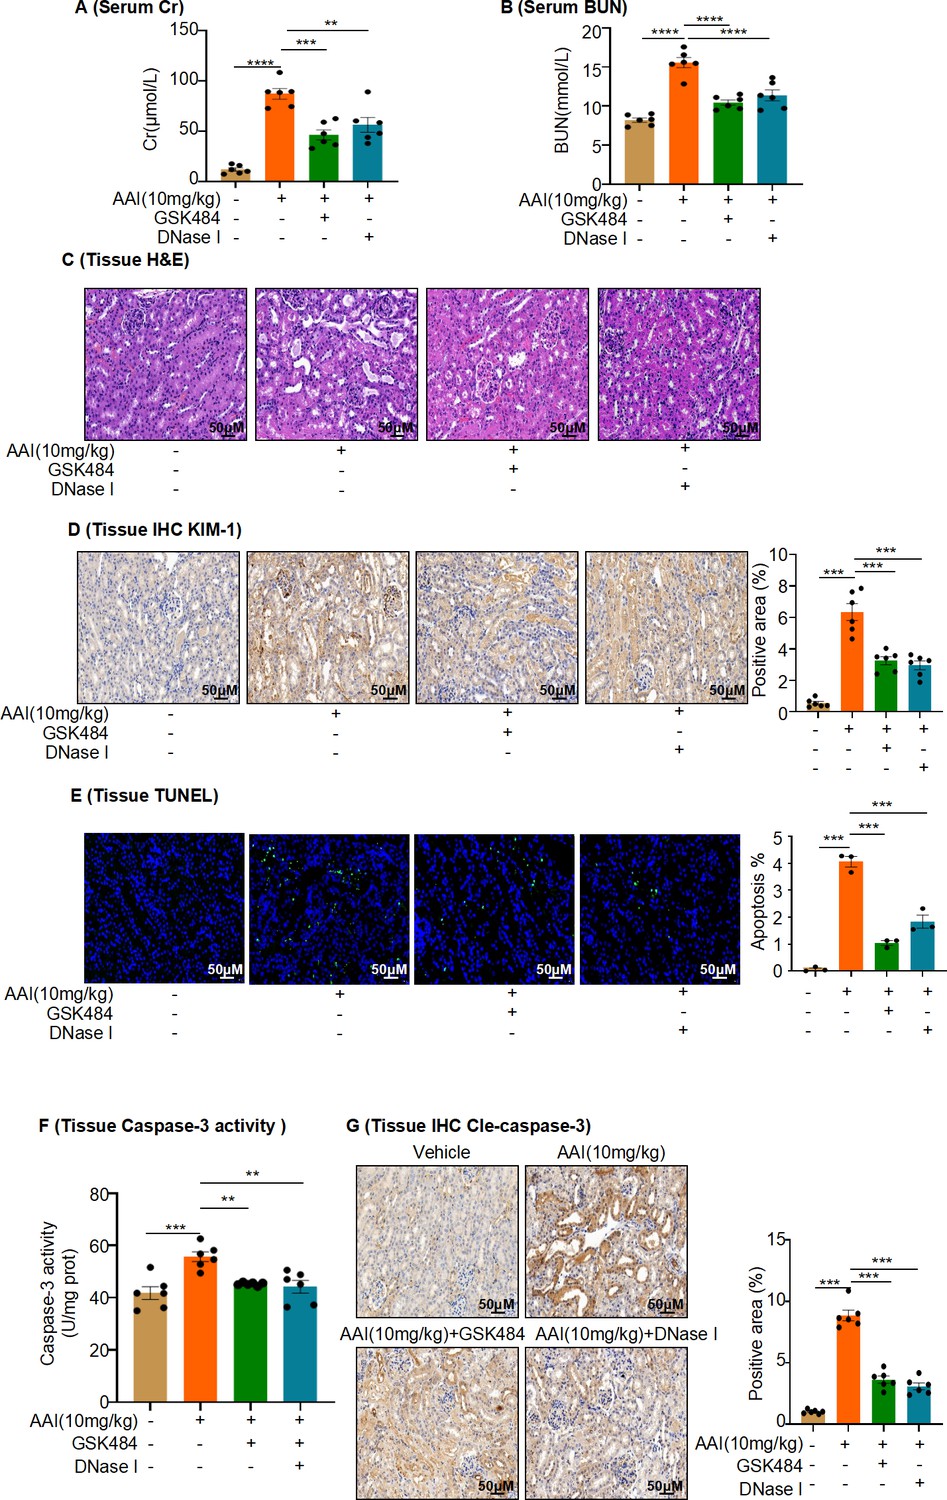
Inhibition of neutrophil extracellular traps (NETs) formation attenuates aristolochic acid I (AAI)-induced kidney damage and apoptosis.
(A, B) Serum creatinine (Cr) and blood urea nitrogen (BUN) assay performed on AAI-treated mice co-treated with GSK484 or DNase I (n = 6 per group). (C) H&E staining of kidney sections of AAI-treated mice co-treated with GSK484 or DNase I (n = 6 per group). Scale bar, 50 μm. (D) KIM-1 staining of kidney sections of AAI-treated mice co-treated with GSK484 or DNase I (n = 6 per group). Scale bar, 50 μm. Positive staining areas were measured using Image-Pro Plus 6.0 (Media Cybernetics, Inc, Rockville, MD, USA). Scale bar, 50 μm. (E) TUNEL staining and quantification of kidney sections (n = 3 per group). Scale bar, 50 μm. (F) Activity of caspase-3 quantified after co-treatment with AAI and GSK484 or DNase I (n = 6 per group). (G) Cleaved-caspase-3 staining and quantification in kidney sections of AAI-treated mice co-treated with GSK484 or DNase I (n = 6 per group). Scale bar, 50 μm. Data are presented as the mean ± SEM of 3–6 biological replicates per condition. Each dot represents a sample. Significant differences were determined by one-way ANOVA followed by Tukey’s post hoc test. **p<0.01, ***p<0.001, ****p<0.0001.
-
Figure 5—figure supplement 3—source data 1
Data represented by each point in Figure 5—figure supplement 3A, B, and D-G.
- https://cdn.elifesciences.org/articles/89740/elife-89740-fig5-figsupp3-data1-v2.zip
Figure 5—figure supplement 4
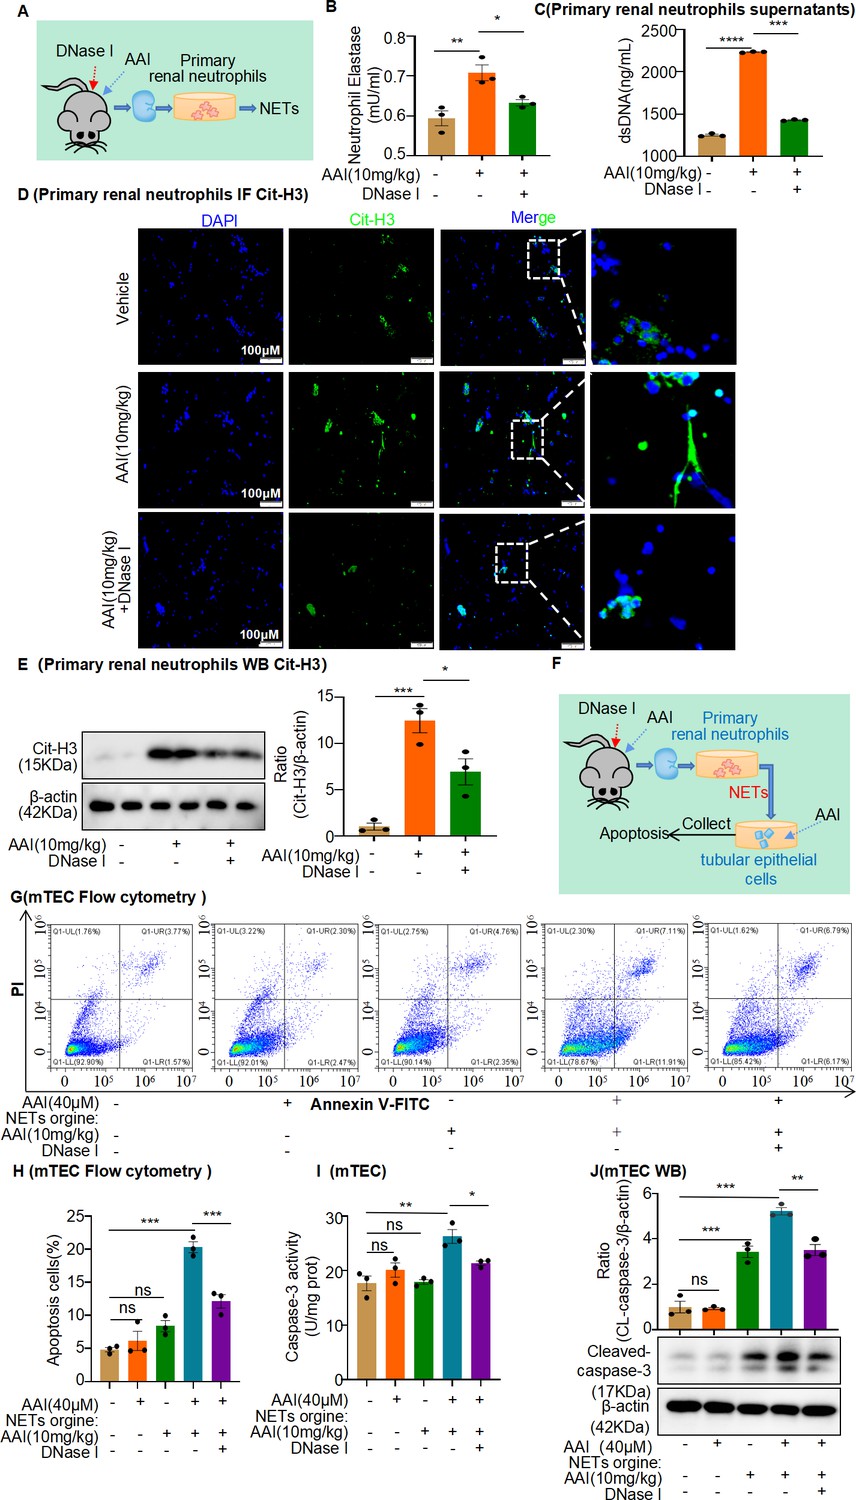
Conditional medium (CM) derived from primary neutrophils of aristolochic acid nephropathy (AAN) mice co-treated with neutrophil extracellular traps (NETs) inhibitor prevents apoptosis of mouse renal tubular epithelial cells (mRTECs).
(A) Primary renal neutrophils were isolated from aristolochic acid I (AAI)- and DNase I-treated mice. (B) The level of neutrophil elastase (NE) in the primary renal neutrophils culture supernatant (n = 3). (C) The level of dsDNA in the primary renal neutrophils culture supernatant (n = 3). (D) The level of citrullinated histone 3 (Cit-H3) in primary renal neutrophils assessed by immunofluorescence staining (n = 3). (E) The level of Cit-H3 in primary renal neutrophils assessed by western blotting (n = 3). (F) Primary neutrophil/mRTEC-conditioned media culture model (n = 3). (G) Apoptosis in mRTECs cultured with different CMs detected using flow cytometry (n = 3). (H) Quantity of apoptotic mRTECs cultured with different CMs (n = 3). (I) Activity of caspase-3 quantified after treating mRTECs with different CMs (n = 3). (J) Protein levels of cleaved caspase-3 assessed by western blotting after treatment with different CMs (n = 3). Data are presented as the mean ± SEM of three biological replicates per condition. Each dot represents a sample. Significant differences were determined by an independent sample t-test and one-way ANOVA followed by Tukey’s post hoc test. *p<0.05, **p<0.01, ***p<0.001, ****p<0.0001, ns: nonsignificant.
-
Figure 5—figure supplement 4—source data 1
Data represented by each point in Figure 5—figure supplement 4B, C, E, and H–J.
- https://cdn.elifesciences.org/articles/89740/elife-89740-fig5-figsupp4-data1-v2.zip
-
Figure 5—figure supplement 4—source data 2
Uncropped western blots for Figure 5—figure supplement 4E and J.
- https://cdn.elifesciences.org/articles/89740/elife-89740-fig5-figsupp4-data2-v2.zip
Figure 6 with 1 supplement
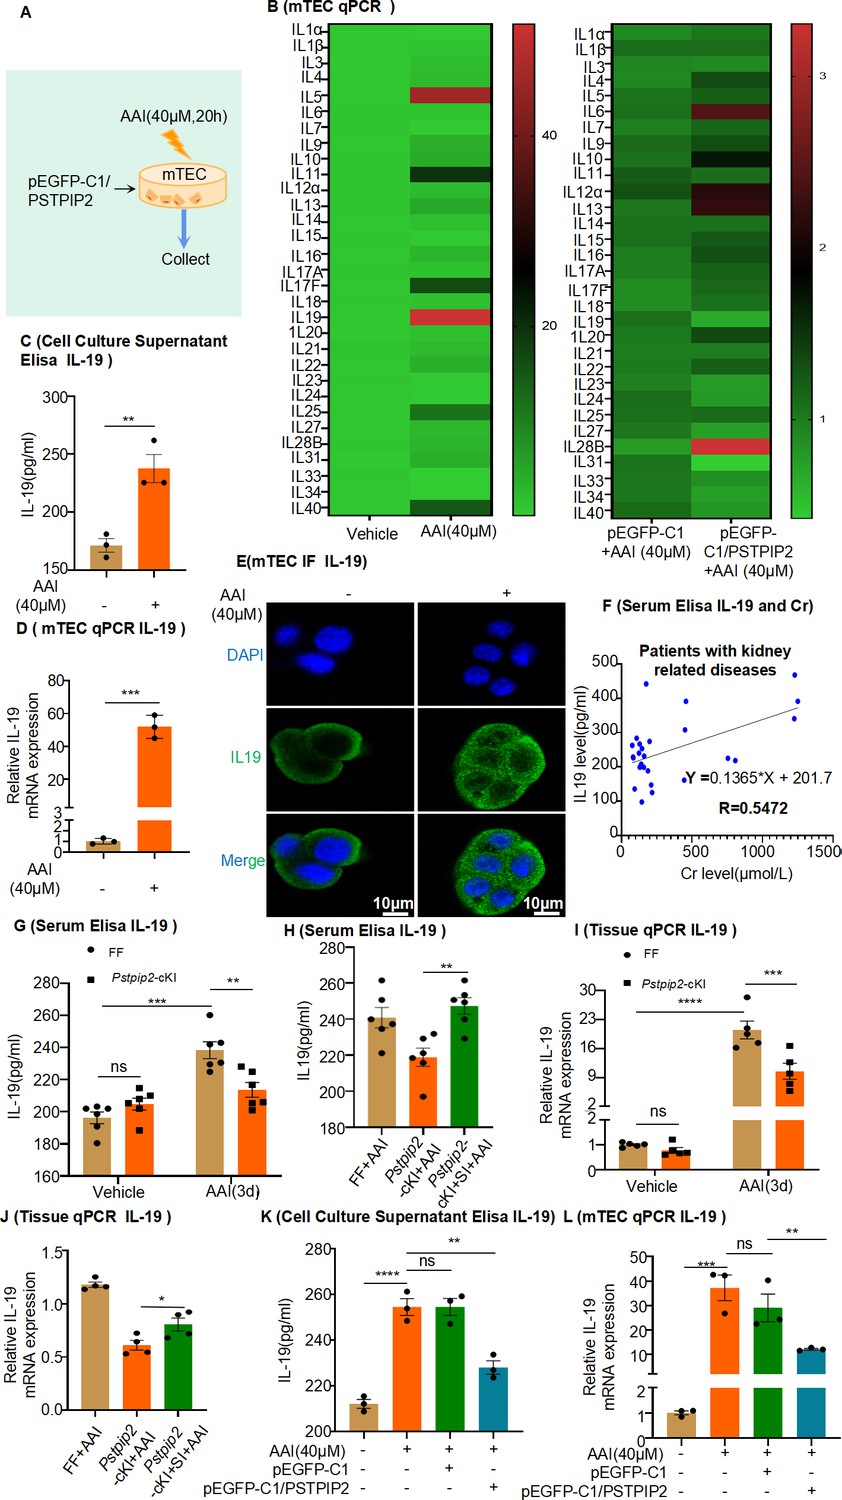
Expression of interleukin-19 (IL-19) was associated with kidney injury and regulated by PSTPIP2.
(A) PSTPIP2 was overexpressed in mouse renal tubular epithelial cells (mRTECs) by the plasmid pEGFP-C1/PSTPIP2; the cells were subsequently treated with aristolochic acid I (AAI, 40 μM) for 20 hr. (B) mRNA levels of various interleukins in mRTECs assessed by real-time PCR (n = 3). (C) Protein level of IL-19 in the cell culture supernatant assessed by ELISA (n = 3). (D) mRNA level of IL-19 in mRTECs assessed after treatment with AAI by real-time PCR (n = 3). (E) IL-19 levels were assessed by immunofluorescence (IF) staining in cells treated with AAI. Scale bar, 10 μm (n = 3). (F) Correlation analysis of serum IL-19 and Cr levels in patients with kidney-related diseases (n = 27). (G) Serum levels of IL-19 protein in Pstpip2Flox/Flox and Pstpip2-cKI mice treated with AAI (n = 6). (H) Serum levels of IL-19 protein in Pstpip2Flox/Flox, Pstpip2-cKI, and Pstpip2-cKI-silenced mice on day 3 after AAI treatment (n = 6). (I) Relative mRNA levels of IL-19 in Pstpip2Flox/Flox and Pstpip2-cKI mice treated with AAI determined by real-time PCR (n = 5 per group). (J) Real-time PCR analysis of IL-19 (n = 4 per group). (K) Protein level of IL-19 in cell culture supernatant assessed by ELISA (n = 3). (L) mRNA level of IL-19 in mRTECs assessed by real-time PCR (n = 3). Data are presented as the mean ± SEM of 3–6 biological replicates per condition. Each dot represents a sample. Significant differences were determined by an independent sample t-test (B–D, H, J) and one-way ANOVA followed by Tukey’s post hoc test (G, I, K, L). Data in (F) were analyzed by Pearson correlation.*p<0.05, **p<0.01, ***p<0.001, ****p<0.0001, ns: non-significant.
-
Figure 6—source data 1
Data represented by each point in Figure 6B–D and F–L.
- https://cdn.elifesciences.org/articles/89740/elife-89740-fig6-data1-v2.zip
Figure 6—figure supplement 1
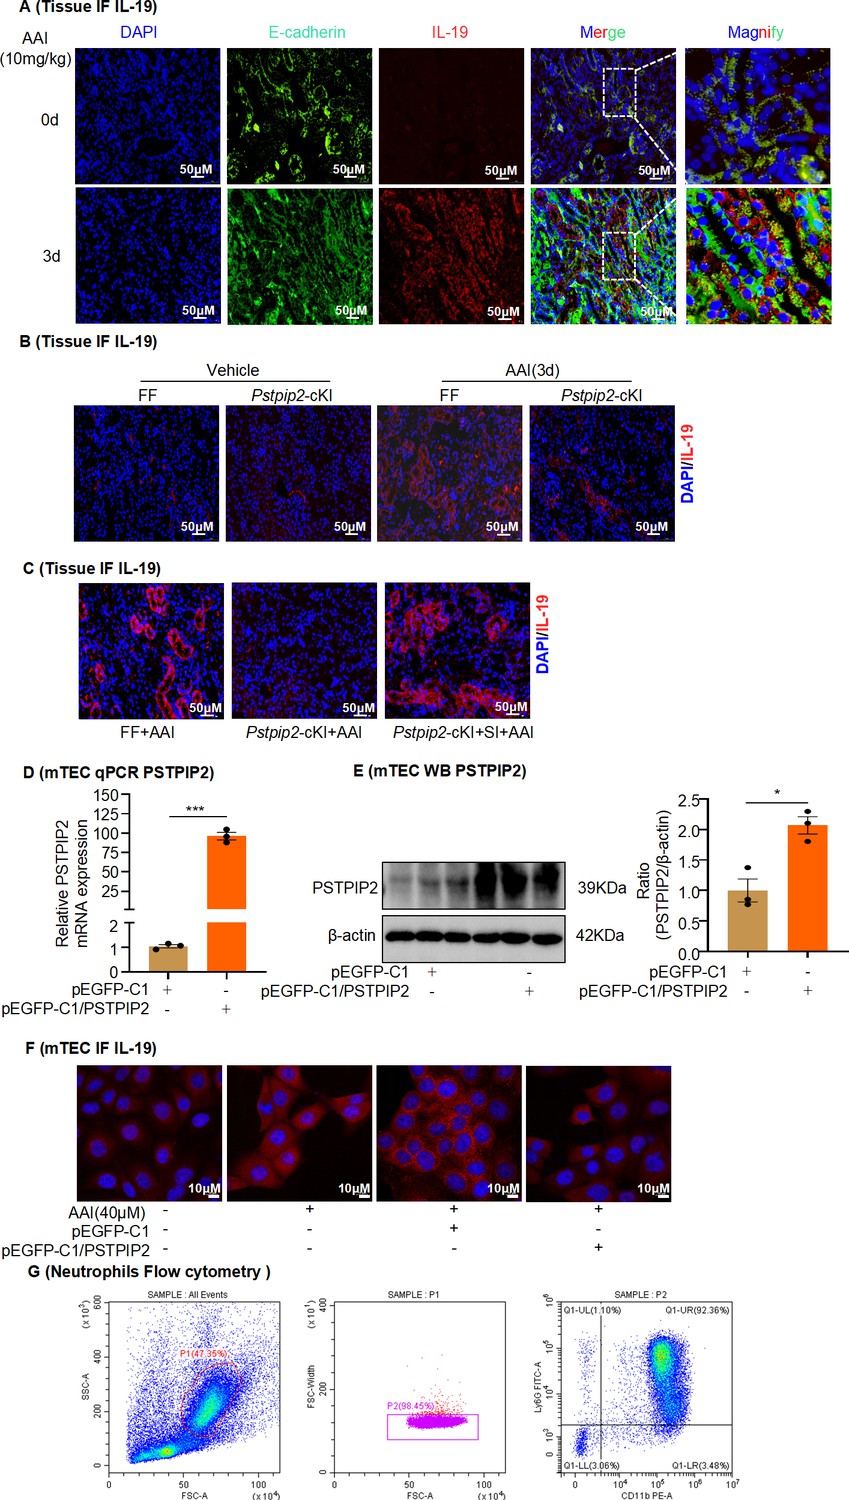
Expression of interleukin-19 (IL-19) in mouse kidneys and mouse tubular epithelial cells (mRTECs) in aristolochic acid I (AAI)-induced aristolochic acid nephropathy (AAN).
(A) Immunofluorescence (IF) staining of IL-19 (red) and E-cadherin (green) in kidney tissues of AAI-induced AAN mice. E-cadherin was used as an epithelial cell marker (mRTECs, n = 6). Scale bar, 50 μm. (B) IF staining of IL-19 (red) in AAI-treated Pstpip2Flox/Flox (FF) and Pstpip2-cKI mice (n = 6). Scale bar, 50 μm. (C) IF staining of IL-19 (red) in AAI-treated Pstpip2-cKI mice with AAV-EV or AAV-OE (n = 6). Scale bar, 50 μm. (D, E) Verification of PSTPIP2 overexpression in mRTECs (n = 3). (F) IF staining of IL-19 in AAI-treated mRTECs overexpressing PSTPIP2 (n = 3). (G) Bone marrow-derived neutrophils isolated from C57BL/6J mice were identified by flow cytometry. Data are presented as the mean ± SEM of three biological replicates per condition. Each dot represents a sample. Significant differences were determined by an independent sample t-test. *p<0.05, ***p<0.001, ****p<0.0001, ns: nonsignificant.
-
Figure 6—figure supplement 1—source data 1
Data represented by each point in Figure 6—figure supplement 1D and E.
- https://cdn.elifesciences.org/articles/89740/elife-89740-fig6-figsupp1-data1-v2.zip
-
Figure 6—figure supplement 1—source data 2
Uncropped western blots for Figure 6—figure supplement 1E.
- https://cdn.elifesciences.org/articles/89740/elife-89740-fig6-figsupp1-data2-v2.zip
Figure 7
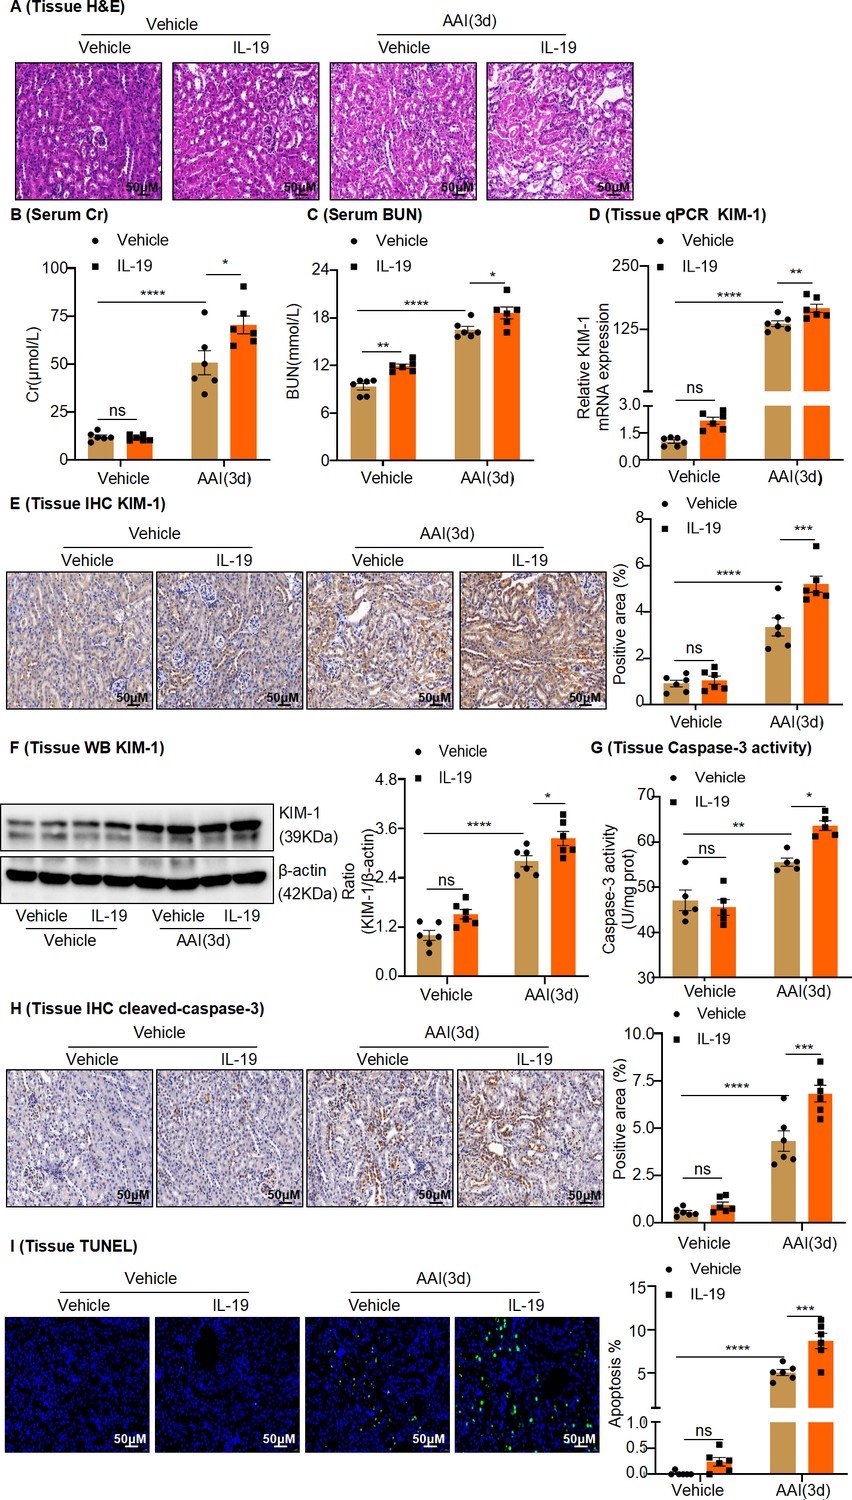
In vivo administration of rIL-19 in mice exacerbated the progression of aristolochic acid nephropathy.
(A) Representative H&E staining images of kidney sections from vehicle and rIL-19-treated mice after being administered with aristolochic acid I (AAI) (n = 6 per group). Scale bar, 50 μm. (B, C) Serum creatinine (Cr) and blood urea nitrogen (BUN) levels assessed after treatment with AAI and co-treatment with vehicle or rIL-19 (n = 6 per group). (D) mRNA level of renal tissue KIM-1 assessed by real-time PCR (n = 6 per group). (E) Immunohistochemistry (IHC) staining and quantification of kidney injury molecule-1 (KIM-1) in kidney tissues (n = 6 per group). Scale bar, 50 μm. (F) Protein level of renal tissue KIM-1 assessed by western blotting (n = 6 per group). (G) Detection of caspase-3 activity in kidney tissues (n = 5 per group). (H) Immunohistochemistry (IHC) staining and quantification of cleaved-caspase-3 in kidney tissues (n = 6 per group). Scale bar, 50 μm. (I) TUNEL staining and quantification in kidney sections (n = 6 per group). Scale bar, 50 μm. Data are presented as the mean ± SEM of 5–6 biological replicates per condition. Each dot represents a sample. Significant differences were determined by one-way ANOVA followed by Tukey’s post hoc test (B–I). *p<0.05, **p<0.01, ***p<0.001, ns: nonsignificant.
-
Figure 7—source data 1
Data represented by each point in Figure 7B–I.
- https://cdn.elifesciences.org/articles/89740/elife-89740-fig7-data1-v2.zip
-
Figure 7—source data 2
Uncropped western blots for Figure 7F.
- https://cdn.elifesciences.org/articles/89740/elife-89740-fig7-data2-v2.zip
Figure 8
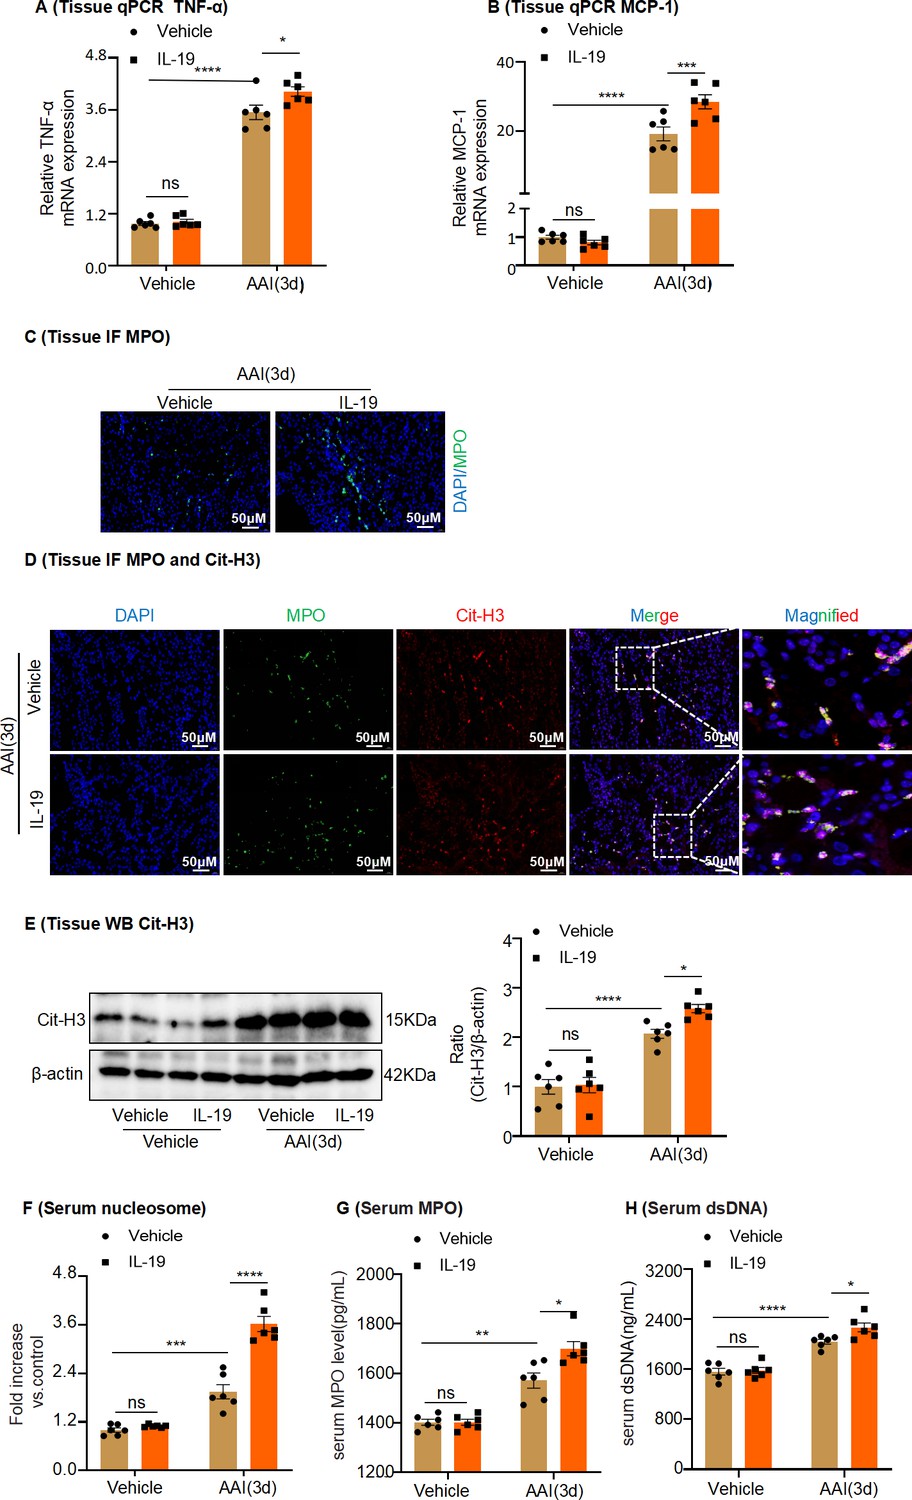
Administration of rIL-19 in mice promotes neutrophil infiltration, inflammatory factor production, and formation of neutrophil extracellular traps in aristolochic acid nephropathy.
(A, B) mRNA level of renal tissue monocyte chemoattractant protein-1 (MCP-1) and tumor necrosis factor-α (TNF-α) assessed by real-time PCR (n = 6 per group). (C) Representative images of Immunofluorescence (IF) staining with MPO+ neutrophils. (DAPI: blue; MPO: green) Scale bar, 50 μm. (D) Representative IF staining images of kidney sections, showing the expression of Cit-H3 (red) and MPO (green). Kidneys were isolated from rIL-19-treated mice after being administered with AAI (n = 6 per group). Scale bar, 50 μm. (E) Western blot analysis of Cit-H3. Quantification of the Cit-H3/β-actin ratio (n = 6 per group). (F–H) Serum nucleosome, MPO, and dsDNA levels of vehicle and rIL-19-treated mice after being administered with AAI (n = 6 per group). Data are presented as the mean ± SEM of six biological replicates per condition. Each dot represents a sample. Significant differences were determined by one-way ANOVA followed by Tukey’s post hoc test (A, B, E–H). *p<0.05, **p<0.01, ***p<0.001, ns: nonsignificant.
-
Figure 8—source data 1
Data represented by each point in Figure 8A, B, and E–H.
- https://cdn.elifesciences.org/articles/89740/elife-89740-fig8-data1-v2.zip
-
Figure 8—source data 2
Uncropped western blots for Figure 8E.
- https://cdn.elifesciences.org/articles/89740/elife-89740-fig8-data2-v2.zip
Figure 9 with 1 supplement
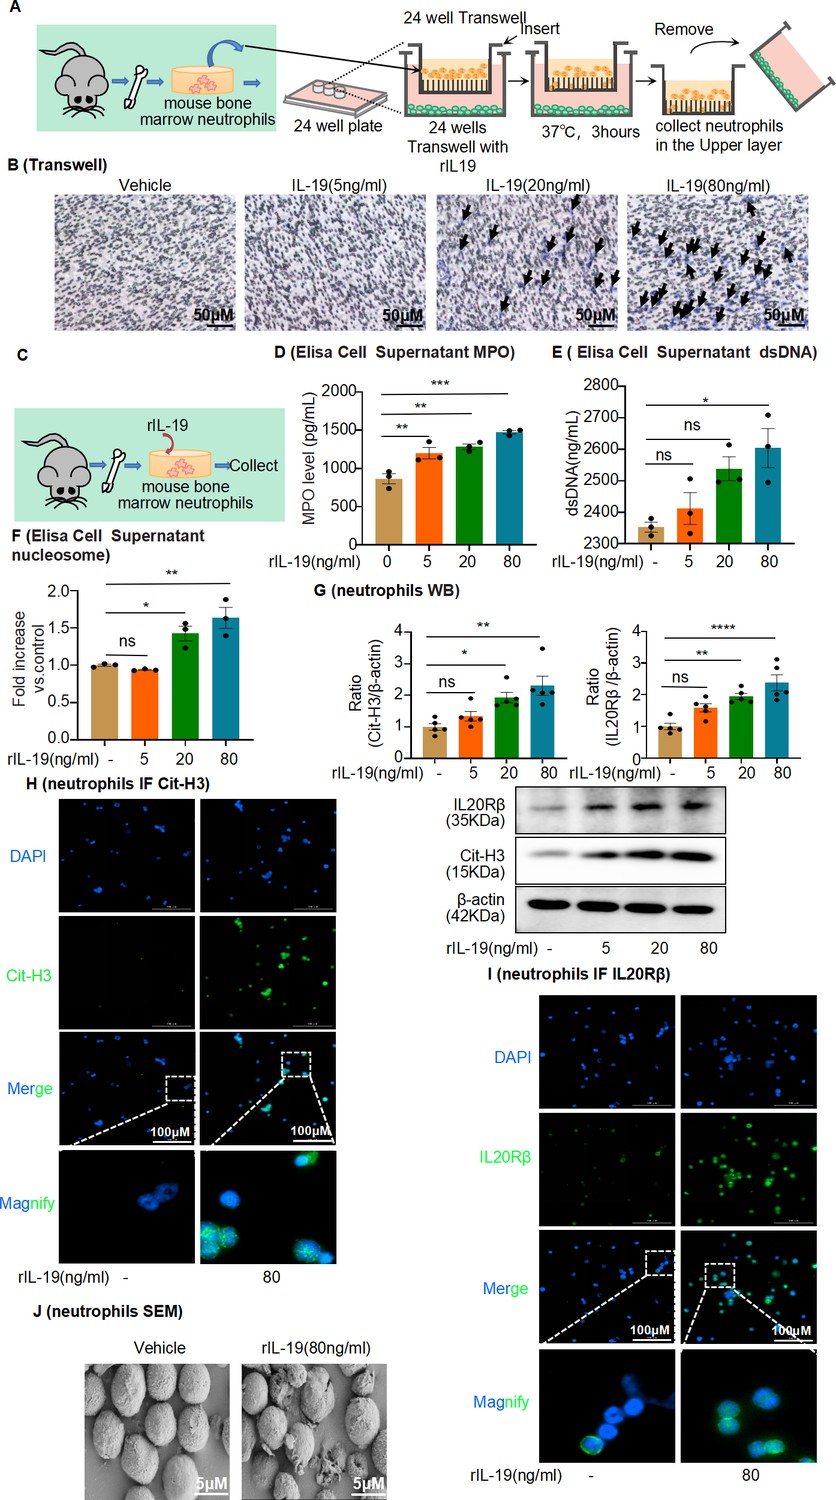
Interleukin-19 (IL-19) induces neutrophil extracellular trap (NET) formation in vitro through IL-20Rβ receptor signaling.
(A) Schematic of Transwell migration assay for neutrophils. (B) Neutrophils were isolated from mouse bone marrow and loaded into the upper Transwell chamber. Serum-free RPMI-1640 medium (500 μL) containing 1% penicillin/streptomycin (P/S), with or without different concentrations of IL-19, was added to the lower chamber. Neutrophil migration was detected by crystal violet staining. Neutrophils are marked by black arrows (n = 3). Scale bar, 50 μm. (C) Mouse bone marrow-derived neutrophils were treated with different concentrations of IL-19 (5 ng/mL, 20 ng/mL, 80 ng/mL) for 4 hr and then collected. (D, E) Level of myeloperoxidase (MPO) and dsDNA in the cell culture supernatant assessed after treatment with different concentrations of IL-19 (n = 3). (F) Level of nucleosomes in the cell culture supernatant assessed after treatment with different concentrations of IL-19 (n = 3). (G) Protein levels of IL-20Rβ and citrullinated histone 3 (Cit-H3) assessed by western blotting after treatment with different concentrations of IL-19 (n = 5). (H, I) Immunofluorescence staining of IL-20Rβ and Cit-H3 of neutrophils after treatment with different concentrations of IL-19 (n = 3). Scale bar, 100 μm. (J) Representative scanning electron microscopy images of vehicle- and IL-19-stimulated neutrophils (NETs, n = 3). Scale bar, 5 μm. Data are presented as the mean ± SEM of 3–5 biological replicates per condition. Each dot represents a sample. Significant differences were determined by an independent sample t-test and one-way ANOVA followed by Tukey’s post hoc test (D–G). *p<0.05, **p<0.01, ***p<0.001, ****p<0.0001, ns: non-significant.
-
Figure 9—source data 1
Data represented by each point in Figure 9D–G.
- https://cdn.elifesciences.org/articles/89740/elife-89740-fig9-data1-v2.zip
-
Figure 9—source data 2
Uncropped western blots for Figure 9G.
- https://cdn.elifesciences.org/articles/89740/elife-89740-fig9-data2-v2.zip
Figure 9—figure supplement 1
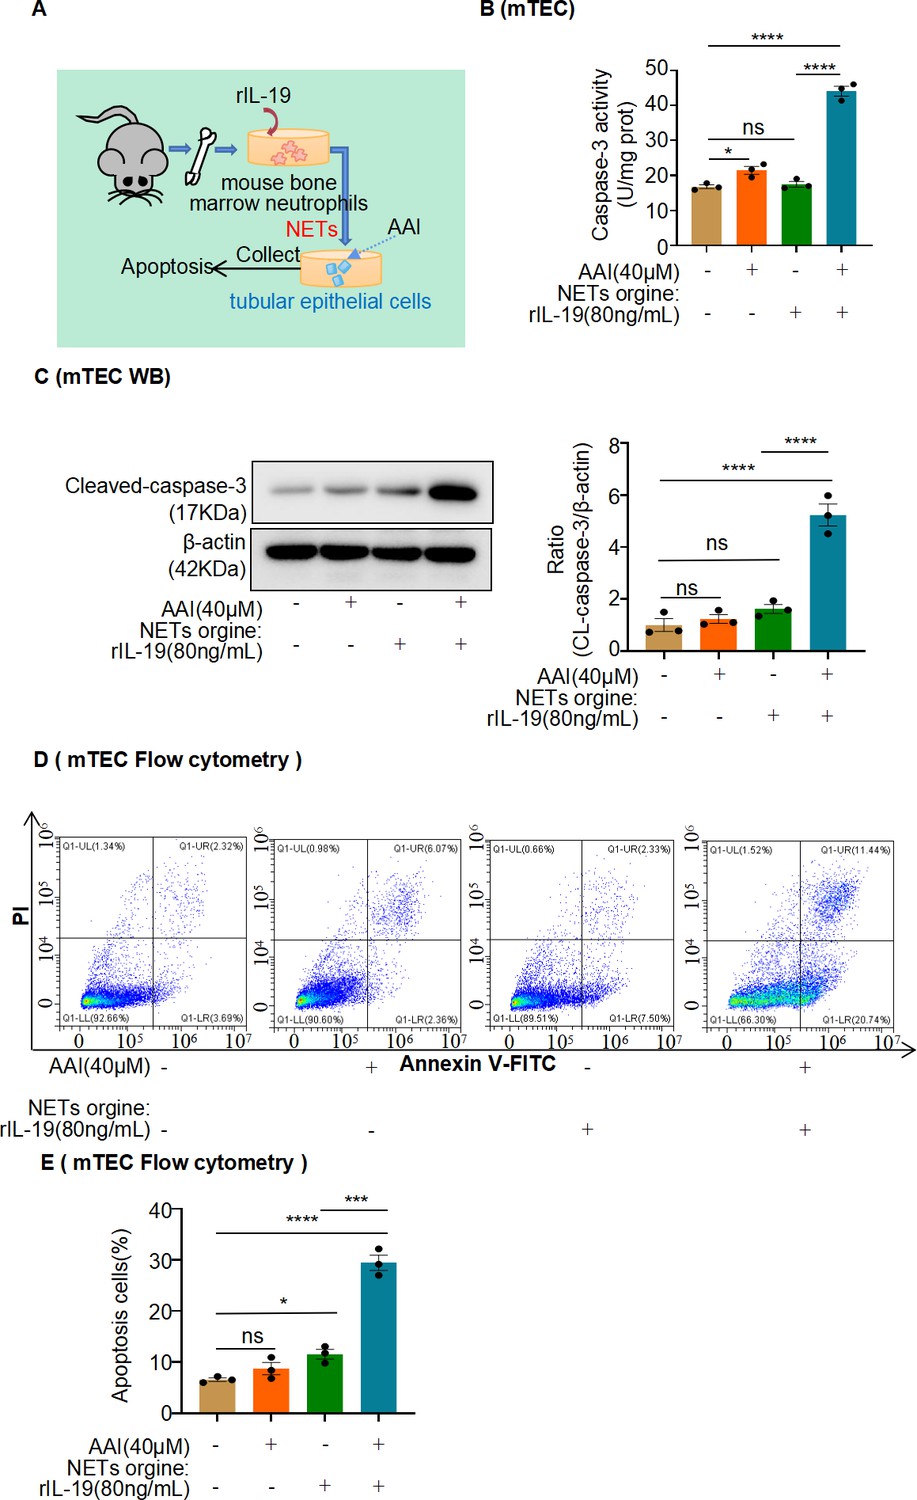
Conditional medium (CM) derived from mouse bone marrow-derived neutrophils co-treated with interleukin-19 (IL-19) promotes apoptosis of injured mouse renal tubular epithelial cells (mRTECs).
(A) Mouse bone marrow-derived neutrophil/mRTEC-conditioned medium culture model. (B) Activity of caspase-3 quantified after treatment with different CMs (n = 3). (C) Protein levels of cleaved caspase-3 assessed by western blotting after treatment with different CMs (n = 3). (D) Level of apoptosis in mRTECs treated with different CMs detected using flow cytometry (n = 3). (E) Quantity of apoptotic mRTECs cultured with different CMs (n = 3). Data are presented as the mean ± SEM of three biological replicates per condition. Each dot represents a sample. Significant differences were determined by an independent sample t-test and one-way ANOVA followed by Tukey’s post hoc test. *p<0.05, ***p<0.001, ****p<0.0001, ns: nonsignificant.
-
Figure 9—figure supplement 1—source data 1
Data represented by each point in Figure 9—figure supplement 1B, C, and E.
- https://cdn.elifesciences.org/articles/89740/elife-89740-fig9-figsupp1-data1-v2.zip
-
Figure 9—figure supplement 1—source data 2
Uncropped western blots for Figure 9—figure supplement 1C.
- https://cdn.elifesciences.org/articles/89740/elife-89740-fig9-figsupp1-data2-v2.zip
Figure 10
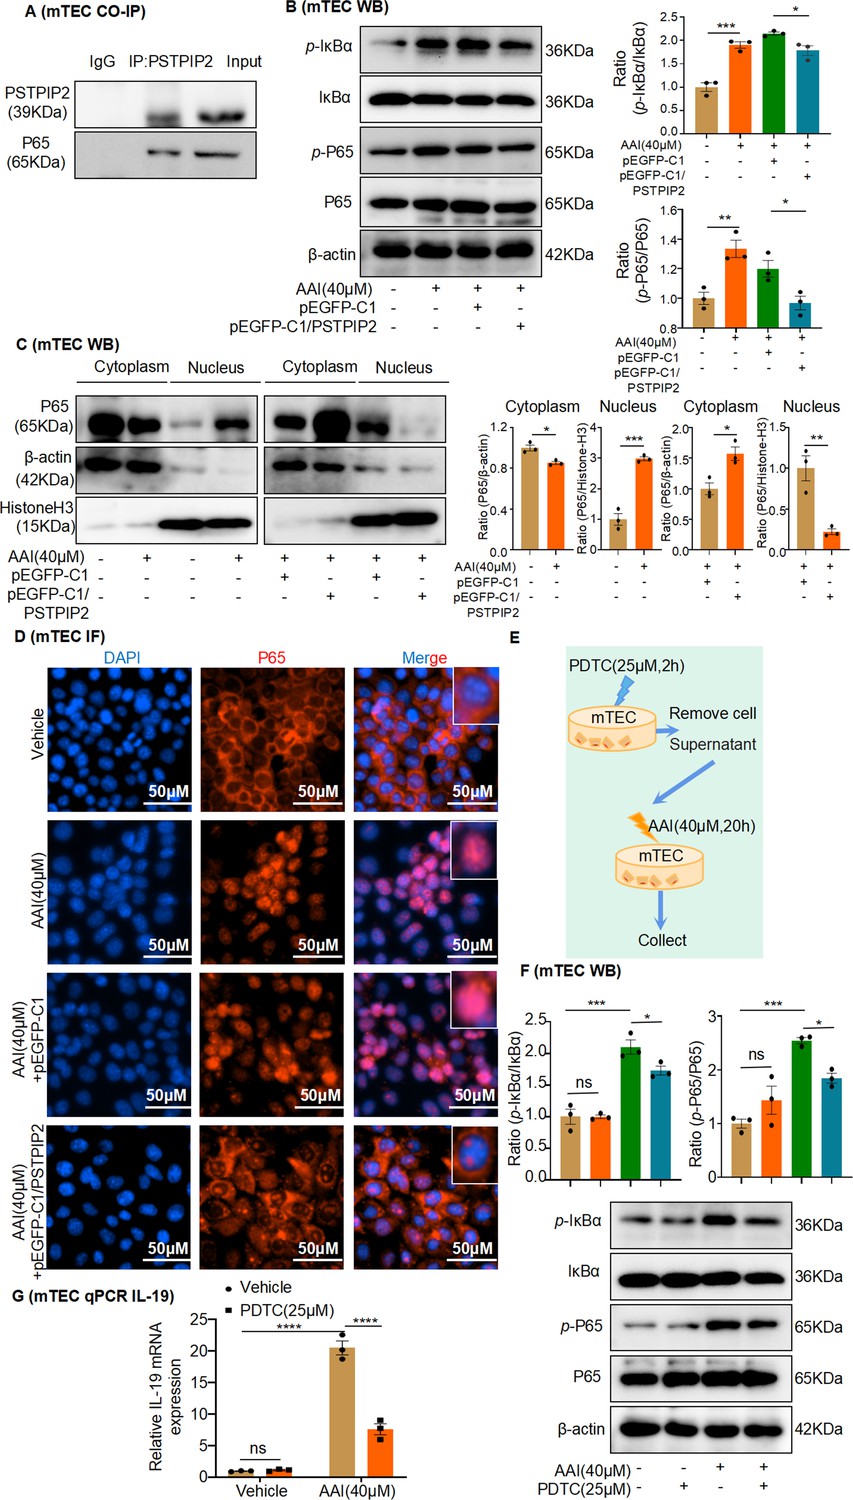
PSTPIP2 reduces interleukin-19 (IL-19) transcription by inhibiting NF-κB signaling.
(A) Co-immunoprecipitation (Co-IP) of PSTPIP2 and NF-κB p65 in mouse renal tubular epithelial cell (mRTEC) using anti-NF-κB p65 and anti-PSTPIP2 antibodies. (B) Western blotting results showed that the protein expression of phosphorylated IκBα and p65 was significantly increased after aristolochic acid I (AAI) stimulation. Overexpression of PSTPIP2 significantly reduced AAI-induced upregulation of phosphorylated IκBα and p65 proteins (n = 3). (C) Expression of NF-κB p65 in the nucleus and cytoplasm of various groups of mRTECs; β-actin and histone H3 were used as cytoplasmic and nuclear protein loading control, respectively (n = 3). (D) Immunofluorescence was used to detect the effect of PSTPIP2 overexpression on the nuclear transfer of p65 (n = 3). (E) NF-κB signaling was inhibited after a 2 hr pretreatment with the NF-κB inhibitor PDTC (25 μM, n = 3). (F) Western blot analysis of phosphorylated IκBα and p65 (n = 3). (G) mRNA level of IL-19 in AAI-treated mRTECs exposed to the NF-κB inhibitor PDTC (25 µM, 2 hr) measured by qPCR (n = 3). Data are presented as the mean ± SEM of three biological replicates per condition. Each dot represents a sample. Significant differences were determined by an independent sample t-test and one-way ANOVA followed by Tukey’s post hoc test (B, C, F, G). *p<0.05, **p<0.01, ***p<0.001, ****p<0.0001, ns: nonsignificant.
-
Figure 10—source data 1
Data represented by each point in Figure 10B, C, F, and G.
- https://cdn.elifesciences.org/articles/89740/elife-89740-fig10-data1-v2.zip
-
Figure 10—source data 2
Uncropped western blots for Figure 10A, B, C, and F.
- https://cdn.elifesciences.org/articles/89740/elife-89740-fig10-data2-v2.zip
Figure 11

PSTPIP2 alleviates aristolochic acid I-induced acute kidney injury and renal tubular epithelial cell apoptosis by suppressing interleukin-19-mediated neutrophil extracellular trap formation.
Author response image 1

Tables
Table 1
Primer sequences for the quantitative real-time PCR analysis of mouse renal tubular epithelial cells (mRTECs) and mouse tissues.
| Terms(mouse) | Forward primer (5'–3') | Reverse primer (5'–3') |
|---|---|---|
| IL1α | TCTATGATGCAAGCTATGGCTCA | CGGCTCTCCTTGAAGGTGA |
| IL1β | GAAATGCCACCTTTTGACAGTG | TGGATGCTCTCATCAGGACAG |
| IL3 | GGGATACCCACCGTTTAACCA | AGGTTTACTCTCCGAAAGCTCTT |
| IL4 | GGTCTCAACCCCCAGCTAGT | GCCGATGATCTCTCTCAAGTGAT |
| IL5 | GCAATGAGACGATGAGGCTTC | GCCCCTGAAAGATTTCTCCAATG |
| IL6 | CTGCAAGAGACTTCCATCCAG | AGTGGTATAGACAGGTCTGTTGG |
| IL7 | TTCCTCCACTGATCCTTGTTCT | AGCAGCTTCCTTTGTATCATCAC |
| IL9 | ATGTTGGTGACATACATCCTTGC | TGACGGTGGATCATCCTTCAG |
| IL10 | CTTACTGACTGGCATGAGGATCA | GCAGCTCTAGGAGCATGTGG |
| IL11 | GCGCTGTTCTCCTAACCCG | GAGTCCAGACTGTGATCTCCG |
| IL12α | CAATCACGCTACCTCCTCTTTT | CAGCAGTGCAGGAATAATGTTTC |
| IL13 | TGAGCAACATCACACAAGACC | GGCCTTGCGGTTACAGAGG |
| IL14 | TCCTGAGTACATACTGTGTGGAC | GCTGCATAGGTTCGGGACTTC |
| IL15 | CATCCATCTCGTGCTACTTGTG | GCCTCTGTTTTAGGGAGACCT |
| IL16 | AAGAGCCGGAAATCCACGAAA | GTGCGAGGTCTGGGATATTGC |
| IL17A | TCAGCGTGTCCAAACACTGAG | CGCCAAGGGAGTTAAAGACTT |
| IL17F | TGCTACTGTTGATGTTGGGAC | CAGAAATGCCCTGGTTTTGGT |
| IL18 | GTGAACCCCAGACCAGACTG | CCTGGAACACGTTTCTGAAAGA |
| IL19 | CTCCTGGGCATGACGTTGATT | GCATGGCTCTCTTGATCTCGT |
| IL20 | GTCTTGCCTTTGGACTGTTCT | AGGTTTGCAGTAATCACACAGC |
| IL21 | GGACCCTTGTCTGTCTGGTAG | TGTGGAGCTGATAGAAGTTCAGG |
| IL22 | ATGAGTTTTTCCCTTATGGGGAC | GCTGGAAGTTGGACACCTCAA |
| IL23 | CAGCAGCTCTCTCGGAATCTC | TGGATACGGGGCACATTATTTTT |
| IL24 | GAGCCTGCCCAACTTTTTGTG | TGTGTTGAAGAAAGGGCCAGT |
| IL25 | ACAGGGACTTGAATCGGGTC | TGGTAAAGTGGGACGGAGTTG |
| IL27 | CTGTTGCTGCTACCCTTGCTT | CTCCTGGCAATCGAGATTCAG |
| IL28B | GTTCAAGTCTCTGTCCCCAAAA | GTGGGAACTGCACCTCATGT |
| IL31 | TCAGCAGACGAATCAATACAGC | TCGCTCAACACTTTGACTTTCT |
| IL33 | ATTTCCCCGGCAAAGTTCAG | AACGGAGTCTCATGCAGTAGA |
| IL34 | TTGCTGTAAACAAAGCCCCAT | CCGAGACAAAGGGTACACATTT |
| IL40 | ACTGGAAGTTTATCCCCAAAGC | CGGAGTCATGCACAACCTTTTT |
| Kim-1 | TAAACCAGAGATTCCCACAC | GATCTTGTTGAAATAGTCGTG |
| MCP-1 | GCTTGAGGTGGTTGTGGAAAA | CTCACCTGCTGCTACTCATTC |
| β-Actin | GATTACTGCTCTGGCTCCTAGC | GACTCATCGTACTCCTGCTTG |
| TNF-α | CCCTCACACTCAGATCATCTTCT | GCTACGACGTGGGCTACAG |
Table 2
Clinical features of the patients with kidney diseases.
| No. | Pathological diagnosis | Sex | Age (years) | Serum creatinine (μmol/L) | Serum IL-19 (ng/mL) |
|---|---|---|---|---|---|
| 1 | Kidney transplant | Female | 19 | 198.4278 | 274.4815 |
| 2 | Kidney transplant | Female | 33 | 144.0580 | 297.7699 |
| 3 | Hydronephrosis with ureteral stones | Male | 48 | 216.9878 | 125.0563 |
| 4 | Hydronephrosis with nephrolithiasis | Male | 47 | 158.1964 | 199.1192 |
| 5 | Renal allograft dysfunction | Male | 27 | 450.1882 | 308.2646 |
| 6 | Allograft dysfunction, renal allograft | Male | 36 | 444.1835 | 161.4381 |
| 7 | Renal anemia, 5 CKD stage | Male | 58 | 1225.2303 | 340.7484 |
| 8 | CKD stage 3, type 2 diabetes | Female | 76 | 129.5376 | 199.1192 |
| 9 | Nephrotic syndrome with minimal change nephropathy | Female | 21 | 160.7620 | 231.6030 |
| 10 | Renal end-stage disease | Male | 35 | 1250.3954 | 391.4230 |
| 11 | Nephrotic syndrome | Male | 56 | 124.0242 | 240.0487 |
| 12 | Polycystic kidney disease | Female | 57 | 210.0129 | 147.1452 |
| 13 | Renal end-stage disease | Female | 38 | 1229.0289 | 468.0847 |
| 14 | Chronic renal failure | Male | 57 | 807.2540 | 218.6095 |
| 15 | Hydronephrosis with nephroureterolithiasis, type I diabetes | Female | 53 | 83.8521 | 226.4056 |
| 16 | Diabetes | Male | 66 | 82.1029 | 229.0043 |
| 17 | Nephrolithiasis with hydronephrosis | Male | 34 | 139.9357 | 208.2147 |
| 18 | CKD stage 4 | Male | 55 | 134.3601 | 201.7179 |
| 19 | Membranous nephropathy | Male | 40 | 145.3473 | 253.6919 |
| 20 | Nephrotic syndrome | Male | 46 | 76.5273 | 262.7874 |
| 21 | Hydronephrosis | Female | 52 | 92.5981 | 135.4511 |
| 22 | Renal insufficiency | Male | 82 | 754.3408 | 225.1062 |
| 23 | SLE, lupus nephritis | Male | 32 | 456.8682 | 391.4230 |
| 24 | Hydronephrosis with nephrolithiasis | Female | 68 | 128.7846 | 266.6854 |
| 25 | Diabetes | Male | 43 | 107.3569 | 283.5770 |
| 26 | Membranous nephropathy | Male | 53 | 174.3729 | 442.0977 |
| 27 | Nephrotic syndrome | Male | 46 | 186.9453 | 188.7244 |
Additional files
Download links
A two-part list of links to download the article, or parts of the article, in various formats.
Downloads (link to download the article as PDF)
Open citations (links to open the citations from this article in various online reference manager services)
Cite this article (links to download the citations from this article in formats compatible with various reference manager tools)
PSTPIP2 ameliorates aristolochic acid nephropathy by suppressing interleukin-19-mediated neutrophil extracellular trap formation
eLife 13:e89740.
https://doi.org/10.7554/eLife.89740


