Functional implications of the exon 9 splice insert in GluK1 kainate receptors
- Laboratory of Membrane Protein Biology, National Centre for Cell Science, India
- Laboratory of Membrane Protein Biology, CSIR-Centre for Cellular and Molecular Biology, India
Figures
Figure 1 with 1 supplement
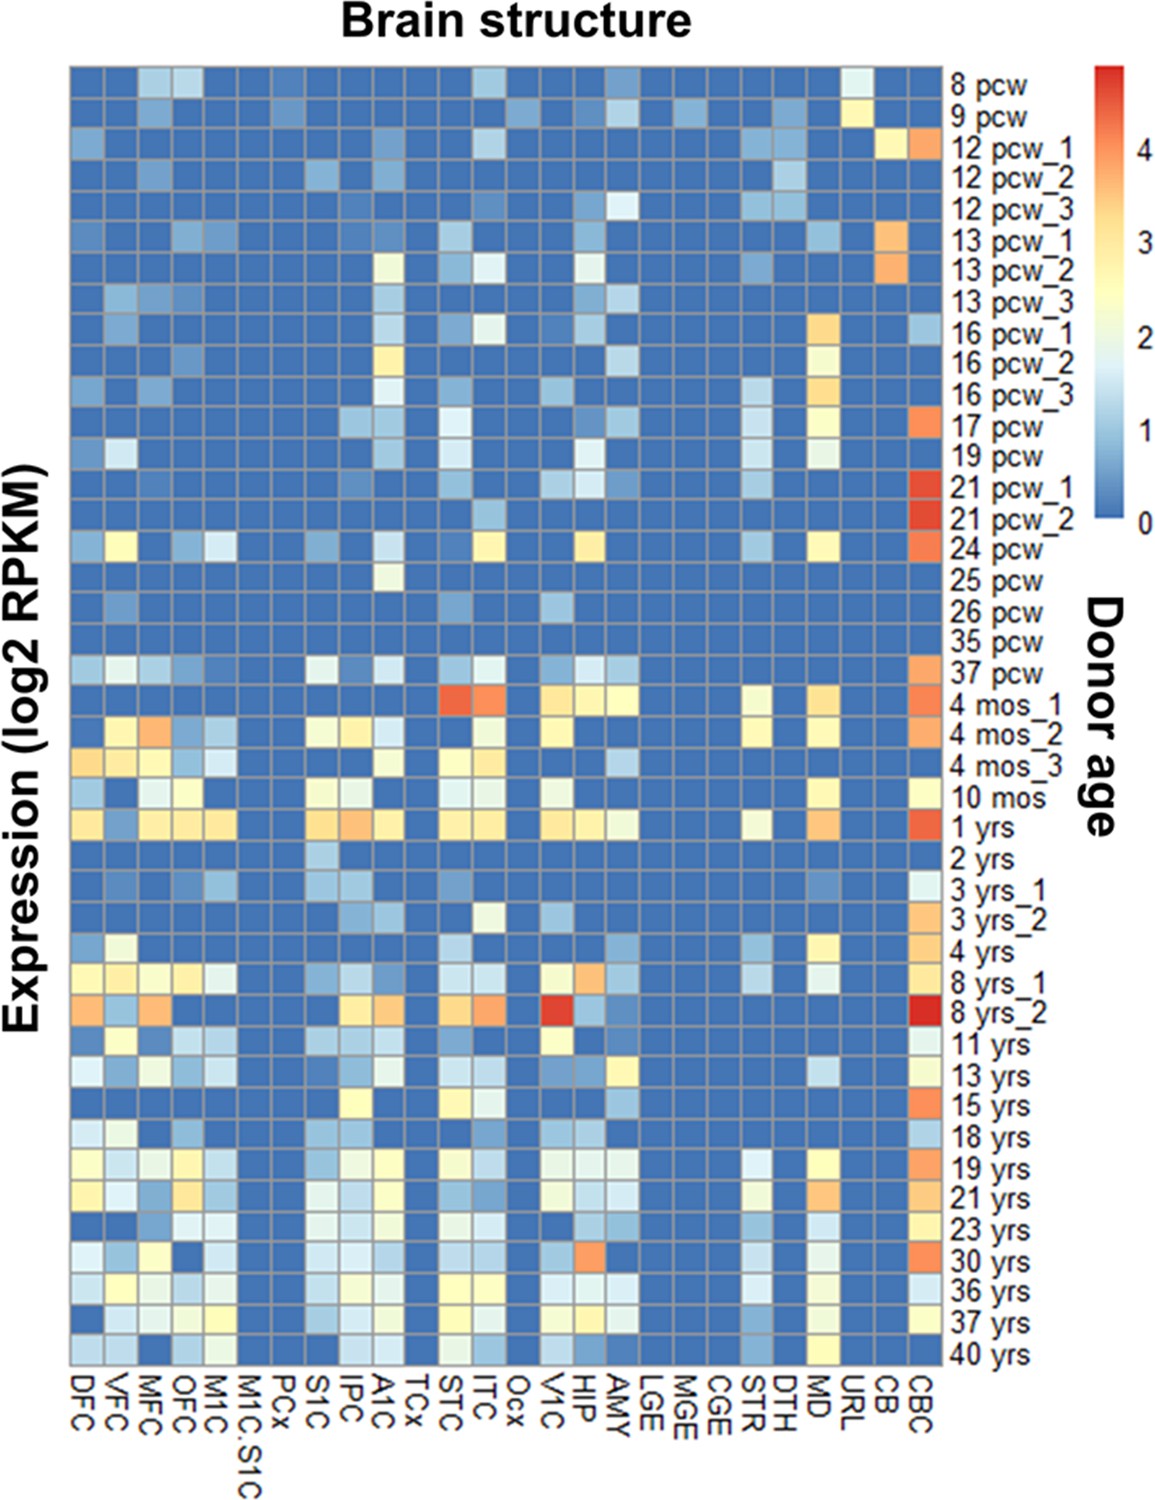
RNA-seq analysis (BrainSpan atlas) demonstrates an abundance of GRIK1 exon 9 in the human brain.
The heat map shows the presence of exon 9 (45 bp; ENSE00001313812) that codes for GluK1 amino-terminal domain (ATD) splice in different brain regions from the embryonic to adult stage. Exon 9 expression coincides with well-studied areas for the GRIK1 gene like the cerebellar cortex, visual cortex, etc. Various regions of the brain and the donor age are represented on the x-axis and y-axis, respectively. The donor age has been abbreviated as pcw (post-conception weeks), mos (months), and yrs (years). The regions of the human brain are abbreviated as: DFC (dorsolateral prefrontal cortex), VFC (ventrolateral prefrontal cortex), MFC (anterior [rostral] cingulate [medial prefrontal] cortex), OFC (orbital frontal cortex), M1C (primary motor cortex area M1, area 4), M1C.S1C (primary motor-sensory cortex [samples]), PCx (parietal neocortex), S1C primary somatosensory cortex (area S1, areas 3,1,2), IPC (posteroventral [inferior] parietal cortex), A1C (primary auditory cortex core), A1C (primary auditory cortex [core]), TCx (temporal neocortex), STC (posterior [caudal] superior temporal cortex, area 22 c), ITC (inferolateral temporal cortex) (area TEv, area 20), OCx (occipital neocortex), V1C primary visual cortex (striate cortex, area V1/17), HIP (hippocampus), AMY (amygdaloid complex), LGE (lateral ganglionic eminence), MGE (medial ganglionic eminence), CGE (caudal ganglionic eminence), STR (striatum), DTH (dorsal thalamus), MD (mediodorsal nucleus of thalamus), URL (upper [rostral] rhombic lip), CB (cerebellum), and CBC (cerebellar cortex). Blue and red color indicates zero and maximum expression, respectively.
-
Figure 1—source data 1
RNA-seq analysis data for GRIK1 exon 9.
- https://cdn.elifesciences.org/articles/89755/elife-89755-fig1-data1-v1.xlsx
Figure 1—figure supplement 1
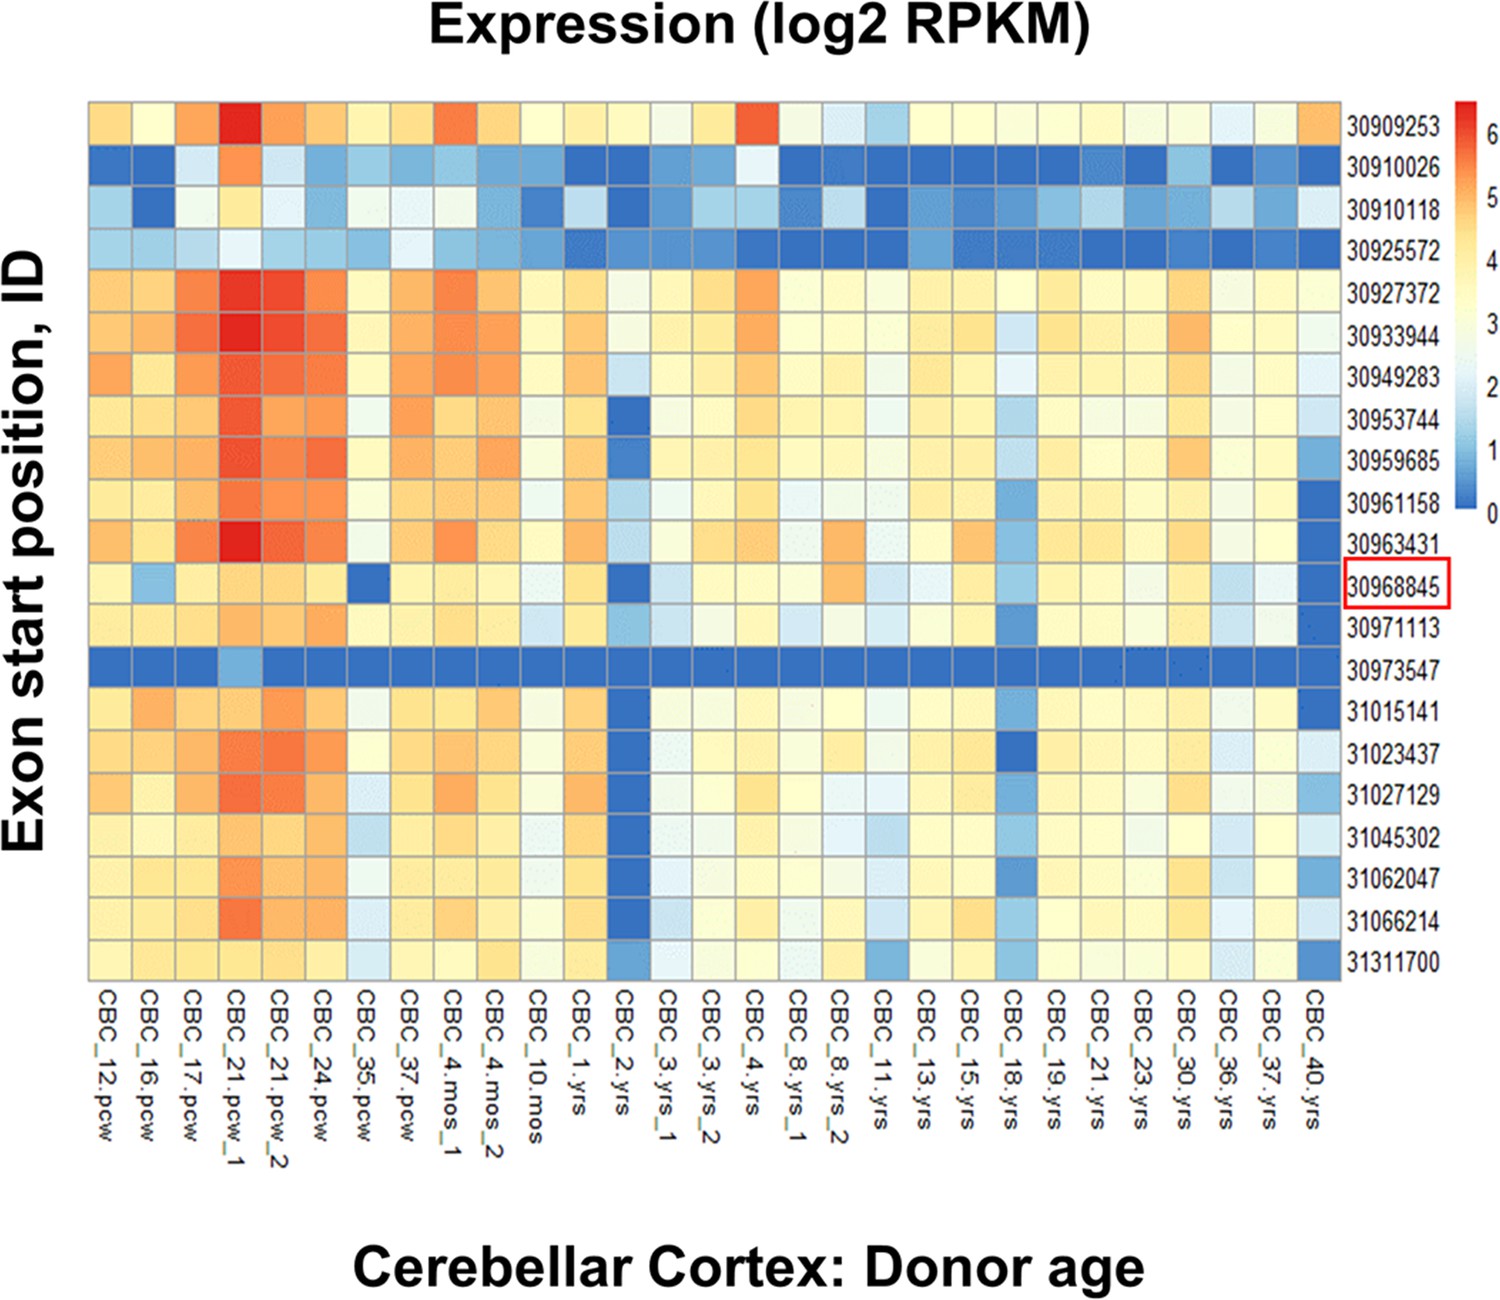
Representative RNA-seq analysis (BrainSpan atlas) of the cerebellar cortex (CBC) demonstrates the high expression of exon 9 in the human brain.
To delve deeper into the high expression areas from Figure 1, the cerebellar cortex was chosen as an example to understand the expression pattern of Exon 9 with respect to other GluK1 exons. The heat map displays the abundance of the GluK1 exons at different stages of human life. Exon 9 (Exon start position: 30968845; marked by a red box) expression coincides with reported high expression of GluK1 kainate receptors in the early developmental stages of humans. Blue and red color indicates zero and maximum expression, respectively.
-
Figure 1—figure supplement 1—source data 1
RNA-seq analysis data for GRIK1 exon 9 for cerebellar cortex (CBC).
- https://cdn.elifesciences.org/articles/89755/elife-89755-fig1-figsupp1-data1-v1.xlsx
Figure 2 with 1 supplement
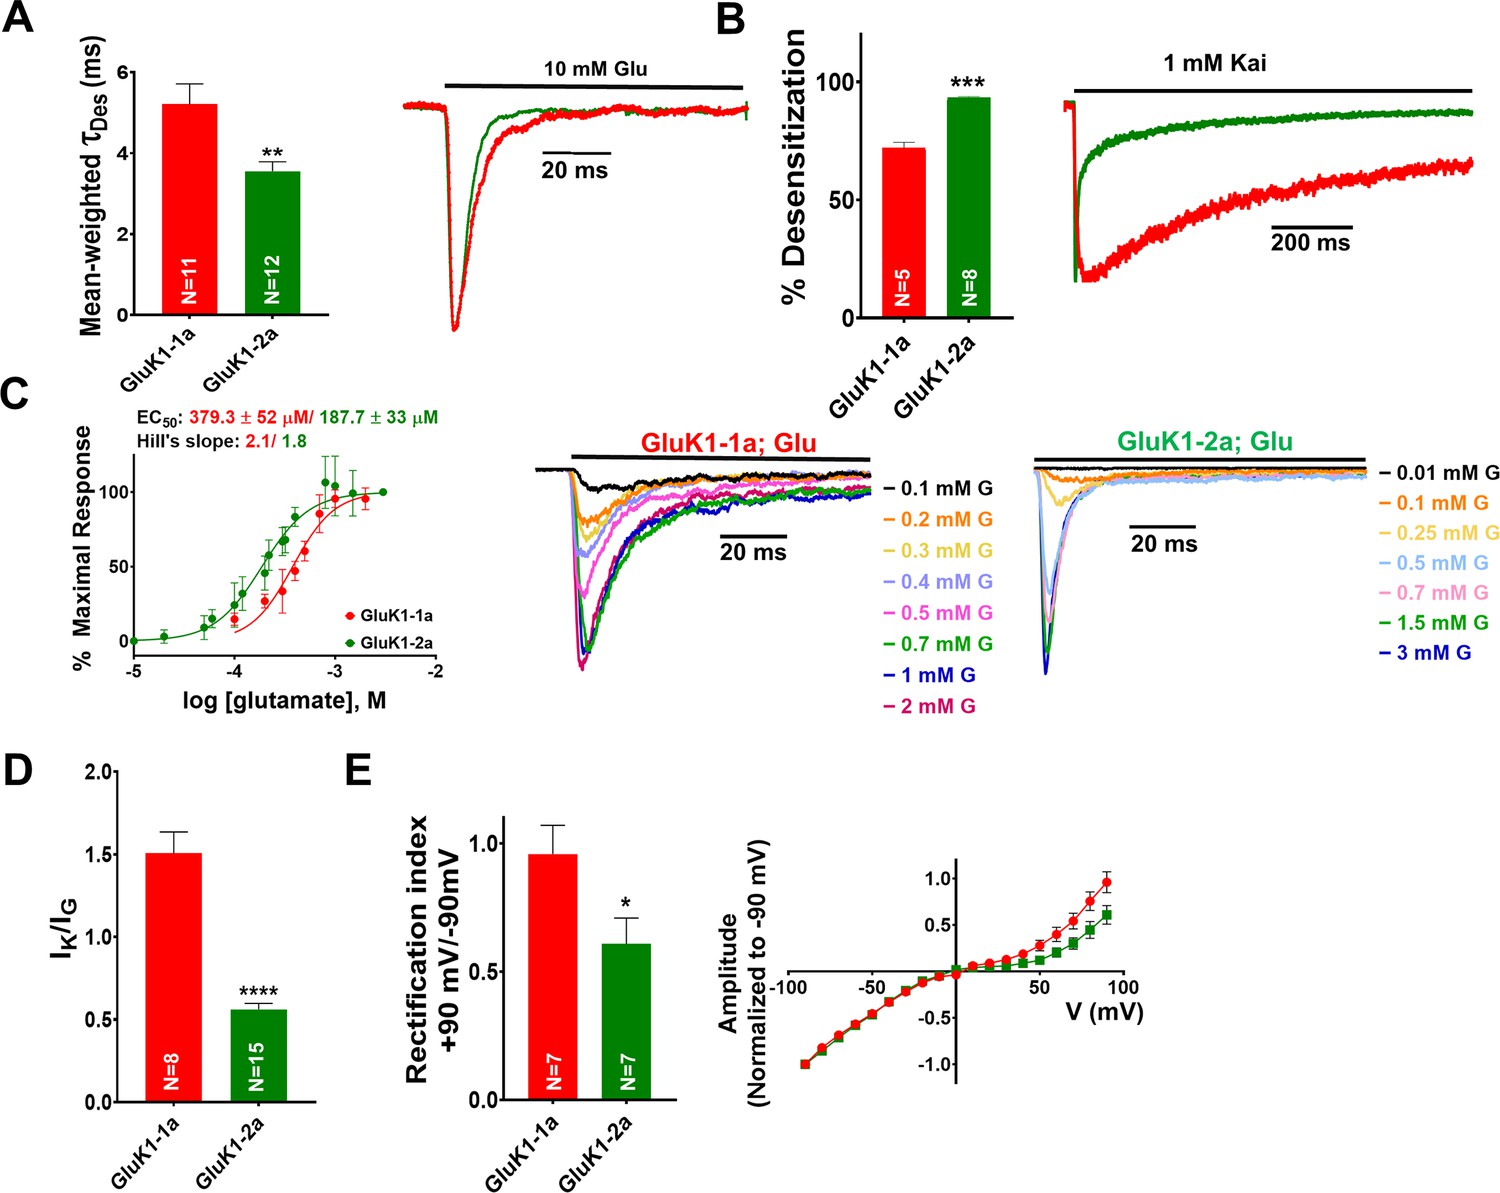
Amino-terminal domain (ATD) splice insert affects the gating properties of the GluK1-1a homomeric receptors.
(A) Displays mean-weighted Tau (τDes) values for GluK1-1a wild-type (red) and GluK1-2a wild-type (green) in the presence of glutamate. The inset shows representative normalized traces for GluK1-1a and GluK1-2a with 10 mM glutamate. (B) Displays the percent desensitization values calculated at 1 s for GluK1-1a wild-type (red) and GluK1-2a wild-type (green) in the presence of kainate. Representative normalized traces for GluK1-1a and GluK1-2a with 1 mM kainate are shown. (C) Demonstrates glutamate dose-response curves for GluK1-1a and GluK1-2a. Representative aligned traces for both receptors at various glutamate concentrations are shown. The kainate dose responses for the splice variants are shown in Figure 2—figure supplement 1. (D) The ratio of currents evoked by kainate and glutamate is plotted for GluK1-1a and GluK1-2a. (E) The ratio of currents evoked by the application of 10 mM glutamate at +90 mV and –90 mV for the GluK1-1a and GluK1-2a receptors is shown. Representative IV plots are depicted for GluK1-1a and GluK1-2a for the entire voltage ramp (–90 to +90 mV). Error bars indicate mean ± SEM, N in each bar represents the number of cells used for analysis, and * indicates the significance at a 95% confidence interval.
-
Figure 2—source data 1
Data used for the electrophysiology plots.
- https://cdn.elifesciences.org/articles/89755/elife-89755-fig2-data1-v1.xlsx
Figure 2—figure supplement 1
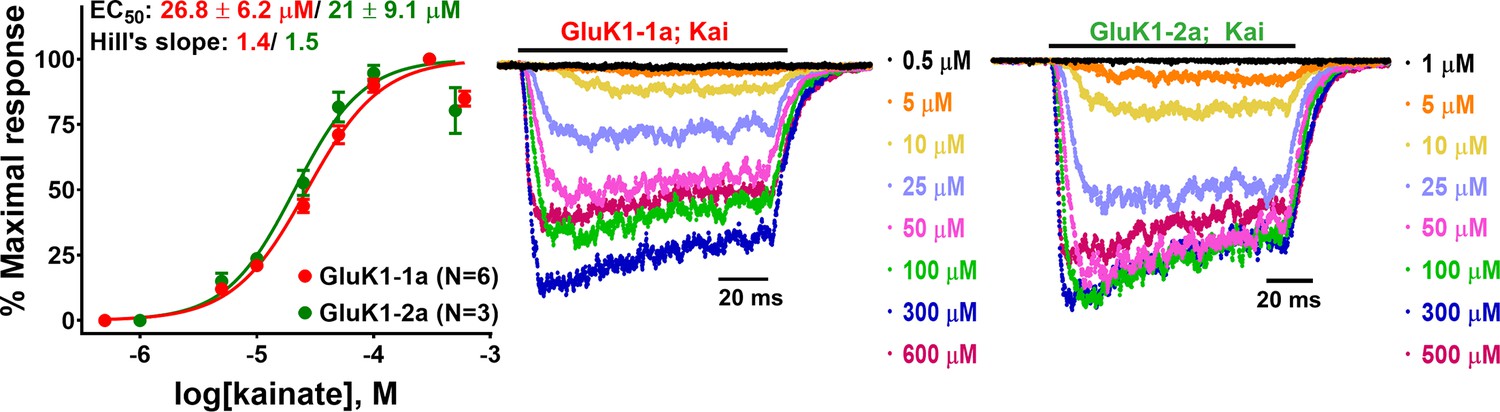
Kainate-evoked responses for GluK1 receptors.
The figure demonstrates the normalized kainate dose-response curves for GluK1-1a and GluK1-2a along with their representative traces.
-
Figure 2—figure supplement 1—source data 1
Data used for the electrophysiology plots.
- https://cdn.elifesciences.org/articles/89755/elife-89755-fig2-figsupp1-data1-v1.xlsx
Figure 3 with 1 supplement
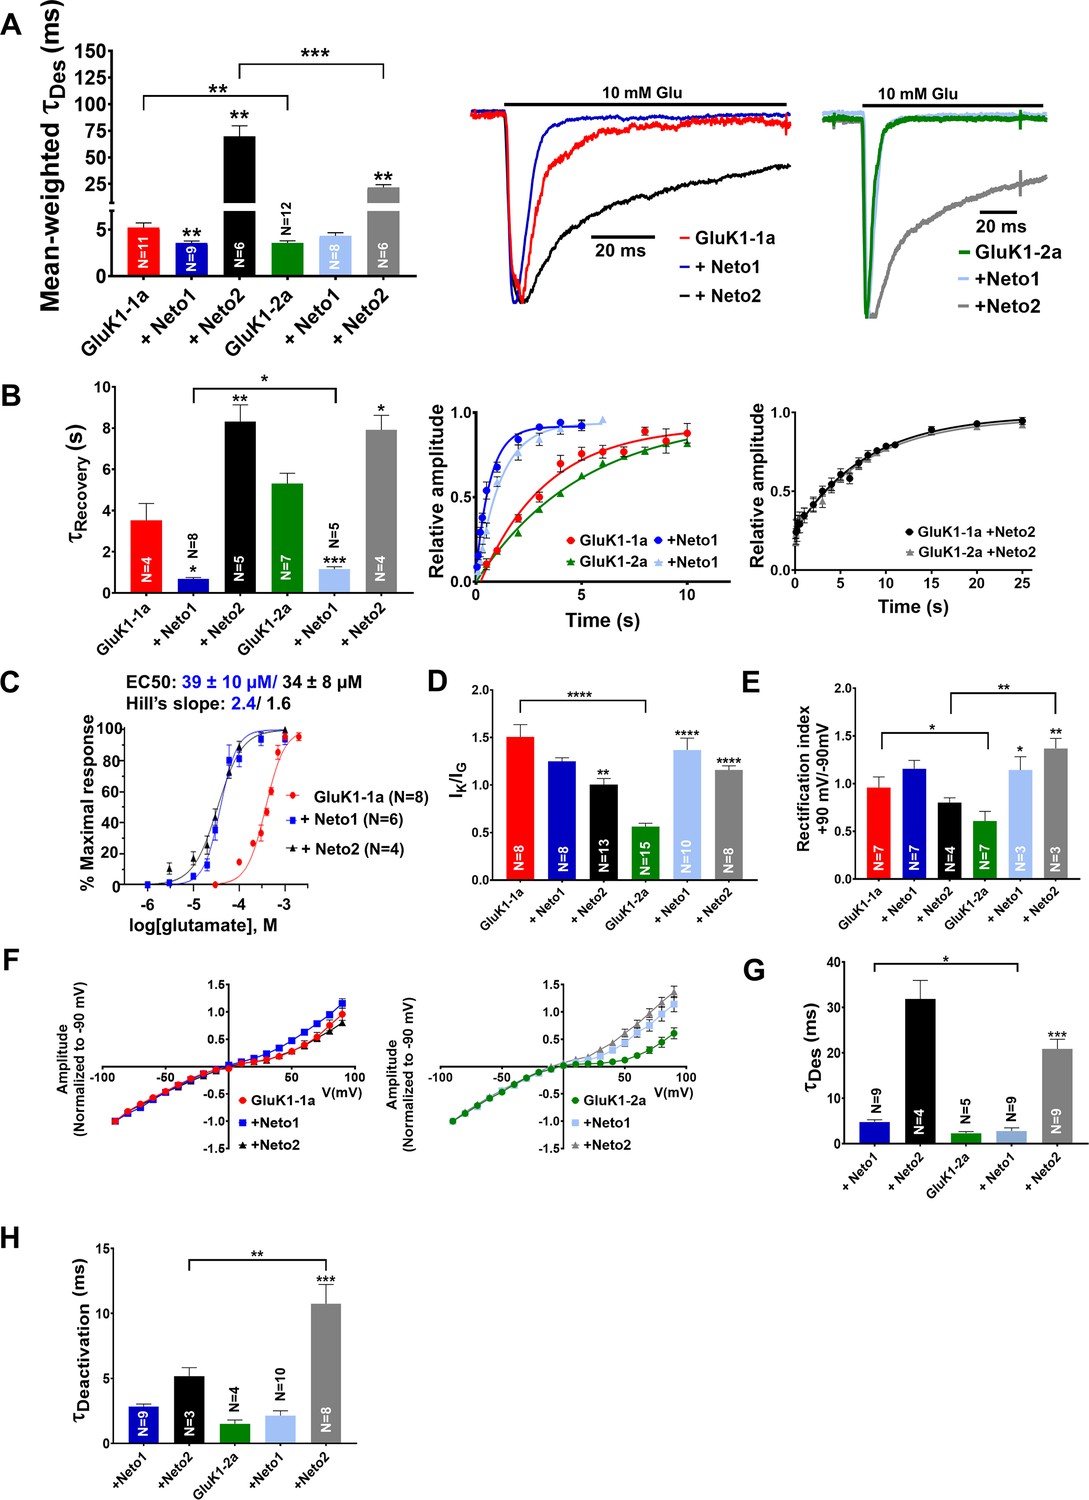
Amino-terminal domain (ATD) splice affects the functional modulation of GluK1 kainate receptors by Neto proteins.
(A) Shows mean-weighted Tau (τDes) values calculated at 100 ms for GluK1-1a (red) and GluK1-2a (green), respectively, with full-length Neto1 (blue/light blue) or Neto2 (black/gray), in the presence of glutamate. Representative normalized traces are shown for 100 ms application of 10 mM glutamate for HEK293 cells co-expressing GluK1-1a or GluK1-2a with Neto1 and Neto2. (B) Shows Tau (τRecovery) values plotted for GluK1-1a and GluK-2a, respectively, with full-length Neto1 or Neto2. Relative amplitude graphs for each receptor in the absence or presence of Neto proteins are also depicted. (C) Demonstrates the glutamate dose-response curves for GluK1-1a with Neto proteins. (D) Indicates the ratio of peak amplitudes evoked in the presence of 1 mM kainate and 10 mM glutamate for GluK1-1a or GluK1-2a with or without Neto proteins. (E) The ratio of currents evoked by the application of 10 mM glutamate at +90 mV and –90 mV for the receptors in the absence or presence of Neto proteins is shown. (F) Shows representative IV plots for GluK1-1a and GluK1-2a for the receptor alone versus with Neto proteins, respectively. Panels (G) and (H) show data recorded from outside-out pulled patches. (G) Displays desensitization kinetics for GluK1-1a (red) and GluK1-2a (green) with or without Neto proteins, respectively. (H) Shows deactivation kinetics at 1 ms for GluK1-1a (red) and GluK1-2a (green) with or without Neto proteins. Error bars indicate mean ± SEM, N in each bar represents the number of cells used for analysis, and * indicates the significance at a 95% confidence interval.
-
Figure 3—source data 1
Data used for the electrophysiology plots.
- https://cdn.elifesciences.org/articles/89755/elife-89755-fig3-data1-v1.xlsx
Figure 3—figure supplement 1
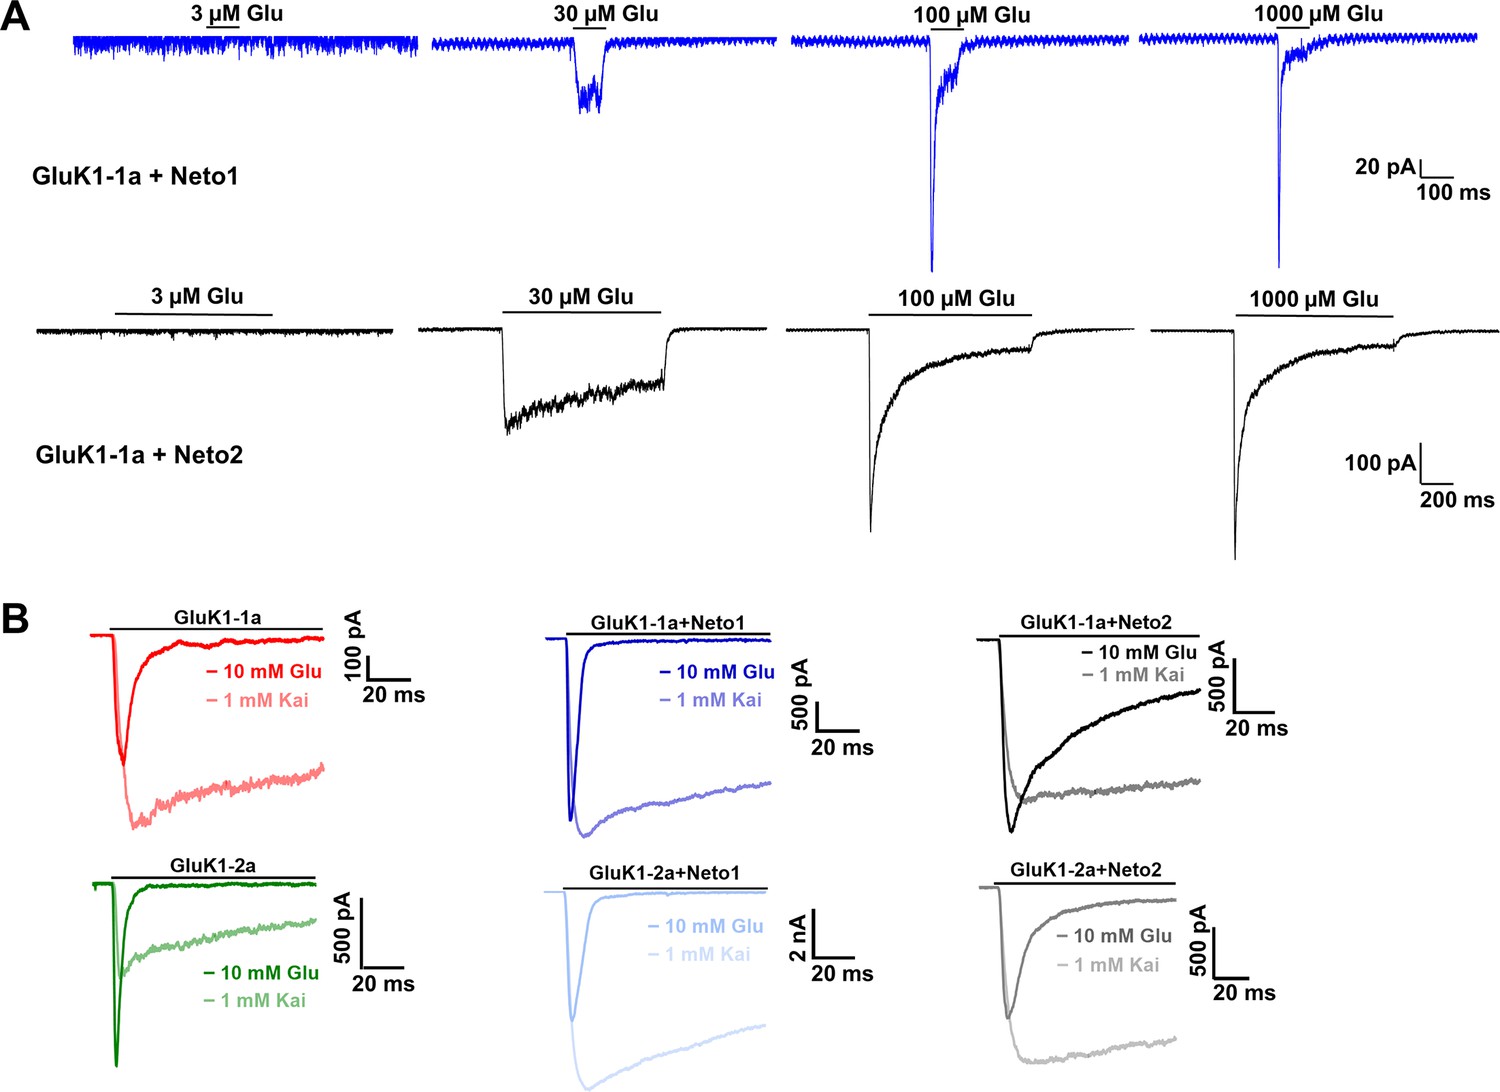
Effect of Neto proteins on agonist-evoked responses of GluK1 receptors.
(A) Displays representative traces for GluK1-1a in the presence of Neto1 (blue) or Neto2 (black) with varying concentrations of glutamate (3 µM, 30 µM, 100 µM, and 1000 µM). Ligand application for receptors with Neto1 and Neto2 was 100 ms, and 1000 ms, respectively. (B) Representative 100ms traces for currents evoked in the presence of glutamate vs. kainate in the absence and presence of Neto proteins.
-
Figure 3—figure supplement 1—source data 1
Data used for the electrophysiology plots.
- https://cdn.elifesciences.org/articles/89755/elife-89755-fig3-figsupp1-data1-v1.xlsx
Figure 4
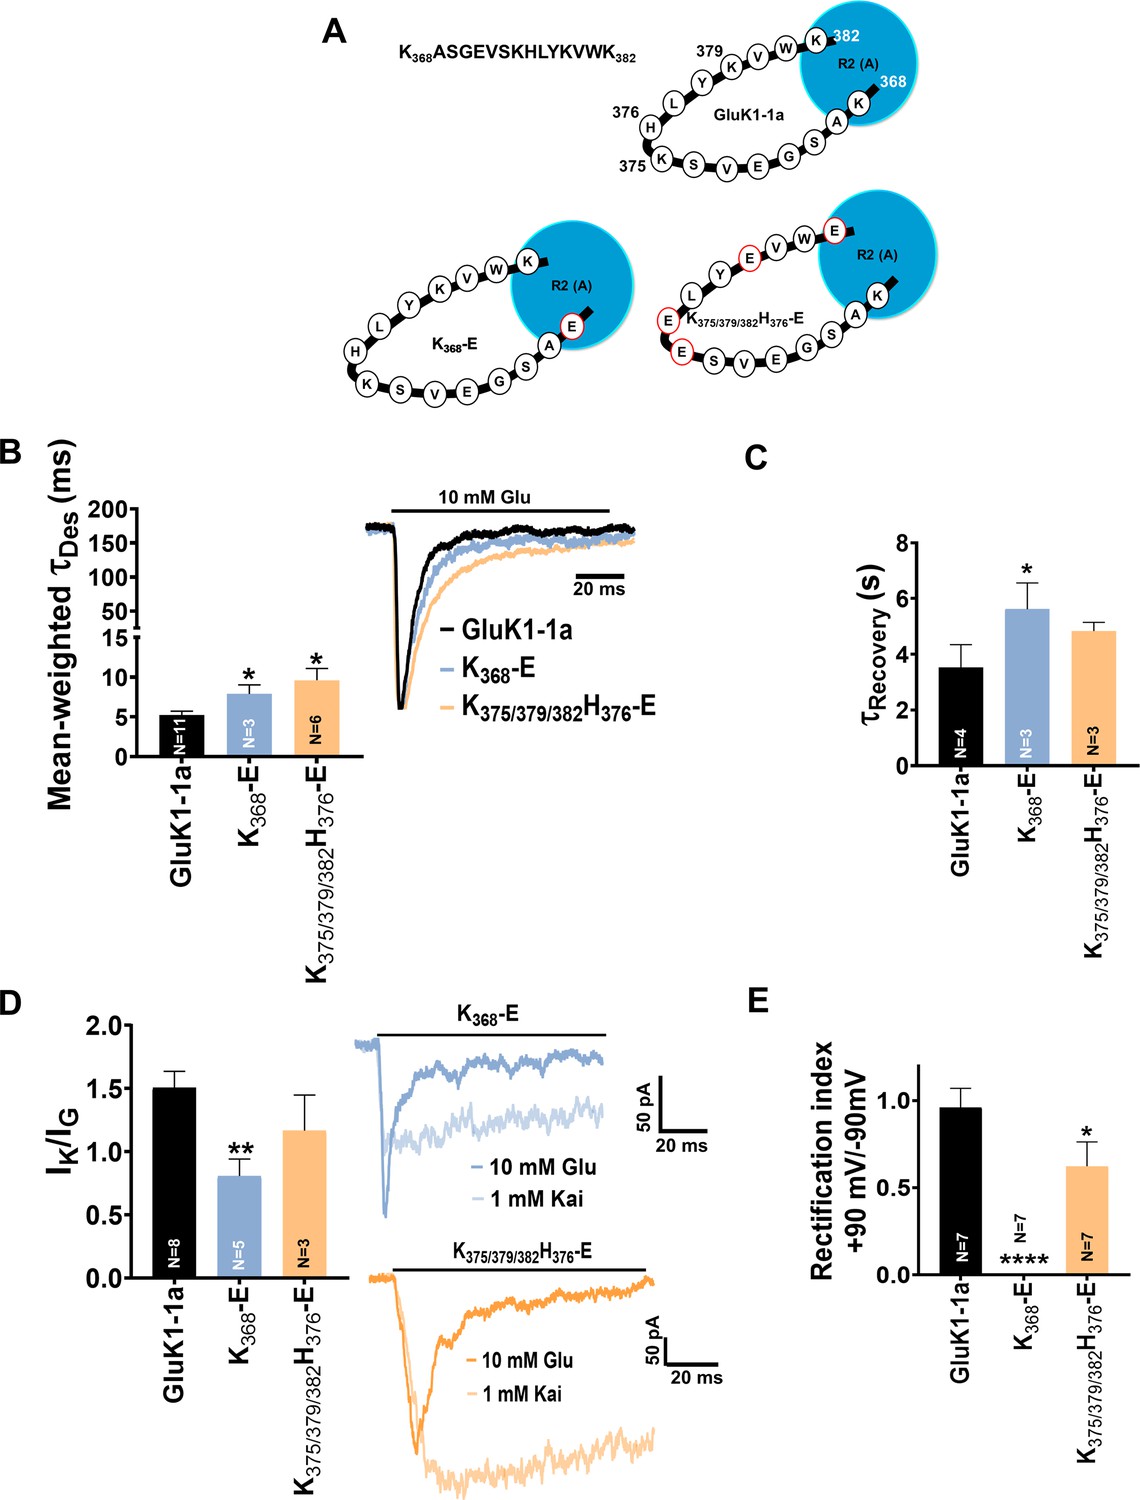
Mutation of GluK1-1a splice insert residues affects the desensitization and recovery kinetics of the receptor.
Bar graphs (mean ± SEM) show a comparison between wild-type and mutant receptors for different kinetic properties. (A) Schematic representation of 15 residues amino-terminal domain (ATD) splice (K368ASGEVSKHLYKVWK382) in wild-type and mutant receptors under study (B) Mean-weighted Tau (τDes) values for GluK1-1a wild-type and mutant receptors in the presence of 10 mM glutamate. (C) Tau (τRecovery) recovery values for GluK1-1a and mutants. (D) The ratio of the peak amplitudes evoked in the presence of 1 mM kainate and 10 mM glutamate is shown for GluK1-1a mutants.(E) The rectification index represented by the ratio of currents evoked by 10 mM glutamate application at +90 mV and –90 mV for the wild-type and mutant receptors is shown. The wild-type GluK1 splice variant data is the same as from Figure 2A and is replotted here for comparison. Error bars indicate mean ± SEM, N in each bar represents the number of cells used for analysis, and * indicates the significance at a 95% confidence interval.
-
Figure 4—source data 1
Data used for the electrophysiology plots.
- https://cdn.elifesciences.org/articles/89755/elife-89755-fig4-data1-v1.xlsx
-
Figure 4—source data 2
GluK1-1a amino-terminal domain (ATD) splice mutants.
The various mutants used in the study and the primer sequences to make charge-neutral and charge-reversal mutants in GluK1-1a are tabulated.
- https://cdn.elifesciences.org/articles/89755/elife-89755-fig4-data2-v1.docx
Figure 5 with 2 supplements
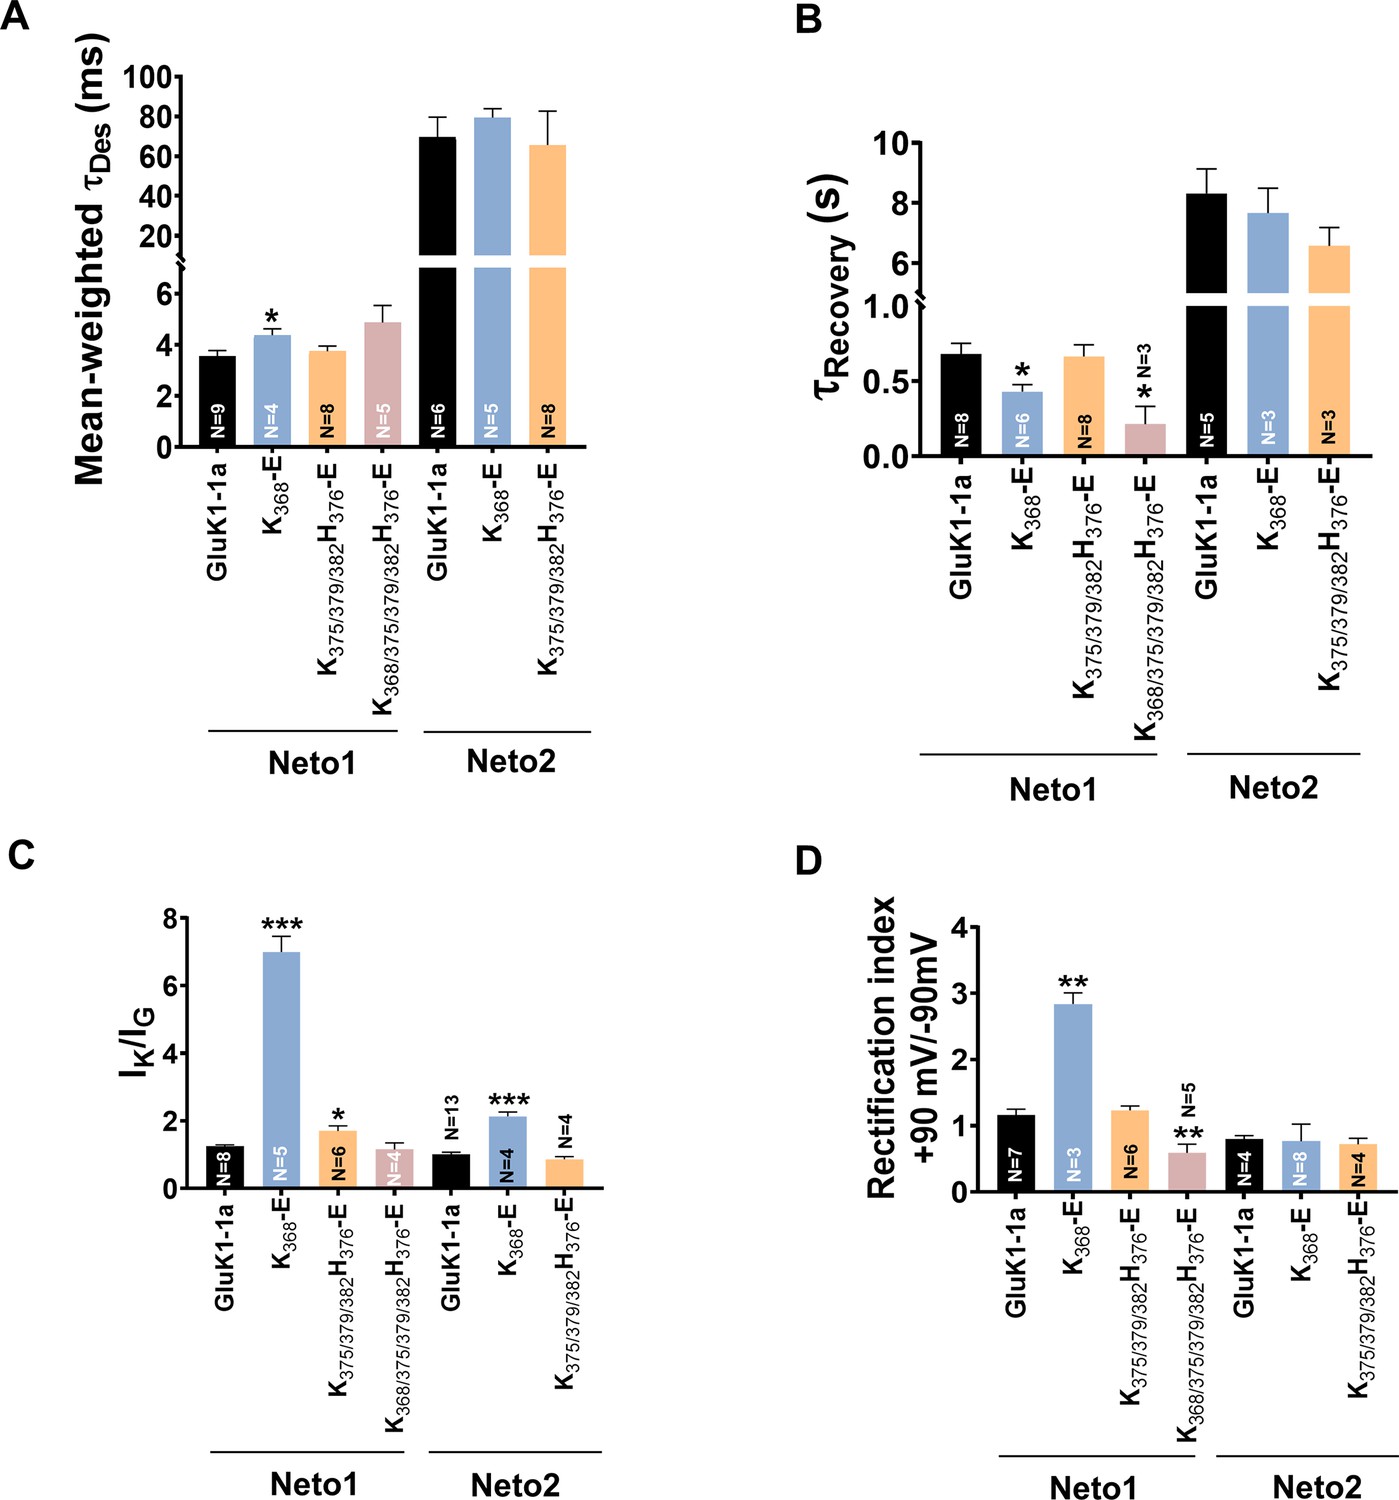
Mutation of GluK1-1a splice insert residues affects the receptor modulation by Neto proteins.
Bar graphs (mean ± SEM) show a comparison between wild-type and mutant receptors with Neto proteins for different kinetic properties. (A) Mean-weighted Tau (τDes) values for GluK1-1a wild-type and mutant receptors in the presence of 10 mM glutamate and expressed with Neto1/2. (B) Tau (τRecovery) recovery values for GluK1-1a and mutants with Neto1/2. (C) The ratio of the peak amplitudes evoked in the presence of 1 mM kainate and 10 mM glutamate for GluK1-1a mutants co-expressed with Neto1/2 is shown. (D) The rectification index represented by the ratio of currents evoked by 10 mM glutamate application at +90 mV and –90 mV for the wild-type and mutant receptors with Neto proteins is shown. The wild-type GluK1 splice variants’ data is the same as in Figure 2 and is replotted here for comparison. Error bars indicate mean ± SEM, N in each bar represents the number of cells used for analysis, and * indicates the significance at a 95% confidence interval.
-
Figure 5—source data 1
Data used for the electrophysiology plots.
- https://cdn.elifesciences.org/articles/89755/elife-89755-fig5-data1-v1.xlsx
Figure 5—figure supplement 1
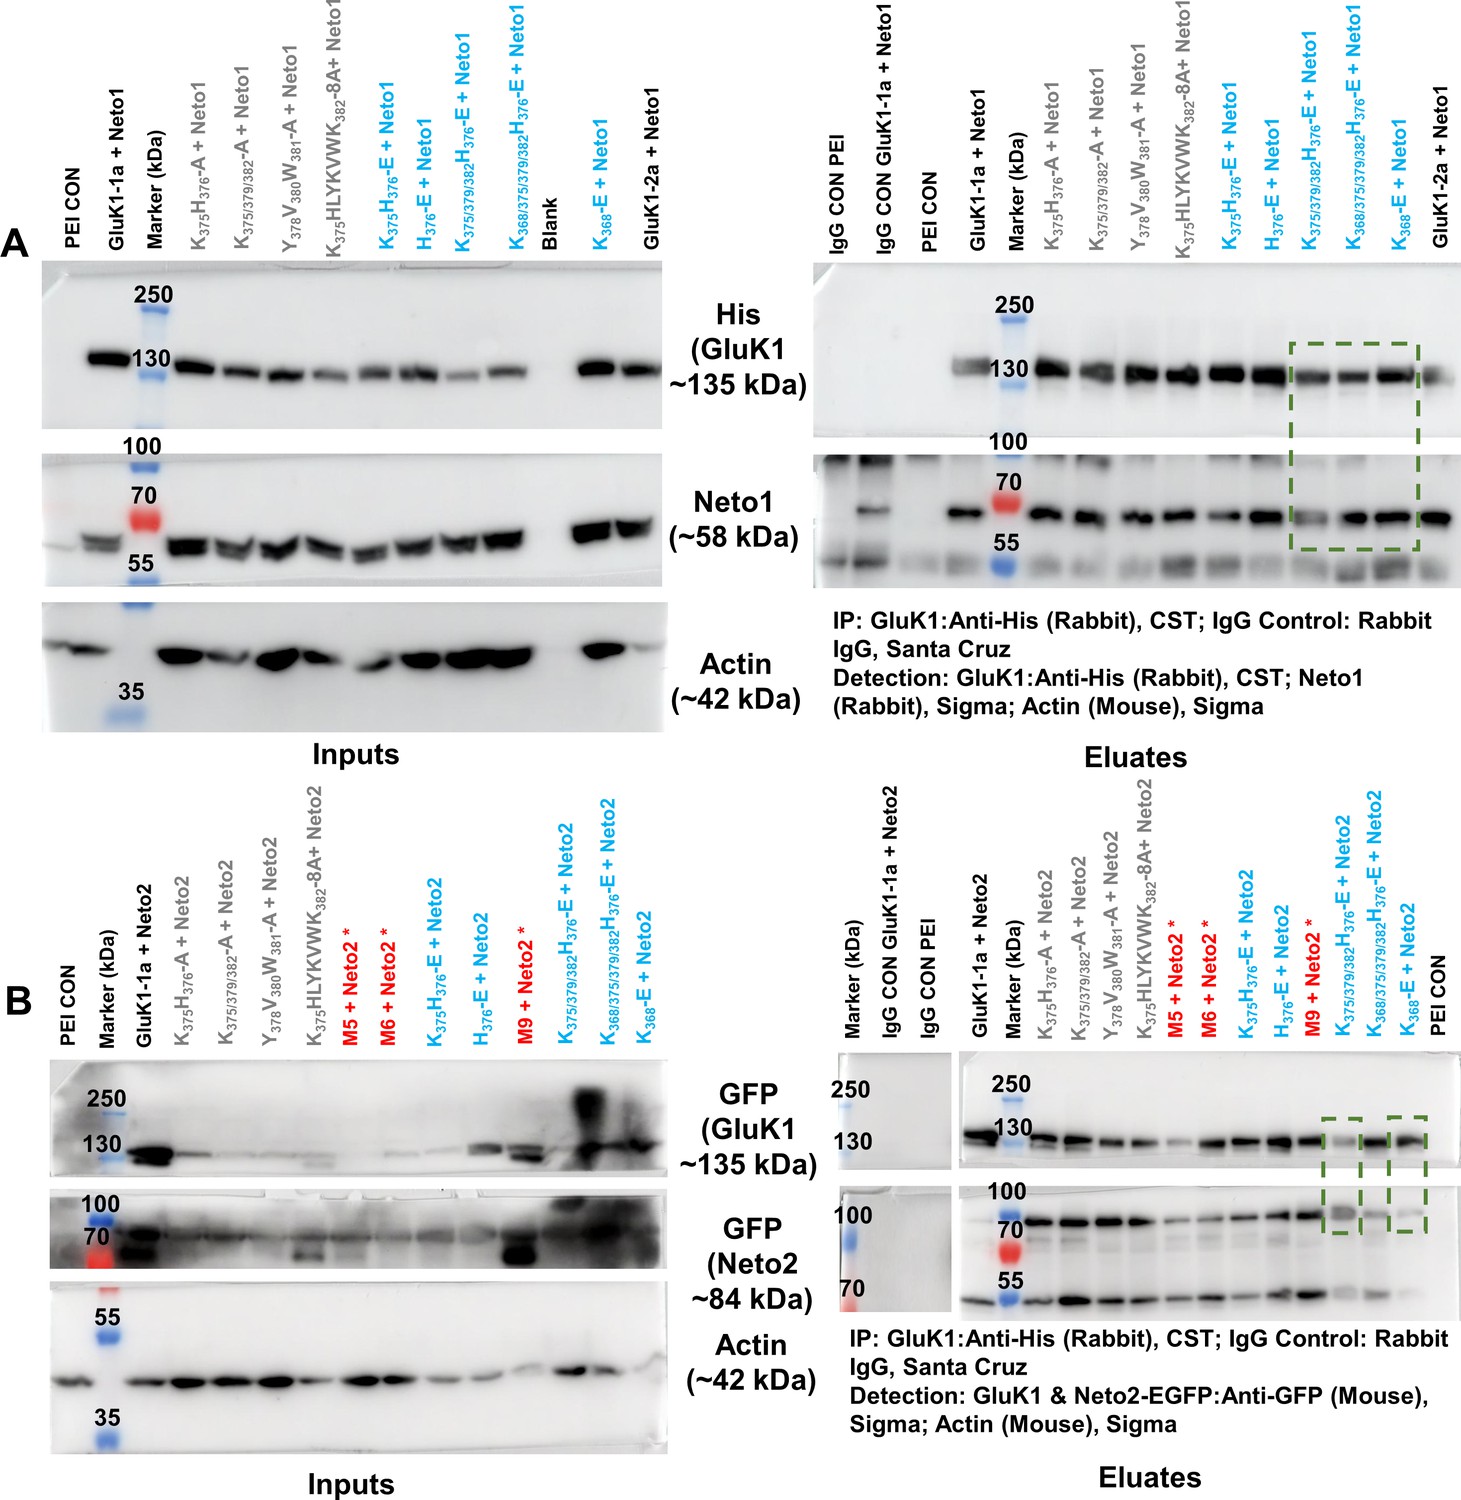
Co-immunoprecipitation analysis of GluK1-1a splice mutants and Neto proteins.
(A, B) represent the raw western blots for receptor pull-down experiments using His-antibody (CST). The left and right panels show the inputs and eluates for the co-IP. Actin was used as an internal control. The antibodies used to detect receptor or Neto proteins have been indicated. Rabbit IgG controls were set up using WT receptor with Neto1 or Neto2 and negative control along with the test samples to check for non-specific interactions. All the experiments were done in triplicates. Charge-neutral (Ala) mutants are labeled in gray, charge reversal (Glu) mutants in cyan and marker, and controls in black. Red asterisks are mutants not used for further studies. The molecular weight of markers and the expected proteins have been indicated. Green boxes display that the mutant receptors shown in the functional analysis were able to interact with both Neto proteins efficiently when co-transfected with Neto1 or Neto2. The western blots are raw images without any editing, they are assembled as they were cut from the same blot for probing with respective primary and secondary antibodies as mentioned in the panels A and B.
-
Figure 5—figure supplement 1—source data 1
PDF files containing labelled western blots for Figure 5—figure supplement 1A.
- https://cdn.elifesciences.org/articles/89755/elife-89755-fig5-figsupp1-data1-v1.pdf
-
Figure 5—figure supplement 1—source data 2
Original files for western blots displayed in Figure 5—figure supplement 1A.
- https://cdn.elifesciences.org/articles/89755/elife-89755-fig5-figsupp1-data2-v1.zip
-
Figure 5—figure supplement 1—source data 3
PDF files containing labelled western blots for Figure 5—figure supplement 1B.
- https://cdn.elifesciences.org/articles/89755/elife-89755-fig5-figsupp1-data3-v1.pdf
-
Figure 5—figure supplement 1—source data 4
Original files for western blots displayed in Figure 5—figure supplement 1B.
- https://cdn.elifesciences.org/articles/89755/elife-89755-fig5-figsupp1-data4-v1.zip
Figure 5—figure supplement 2
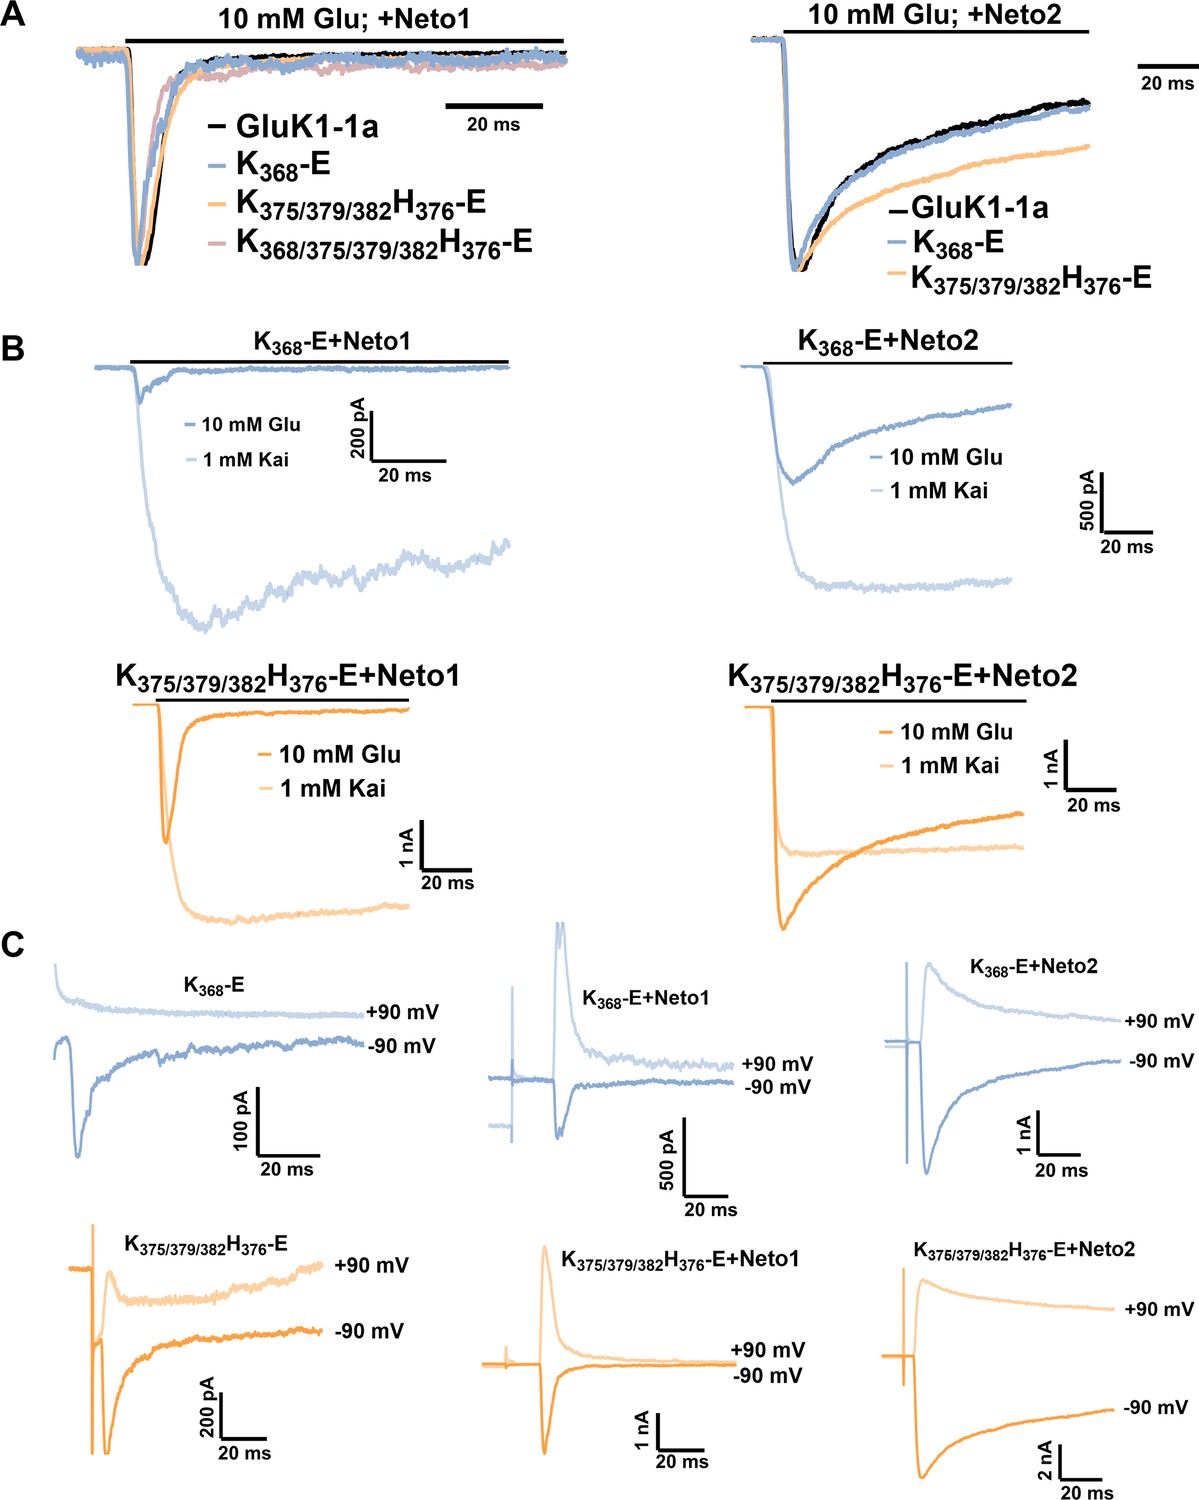
Representative traces for the GluK1 mutant receptors with Neto proteins.
(A) Demonstrates the normalized traces for wild-type and mutant receptors with Neto1/2 for glutamate-evoked desensitization. (B) Displays representative traces for glutamate vs. kainate evoked responses in the presence of Neto1 or Neto2. (C) Representative 100 ms traces for currents evoked at positive (+90 mV) and negative (–90 mV) potentials in the absence and presence of Neto proteins.
-
Figure 5—figure supplement 2—source data 1
Data used for the electrophysiology plots.
- https://cdn.elifesciences.org/articles/89755/elife-89755-fig5-figsupp2-data1-v1.xlsx
Figure 6 with 9 supplements
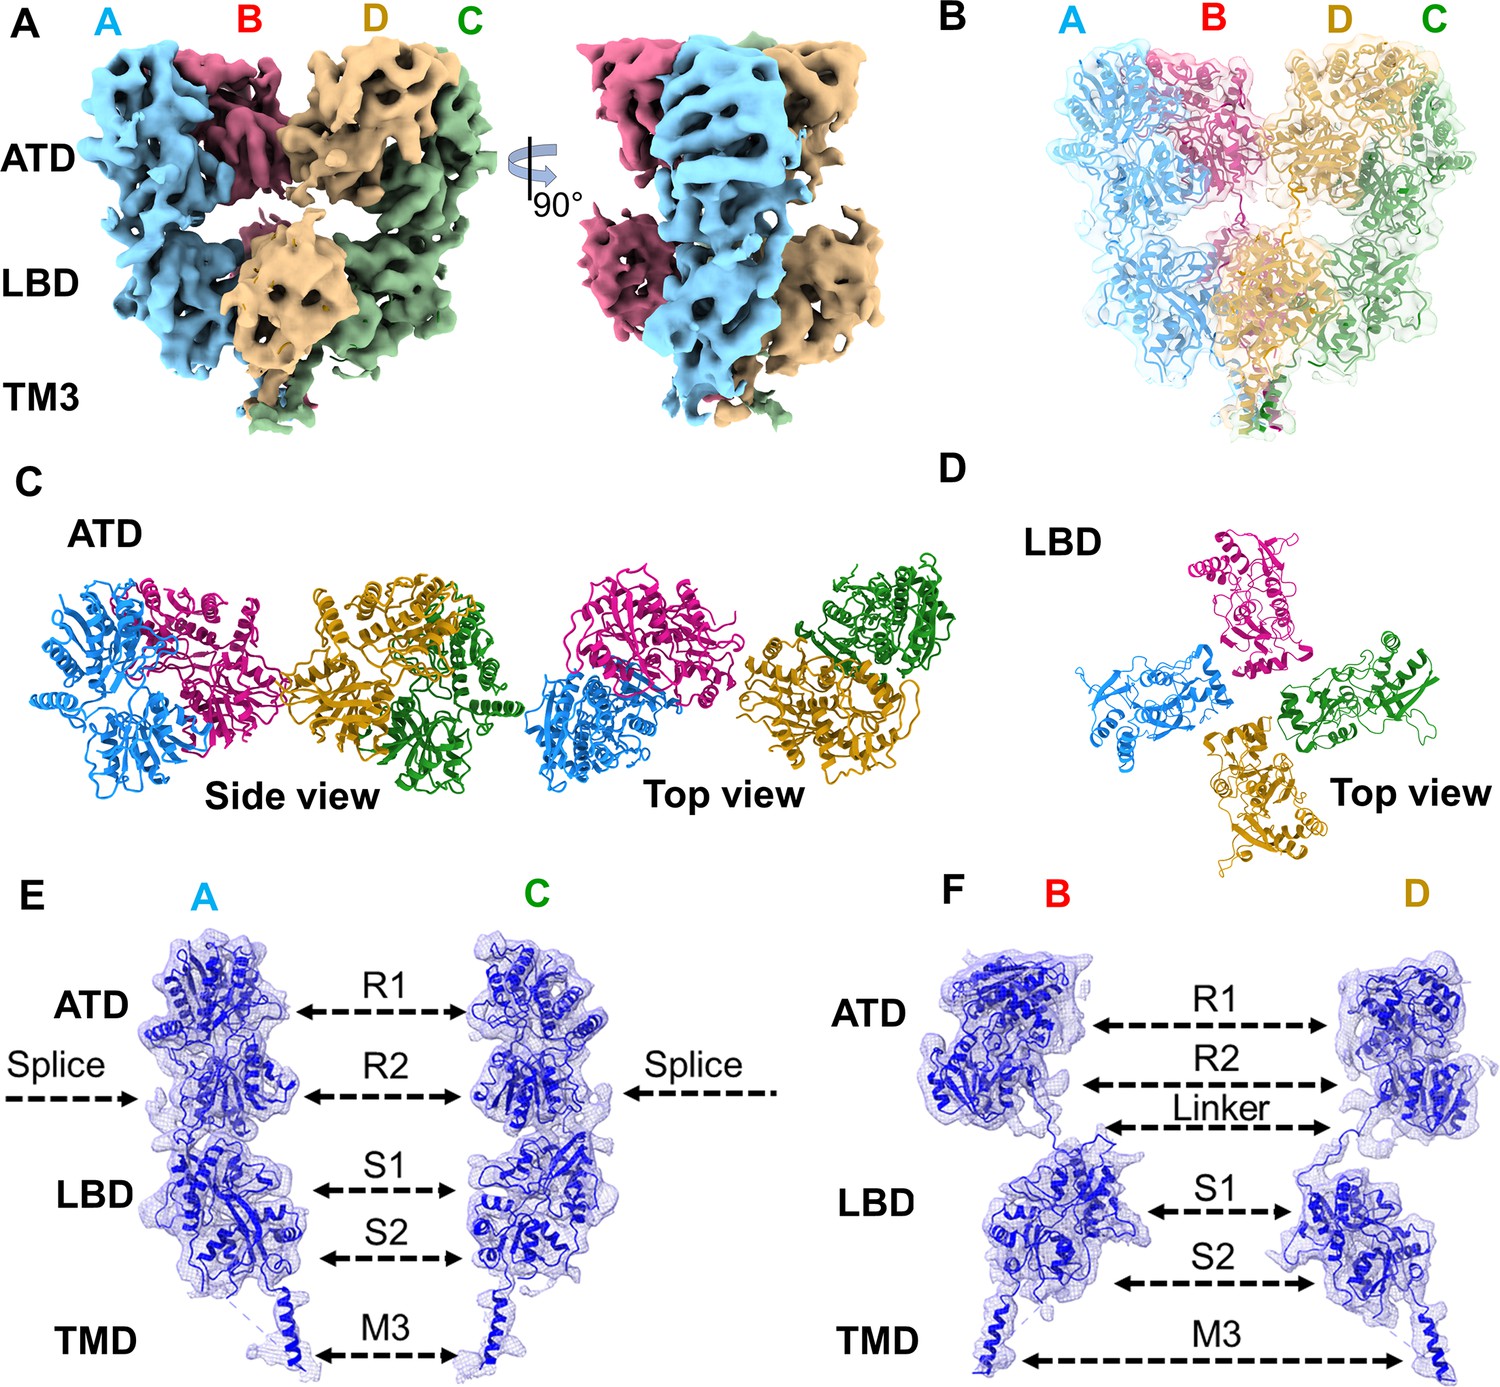
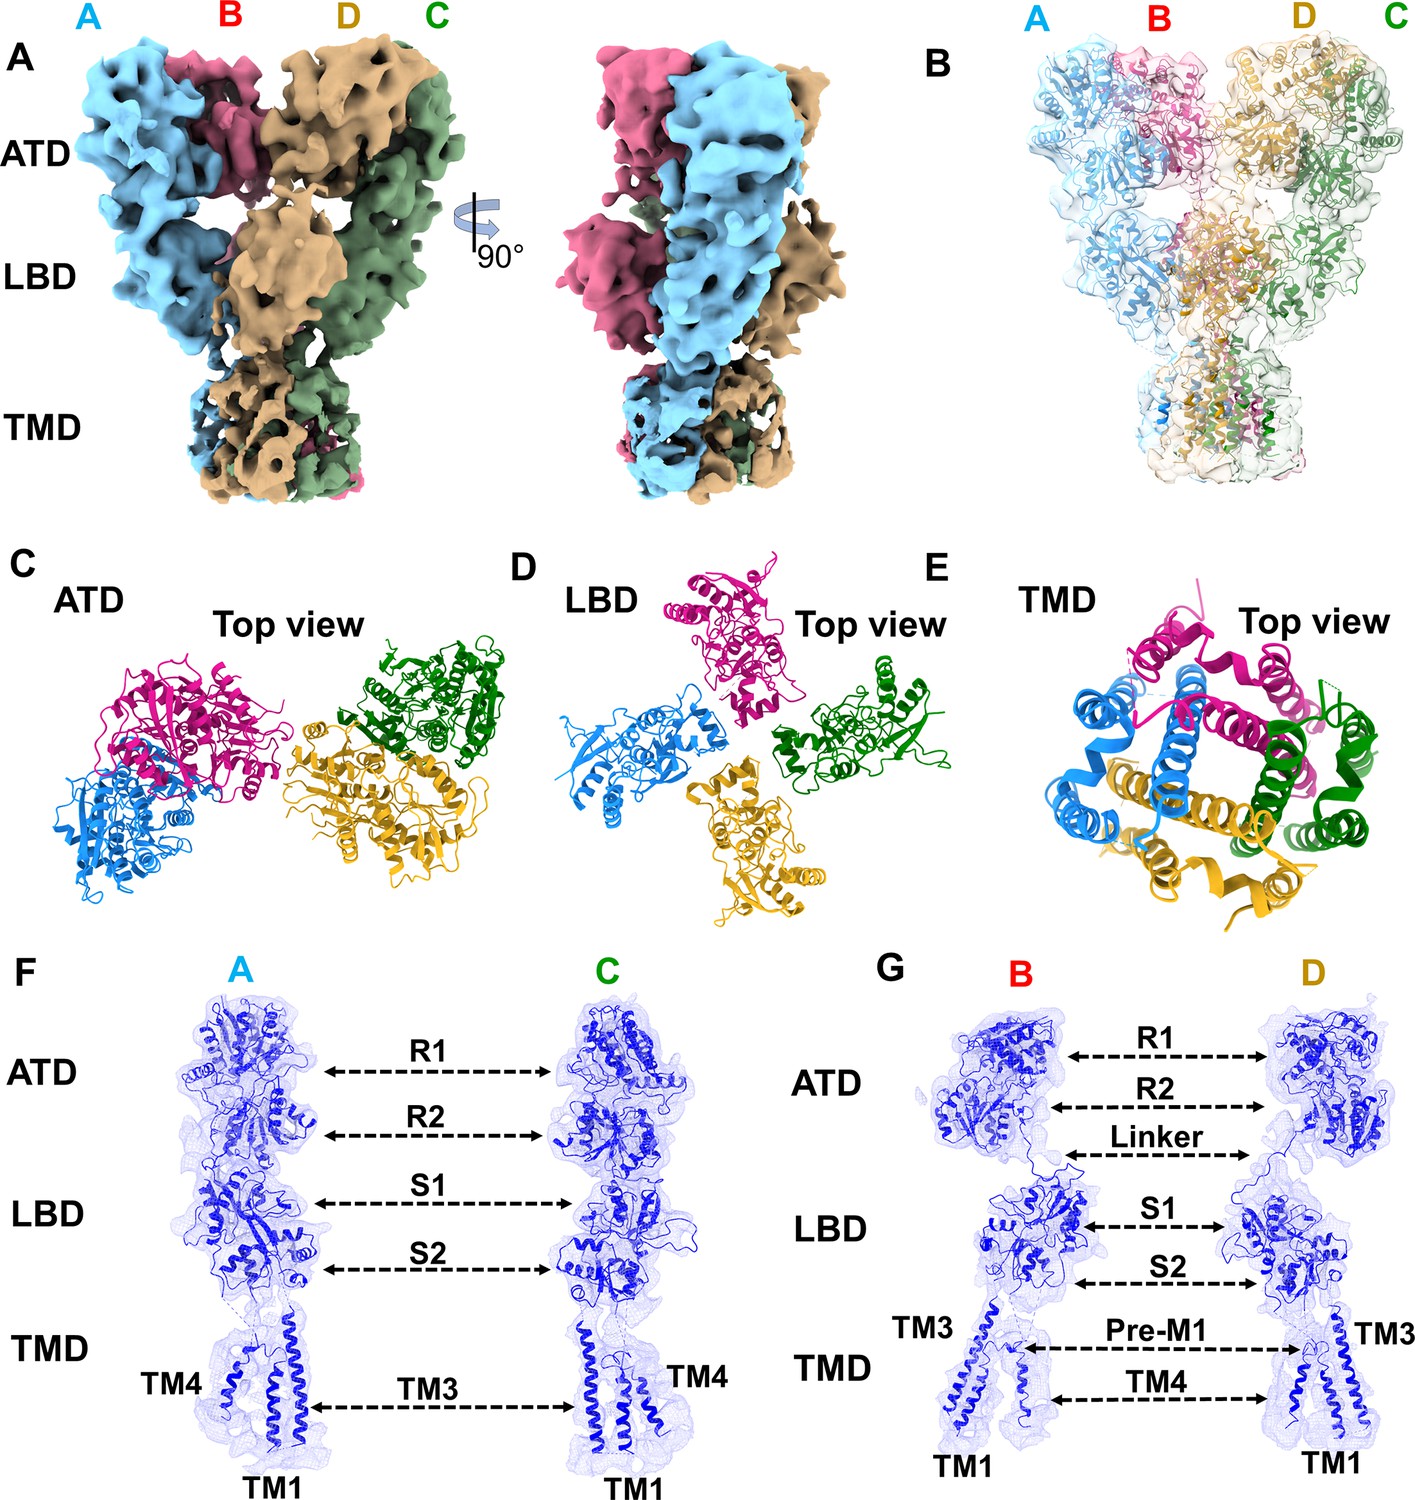
Architecture of GluK1-1aEM reconstituted in nanodisc for SYM-bound desensitized state.
(A) Shows the segmented density map colored according to unique chains of the receptor tetramer (A- blue, B-pink, C-green, and D-gold) at 5.23 Å in side view and 90° rotated orientations. (B) Shows the final model fitted in the EM map. (C and D) Top views of amino-terminal domain (ATD) and ligand binding domain (LBD) layers. (E & F) Display the segmented map fitted with the corresponding distal (A & C) and proximal (B & D) chains. Receptor sub-domains, the position of splice insertion, and linkers are indicated.
Figure 6—figure supplement 1
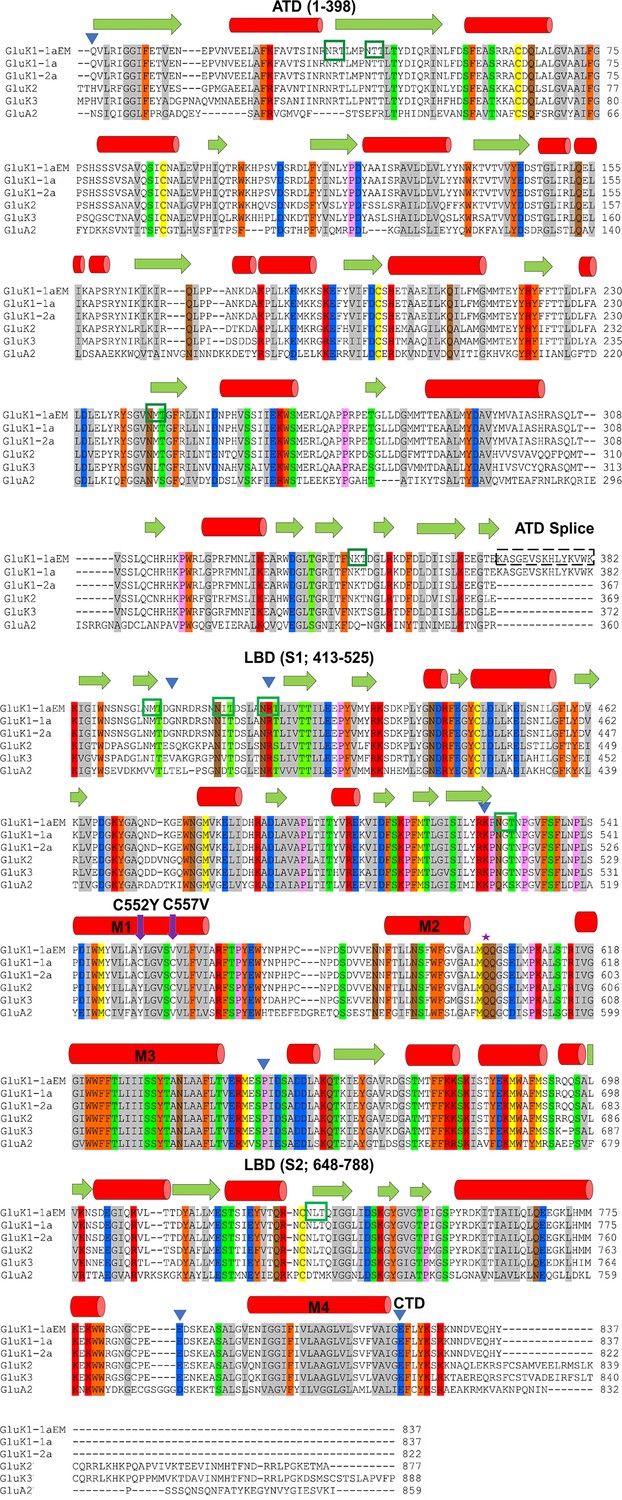
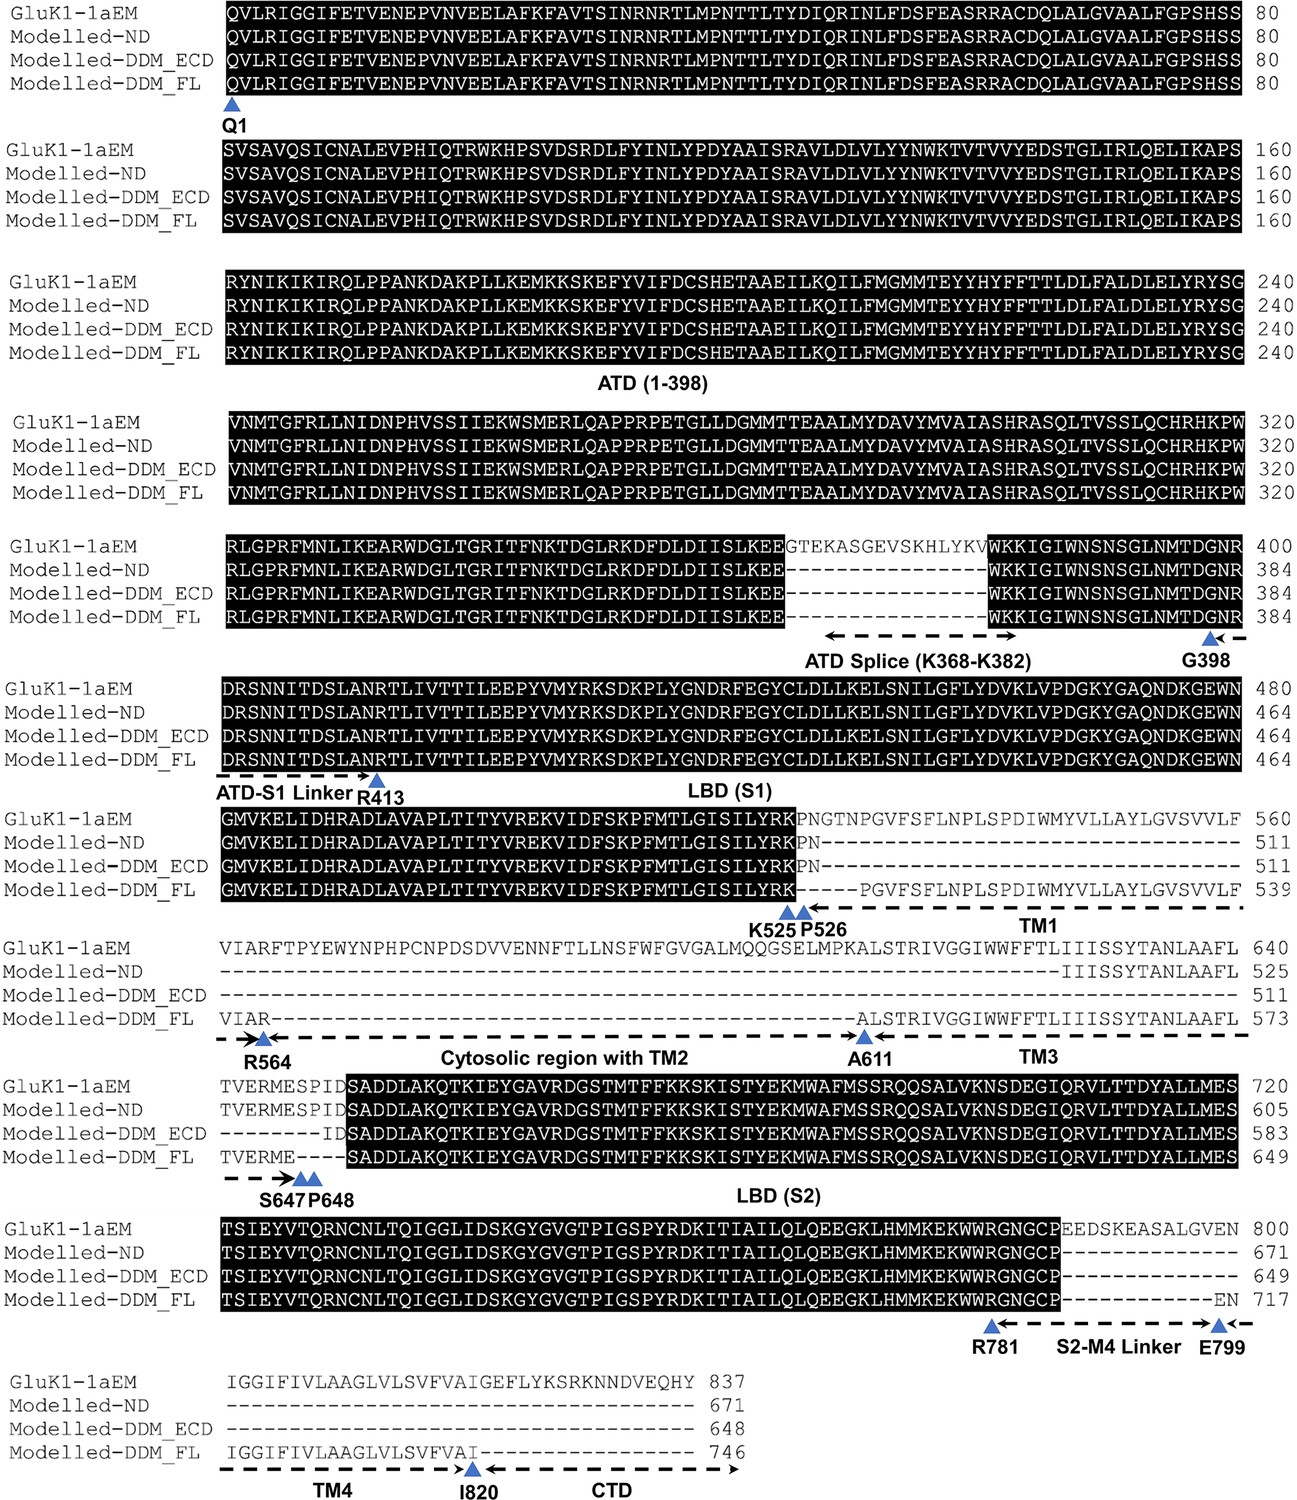
Sequence alignment and construct design of GluK1-1aEM.
The EM construct was aligned with mature polypeptide sequences of wild-type (WT) rat GluK1-1a, GluK1-2a, GluK2, GluK3, and GluA2. The color scheme grouping was based on the similarity of residues, with gray (G, A, V, L, I), orange (F, Y, W), yellow (C, M), green (S, T), red (K, R, H), blue (D, E), brown (N, Q), and pink (P). The approximate domain boundaries and the residue numbers have been marked with blue inverted triangles and written in parenthesis. Green boxes mark predicted N-linked glycosylation sites (NXT). Purple arrows show cysteine mutations in the EM construct. The predicted secondary structure is shown above the sequence, with red cylinders for the α-helix and green arrows for the β-strand.
Figure 6—figure supplement 2
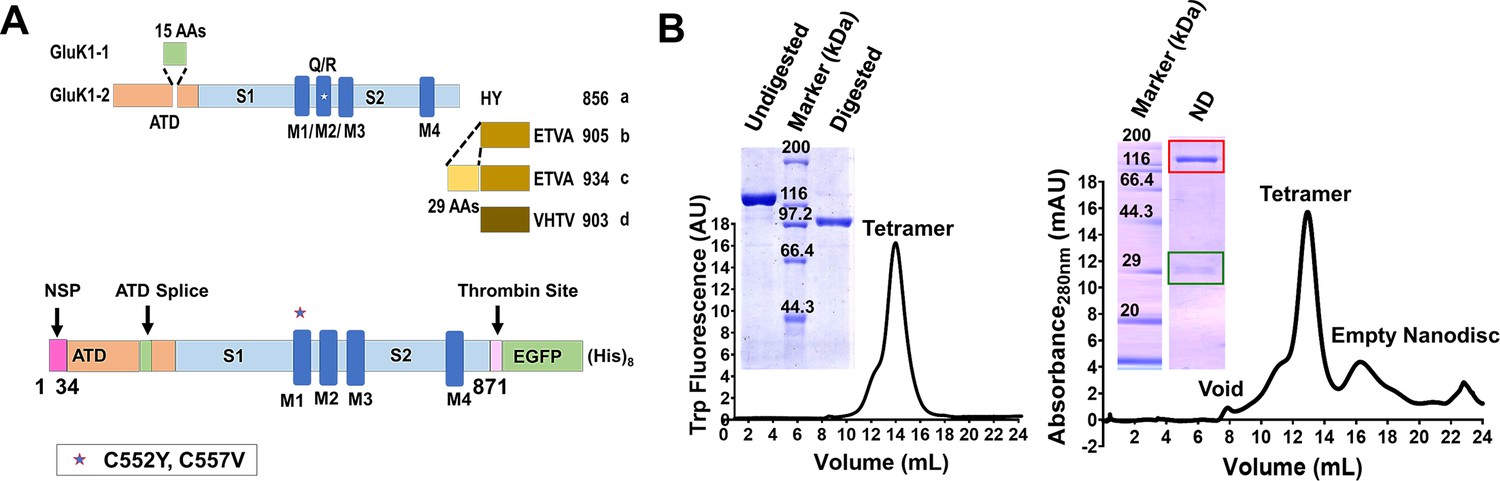
GluK1-1aEM construct design and purification.
(A) Schematic representation of GluK1 splice variants present in the human brain along with a schematic for the GluK1-1aEM construct is shown. The N-terminal Signal Peptide (NSP; 1–34 residues), 15 amino acid splice insert in the amino-terminal domain (ATD), S1/S2 (ligand binding domain, LBD), M1-M4 (trans-membrane domain, TMD) and C-terminal thrombin site followed by EGFP and (His)8 tags. The star in the M1 region denotes the point mutation of free cysteines at positions 552 and 557; the numbering of residues is based on the mature polypeptide. (B) Superose 6 size exclusion chromatography profiles for the purified protein in detergent micelles and nanodisc, respectively, are shown, and the position corresponding to void, receptor tetramer, and empty nanodisc are indicated. SDS-PAGE gel images inset shows the undigested and thrombin-digested protein for GluK1-1aEM in detergent and MSP1E3D1 (green box) co-eluting with GluK1-1aEM (red box), revealing a stable protein-nanodisc complex, respectively. ND indicates receptors in lipid nanodiscs.
-
Figure 6—figure supplement 2—source data 1
Size exclusion chromatography data used for the plots.
- https://cdn.elifesciences.org/articles/89755/elife-89755-fig6-figsupp2-data1-v1.xlsx
-
Figure 6—figure supplement 2—source data 2
PDF files containing original SDS-PAGE gels for Figure 6—figure supplement 2B -inset 1 with rectangle indicating the cropping margin.
- https://cdn.elifesciences.org/articles/89755/elife-89755-fig6-figsupp2-data2-v1.zip
-
Figure 6—figure supplement 2—source data 3
Original uncropped SDS-PAGE gels for Figure 6—figure supplement 2B -inset 1.
- https://cdn.elifesciences.org/articles/89755/elife-89755-fig6-figsupp2-data3-v1.zip
-
Figure 6—figure supplement 2—source data 4
PDF files containing original SDS-PAGE gels for Figure 6—figure supplement 2B -inset 2 with rectangle indicating the cropping margin.
- https://cdn.elifesciences.org/articles/89755/elife-89755-fig6-figsupp2-data4-v1.zip
-
Figure 6—figure supplement 2—source data 5
Original uncropped SDS-PAGE gels for Figure 6—figure supplement 2B -inset 2.
- https://cdn.elifesciences.org/articles/89755/elife-89755-fig6-figsupp2-data5-v1.zip
Figure 6—figure supplement 3
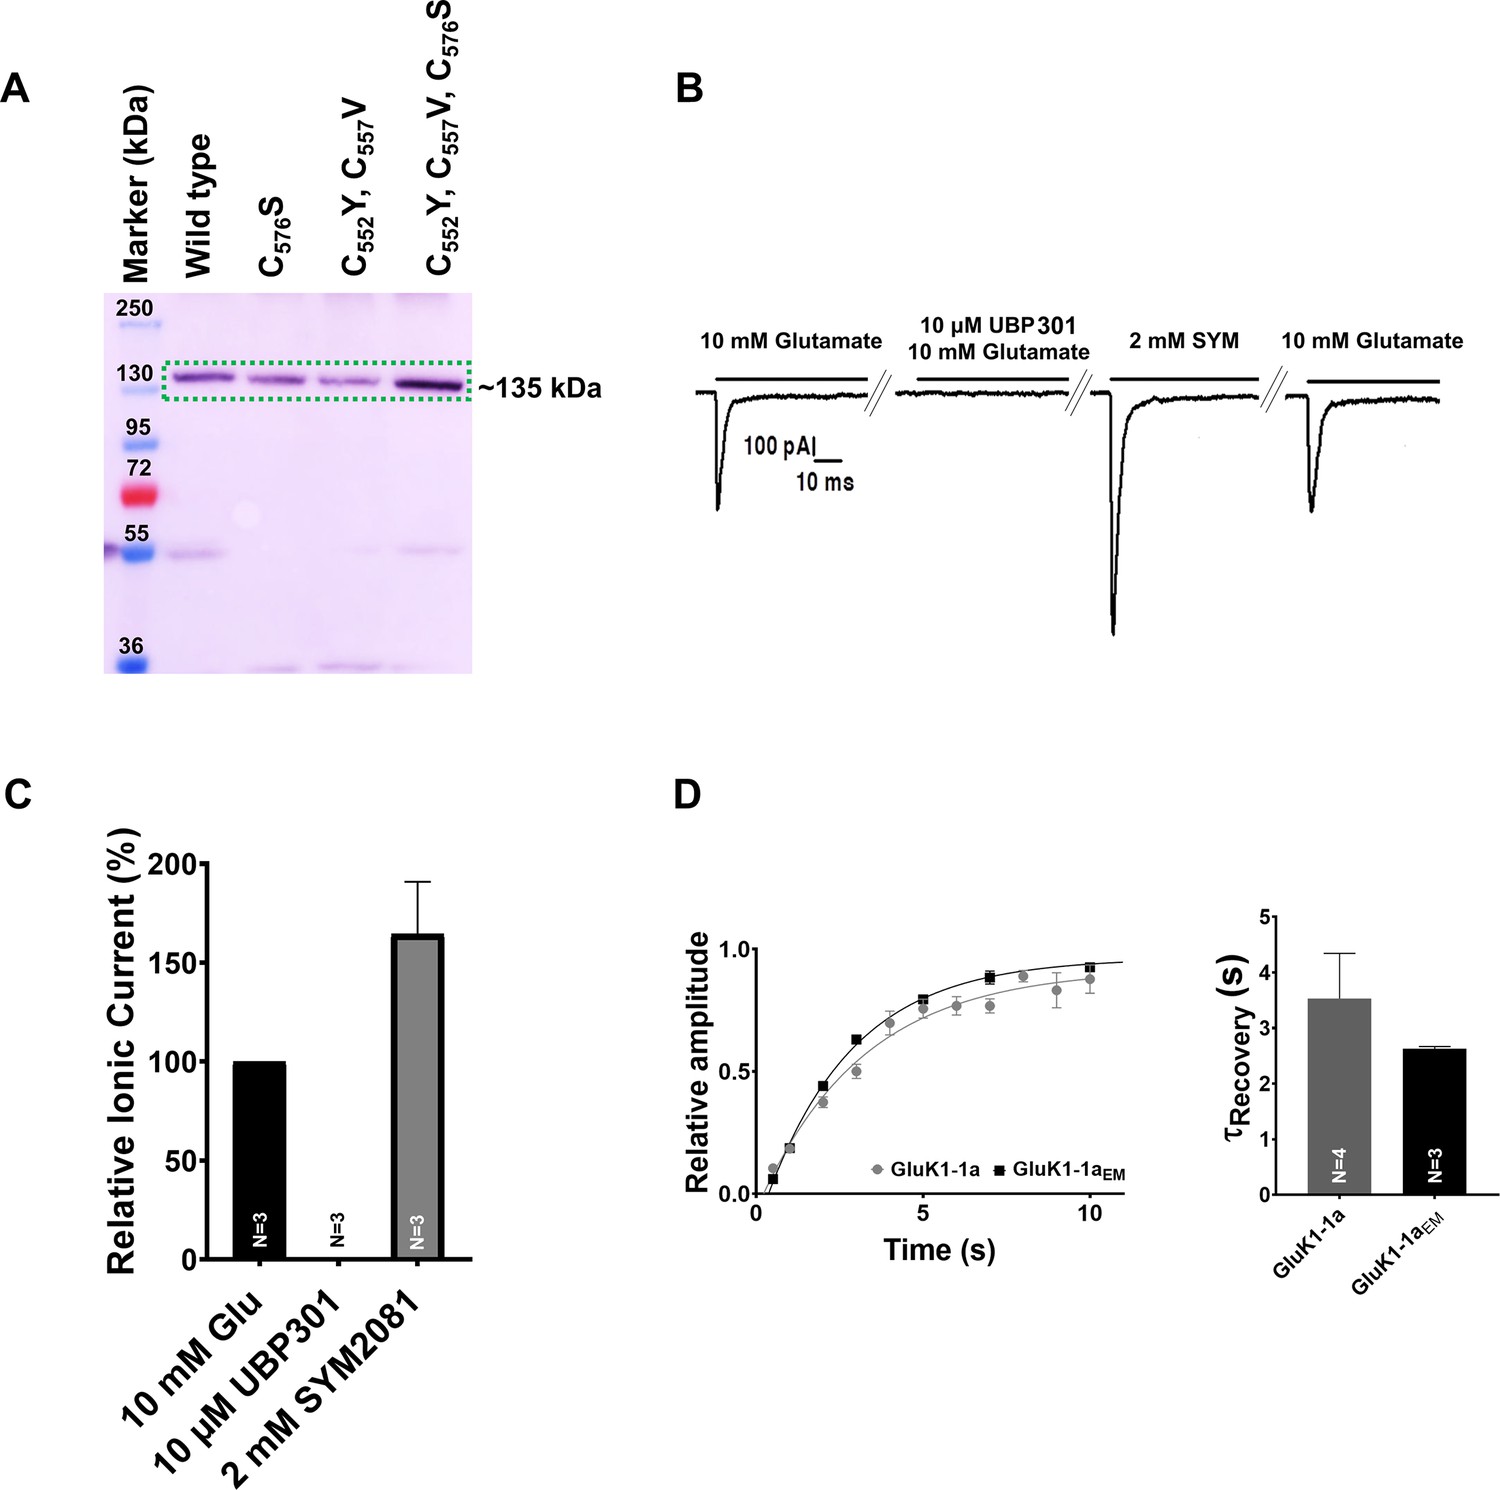
GluK1-1a construct optimization for structural studies and its gating properties.
The optimized constructs were verified for expression. Here, three free cysteines mutations in the TM1 are represented as C576S (1 x Cys), C552Y, C557V (2 x Cys), and C552Y, C557V, C576S (3 x Cys). 2 x Cys (C552Y, C557V) mutant was used as GluK1-1aEM for structural studies. (A) Western blot probed with anti-His antibody (Cell Signaling Technology, USA) shows the expression of all the mutants with respect to the wild-type (WT) construct; the Expected size of the polypeptide is indicated (MW:~135 kDa). (B) Representative traces for whole-cell patch clamp recordings (36–48 hr post-infection) of HEK293 cells infected with GluK1-1aEM baculovirus is shown. The receptors showed activation by 10 mM Glutamate, blocked in the presence of the inhibitor 10 µM UBP301. Post-washing the reversible inhibitor, the receptor could undergo a similar activation and desensitization cycle in the presence of 2 mM SYM and 10 mM Glutamate. (C) Shows the graphical representation of the percentage of relative current in the presence of 10 µM UBP301, 2 mM SYM, and 10 mM glutamate. (D) Electrophysiology profiles confirm that the GluK1-1aEM construct behaves similarly to the wild-type GluK1-1a in terms of recovery from desensitization. Error bars indicate mean ± SEM, and N in each bar represents the number of cells used for analysis.
-
Figure 6—figure supplement 3—source data 1
Uncropped western blot with rectangle indicating the cropping margin.
- https://cdn.elifesciences.org/articles/89755/elife-89755-fig6-figsupp3-data1-v1.zip
-
Figure 6—figure supplement 3—source data 2
Original file for western blot displayed in Figure 6—figure supplement 3A.
- https://cdn.elifesciences.org/articles/89755/elife-89755-fig6-figsupp3-data2-v1.zip
-
Figure 6—figure supplement 3—source data 3
Data used for the electrophysiology plots in panels B-D.
- https://cdn.elifesciences.org/articles/89755/elife-89755-fig6-figsupp3-data3-v1.xlsx
Figure 6—figure supplement 4
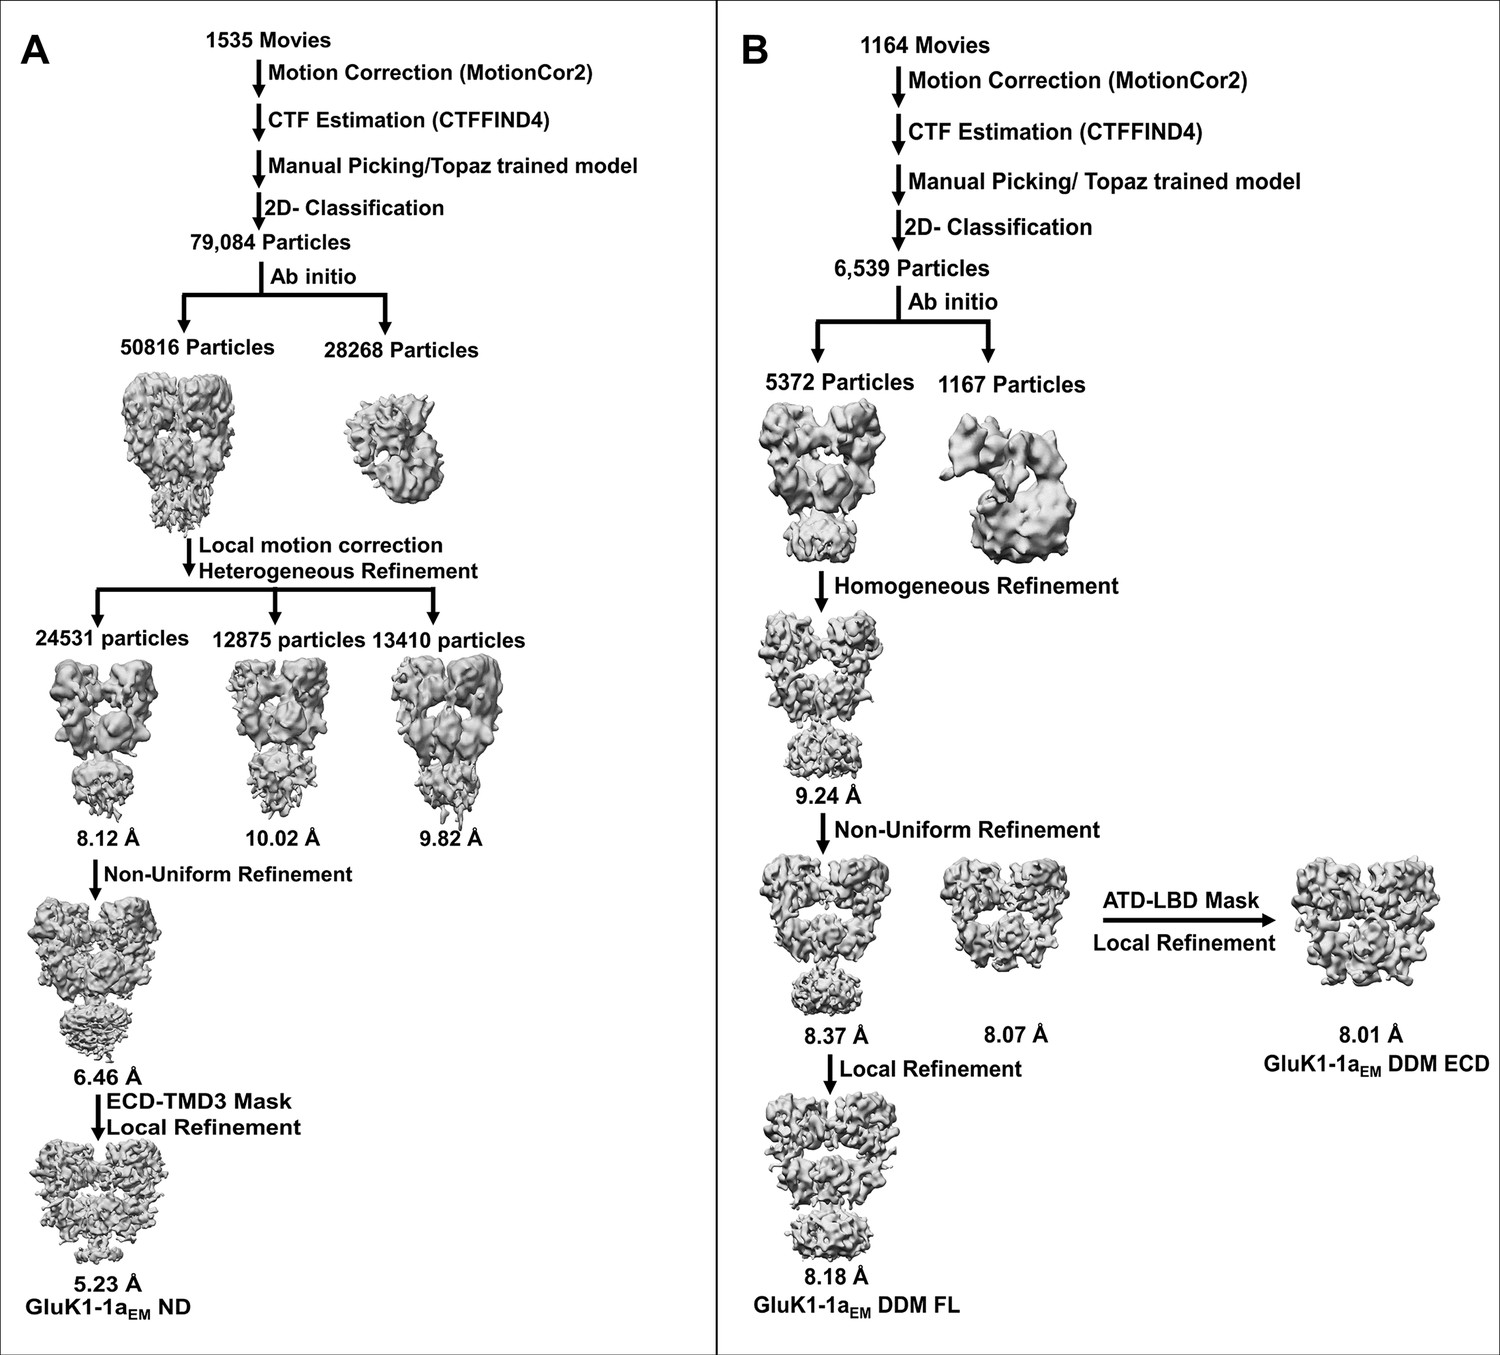
Single-particle cryo-EM data processing flow chart for GluK1-1aEM in nanodisc (ND) and detergent (DDM).
(A) For the GluK1-1aEM ND dataset, 79,084 particles from the final 2D classification were used for initial 3D reconstruction into two classes to remove junk particles. Furthermore, the good 50,816 particles were polished using local motion correction, and the initial 3D map was heterogeneously refined into three classes. The best map (24531 particles, highlighted in red box) was subsequently refined using non-uniform refinement followed by local refinement using the ECD-TMD3 mask to attain the final density map (GluK1-1aEM ND) resolution of 5.23 Å at 0.143 FSC. (B) 6539 particles from the final 2D classification were used to determine ab initio 3D reconstruction of GluK1-1aEM DDM in 2 classes to remove broken particles. The 3D map was refined using good particles (5372, highlighted in red box) with homogenous refinement to obtain a resolution of 9.2 Å. Further, non-uniform refinement followed by local refinement was performed using full-length and extracellular domain (ECD = ATD + LBD) masks to get final resolutions of 8.2 Å (GluK1-1aEM DDM FL) and 8 Å (GluK1-1aEM DDM ECD), respectively.
Figure 6—figure supplement 5
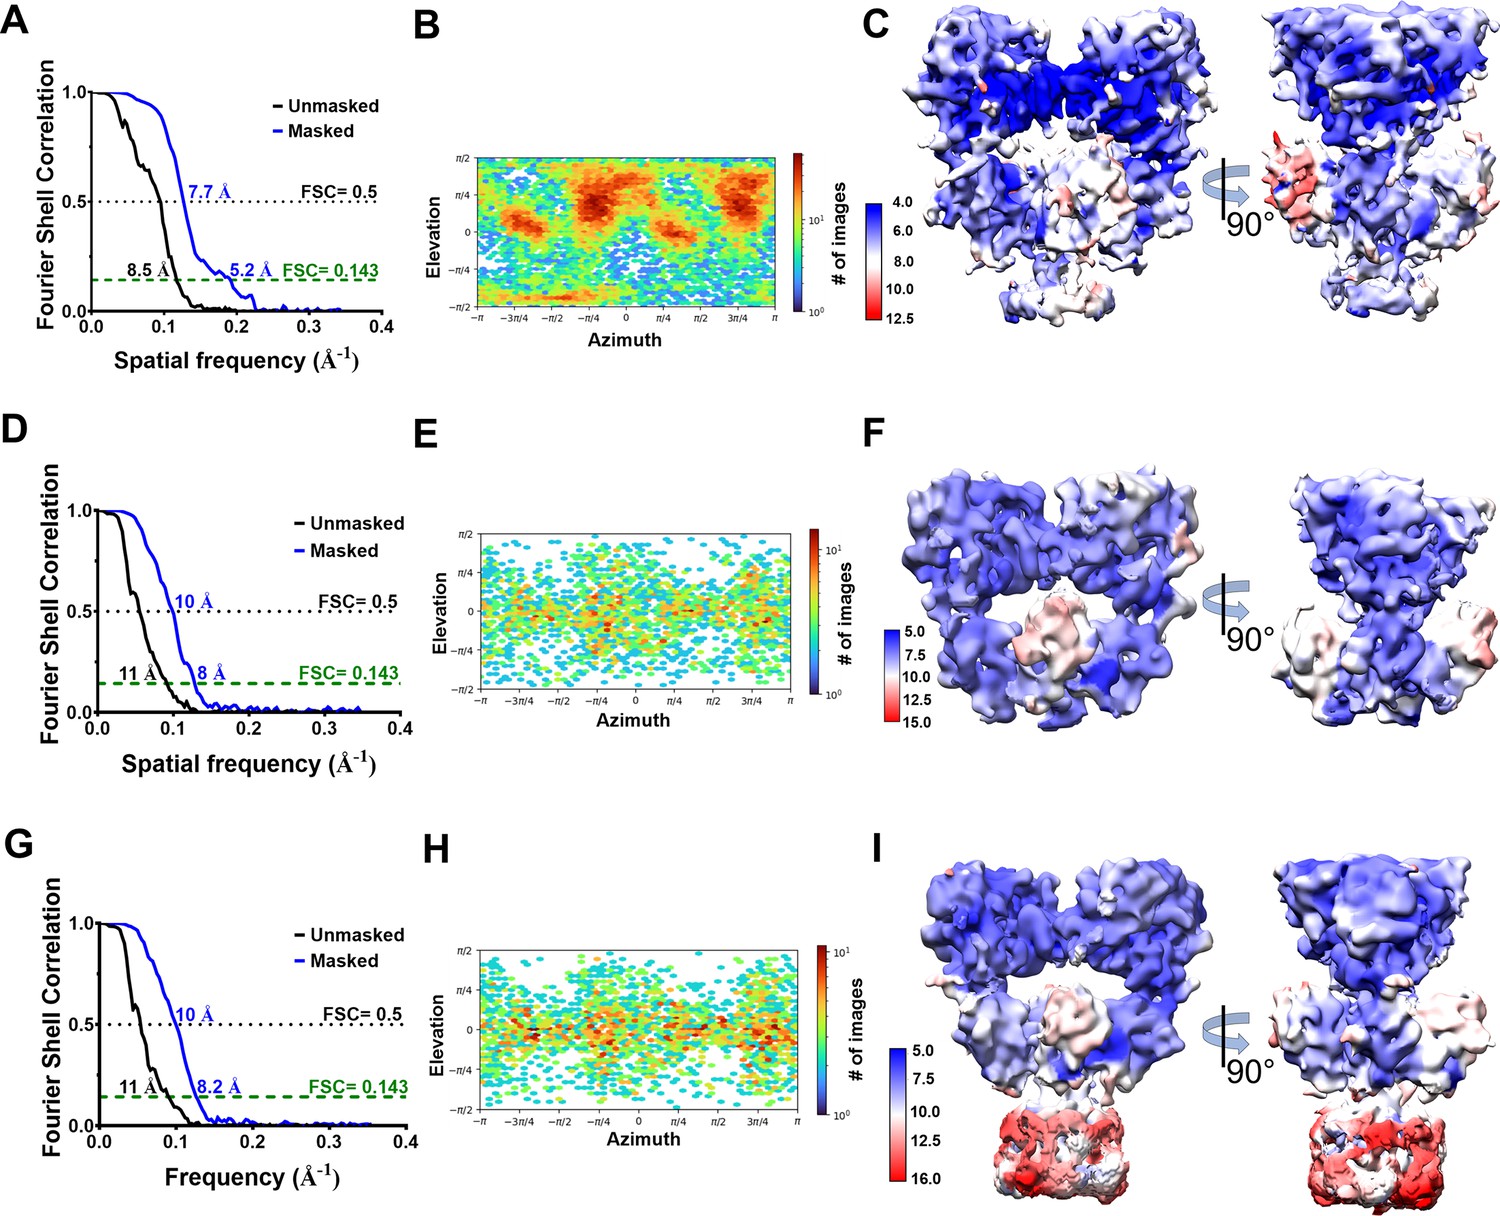
Estimation of resolution and particle distribution for GluK1-1aEM structures.
(A, D, and G) Show Fourier Shell Correlation curves at 0.143 and 0.5 cut-offs for GluK1-1aEM ND, GluK1-1aEM DDM ECD, and GluK1-1aEM DDM FL reconstructions, respectively, for unmasked (black) and masked (blue) maps estimated in cryoSPARCv3.1. (B, E, and H) Show the angular distribution of particles for GluK1-1aEM ND, GluK1-1aEM DDM ECD, and GluK1-1aEM DDM FL maps, respectively, as produced by cryoSPARCv3.1. (C, F, and I) Show the local resolution estimates for GluK1-1aEM ND (4–12.5 Å), GluK1-1aEM DDM ECD (5–15 Å), and GluK1-1aEM DDM FL (5–16 Å) maps, respectively.
-
Figure 6—figure supplement 5—source data 1
Data for the FSC plots.
- https://cdn.elifesciences.org/articles/89755/elife-89755-fig6-figsupp5-data1-v1.xls
Figure 6—figure supplement 6
Sequence alignment for the three models presented in the study.
Polypeptide chains modeled in the EM maps vs. the full GluK1-1aEM construct are shown. The beginning and ending residues of each modeled domain are indicated by blue triangles for GluK1-1aEM ND, GluK1-1aEM DDM ECD, and FL models. Missing residues are shown as dashed lines that could not be built due to resolution limitations.
Figure 6—figure supplement 7
Cryo-EM map and model for GluK1-1aEM dodecyl-β-maltoside (DDM) FL-SYM complex.
(A) Shows the front and side views of the segmented density map for the DDM solubilized GluK1-1a colored uniquely according to different chains. (B) Shows the atomic model fitted in the EM map. (C, D, and E) Show the top views of amino-terminal domain (ATD), ligand binding domain (LBD), and TMD layers. (F, G) Show the segmented map with fitted chains for each subunit, respectively. Sub-domains and helices of the TMD region are labelled.
Figure 6—figure supplement 8
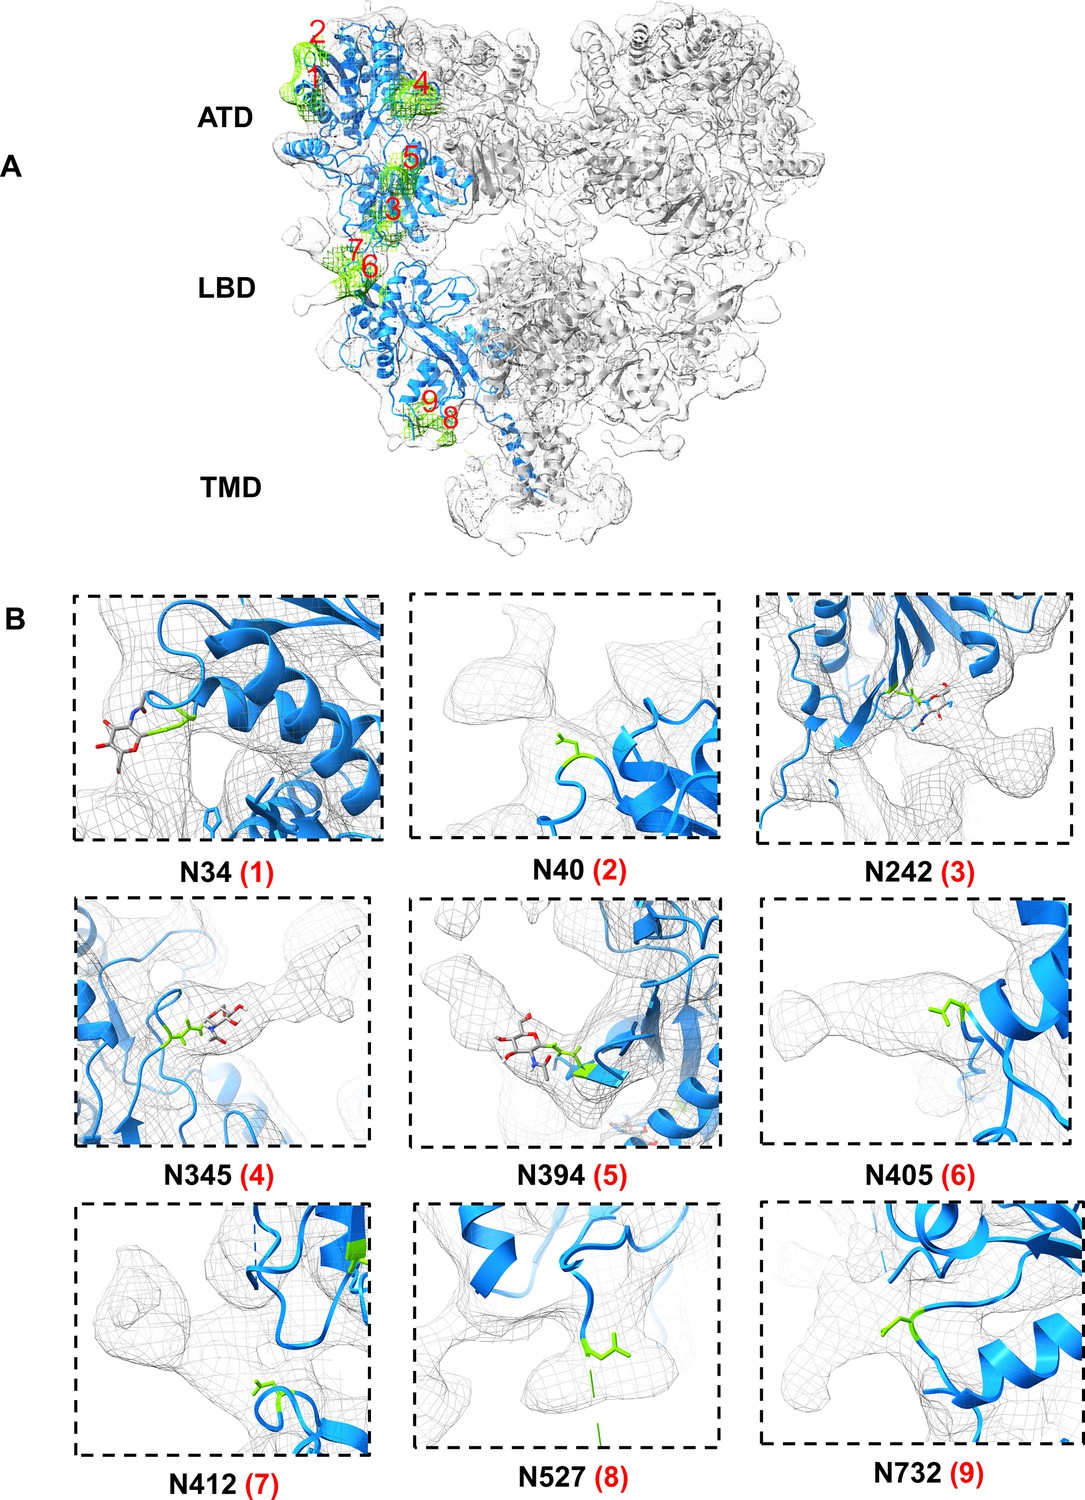
EM density map labeled to show predicted N-linked glycosylation sites (NXT) for GluK1-1aEM.
(A) Shows GluK1-1aEM ND with a fitted model in EM density. Chain A is emphasized in blue, and the residual N-linked glycan densities are shown in green color with respective Asn residues labeled from 1 to 9. (B) Shows zoomed view of individual Asn residues with side chain shown as a stick model and the corresponding glycan density in mesh form. For N34, N242, N345, and N394 residues, glycan density (NAG) observed in the GluK1-1a ATD crystal structure has been depicted with a conventional color scheme (C- gray, O- red, N- blue, H- white).
Figure 6—figure supplement 9
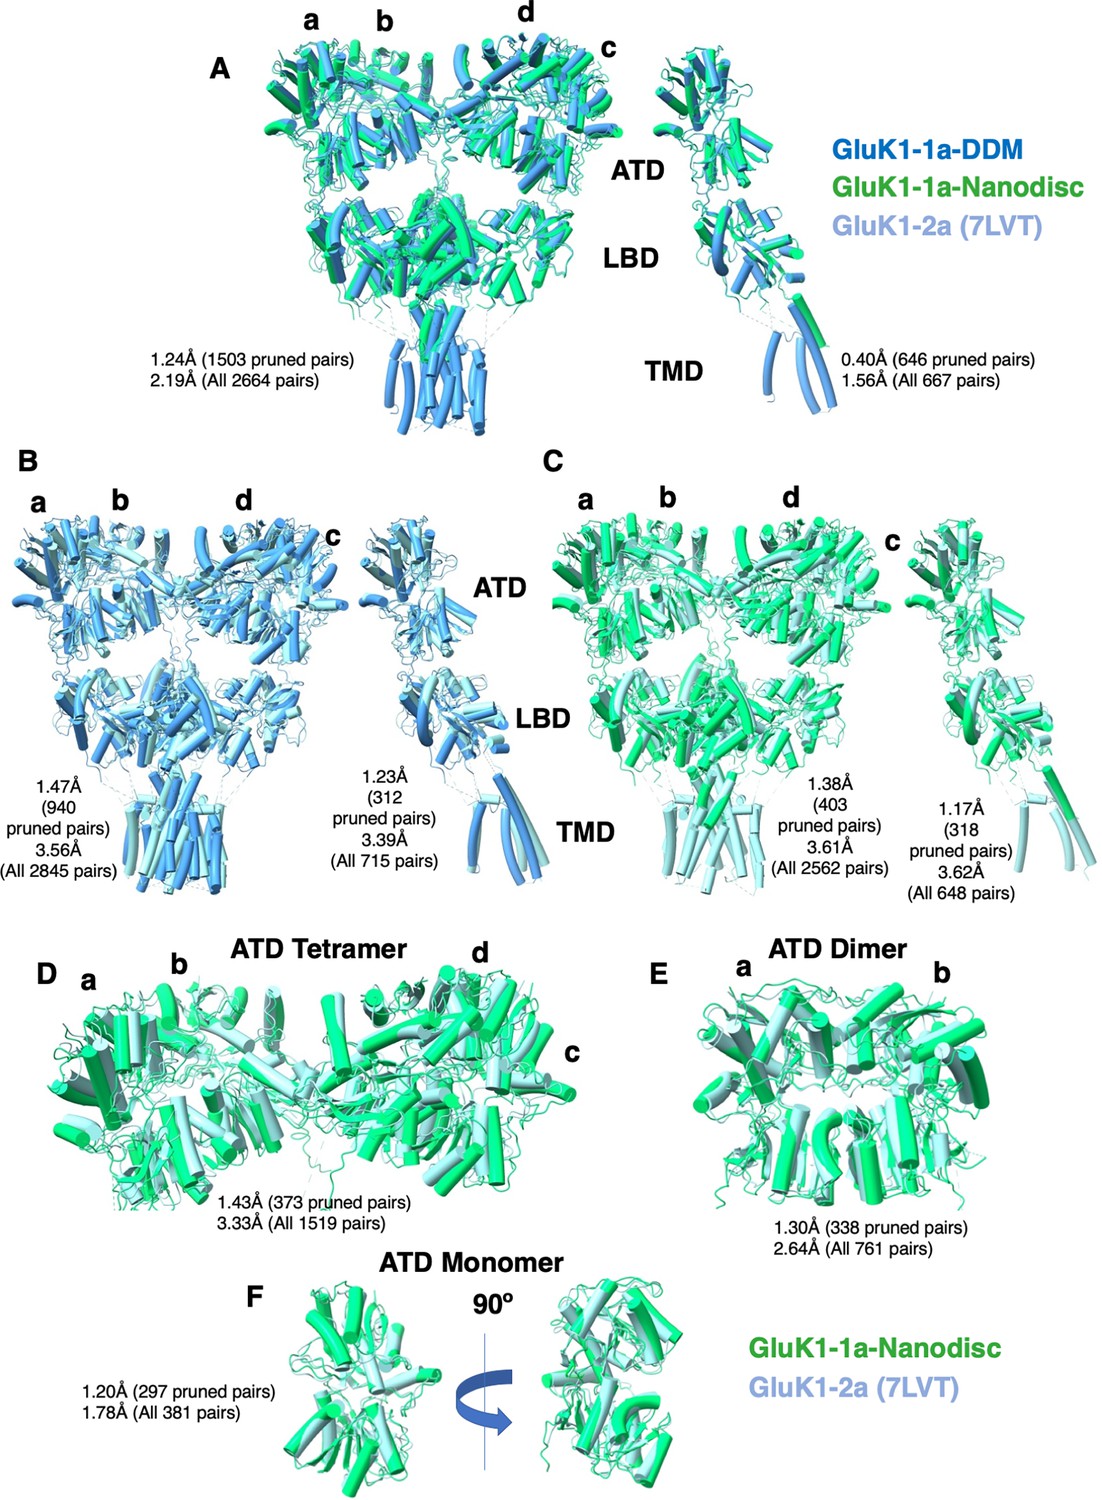
Comparison between GluK1-1aEM (detergent-solubilized or reconstituted in nanodiscs) and GluK1-2a (PDB-7LVT) in the desensitized state.
Each panel (A–F) illustrates a pairwise comparison with superimposed structures, where the root-mean-square deviation (RMSD) values, measured in Å, are indicated adjacent to each comparison. The structural comparison was carried out in ChimeraX and indicates significant structural similarities between all the protein models. The superimposition does not show significant differences in the arrangement at both amino-terminal domain (ATD) and ligand binding domain (LBD) layers of GluK1-1a with respect to GluK1-2a.
Tables
Table 1
Whole-cell patch clamp recordings of GluK1-1a, GluK1-1aEM, GluK1-2a, and GluK1-1a mutants in the absence or presence of Neto1 (green) or Neto2 (peach).
Errors are reported as SEM. Statistical significance is reported at 95 % CI. p<0.05 (*), p<0.01 (**), p<0.001 (***), p<0.0001 (****) for comparisons between wild-type GluK1-1a receptor with EM construct, GluK1-2a, or various mutants in presence or absence of Neto proteins.
‘a’ denotes the lack of rectification index value due to no conductance observed at positive potentials in the K368-E mutant alone.
| S. No. | Name of the construct | Desensitization | Total No. of cells tested | ||||
|---|---|---|---|---|---|---|---|
| 10 mM G (ƮDes in ms) | 1 mM K (%) | IK/IG | Recovery (ƮRec in s) | Rectification (+90 mV/–90 mV) | |||
| 1 | GluK1-1aEM | 1.94+0.13 N=8 (****p<0.0001) | - | - | 2.63±0.04 N=3 (p=0.3501) | - | 23 |
| 2 | GluK1-1a | 5.21±0.50 N=11 | 72.06±2.33 N=5 | 1.51±0.13 N=8 | 3.53±0.81 N=4 | 0.96±0.11 N=7 | 19 |
| +Neto1 | 3.56±0.22 N=9 (**p=0.0090) | 49.61±5.23 N=7 (**p=0.0075) | 1.25±0.04 N=8 (p=0.1500) | 0.68±0.07 N=8 (*p=0.0390) | 1.16±0.09 N=7 (p=0.1880) | 11 | |
| +Neto2 | 69.62±9.98 N=6 (**p=0.0024) | 68.96±4.36 N=9 (p=0.7459) | 1.00±0.07 N=13 (**p=0.0096) | 8.32±0.81 N=5 (**p=0.0044) | 0.80±0.05 N=4 (p=0.2401) | 17 | |
| 3 | GluK1-2a | 3.55±0.23 N=12 (**p=0.0092) | 93.20±0.55 N=8 (***p=0.0006) | 0.56±0.04 N=15 (****p<0.0001) | 5.31±0.50 N=7 (p=0.1191) | 0.61±0.10 N=7 (*p=0.0385) | 21 |
| +Neto1 | 4.32±0.34 N=8 (p=0.1495) | 76.99±3.41 N=6 (**p=0.0085) | 1.37±0.12 N=10 (****p<0.0001) | 1.15±0.12 N=5 (***p=0.0002) | 1.14±0.14 N=3 (*p=0.0338) | 14 | |
| +Neto2 | 21.68±2.64 N=6 (**p=0.0017) | 65.98±2.41 N=7 (****p<0.0001) | 1.16±0.04 N=8 (****p<0.0001) | 7.91±0.71 N=4 (*p=0.0430) | 1.37±0.10 N=3 (**p=0.0022) | 18 | |
| 4 | K375H376-A | 3.80±0.33 N=5 (*p=0.0332) | 71.07±5.27 N=5 (p=0.9998) | 1.43±0.07 N=5 (p=0.6195) | 1.10±0.22 N=4 (**p=0.0095) | 0.78±0.05 N=4 (p>0.9999) | 9 |
| +Neto1 | 3.38±0.14 N=8 (p=0.4947) | 54.64±5.18 N=6 (p=0.5086) | 1.76±0.14 N=8 (**p=0.0070) | 1.15±0.11 N=9 (**p=0.0026) | 0.64±0.04 N=4 (***p=0.0008) | 10 | |
| +Neto2 | 42.57±11.96 N=4 (p=0.1280) | 61.03±5.12 N=5 (p=0.6416) | 1.02±0.02 N=5 (Pp0.7791) | 9.32±0.15 N=3 (p=0.6286) | 0.60±0.06 N=5 (p=0.1138) | 6 | |
| 5 | K375/379/382 A | Low peak amplitudes (≤40 pA) | 15 | ||||
| +Neto1 | 2.82±0.18 N=6 | 64.13±5.26 N=5 | 1.42±0.08 N=6 | 0.74±0.08 N=6 | 1.28±0.10 N=6 | 8 | |
| +Neto2 | Low peak amplitudes (≤40 pA) | 27 | |||||
| 6 | Y378V380W381-A | Low peak amplitudes (≤40 pA) | 18 | ||||
| +Neto1 | 3.31±0.16 N=9 | 71.48±4.66 N=5 | 1.76±0.21 N=7 | 1.02±0.07 N=7 | 0.77±0.14 N=5 | 10 | |
| +Neto2 | 45.79±17.32 N=3 | 51.82±4.88 N=3 | 1.19±0.11 N=3 | 9.45±1.21 N=3 | 1.03±0.44 N=4 | 22 | |
| 7 | K375-K382-8A | Non-functional N=15 | Non-functional N=5 | - | - | Non-functional N=5 | 15 |
| +Neto1 | Non-functional N=11 | Non-functional N=4 | - | - | Non-functional N=5 | 11 | |
| +Neto2 | Non-functional N=11 | Non-functional N=5 | - | - | Non-functional N=6 | 11 | |
| 8 | K375H376-E | Low peak amplitudes (≤40 pA) | 13 | ||||
| +Neto1 | 3.59±0.29 N=4 | 13.78±3.16 N=5 | 0.70±0.19 N=4 | 0.63±0.10 N=3 | 0.68±0.19 N=3 | 23 | |
| +Neto2 | Low peak amplitudes (≤40 pA) | 36 | |||||
| 9 | H376-E | 5.07±0.42 N=7 (p=0.8408) | 29.80±13.21 N=4 (*p=0.0471) | 0.88±0.05 N=3 (*P=0.0272) | 1.48±0.18 N=8 (*p=0.0112) | 0.44±0.07 N=6 (**p=0.0023) | 19 |
| +Neto1 | 2.69±0.15 N=5 (**p=0.0065) | 59.24±8.62 N=4 (p=0.3813) | 2.36±0.30 N=4 (*P=0.0328) | 0.66±0.05 N=5 (p=0.7939) | 0.80±0.19 N=4 (p=0.3625) | 6 | |
| +Neto2 | 50.88±6.49 N=4 | 28.82±6.43 N=5 (**p=0.0034) | 1.43±0.13 N=4 (*P=0.0347) | 4.98±0.81 N=3 (*p=0.0237) | 0.42±0.08 N=8 (**p=0.0056) | 50 | |
| 10 | K375/379/382H376-E | 9.62±1.47 N=6 (*p=0.0290) | 54.25±8.28 N=3 (*p=0.0396) | 1.17±0.28 N=3 (P=0.3733) | 4.83±0.31 N=3 (p=0.2774) | 0.62±0.14 N=7 (*p=0.0499) | 36 |
| +Neto1 | 3.74±0.20 N=8 (p=0.5390) | 57.72±12.65 N=3 (p=0.5996) | 1.69±0.15 N=6 (*p=0.0326) | 0.66±0.08 N=8 (p=0.8702) | 1.23±0.07 N=6 (p=0.5351) | 9 | |
| +Neto2 | 65.57±17.04 N=8 (p=0.8412) | 26.66±2.05 N=4 (****p<0.0001) | 0.86±0.08 N=4 (p=0.2045) | 6.57±0.61 N=3 (p=0.3588) | 0.72±0.09 N=4 (p=0.6677) | 48 | |
| 11 | K368/375/379/382H376-E | Low peak amplitudes (≤40 pA) | 20 | ||||
| +Neto1 | 4.86±0.67 N=5 (p=0.1242) | 10.39±.3.53 N=5 | 1.15±0.20 N=4 (p=0.6495) | 0.21±0.12 N=3 | 0.59±0.13 N=5 (**p=0.0081) | 21 | |
| +Neto2 | Low peak amplitudes (≤40 pA) | 22 | |||||
| 12 | K368-E | 7.89±1.14 N=3 (*p=0.0334) | 46.66±5.88 N=5 (**p=0.0093) | 0.81±0.13 N=5 (**p=0.0037) | 5.61±0.95 N=3 (*p=0.0417) | a N=7 (****p<0.0001) | 32 |
| +Neto1 | 4.37±0.25 N=4 (*p=0.0393) | 59.68±8.72 N=3 (p=0.3851) | 6.99±0.47 N=5 (***p=0.0002) | 0.43±0.05 N=6 (*p=0.0118) | 2.84±0.16 N=3 (**p=0.0021) | 8 | |
| +Neto2 | 79.40±4.44 N=5 (p=0.4012) | 33.47±8.98 N=5 (*p=0.0388) | 2.13±0.13 N=4 (***p=0.0007) | 7.66±0.83 N=3 (p=0.9473) | 0.76±0.26 N=8 (p=0.9860) | 43 | |
Table 2
Excised patch outside-out electrophysiology of GluK1-1a and GluK1-2a in the absence or presence of Neto1 (green) or Neto2 (peach).
Errors are reported as SEM. Statistical-significance is reported at 95% CI. p<0.05 (*), p<0.01 (**), p<0.001 (***), p<0.0001 (****) for comparisons between GluK1-1a and GluK1-2a receptors in presence of Neto proteins. Red p-values are statistical significance at 95% for comparison between GluK1-1a and GluK1-2a with either of the Neto proteins.
| Name of the construct | Deactivation | Desensitization | Total No. of cells tested | ||
|---|---|---|---|---|---|
| ƮDeact (ms) | Rise Time (ms) | ƮDes (ms) | Rise Time (ms) | ||
| GluK1-1a | Low peak amplitude | 0.68±0.19 (N=3) | Low peak amplitude | 0.48±0.1 (N=3) | 10 |
| +Neto1 | 2.83±0.2 (N=9) | 0.75±0.04 (N=9) (p=0.7615) | 4.83±0.46 (N=9) | 0.71±0.04 (N=9) | 9 |
| +Neto2 | 5.18±0.65 (N=3) | 1.5±0.24 (N=3) (p=0.0627) | 31.89±4.08 (N=4) | 1.87±0.06 (N=4) | 4 |
| GluK1-2a | 1.51±0.28 (N=4) | 0.58±0.06 (N=4) | 2.34±0.35 (N=5) | 0.72±0.07 (N=5) | 9 |
| +Neto1 | 2.14±0.37 (N=10) (p=0.2086) | 0.75±0.06 (N=10) (p=0.0731) | 2.84±0.69 (N=9) (p=0.5312 / *p=0.0310) | 0.69±0.07 (N=9) | 12 |
| +Neto2 | 10.74±1.48 (N=8) (***p=0.0004 / **p=0.0077) | 1.47±0.23 (N=8) (p=0062) | 20.91±2.11 (N=9) (***p=0.0003 / p=0.0665) | 1.42±0.25 (N=9) | 9 |
Table 3
Cryo-EM data collection, refinement, and validation for GluK1-1aEM.
| GluK1-1a- 2 S,4R-4-methyl glutamate | |||
|---|---|---|---|
| GluK1-1aEM ND | GluK1-1aEM DDM ECD | GluK1-1aEM DDM FL | |
| Data Collection and Processing | |||
| Microscope | Titan Krios | Titan Krios | |
| Voltage (keV) | 300 | 300 | |
| Number of micrographs | 1535 | 1100 | |
| Camera | K2 | Falcon3 | |
| Mode of recording | Super resolution with energy filter (20 eV slit) | Counting | |
| Exposure time (s) | 12 | 60 | |
| Total dose (e-/Å2) | 40.8 | 19.5 | |
| Defocus range (µm) | 1.8–3.2 | 2.0–3.2 | |
| Pixel size (Å) | 1.41 | 1.38 | |
| Symmetry | C1 | C1 | |
| Initial particle number | 1,97,908 | 13,750 | |
| Final particle number | 24531 | 5372 | |
| Map resolution (Å) | 5.23 | 8.01 | 8.2 |
| FSC threshold | 0.143 | 0.143 | 0.143 |
| Refinement (Phenix) | |||
| Initial model used (PDB code) | (ATD), 3 C32 (LBD), 5KUF(TM3) | (ATD), 3 C32 (LBD) | (ATD), 3 C32 (LBD), 5KUF (TMD) |
| Model resolution (Å) | 5.1/7.3 | 7.2/9.0 | 7.8/9.1 |
| FSC threshold | 0.143/0.5 | 0.143/0.5 | 0.143/0.5 |
| Map-to model fit, CC_mask | 0.71 | 0.69 | 0.73 |
| Model composition | |||
| Non-hydrogen atoms | 21556 | 20880 | 23616 |
| Protein residues | 2684 | 2596 | 2948 |
| R.m.s. deviations | |||
| Bond lengths (Å) | 0.004 | 0.003 | 0.004 |
| Bond angles (°) | 0.861 | 0.796 | 0.805 |
| Validation | |||
| MolProbity score | 1.92 | 2.03 | 2.12 |
| Clashscore | 15.03 | 19.06 | 20.96 |
| Ramachandran plot | |||
| Favored (%) | 96.39 | 96.27 | 95.59 |
| Allowed (%) | 3.53 | 3.65 | 4.38 |
| Disallowed (%) | 0.08 | 0.08 | 0.03 |
| Rotamer outliers (%) | 0.3 | 0.17 | 0.12 |
| Cß outliers (%) | 0.04 | 0 | 0.04 |
Key resources table
| Reagent type (species) or resource | Designation | Source or reference | Identifiers | Additional information |
|---|---|---|---|---|
| Gene (Rattus norvegicus) | GRIK1-1a, GRIK1-2a, Neto1, Neto2 | This paper | GRIK1 was used with mutations in the TM1 region to improve protein expression and stability | |
| Strain, strain background (Escherichia coli) | BL21(DE3) | Sigma-Aldrich | CMC0016 | competent cells |
| Cell line (Homo sapiens) | HEK293 GnTI- suspension-adapted cells | ATCC | CRL-3022 | Used for expression of GluK1-1aEM for large-scale purification |
| Cell line (Homo sapiens) | HEK293 WT cells | ATCC | CRL-1573 | Used for whole-cell patch-clamp electrophysiology |
| Cell line (Homo sapiens) | HEK293-T/17 cells | ATCC | CRL-11268 | Used for outside-out patch-clamp electrophysiology |
| Antibody (Rabbit monoclonal) | Anti-His monoclonal antibody | Cell Signaling Technology | Cat. No. 12698 | Used for co-immunoprecipitation/Western Blotting |
| Antibody (Rabbit polyclonal) | Anti-Neto1 polyclonal antibody | Sigma-Aldrich | SAB3500679 | Used for co-immunoprecipitation/Western Blotting |
| Antibody (Mouse Monoclonal) | Anti-GFP | Sigma-Aldrich | G1546 | Used for co-immunoprecipitation/Western Blotting |
| Antibody (Mouse Monoclonal) | Anti-Actin | Sigma-Aldrich | A3853 | Used for co-immunoprecipitation/Western Blotting |
| Chemical compound | SYM2081 (2 S, 4R-4-methyl glutamate) | Tocris Bioscience | 31137-74-3 | Used to stabilize the receptor and electrophysiology experiments |
| Chemical compound | UBP301 | Tocris Bioscience | 569371-10-4 | Used to stabilize the receptor and electrophysiology experiments |
| Chemical compound | Kainic acid | Tocris Bioscience | 487-79-6 | Used to stabilize the receptor and electrophysiology experiments |
| Chemical compound | L-Glutamic acid | Sigma-Aldrich | 49449 | Used to stabilize the receptor and electrophysiology experiments |
| Chemical compound | Sodium Butyrate | Sigma-Aldrich | 8.17500 | Added to boost protein production |
| Commercial assay kit | Bio-Beads SM-2 | Bio-Rad | 1523920 | Used for detergent removal during nanodisc reconstitution |
| Recombinant DNA reagent | pEGBacMam vector | Eric Gouaux's lab (shared) | Used for protein expression | |
| Recombinant DNA reagent | GluK1-1a and GluK1-2a in pRK7 vector | Mark Mayer’s lab (shared) | Used for electrophysiology experiments | |
| Software algorithm | cryoSPARCv3 | Nature Methods Punjani et al., 2017 | DOI:10.1038/nmeth.4169 | Used for single-particle data processing |
| Software algorithm | UCSF Motioncor2 | Nature Methods Zheng et al., 2017 | DOI 10.1038/nmeth.4193 | Used for motion correction of cryo-EM data |
| Software, algorithm | UCSF ChimeraX | Goddard et al., 2018 | RRID:SCR_015872 | Molecular |
| Software, algorithm | UCSF Chimera | Pettersen et al., 2004 | RRID:SCR_004097 | Molecular |
| Software, algorithm | Coot | Emsley and Cowtan, 2004 | RRID:SCR_014222 | Protein Model |
| Software, algorithm | Phenix | Adams et al., 2010 | RRID:SCR_014224 | Protein Model |
| Software, algorithm | Clampfit | Molecular Devices | 11.2 | Electrophysiology data analysis |
| Software, algorithm | Fitmaster | HEKA Elektronik | v2x90.4 | Electrophysiology data analysis |
| Software, algorithm | Dotmatics | GraphPad Prism | version 8.0.1 | Used for statistical analysis and graphs/plots |
| Sequence-based reagent | Primers | This paper | PCR primers | Sequences given in Figure 4—source data 2 |
| Other | Soybean polar lipids | Avanti Polar Lipids | 541602 P | Used for the reconstitution of GluK1-1aEM in nanodiscs |
| Other | Dodecyl-β-maltoside (DDM) | Anatrace | D310LA | Used for solubilization of membrane fractions |
| Other | TALON Cobalt Resin | Clontech Takara | 635653 | Used for IMAC purification |
| Other | Protein A Agarose Beads | Thermo Scientific | 20334 | Used for pull-down assays |
| Other | cOmplete Protease Inhibitor Cocktail | Roche (Merck) | 11697498001 | Added to buffers used for protein purification |
Additional files
Download links
A two-part list of links to download the article, or parts of the article, in various formats.
Downloads (link to download the article as PDF)
Open citations (links to open the citations from this article in various online reference manager services)
Cite this article (links to download the citations from this article in formats compatible with various reference manager tools)
Functional implications of the exon 9 splice insert in GluK1 kainate receptors
eLife 12:RP89755.
https://doi.org/10.7554/eLife.89755.4


