Base editing strategies to convert CAG to CAA diminish the disease-causing mutation in Huntington’s disease
- Center for Genomic Medicine, Massachusetts General Hospital, United States
- Department of Neurology, Harvard Medical School, United States
- Medical and Population Genetics Program, The Broad Institute of MIT and Harvard, United States
- Department of Pathology, Massachusetts General Hospital, United States
- Department of Pathology, Harvard Medical School, United States
Figures
Figure 1 with 3 supplements
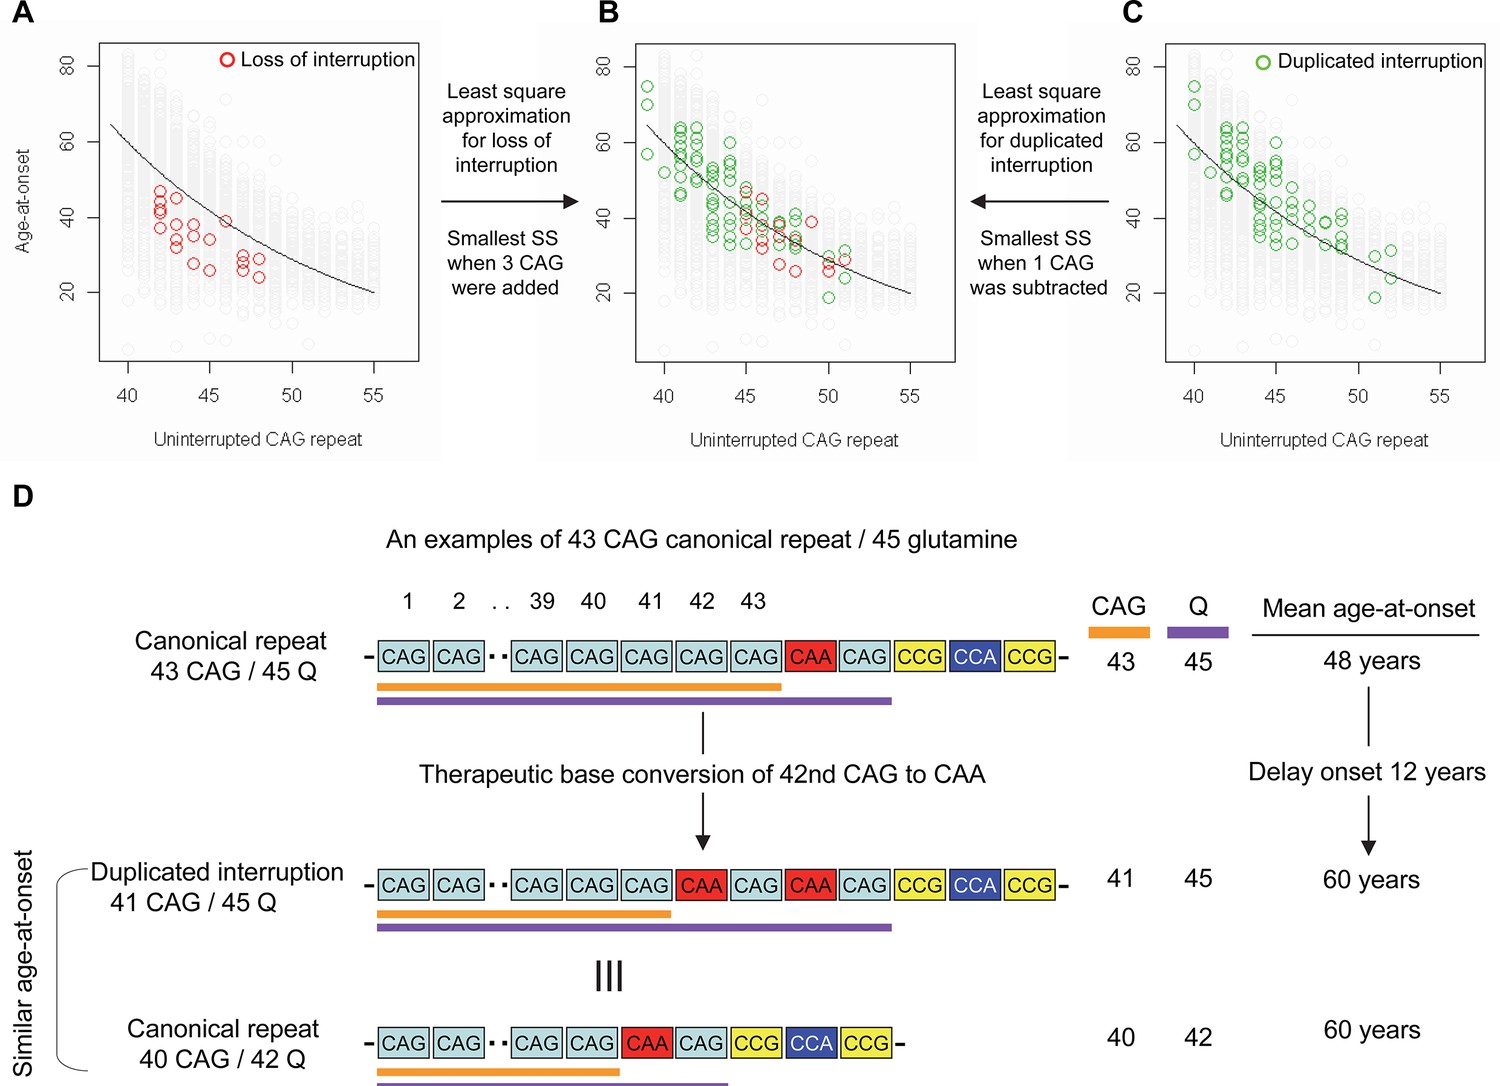
Effects of CAA interruption on Huntington’s disease (HD) age-at-onset.
(A–C) Least square approximation was performed to estimate the additional effects of loss of interruption (red circles in panels A and B; n=21) and duplicated interruption on age-at-onset (green circles in panels B and C; n=69). We varied the CAG length of HD participants carrying loss of interruption or duplicated interruption, and subsequently calculated sum of square to identify the CAG repeat that explained the maximum variance in age-at-onset of these allele carriers. Y-axis and X-axis represent age-at-onset and CAG repeat length, respectively. Gray circles and black trend lines respectively represent HD participants with canonical repeats and their onset-CAG relationship. SS means sum of square. (D) To illustrate the magnitude of the impact of a therapeutic base editing (BE) strategy of converting a canonical repeat to duplicated interruption by changing CAG to CAA, an example of a canonical repeat of 43 CAG (45 glutamine) with a mean observed onset of 48 years is displayed (n=564). In this example, therapeutic conversion of the 42nd CAG to CAA by BE would produce a duplicated interruption of 41 CAG (45 glutamine). Considering the additional effect of duplicated interruption in HD patients, a 41 CAG / 45 glutamine duplicated interruption would produce an onset similar to a canonical repeat allele of 40 CAG/42 glutamine, with a mean onset age of 60. Therefore, CAG-to-CAA conversion in HD subjects with 43 canonical repeat repeats could delay onset by 12 years.
Figure 1—figure supplement 1
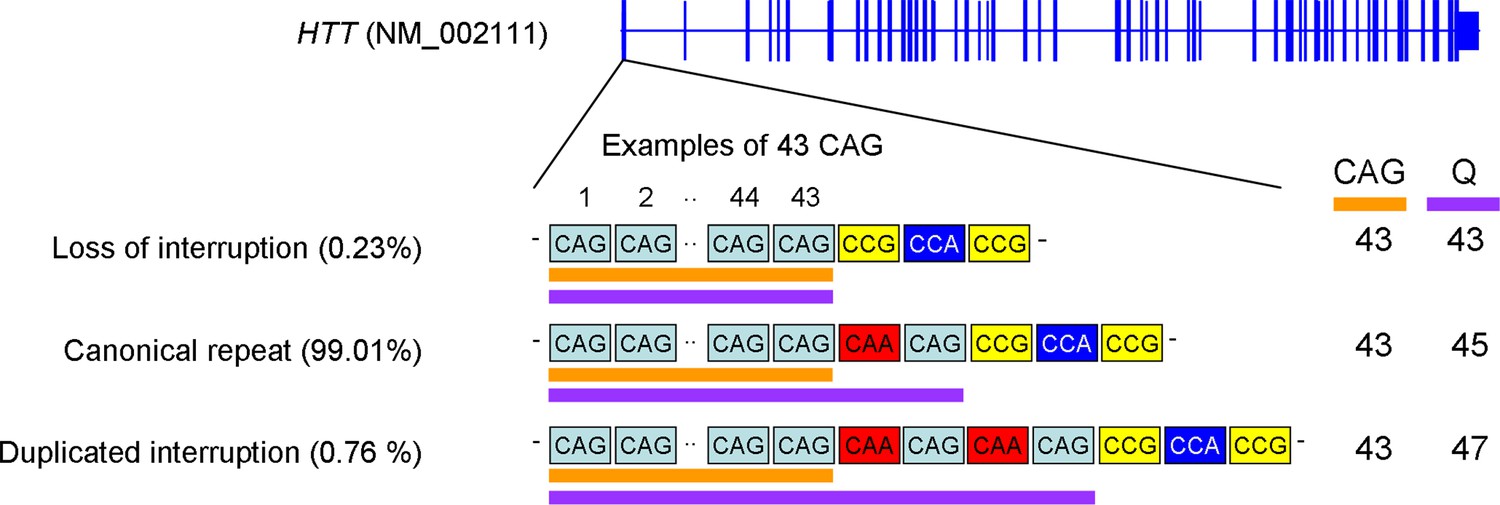
The canonical repeat, loss of interruption, and duplicated interruption.
Three naturally occurring HTT CAG repeat alleles and their estimated frequencies are summarized. The canonical repeat consists of an uninterrupted CAG repeat followed by a CAA-CAG codon doublet; this repeat sequence is the most frequent accounting for approximately 99% of the disease chromosomes in our previous genome-wide association studies (GWAS) data. For canonical repeat, the size of the polyglutamine stretch is longer by two than the length of the uninterrupted CAG repeat since CAA and CAG both specify glutamine (Q). Loss of interruption alleles lack the CAA interruption. This repeat is infrequent in Huntington’s disease (HD) subjects (0.23% in our GWAS data); the lengths of the polyglutamine stretch and uninterrupted CAG repeat are the same. Duplicated interruption alleles, featuring two copies of the CAA-CAG, are also infrequent (0.76% in our GWA participants); the polyglutamine length is greater by four compared to the uninterrupted CAG repeat length. Orange and purple horizontal bars represent uninterrupted CAG repeat and polyglutamine, respectively. Examples were based on 43 uninterrupted CAG repeats. CAG and Q represent uninterrupted CAG repeat and polyglutamine, respectively.
Figure 1—figure supplement 2
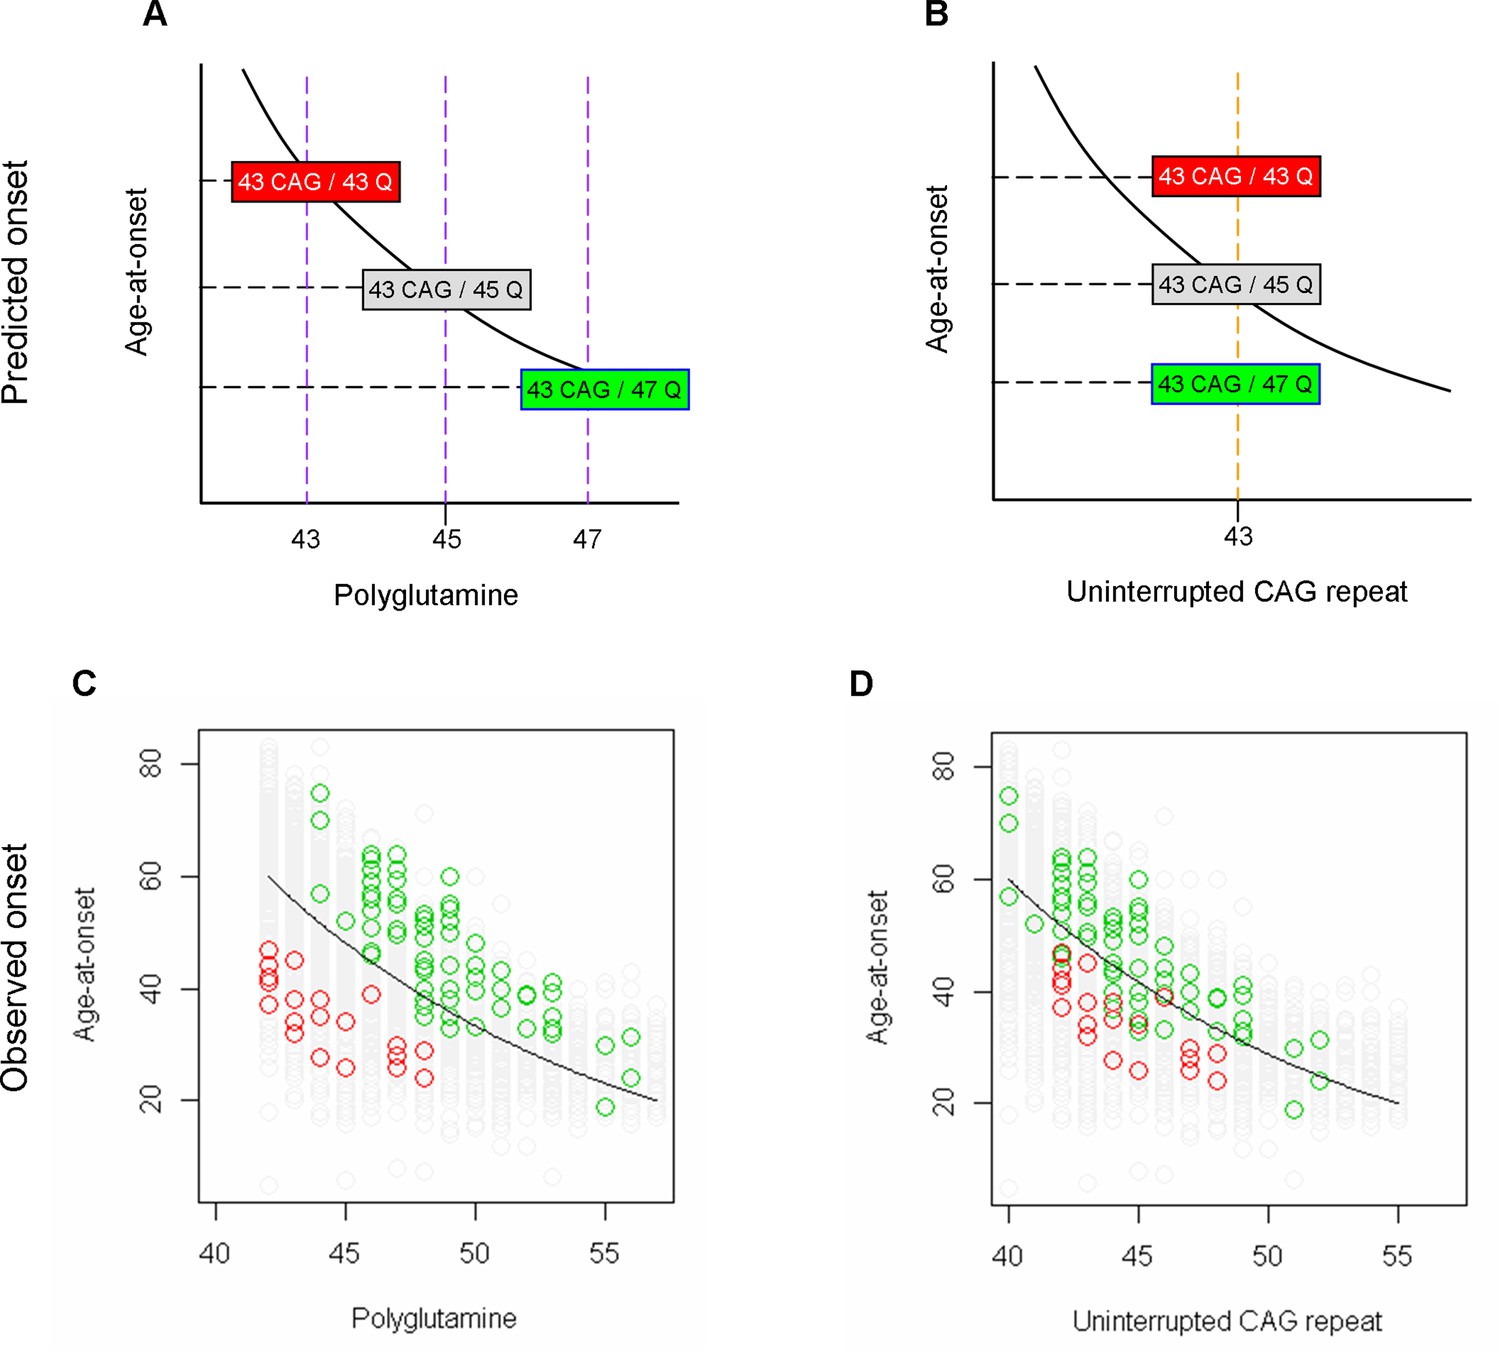
Prediction of age-at-onset of loss of interruption and duplicated interruption carriers based on an assumption that polyglutamine determines onset.
(A and B) Huntington’s disease (HD) subjects carrying 43 uninterrupted CAG repeats with different polyglutamine lengths due to loss of interruption and duplicated interruption are displayed as examples of their positioning relative to the trend lines, which represent hypothetical regression models for canonical repeat carriers describing the relationship between onset age and polyglutamine length (panel A) or uninterrupted CAG repeat length (panel B). Red, gray, and green rectangles respectively represent HD subjects carrying loss of interruption, canonical repeat, and duplicated interruption of 43 uninterrupted CAG repeats. (C and D) The observed age-at-onset (Y-axis) was compared to the size of polyglutamine tract (panel C) and uninterrupted CAG repeat (panel D). Green, gray, and green circles again represent HD subjects who carry duplicated interruption, canonical repeat, and loss of interruption, respectively. Black trend lines represent the actual regression models describing the relationship between onset age and polyglutamine length (panel C) or CAG repeat (panel D) in HD subjects carrying canonical repeats. In the observed data, the loss of interruption and duplicated interruption carriers showed the opposite patterns of age-at-onset from the prediction based on the assumption that polyglutamine length drives onset.
Figure 1—figure supplement 3
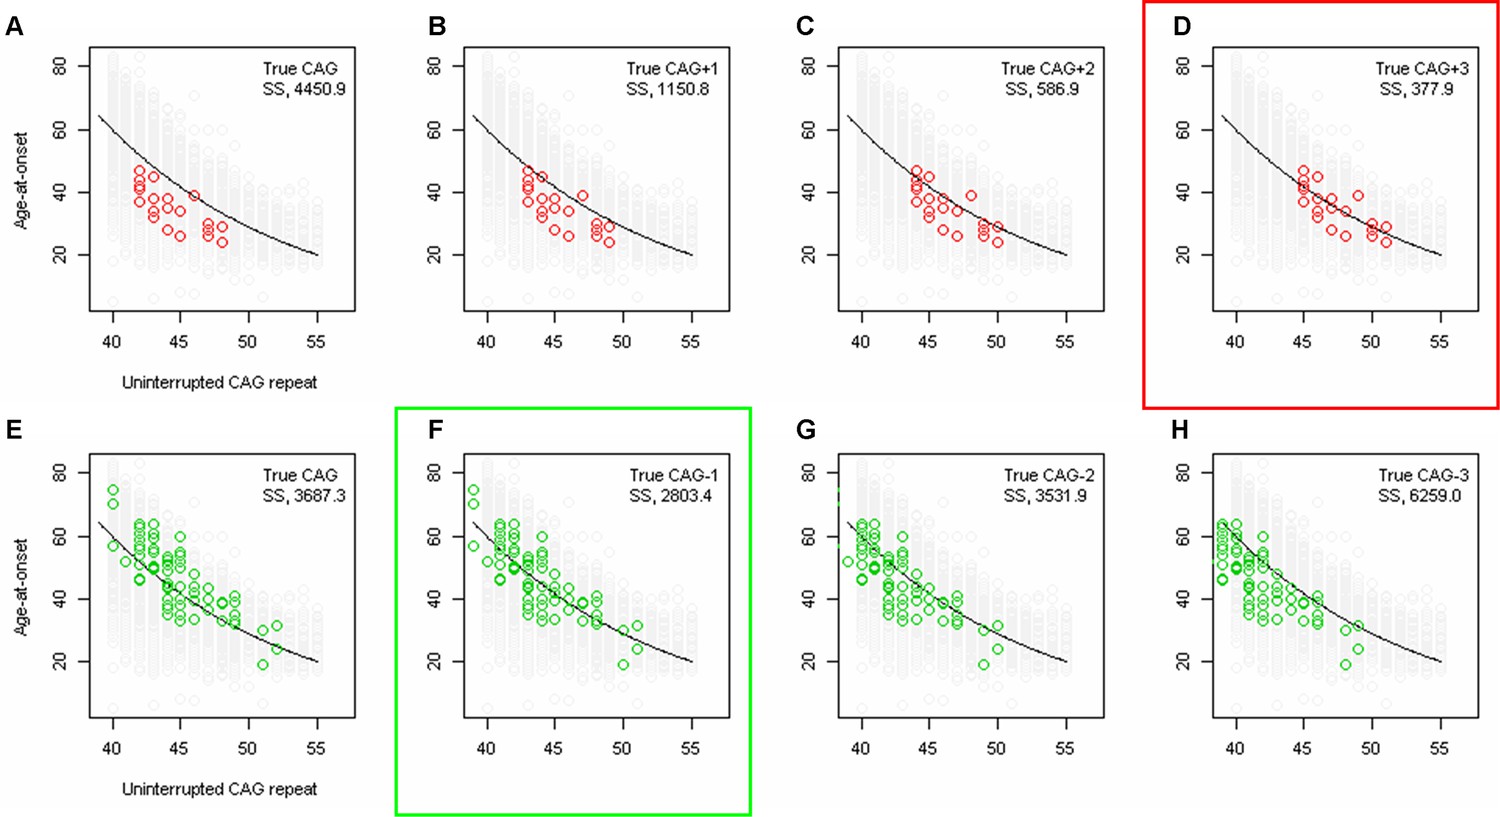
Least squares approximation to estimate the magnitude of additional effects of loss of interruption and duplicated interruption on age-at-onset.
To calculate the additional effects of loss of interruption and duplicated interruption after accounting for uninterrupted CAG repeat length, we performed least squares approximation. For loss of interruption (red circles) carriers, we calculated the sum of square (SS) using true CAG (A), true CAG+1 (B), true CAG+2 (C), and true CAG+3 (D). Similarly, we performed least squares approximation for duplicated interruption carriers by calculating SS using true CAG (E), true CAG-1 (F), true CAG-2 (G), and true CAG-3 (H). Y-axis represents age-at-onset, and black trend lines represent the onset-CAG regression model based on canonical repeat carriers. SS values are shown at the top right corner of each plot. Least squares approximation that produced the smallest SS for loss of interruption and duplicated interruption are indicated by red and green rectangles, respectively.
Figure 2 with 1 supplement
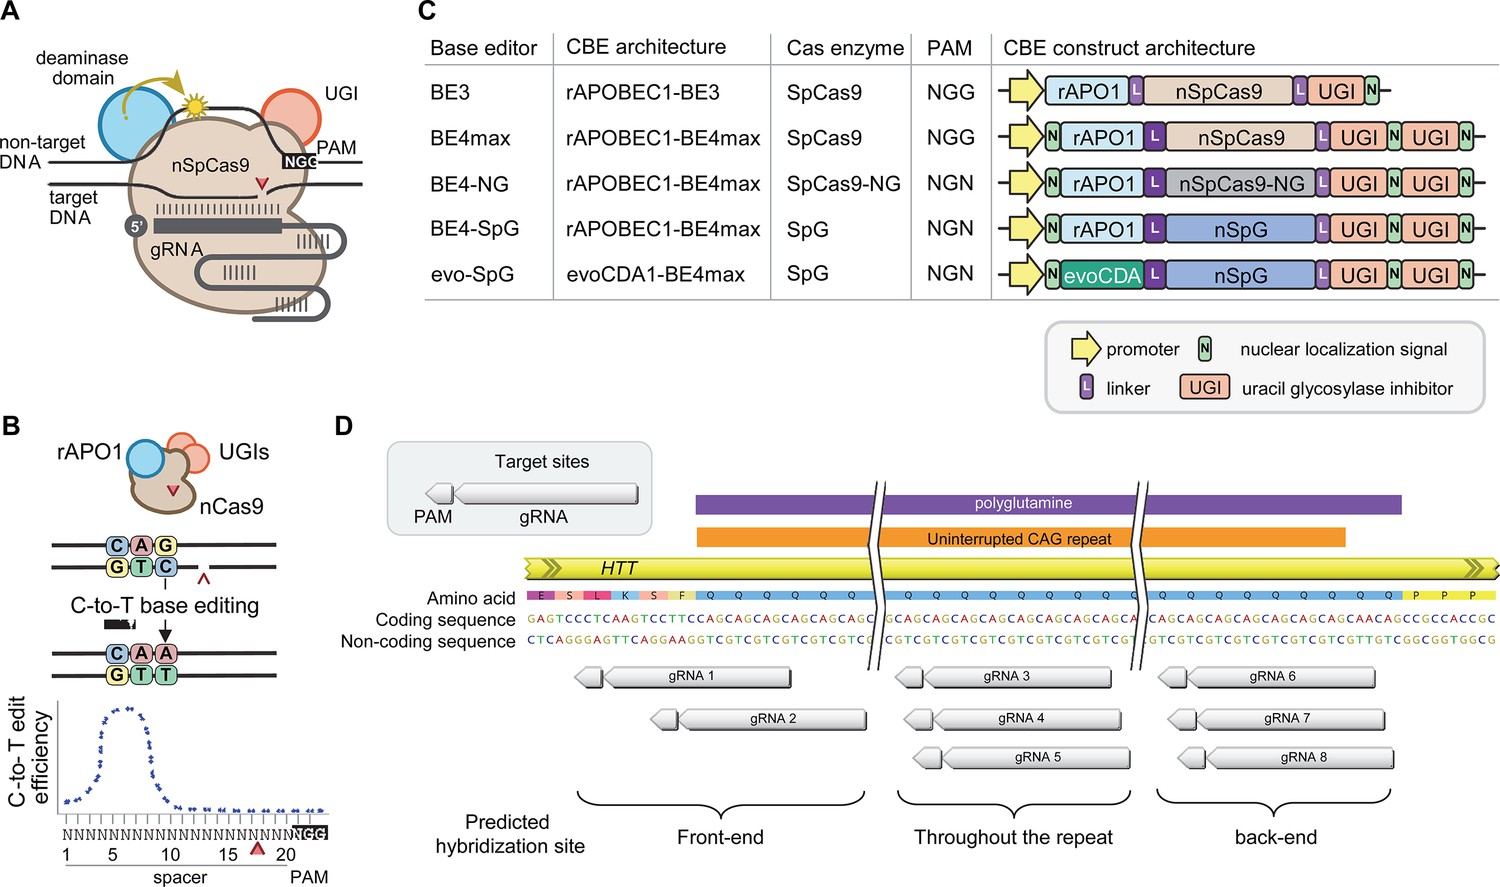
Cytosine base editors and guide RNAs (gRNAs) for CAG-to-CAA conversion in Huntington’s disease (HD).
(A) Constituents of base editing are displayed. (B) Schematic of cytosine base editors that can generate C-to-T conversion within a finite edit window at a fixed distance from the protospacer-adjacent motif (PAM). (C) Cytosine base editor variants described in the literature and used in this study (lower 4) are shown, including the evoCDA1-based SpG cytosine base editor that functions more efficiently in GC nucleotide contexts. PAM, gRNA, uracil glycosylase inhibitor (UGI), rat APOBEC1 deaminase domain (rAPO1), evolved CDA1 cytosine deaminase domain (evoCDA). (D) The target region, gRNAs, and expected hybridization sites of the eight gRNAs are shown.
Figure 2—figure supplement 1
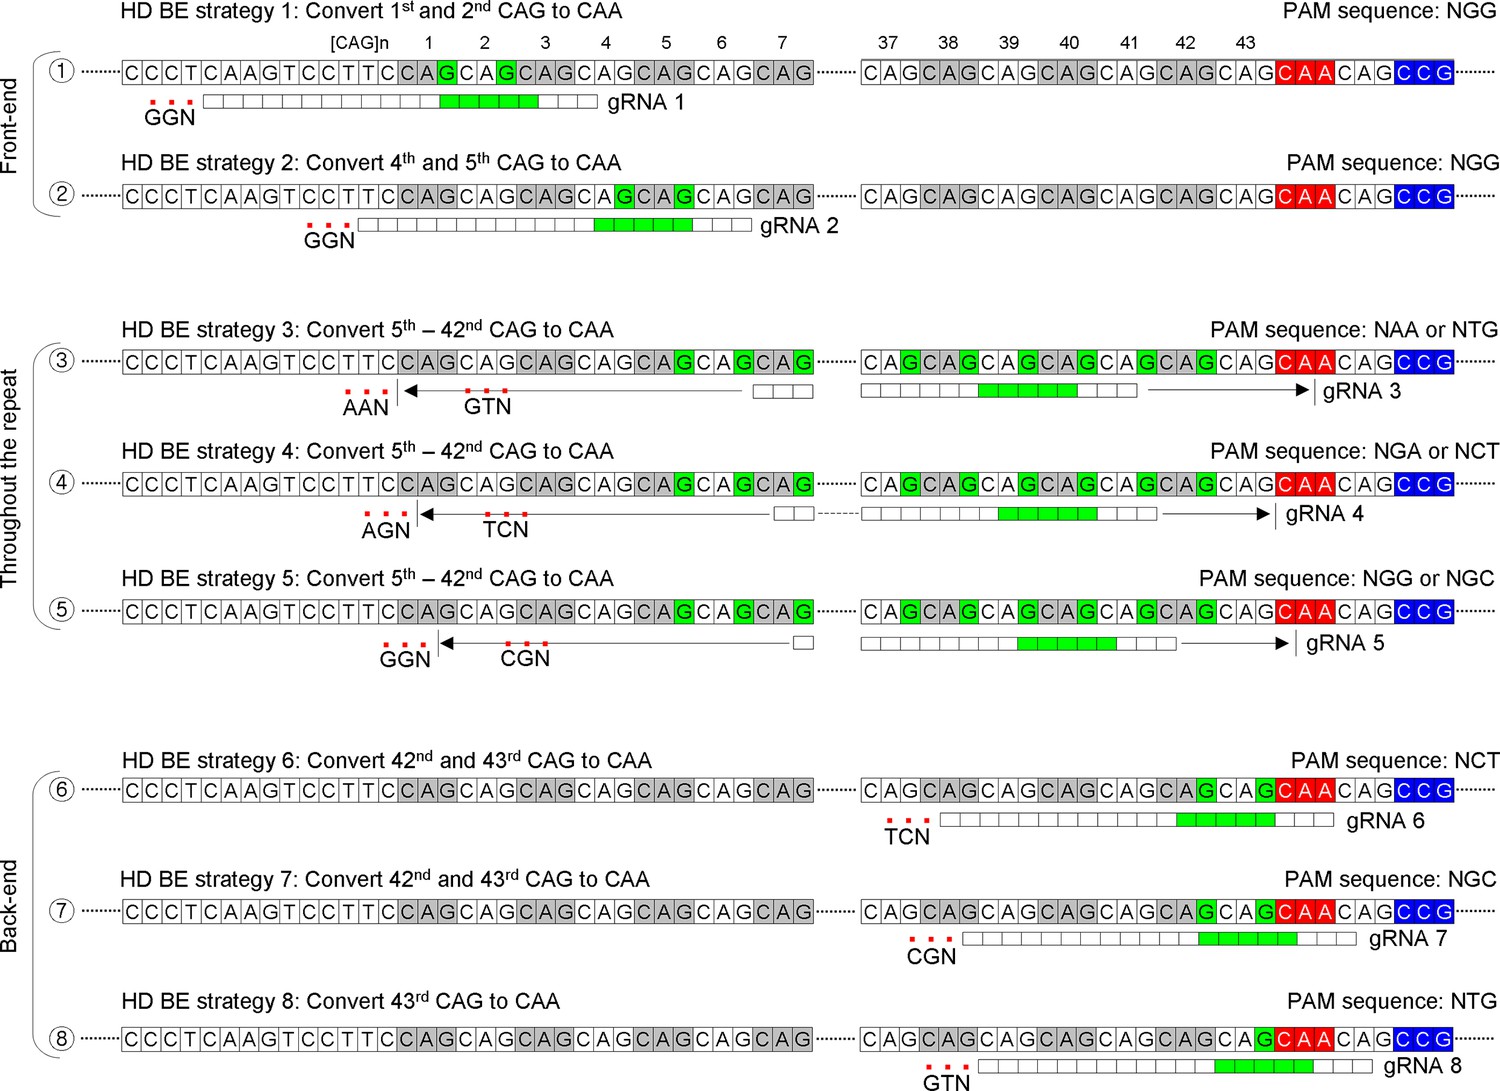
The guide RNAs (gRNAs) for CBEs to convert CAG to CAA in Huntington’s disease (HD).
We tested eight gRNAs in this study. The gRNAs are grouped based on the predicted sites of gRNA-target hybridization. The gRNAs 1, 2 were predicted to hybridize at the front-end of the repeat; gRNAs 3, 4, and 5 were predicted to hybridize throughout the repeat; and gRNAs 6, 7, and 8 were predicted to hybridize at the back-end of the repeat. The location of the protospacer-adjacent motif (PAM) (small red-filled squares under the target sequence) and gRNAs (a stretch of white and green rectangles) are indicated relative to an example of 43 CAG canonical repeat. The predicted conversion sites represented by the target sequence (filled green) were based on the widely used BE4.
Figure 3 with 2 supplements
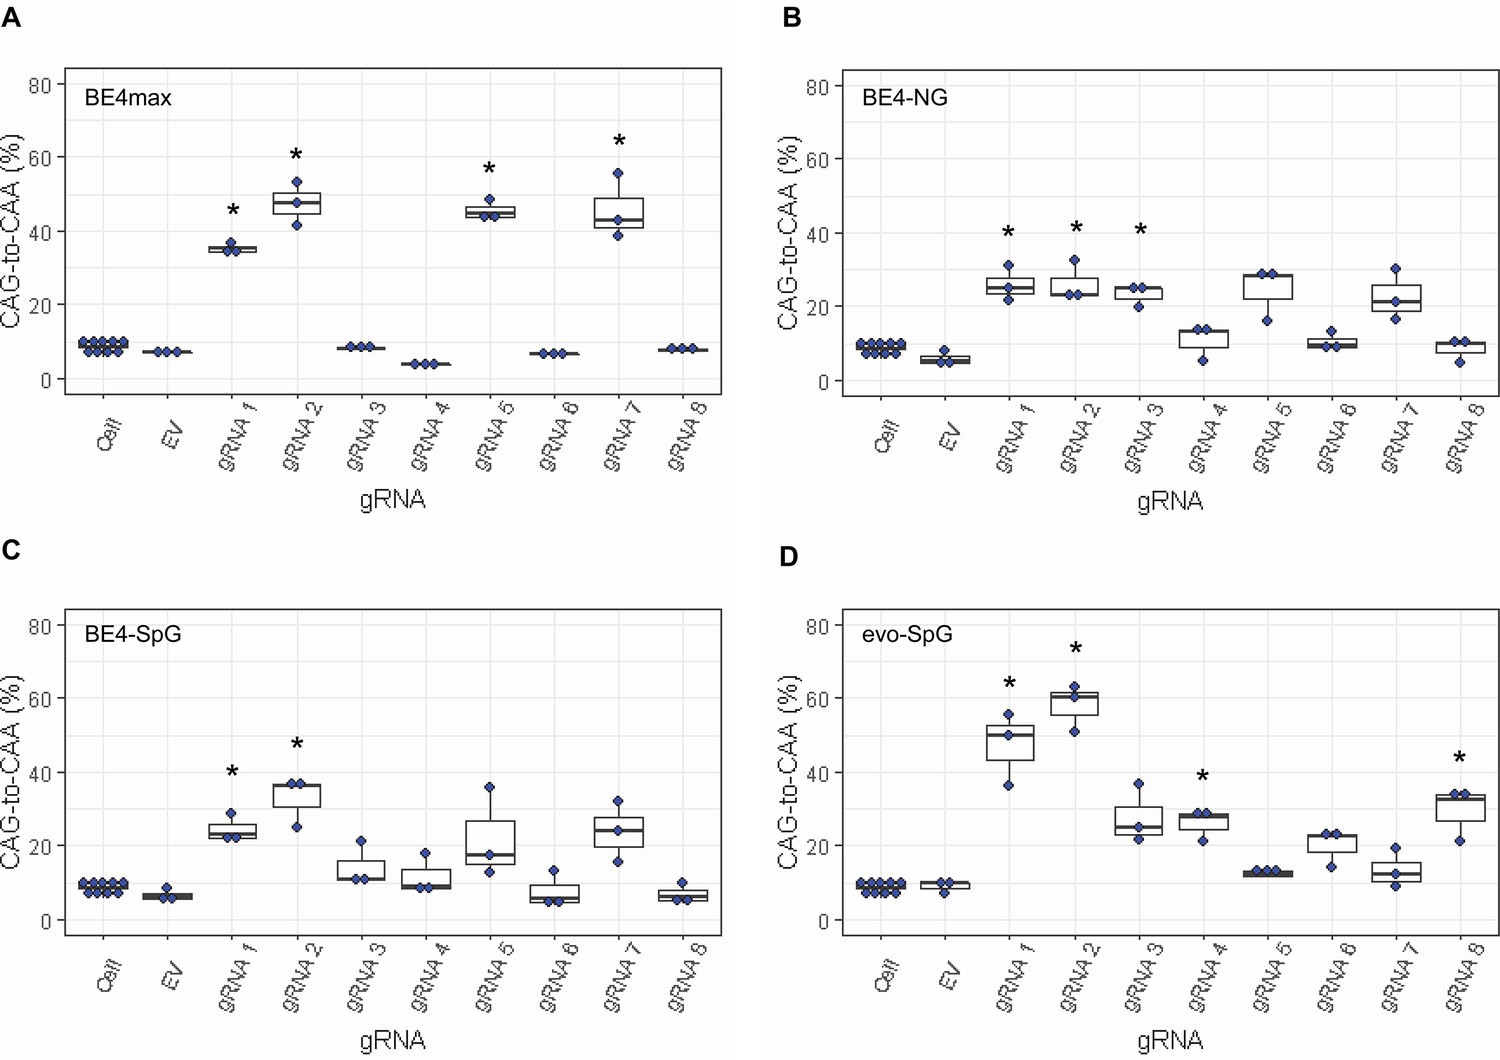
Levels of CAG-to-CAA conversion by base editing (BE) strategies.
Only CAG-to-CAA conversion showed significantly increased levels over the baseline sequencing errors. Thus, we calculated the percentage of CAA in the cells that were treated with a combination of cytosine base editors (A, BE4max; B, BE4-NG; C, BE4-SpG; and D, evo-SpG) and guide RNAs (gRNAs) (n=3). HEK293 cells without any treatment (i.e. Cell) were combined (n=8) and plotted for each base editor. EV represents HEK293 cells treated with a base editor and empty vector for gRNA. *, significant by Bonferroni-corrected p-value<0.05 (eight tests for each base editor).
Figure 3—figure supplement 1
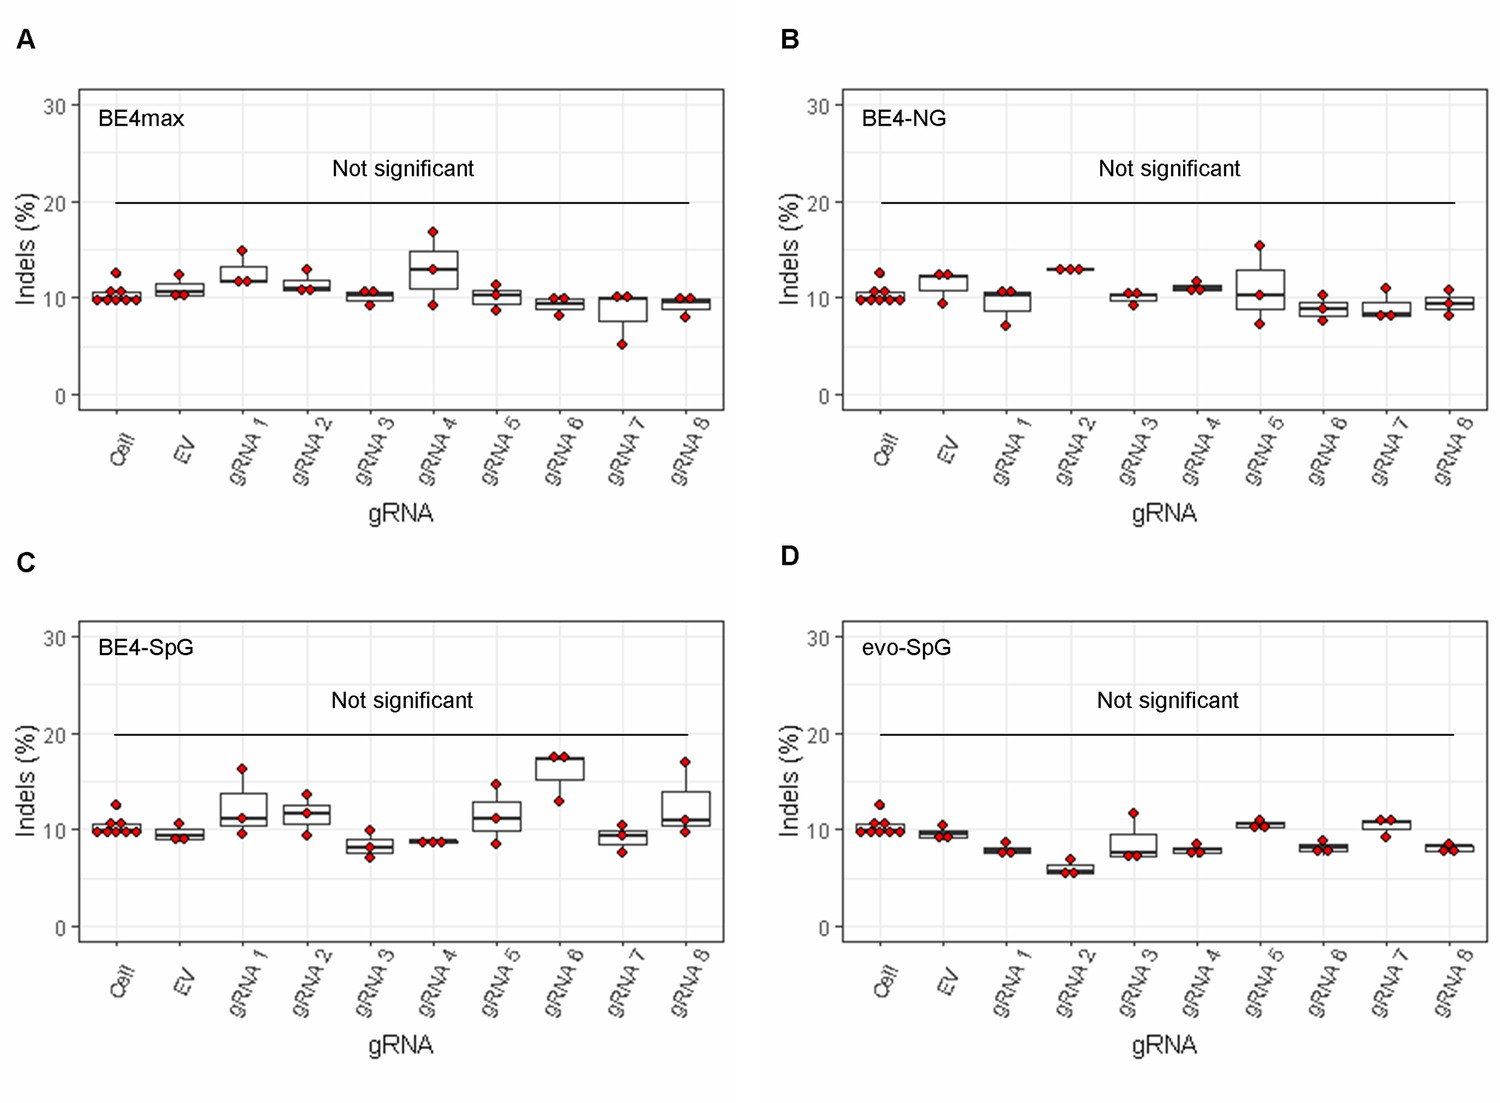
The lack of significant indels by base editing (BE) strategies.
MiSeq analysis was performed on HEK293 cells treated with combinations of base editors (A, BE4max; B, BE4-NG; C, BE4-SpG; and D, evo-SpG) and guide RNAs (gRNAs) to determine the proportion of the sequence reads containing indels. Replicate samples for HEK293 cells without any treatment (i.e. Cell) were combined (n=8) and plotted for each base editor. EV represents HEK293 cells treated with a base editor and empty vector for gRNA. Each box shows the maximum, upper quarter, median, lower quarter, and minimum (from the top) based on three independent transfection experiments. Red circles represent individual data points. None was significant compared to corresponding EV-treated cells by Bonferroni-corrected Student’s t-test (eight tests for each base editor).
Figure 3—figure supplement 2
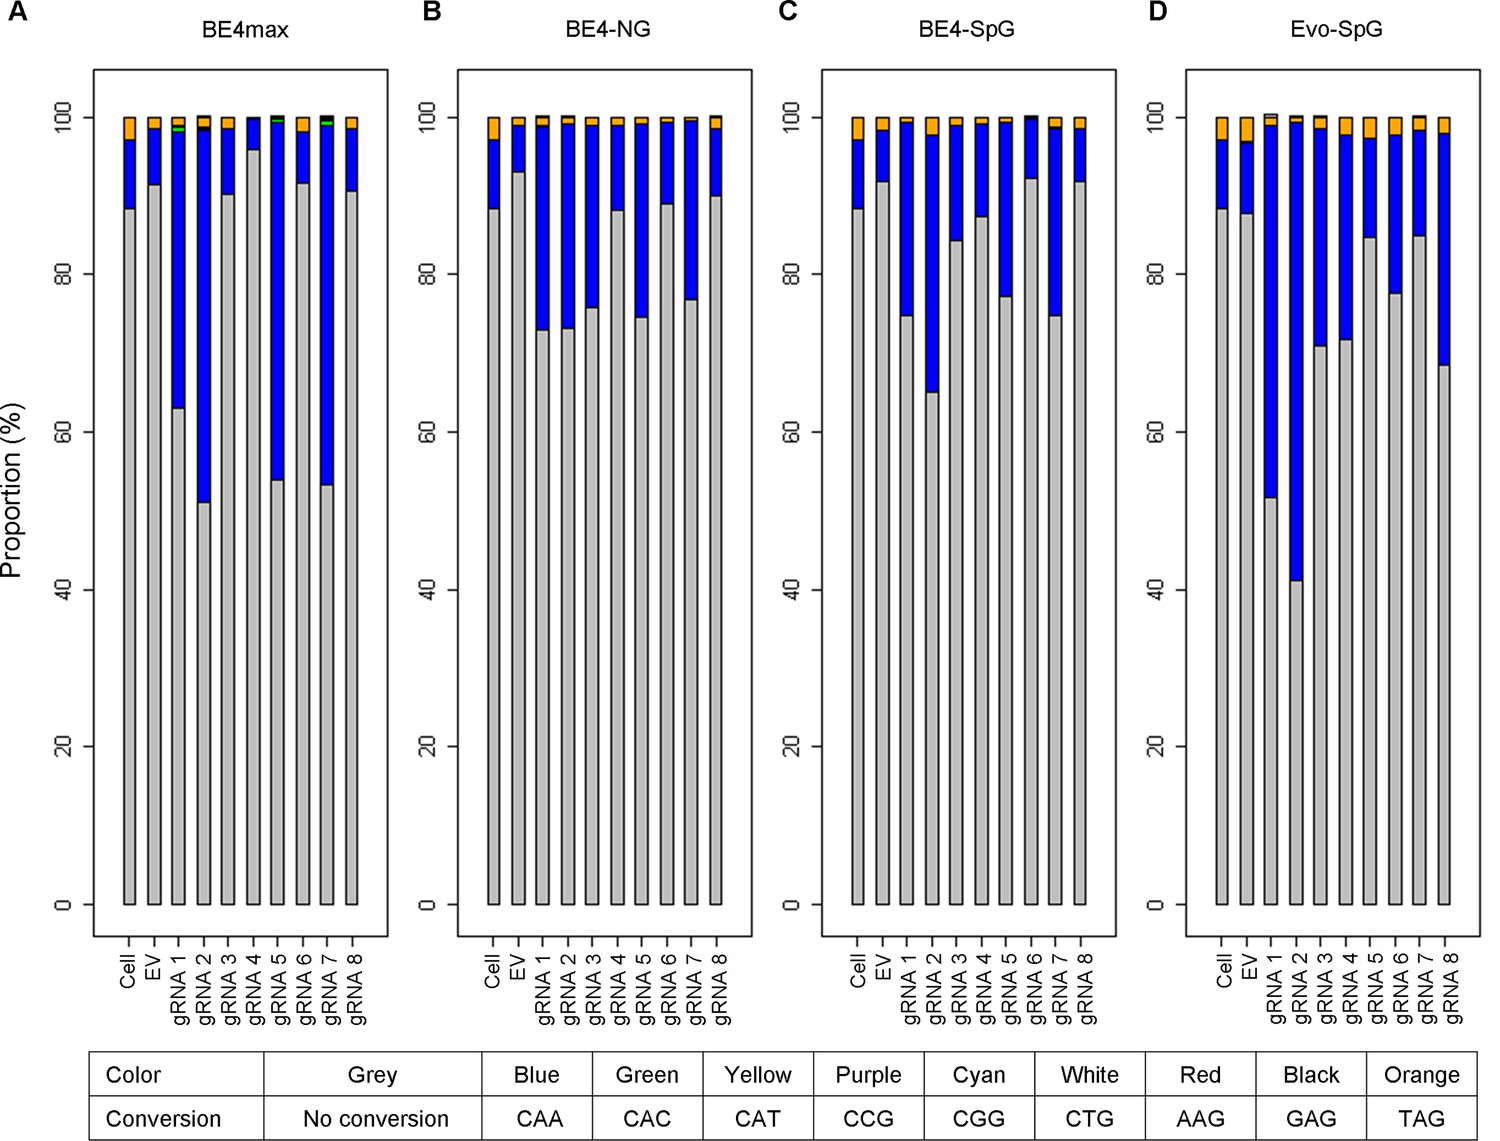
Types of base conversion by CBEs.
To determine the types of base conversions and to quantify their levels, we analyzed sequence reads of 16 or 17 CAGs (A, BE4max; B, BE4-NG; C, BE4-SpG; and D, evo-SpG). For each sample, we calculated the percentages of sequence reads containing CAA (blue), TAG (orange), and other trinucleotides. For example, the percentage of sequence reads containing CAA was calculated by dividing the number of sequence reads involving at least one CAA by the number of all sequence reads; therefore, 20% CAA means 20% of all sequence reads with 16 or 17 repeat sequences contain at least one CAA.
Figure 4 with 7 supplements
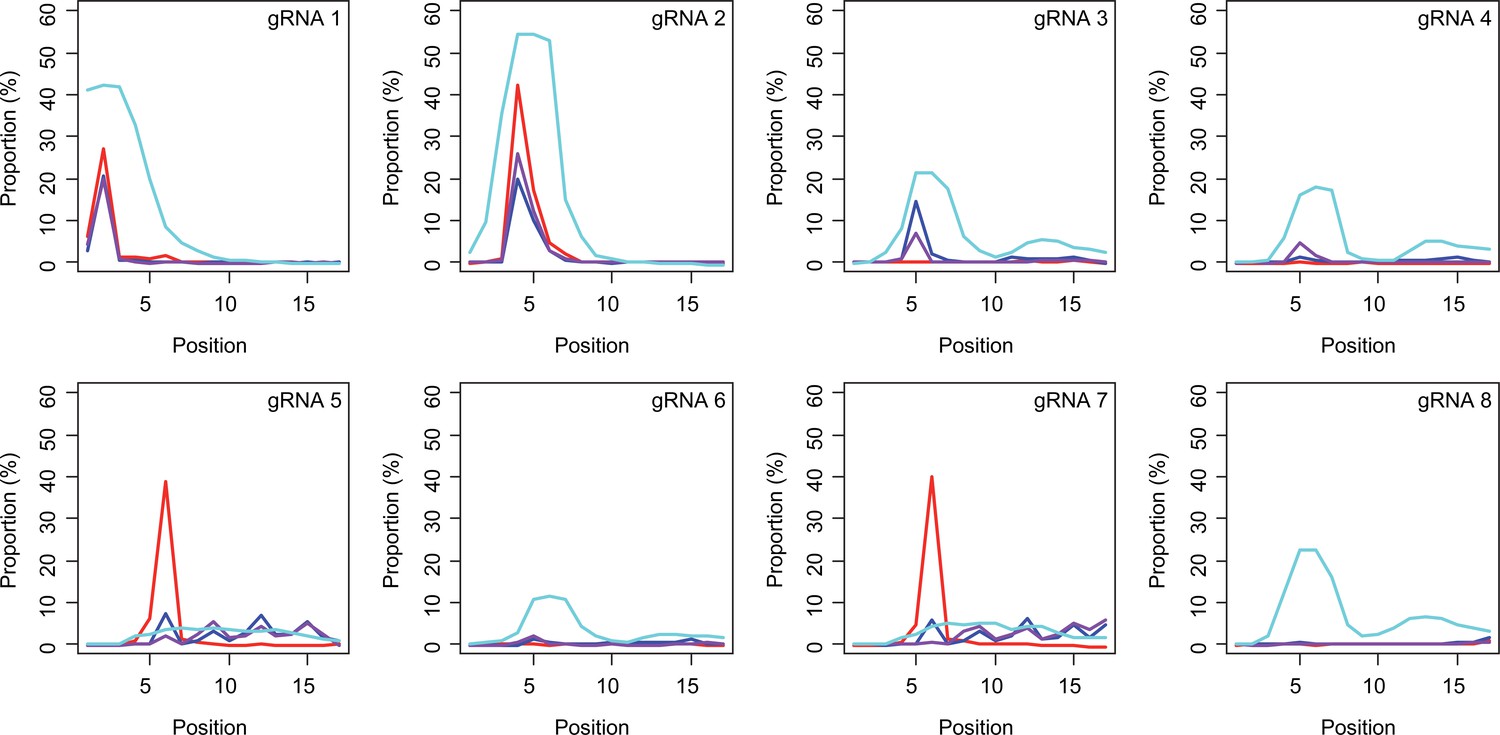
Sites of CAG-to-CAA conversion by base editing (BE) strategies.
We calculated the mean percentage of sequence reads containing CAA at specific sites relative to all sequence reads (n=3). For example, 27.7% conversion at the 2nd CAG by BE4max-gRNA 1 (top left panel, red) means 27.7% of all sequence reads in HEK293 cells have CAA at the 2nd CAG. X-axis and Y-axis represent the position of the CAG and percent conversion. Each panel represents a tested gRNA. Plots were based on the mean of three independent transfection experiments in HEK293 cells after subtracting corresponding empty vector (EV)-treated cell data. Red, blue, purple, and cyan traces represent BE4max, BE4-NG, BE4-SpG, and evo-SpG, respectively.
Figure 4—figure supplement 1
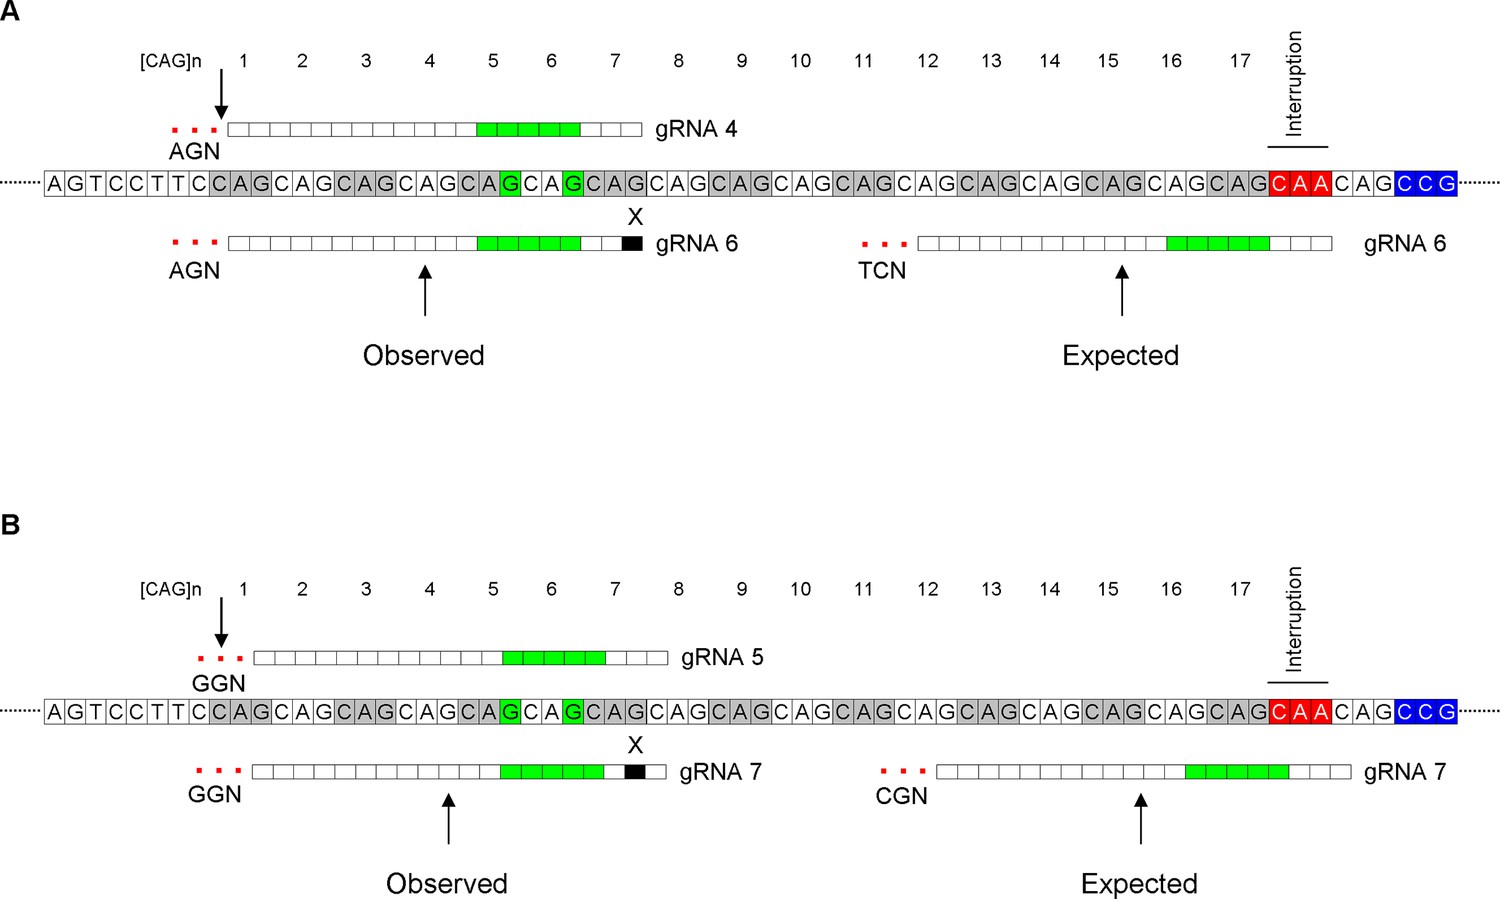
Potential explanations for unexpected conversion sites.
Diagrams illustrating the potential reason for the conversion at the 5th CAG by guide RNA (gRNA) 6 (A; BE4-NG and BE4-SpG) and at the 6th CAG by gRNA 7 (B; BE4max) are shown. The sequences of gRNAs 4 and 6 are identical except for one mismatch. Therefore, it appeared that one mismatch was tolerated (black rectangle with an ‘X’) in favor of the NGA protospacer-adjacent motif (PAM), resulting in conversion at the front-end (B). Similarly, the sequences of gRNAs 5 and 7 are the same except for one nucleotide at the 19th position (B). Tolerance of one mismatch (black rectangle with an ‘X’) would allow gRNA 7 to interact with the target site at the front-end, resulting in efficient editing at the 6th CAG, thanks to NGG PAM. Alignment and the locations of putative PAMs were indicated relative to an example of a 43 CAG canonical repeat. ‘G’ with green highlight represents putative conversion sites; green rectangles represent conversion windows for BE4max.
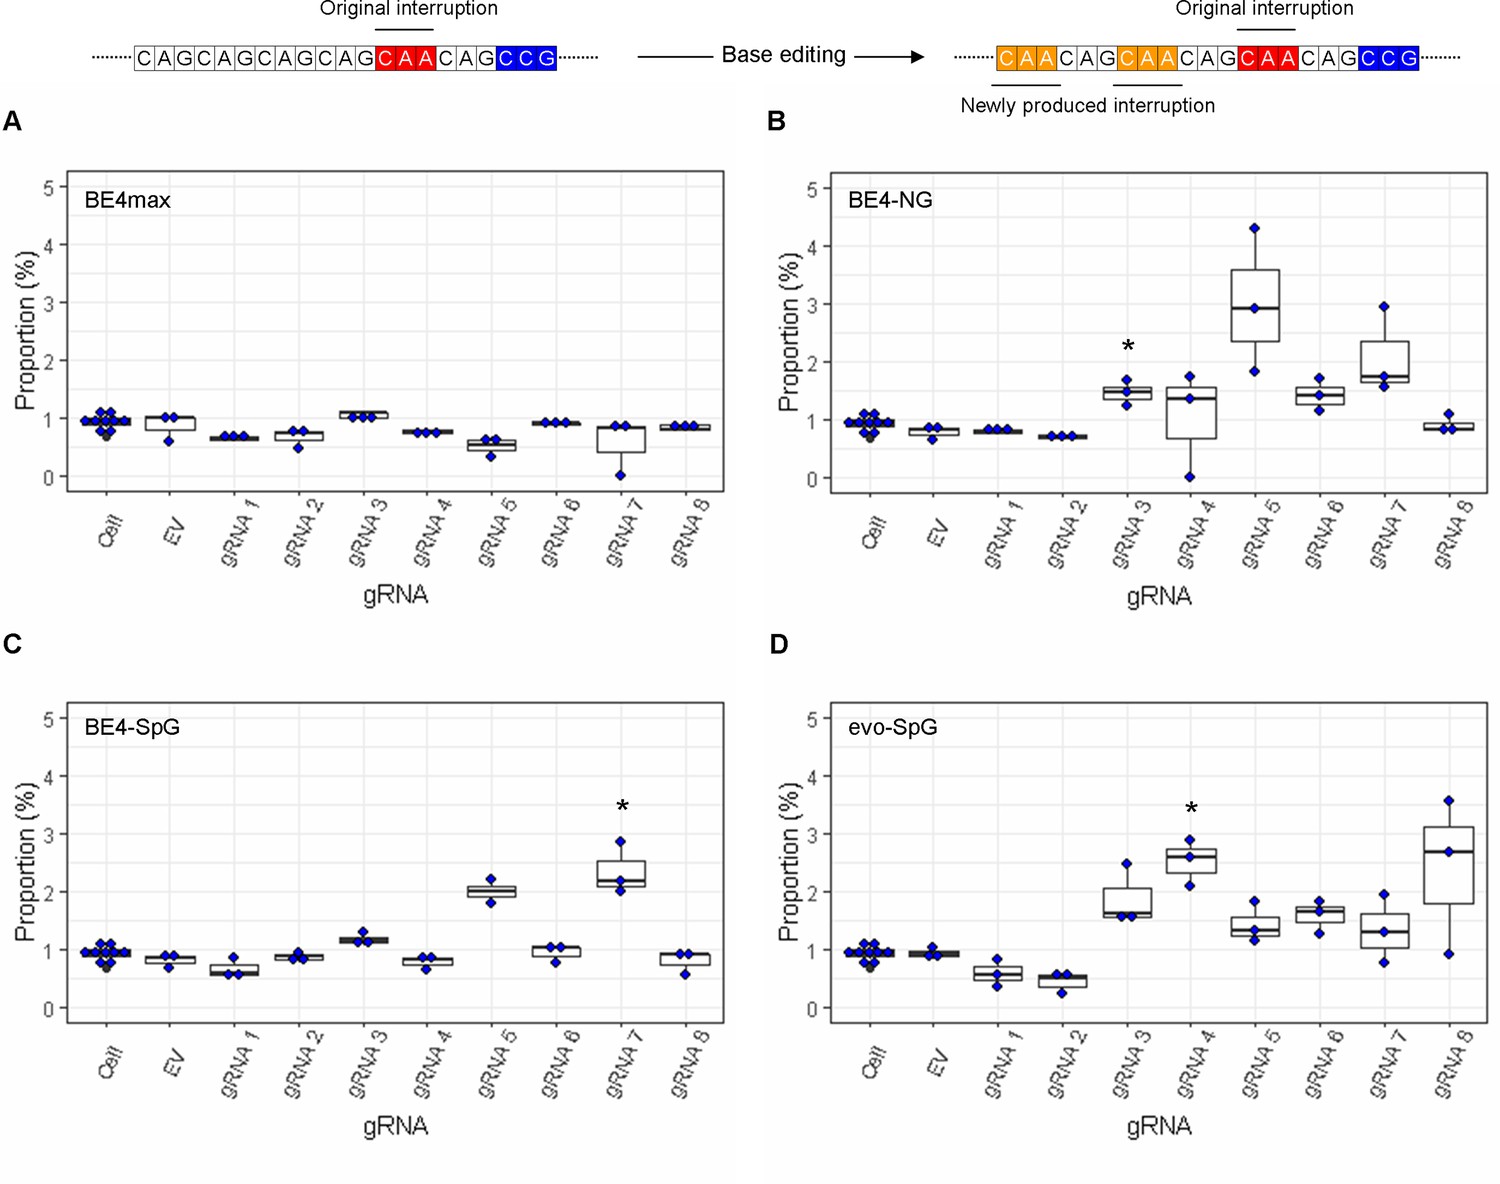
Figure 4—figure supplement 2
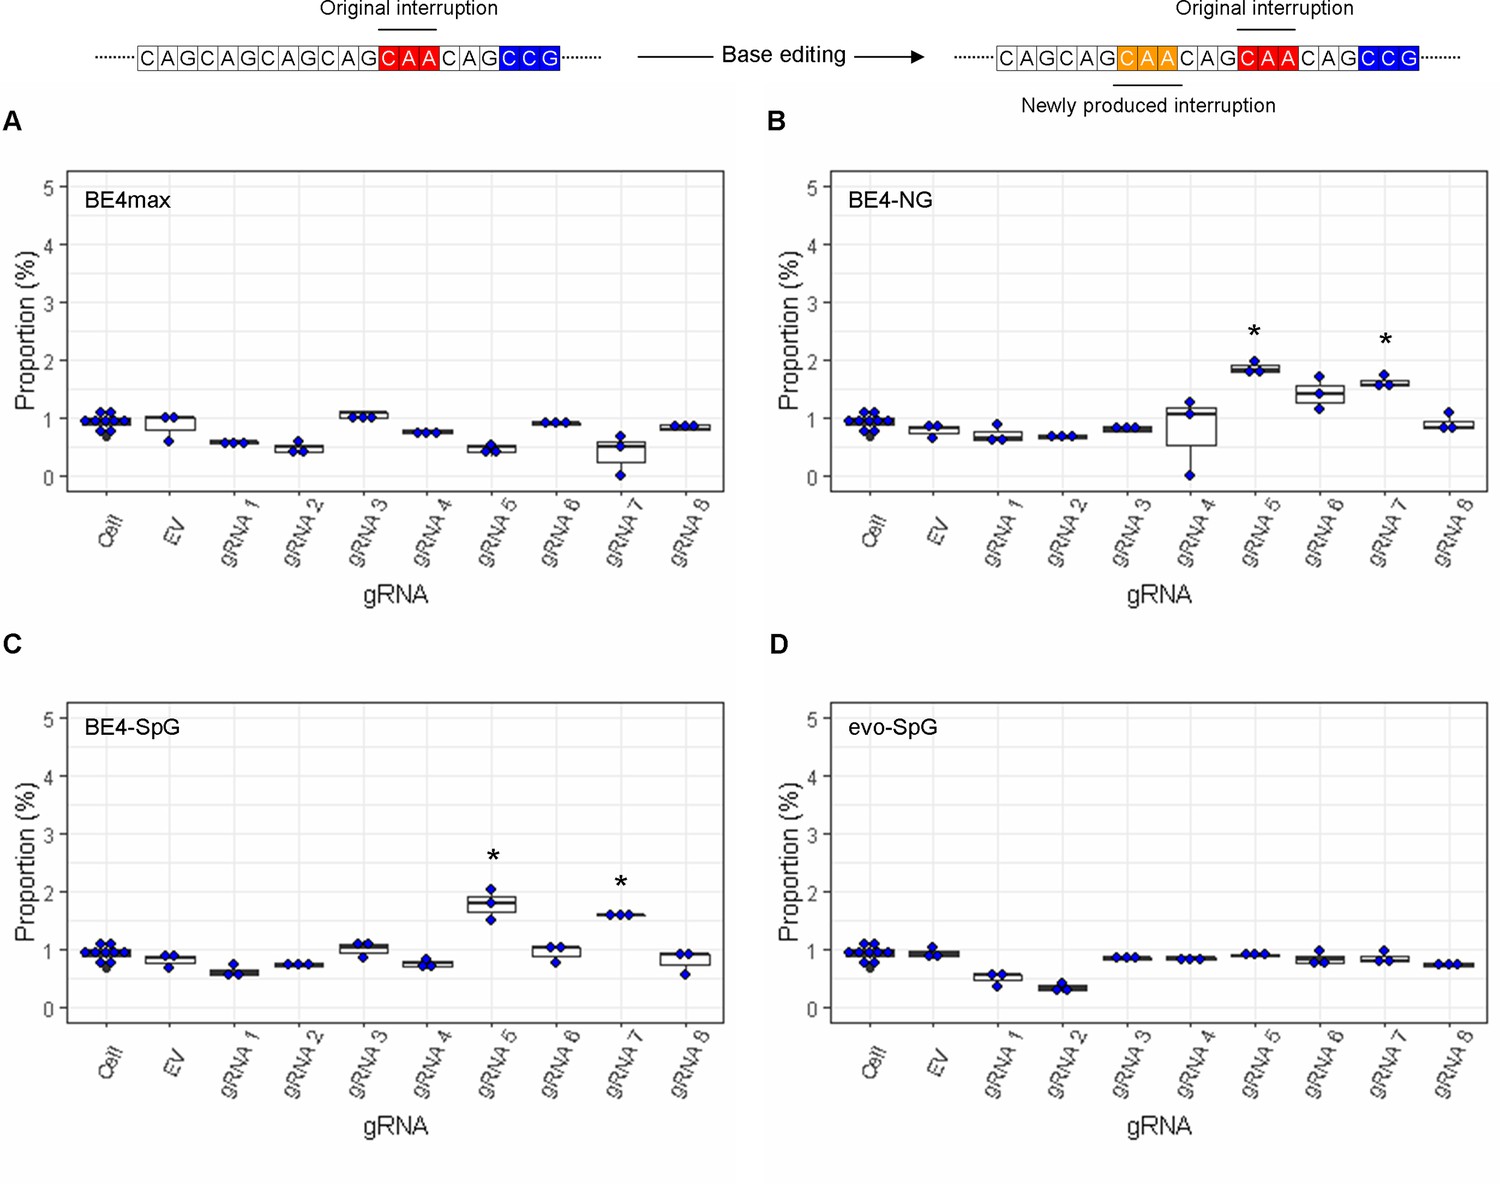
The levels of duplicated interruption alleles produced by base editing (BE) strategies.
On the top, an example of duplicated interruption is displayed; filled red and orange in the example diagram represent original CAA interruption and CAA produced by BE strategies, respectively. The proportion of duplicated interruption in HEK293 cells treated with different BE strategies are displayed (A, BE4max; B, BE4-NG; C, BE4-SpG; and D, evo-SpG) (n=3 independent experiments). HEK293 cells without any treatment (i.e. Cell) were combined (n=8) and plotted for each base editor. EV represents HEK293 cells treated with a base editor and empty vector for guide RNA (gRNA). *, significant by Bonferroni-corrected p-value<0.05 (eight tests for each base editor).
Figure 4—figure supplement 3
The levels of sequence read containing both duplicated interruption and CAG-to-CAA conversions at other sites.
On the top, an example of duplicated interruption with additional CAG-to-CAA conversion is displayed; filled red and orange in the example diagram represent original CAA interruption and new CAA produced by base editing (BE) strategies, respectively. The proportion of sequence reads containing duplicated interruption and CAG-to-CAA conversions at other sites in HEK293 cells treated with different BE strategies are displayed (A, BE4max; B, BE4-NG; C, BE4-SpG; and D, evo-SpG) (n=3 independent experiments). An example of such modification is displayed at the top. HEK293 cells without any treatment (i.e. Cell) were combined (n=8) and plotted for each base editor. EV represents HEK293 cells treated with a base editor and empty vector for guide RNA (gRNA). *, significant by Bonferroni-corrected p-value<0.05 (eight tests for each base editor).
Figure 4—figure supplement 4
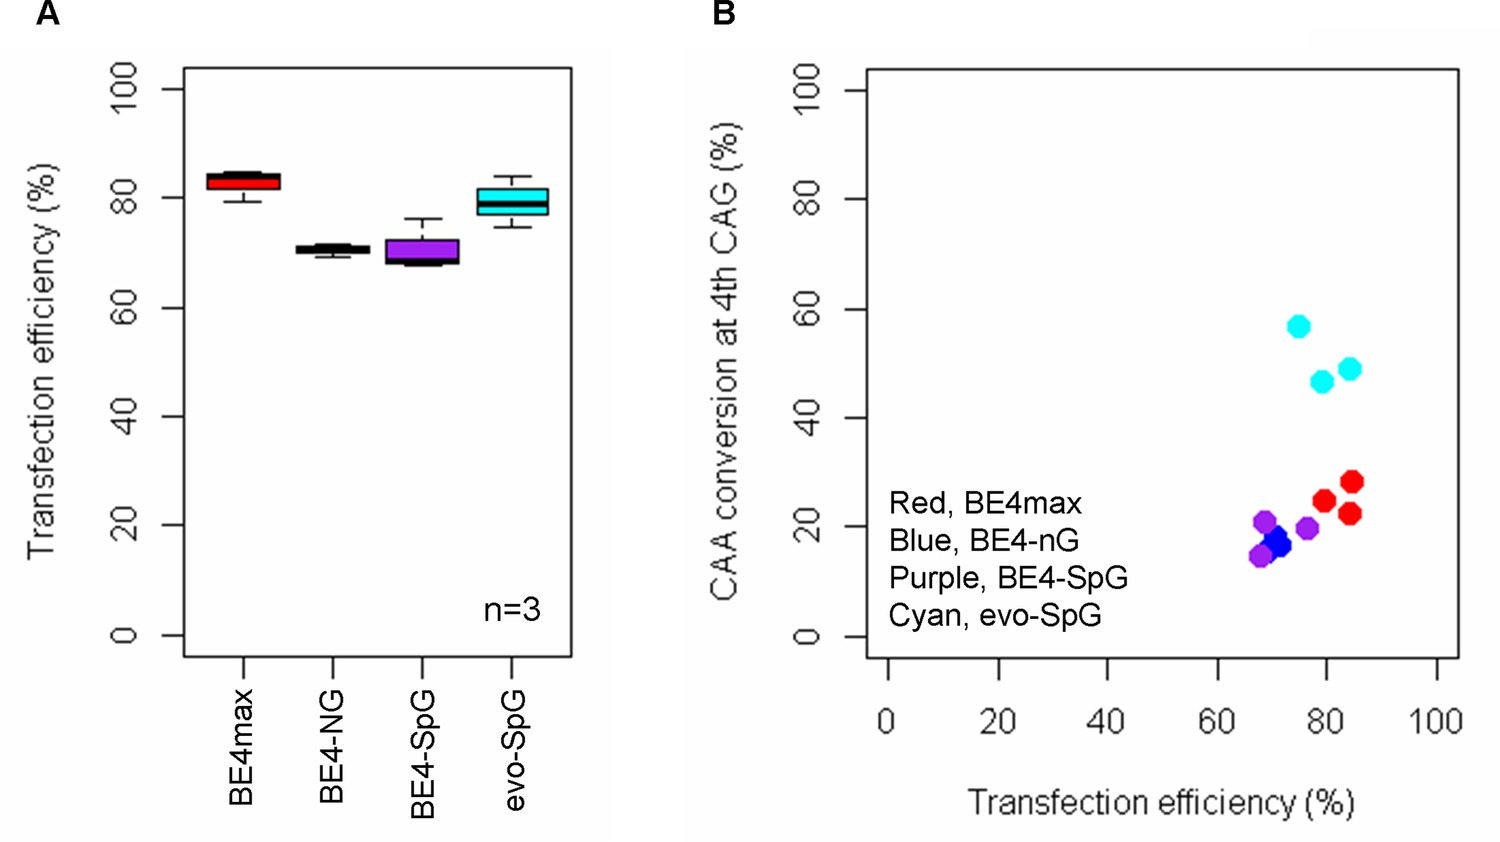
Transfection efficiency.
To determine whether different conversion efficiencies and patterns were due to transfection efficiencies, we treated HEK293 cells with guide RNA (gRNA) 2, and determined transfection efficiencies (A) and conversion efficiencies (B). We compared transfection efficiency (X-axis) with the conversion efficiencies at the 4th CAG (Y-axis in the panel B). Plots were based on the mean of three independent transfection experiments.
Figure 4—figure supplement 5
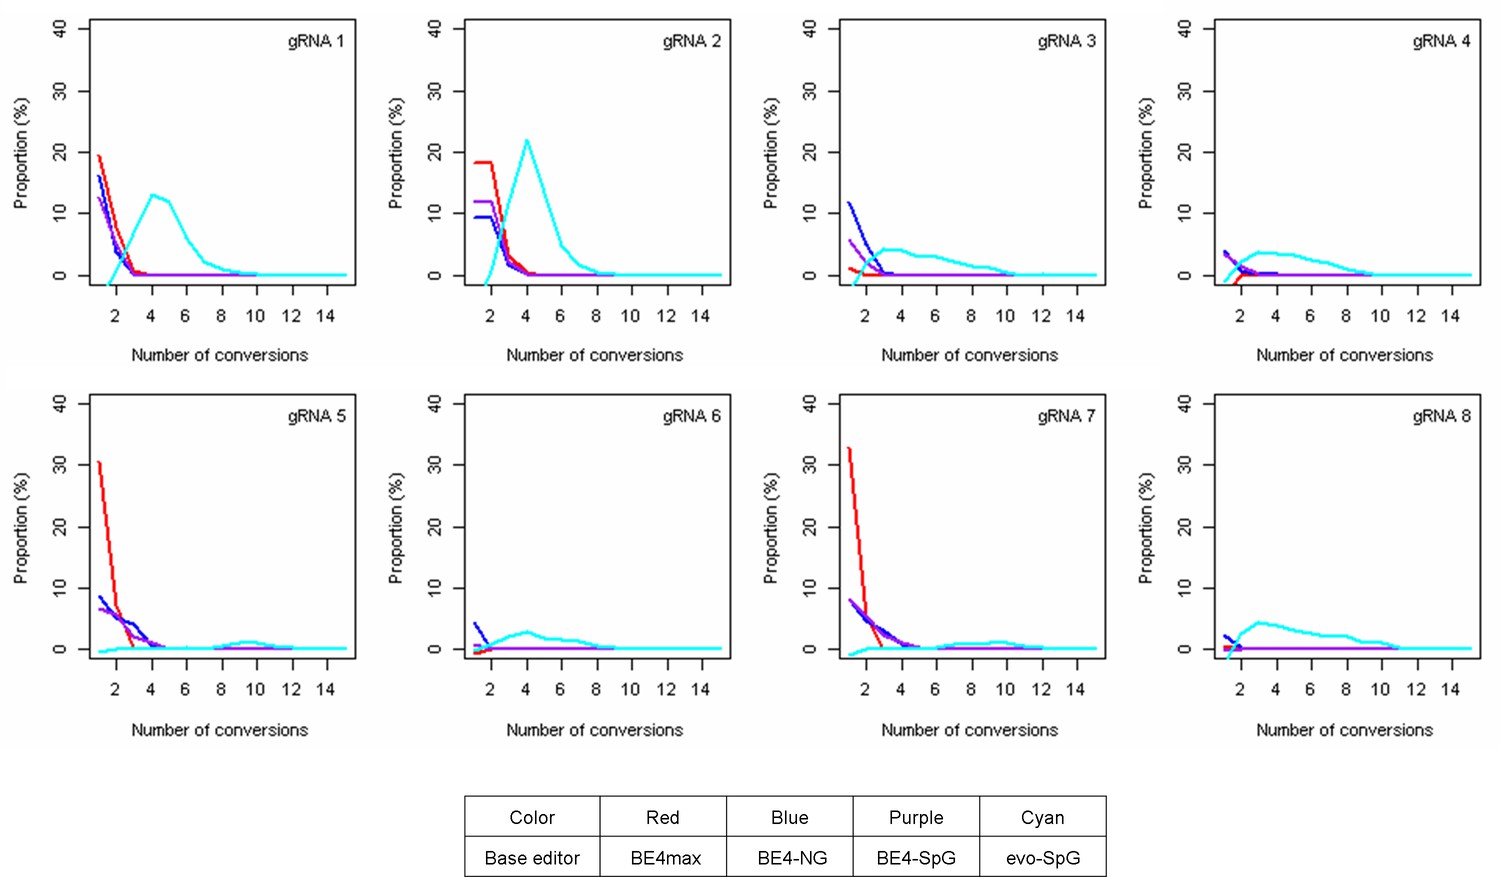
The levels of multiple conversions.
The sequence reads in our MiSeq data with at least one CAG-to-CAA conversion were analyzed to count the number of CAG-to-CAA conversions in a given sequence read. The proportion was calculated by subtracting corresponding empty vector (EV)-treated cell data (Y-axis), meaning the percentage of sequence reads containing a given number of multiple conversions relative to all sequence reads from the original 16 or 17 CAG alleles. Red, blue, purple, and cyan traces represent BE4max, BE4-NG, BE4-SpG, and evo-SpG, respectively. Each panel shows a tested guide RNA (gRNA); plots were based on the mean of three independent transfection experiments in HEK293 cells.
Figure 4—figure supplement 6
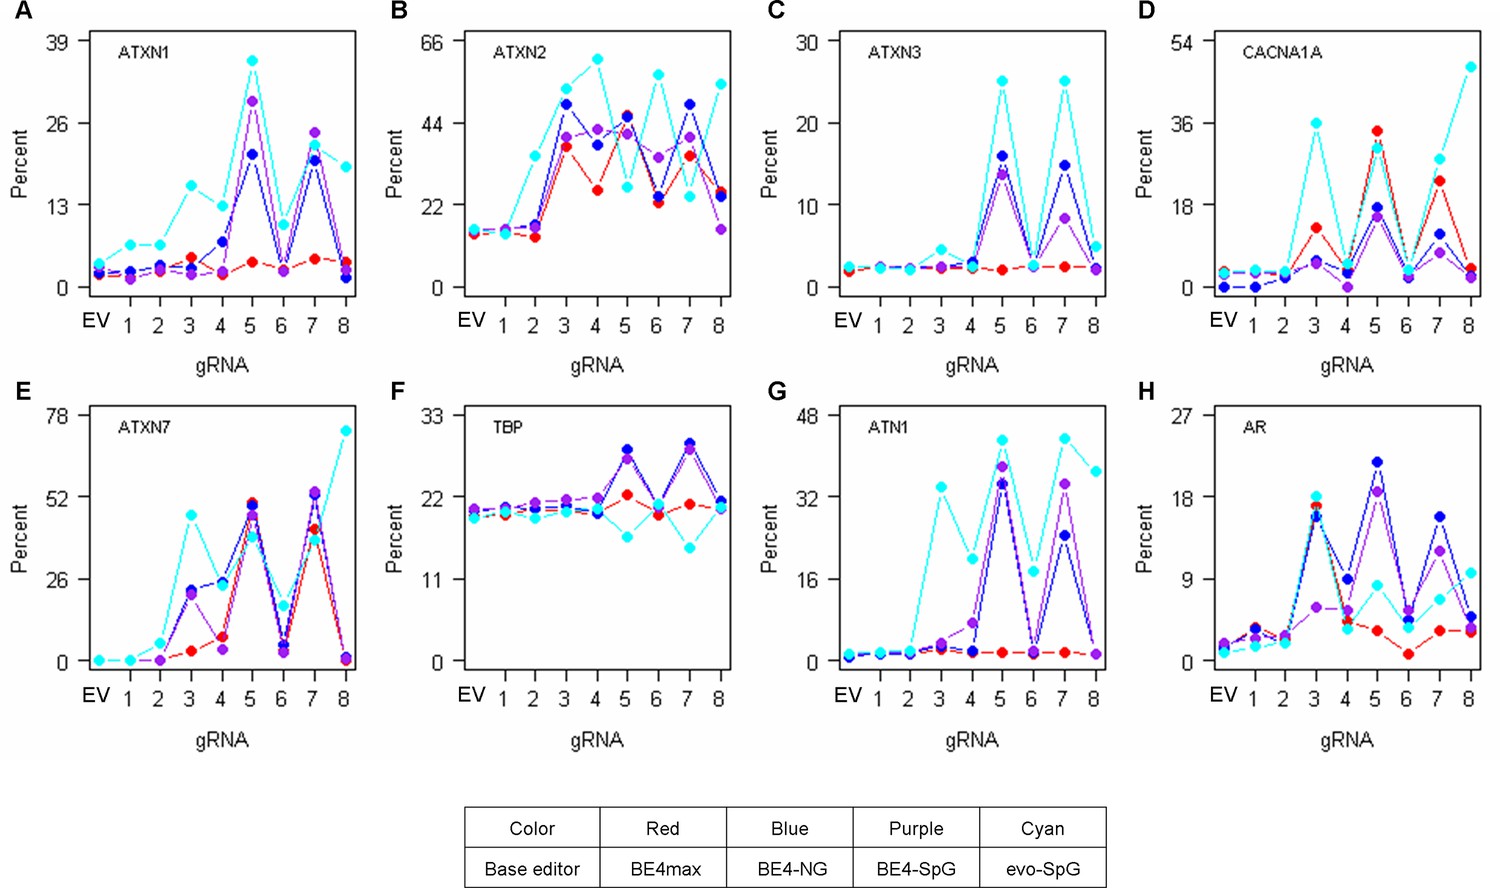
Off-target conversions on other polyglutamine disease genes.
To determine the levels of CAG-to-CAA conversions in the CAG repeats of other polyglutamine disease genes (A, ATXN1; B, ATXN2; C, ATXN3; D, CACNA1A; E, ATXN7; F, TBP; G, ATN1; and H, AR), we further analyzed representative HEK293 cells treated with base editing (BE) strategies (n=1). EV represents empty vector-treated cells. Red, blue, purple, and cyan traces represent BE4max, BE4-NG, BE4-SpG, and evo-SpG, respectively.
Figure 4—figure supplement 7
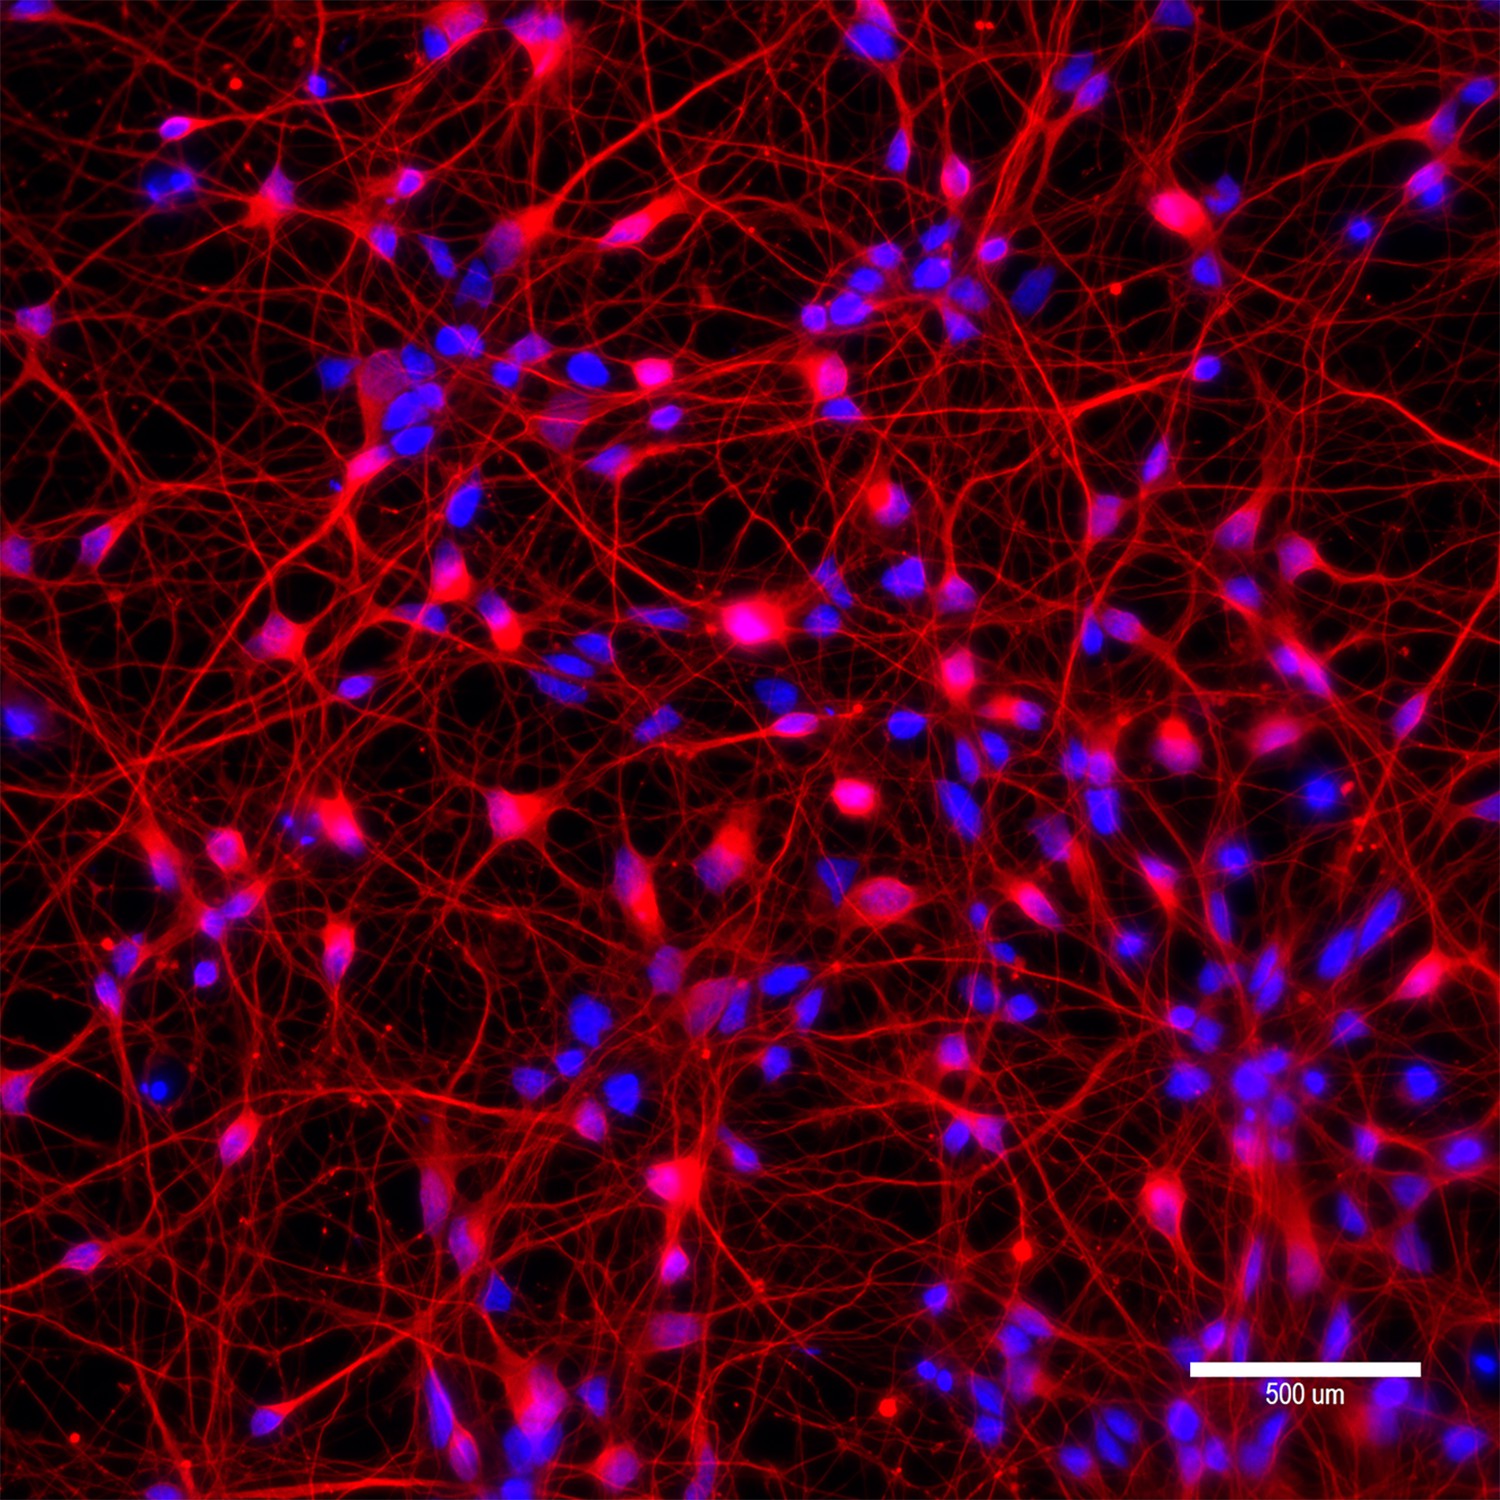
Characterization of differentiated neurons from a patient-derived induced pluripotent stem cell (iPSC).
To determine the levels of allele specificities of base editing (BE) strategies in neurons, we differentiated a patient-derived iPSC (42 CAG) into neurons and transfected with candidate BE strategies. Characterization of differentiated neurons was based on immunostaining of beta III tubulin (red). Blue staining represents DAPI staining for nuclei. A scale bar is equal to 500 µm.
Figure 5 with 1 supplement
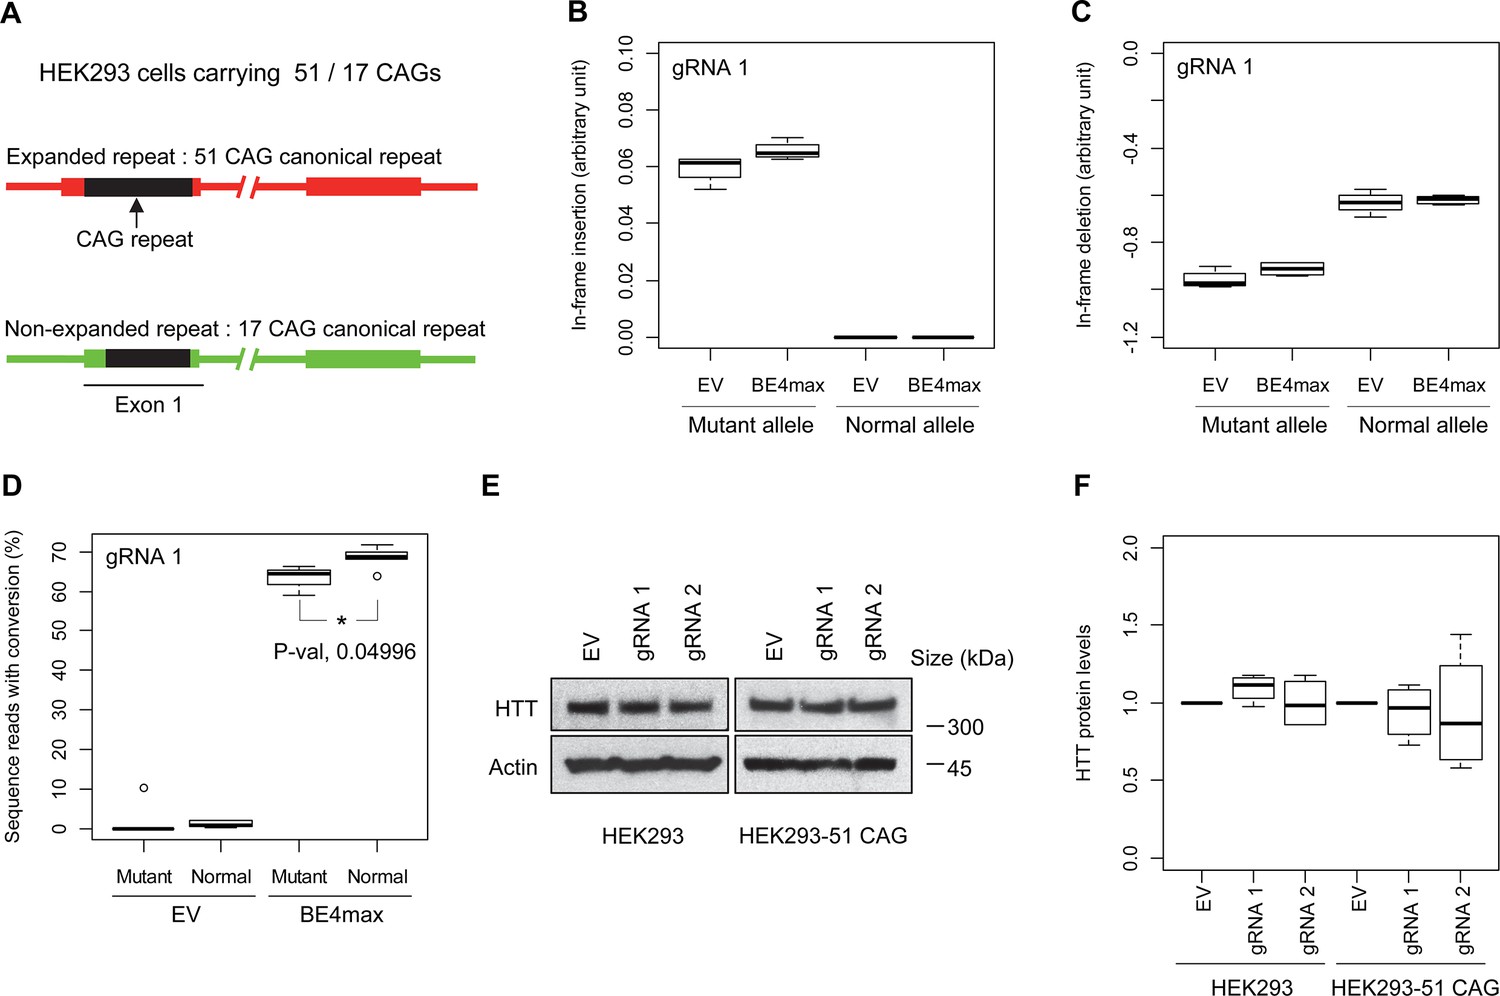
Allele specificity and molecular outcomes of candidate base editing (BE) strategies.
(A) To overcome the limitations of patient-derived induced pluripotent stem cell (iPSC) and differentiated neurons, we developed HEK293 carrying an adult-onset CAG repeat by replacing one of the normal repeats with 51 canonical CAG (namely HEK293-51 CAG). Red and green bars represent respectively mutant and normal HTT in HEK293-51 CAG cells. (B and C) The HEK293-51 CAG cells were treated with BE4max-gRNA 1 and analyzed to determine the levels of in-frame insertion (B) and in-frame deletion (C) at the time of treatment (n=4). (D) The HEK293-51 CAG cells were treated with the gRNA 1 and analyzed by MiSeq to determine the levels of allele specificity. Conversion efficiency on the Y-axis indicates the percentage of sequence reads containing the CAG-to-CAA conversion at the target site (n=3). * represents uncorrected p-value<0.05 by Student’s t-test. (E) Original HEK293 cells and HEK293-51 CAG cells were treated with empty vector (EV), or candidate BE strategies (BE4max-gRNA 1 and BE4max-gRNA 2) and subjected to immunoblot analysis; representative blot is shown in panel E (n=3). (F) Four independent experiments were performed, and we performed one-sample t-test to determine whether BE-treated cells show different total HTT protein levels compared to EV-treated cells (n=4). Nothing was significant by p-value<0.05.
-
Figure 5—source data 1
Unedited original images of the western blot analysis in Figure 5E.
- https://cdn.elifesciences.org/articles/89782/elife-89782-fig5-data1-v2.zip
-
Figure 5—source data 2
Uncropped images with labels of the western blot analysis in Figure 5E.
- https://cdn.elifesciences.org/articles/89782/elife-89782-fig5-data2-v2.zip
Figure 5—figure supplement 1
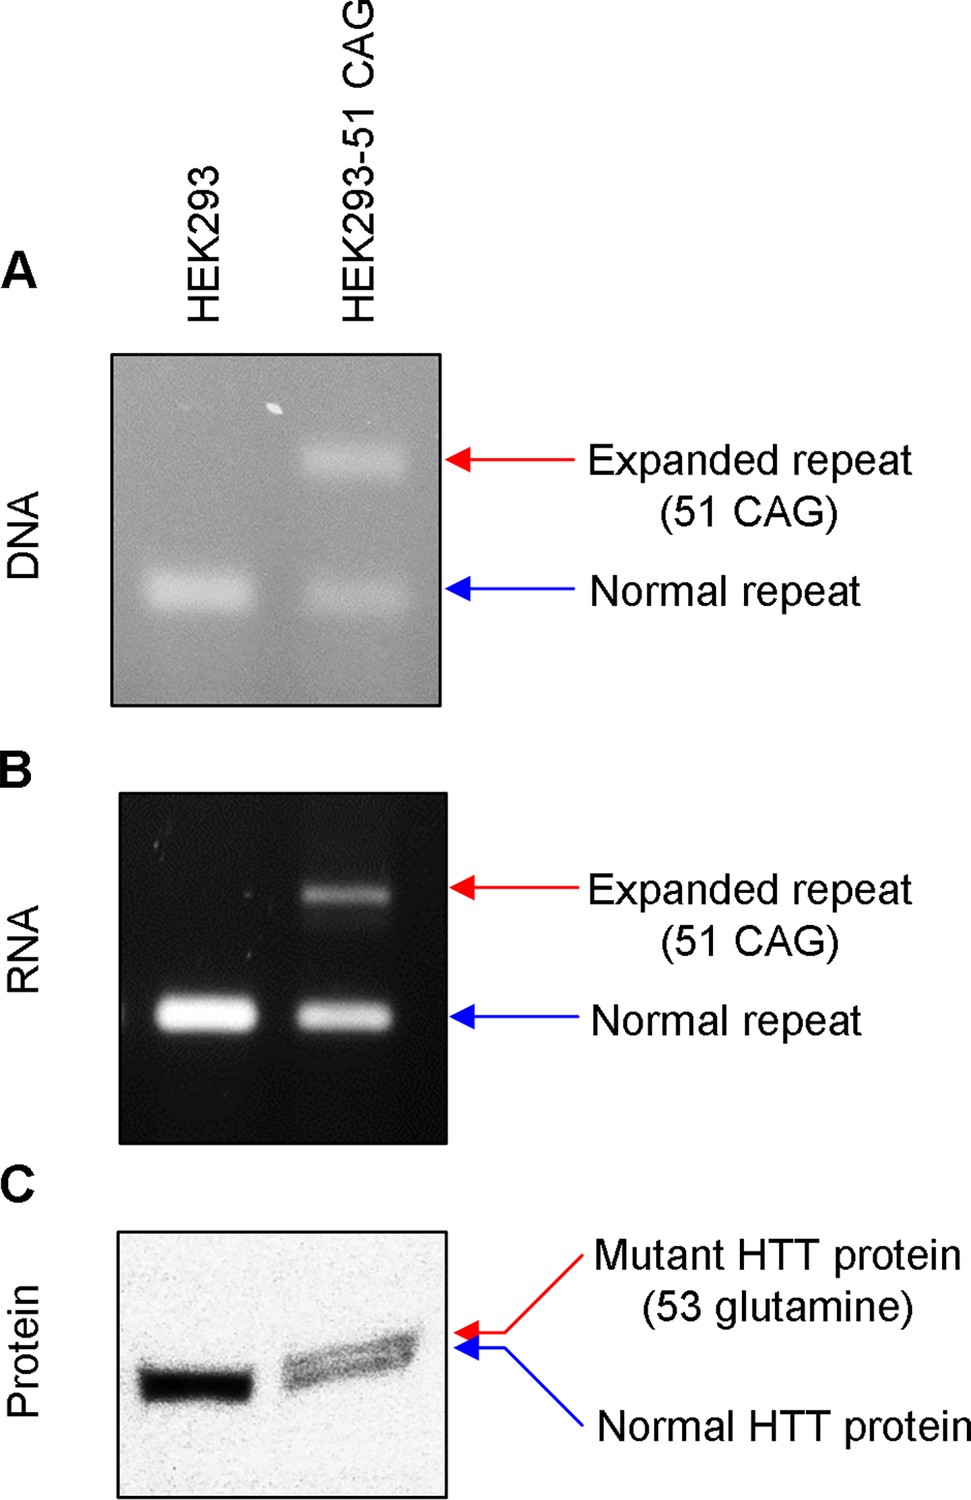
Validation of HEK293-51 CAG cells.
The HEK293-51 CAG cell line was generated by knocking in a 51 CAG canonical repeat using CRISPR-Cas9. To validate the correct replacement of repeats, we analyzed DNA, RNA, and protein samples. (A) HTT CAG repeat region was amplified to detect the presence of the expanded CAG repeat in the DNA. (B) Similarly, RNA samples were amplified focusing on the CAG repeat region to determine whether HEK293-51 CAG cells express HTT mRNA harboring an expanded repeat. (C) Immunoblot analysis was performed to confirm the expression of mutant HTT protein. Note, the separation between mutant and normal HTT protein was marginal because the size difference between the two is relatively very small (C). HEK293 and HEK293-51 CAG represent original carrying 16/17 CAG canonical repeats and HEK293 cells carrying 17/51 CAG canonical repeats, respectively.
-
Figure 5—figure supplement 1—source data 1
Unedited original images of Figure 5—figure supplement 1.
- https://cdn.elifesciences.org/articles/89782/elife-89782-fig5-figsupp1-data1-v2.zip
-
Figure 5—figure supplement 1—source data 2
Uncropped images with labels of Figure 5—figure supplement 1.
- https://cdn.elifesciences.org/articles/89782/elife-89782-fig5-figsupp1-data2-v2.zip
Figure 6 with 1 supplement
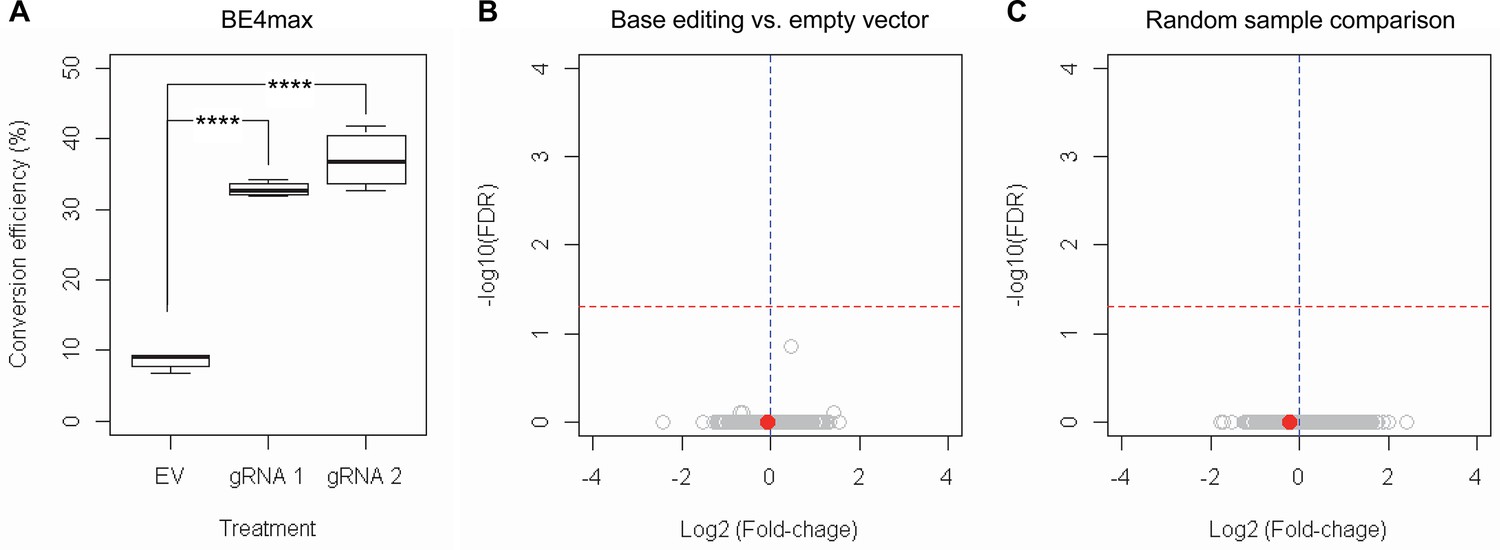
RNAseq analysis of base editing (BE) strategies confirms the lack of transcriptome alternation.
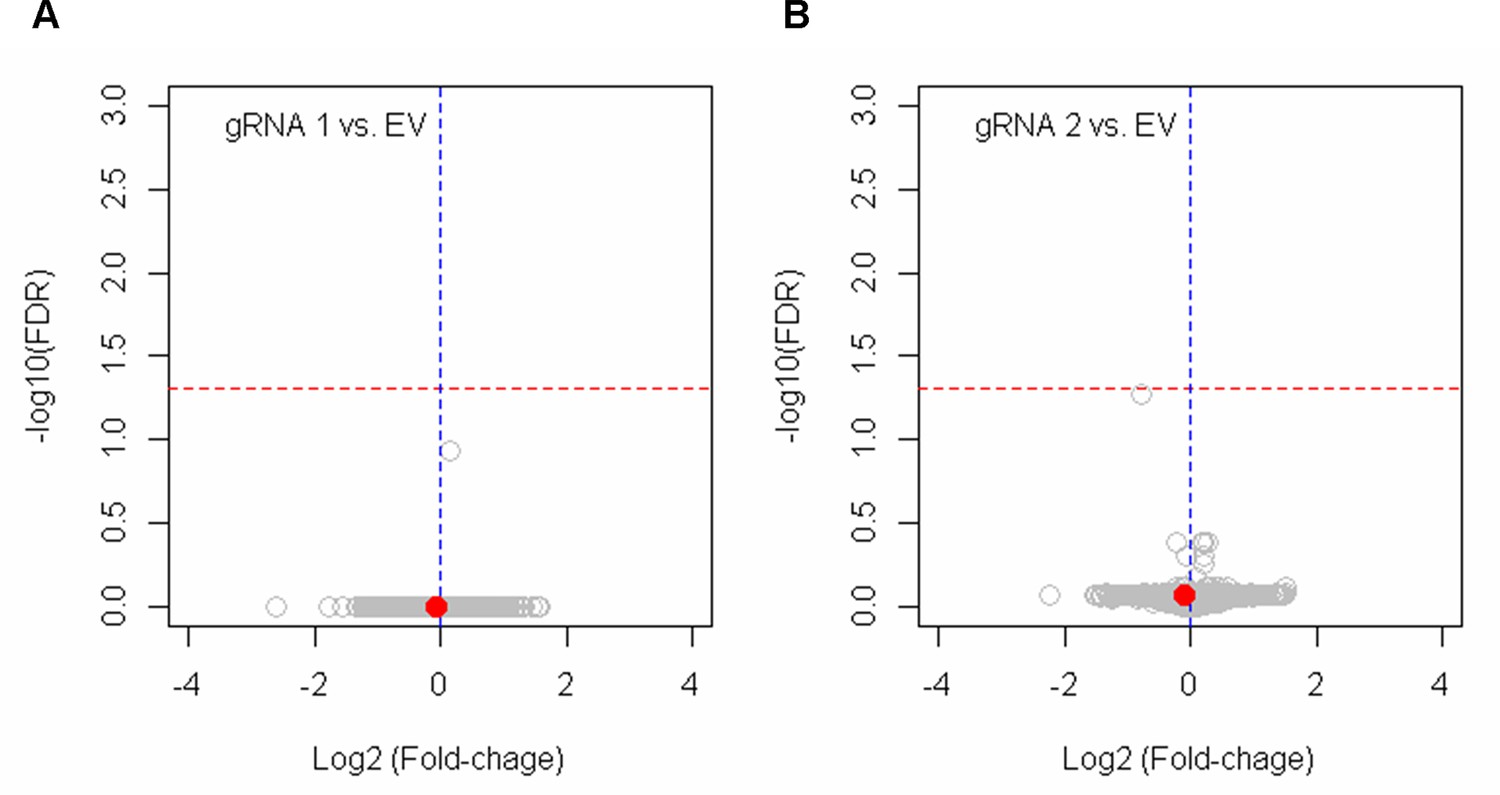
(A) HEK293 cells were treated with empty vector (EV) or candidate BE strategies such as BE4max-gRNA 1 (gRNA 1) and BE4max-gRNA 2 (gRNA 2) for RNAseq analysis. MiSeq analysis was also performed to judge the levels of CAG-to-CAA conversion. ****, p-value<0.0001 by Student’s t-test (n=4). (B) Confirming the lack of significantly altered genes in BE4max-gRNA 1 or BE4max-gRNA 2, we compared all BE-treated samples (n=8) with all EV-treated samples (n=4) to increase the power in the RNAseq differential gene expression analysis. Each circle in the volcano plot represents a gene analyzed in the RNAseq; HTT is indicated by a filled red circle. A red horizontal line represents false discovery rate of 0.05, showing that none was significantly altered by candidate BE strategies. (C) We also compared two groups of randomly assigned samples (six samples vs. six samples) to understand the shape of the volcano plot when there were no significant genes.
Figure 6—figure supplement 1
The lack of significant alterations in gene expression by BE4max-gRNA 1 and BE4max-gRNA 2.
HEK293 cells were treated with empty vector (EV), or candidate base editing (BE) strategies such as BE4max-gRNA 1 (A) and BE4max-gRNA 2 (B). Subsequently, DNA samples and RNA samples were collected for MiSeq analysis and RNAseq analysis to evaluate the levels of on-target conversion and changes in transcriptome (n=4), respectively. The most significant gene in cells treated with BE4max-gRNA 2 (panel B) was HSD3B1, which was not significant by false discovery rate of 0.05 (red lines).
Figure 7
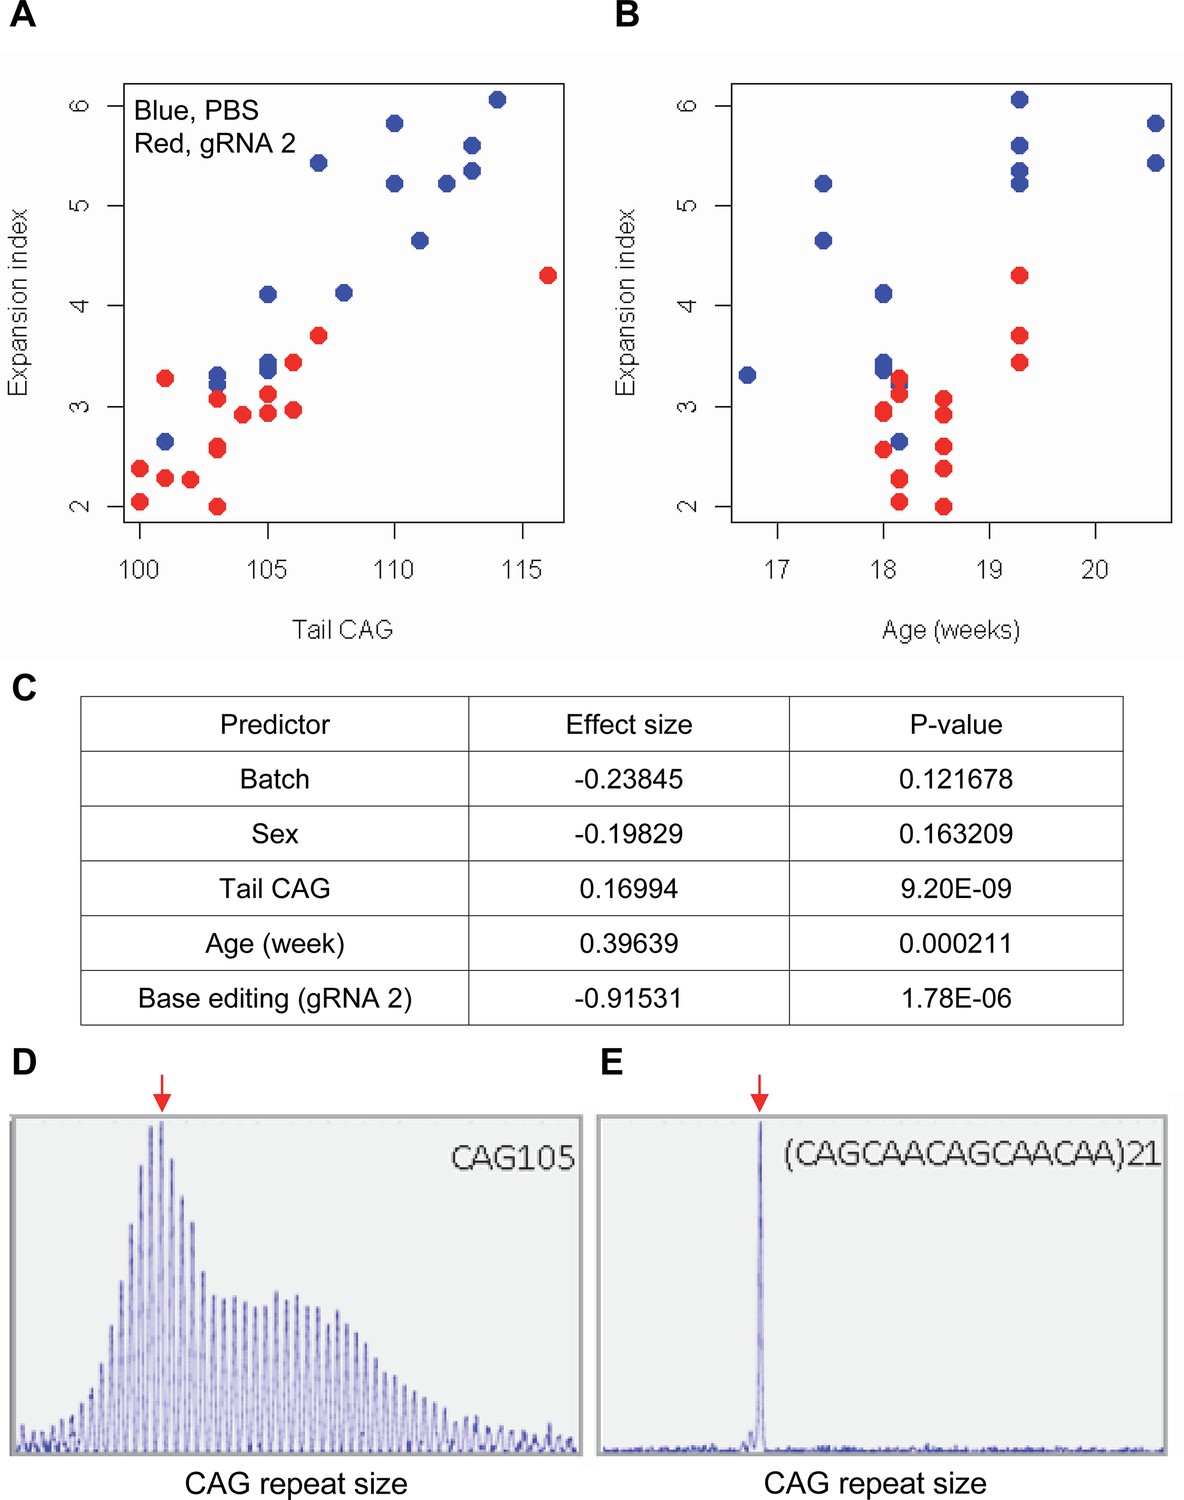
Impacts of CAA interruption on CAG repeat instability.
(A–C) DNA samples (liver and tail) of base editing (BE)-treated (guide RNA [gRNA] 2, red; n=16) or PBS-treated (PBS, blue; n=15) were analyzed to quantify somatic repeat expansion. We performed linear regression analysis to model the levels of repeat expansion as a function of treatment, CAG repeat in tail (A), age (B), and with other covariates (i.e. experimental batch, sex, tail CAG, and age). Summary of the statistical analysis is summarized in the panel C. (D and E) To determine the maximal impacts of CAA interruption on the repeat expansion, Huntington’s disease (HD) knock-in mice carrying CAA-interrupted repeats were analyzed. Liver samples of 105 uninterrupted CAG repeat (D) and interrupted repeat (E) were analyzed at 5 months. Representative fragment analysis is displayed. Red arrows indicate the modal alleles representing inherited CAG repeats; peaks at the right side of the modal peaks (red arrows) represent expanded repeats.
Additional files
-
Supplementary file 1
Sequences, expected hybridization sites, and protospacer-adjacent motifs (PAMs) of guide RNAs (gRNAs) used in this study.
For each gRNA, sequence, length, hybridization site, and PAM sequence are summarized.
- https://cdn.elifesciences.org/articles/89782/elife-89782-supp1-v2.xls
-
Supplementary file 2
Types of base conversion by base editing (BE) strategies.
HEK293 cells were treated with different combinations of base editors and guide RNAs (gRNAs). Subsequently, genomic DNA samples were analyzed by MiSeq platform to determine sequence changes produced by BE strategies. Base editor-none and gRNA-none represents HEK293 cells without any treatment (n=8). Empty vector represents HEK293 cells treated with plasmids for a base editor and empty vector for gRNA. Data represent means of three independent experiments.
- https://cdn.elifesciences.org/articles/89782/elife-89782-supp2-v2.xls
-
Supplementary file 3
Sites of CAG-to-CAA conversion in HEK293 cells.
HEK293 cells treated with combinations of base editors and guide RNAs (gRNAs) were analyzed by MiSeq. Each sequence read with 16 or 17 CAG repeats were further analyzed to find out sites of conversion. Each data value means the percentage of alleles containing the CAA at a given site relative to all alleles. Base editor-none and gRNA-none represents HEK293 cells without any treatment (n=8). Empty vector represents HEK293 cells treated with a base editor and empty vector for gRNA. Data represent means of three independent experiments.
- https://cdn.elifesciences.org/articles/89782/elife-89782-supp3-v2.xls
-
Supplementary file 4
The levels of multiple CAG-to-CAA conversion.
HEK293 cells were treated with base editors and guide RNA (gRNA) and subsequently analyzed by MiSeq. Each sequence reads of 16 or 17 repeat alleles were analyzed to count the number of CAG-to-CAA conversion in a given repeat. Each data value means the percentage of alleles containing the given number of conversions relative to all alleles. Base editor-none and gRNA-none represents HEK293 cells without any treatment (n=8). Empty vector represents HEK293 cells treated with plasmid for a base editor and empty vector for gRNA. Data represent means of three independent experiments.
- https://cdn.elifesciences.org/articles/89782/elife-89782-supp4-v2.xls
-
Supplementary file 5
Off-target prediction.
The number of predicted off-targets are summarized. MM represents mismatch. Numbers in parentheses shows predicted off-targets on the protein-coding genes.
- https://cdn.elifesciences.org/articles/89782/elife-89782-supp5-v2.xls
-
Supplementary file 6
Experimental validation of predicted off-targets.
HEK293 cells that were treated with base editing (BE) strategies 1 or 2. Subsequently, we performed MiSeq analysis focusing on predicted off-targets on protein-coding genes. Locations of off-targets are based on hg19. MM represents the number of mismatches. MiSeq analysis was performed for HTT as on-target. Numbers represent the percentages of sequence reads containing CAG-to-CAA conversion.
- https://cdn.elifesciences.org/articles/89782/elife-89782-supp6-v2.xls
-
Supplementary file 7
Other polyglutamine disease genes.
The names of polyglutamine diseases, respective genes, and RefSeq IDs are shown.
- https://cdn.elifesciences.org/articles/89782/elife-89782-supp7-v2.xls
-
Supplementary file 8
Off-target conversions in other polyglutamine disease genes.
Representative HEK293 cell MiSeq data were analyzed to determine the levels of CAG-to-CAA conversion in other polyglutamine disease genes. Each number represents the percentage of sequence reads that contained CAG-to-CAA conversion relative to all sequence reads.
- https://cdn.elifesciences.org/articles/89782/elife-89782-supp8-v2.xls
-
Supplementary file 9
CAG-to-CAA conversion in Huntington's disease (HD) patient-derived cells.
Cells were transfected with plasmids for BE4max and guide RNAs (gRNAs). Subsequently, genomic DNA samples were subjected to MiSeq analysis. Each number represents the percentage of sequence reads containing CAA at specific site relative to all quality control (QC)-passed sequence reads.
- https://cdn.elifesciences.org/articles/89782/elife-89782-supp9-v2.xls
-
MDAR checklist
- https://cdn.elifesciences.org/articles/89782/elife-89782-mdarchecklist1-v2.docx
Download links
A two-part list of links to download the article, or parts of the article, in various formats.
Downloads (link to download the article as PDF)
Open citations (links to open the citations from this article in various online reference manager services)
Cite this article (links to download the citations from this article in formats compatible with various reference manager tools)
Base editing strategies to convert CAG to CAA diminish the disease-causing mutation in Huntington’s disease
eLife 12:RP89782.
https://doi.org/10.7554/eLife.89782.2


