Diffusive lensing as a mechanism of intracellular transport and compartmentalization
- Department of Biochemistry, Stanford University, United States
- Department of Biological Sciences, Indian Institute of Science Education and Research (IISER) Mohali, India
- Department of Physics, University of California, Santa Barbara, United States
Figures
Figure 1 with 1 supplement
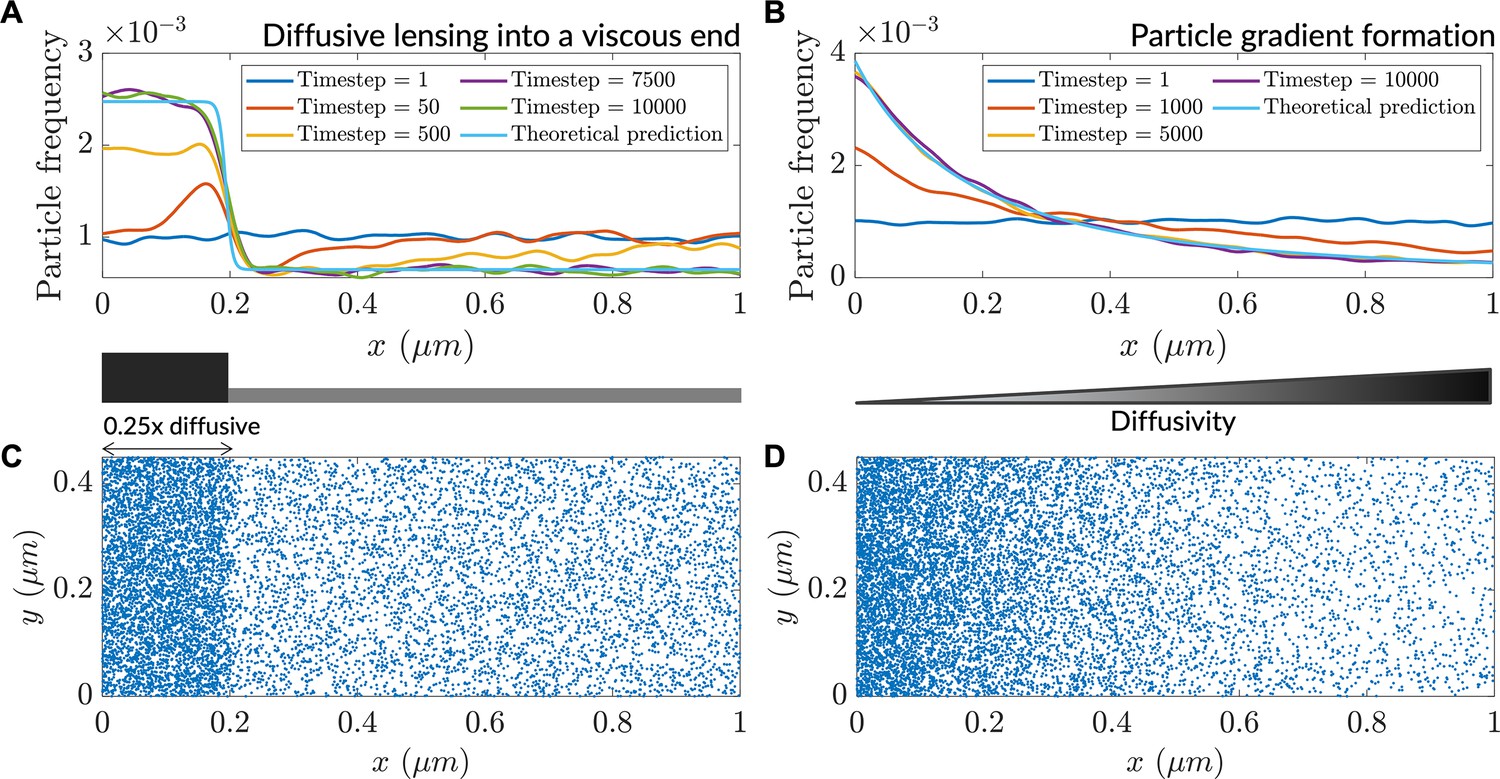
Low diffusivity leads to accumulation of particles.
(A) Particle distribution at various timesteps of a simulation with a step-like lower-diffusivity region. (B) Particle distribution at various timesteps for a simulation with a diffusivity gradient. (C) Steady-state particle distribution for the simulation in (A). (D) Steady-state particle distribution for the simulation in (B).
Figure 1—figure supplement 1
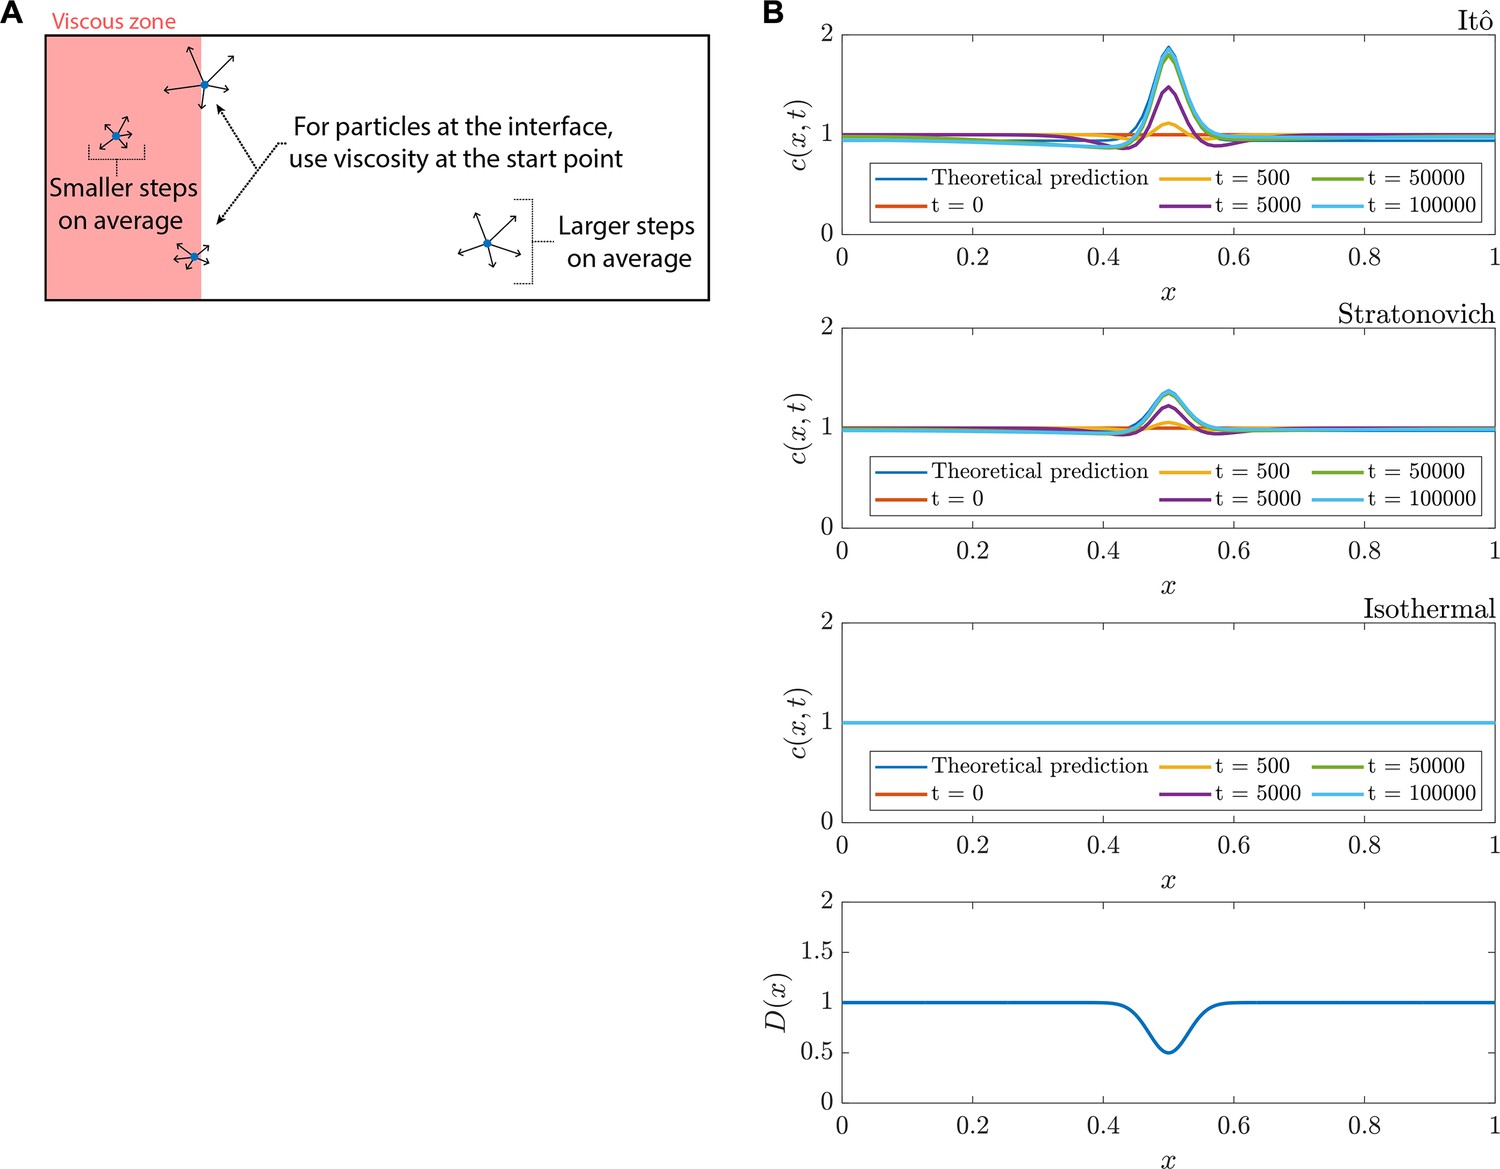
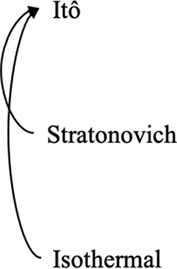
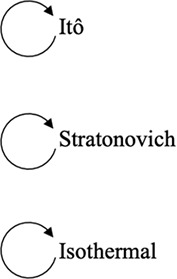
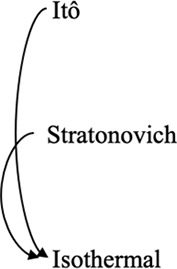
Itô convention leads to Fokker-Planck diffusion, contrasting canonical (‘Fickian’) homogenization.
(A) Agent-based modeling of particle dynamics was used in this study. Choosing the diffusivity at the start point of a particle hop is in line with the Itô interpretation. (B) Numerical solutions for drift-less Fokker-Planck equations with an inhomogeneous diffusion coefficient, for the Itô, Stratonovich, and isothermal conventions.
Figure 2 with 1 supplement
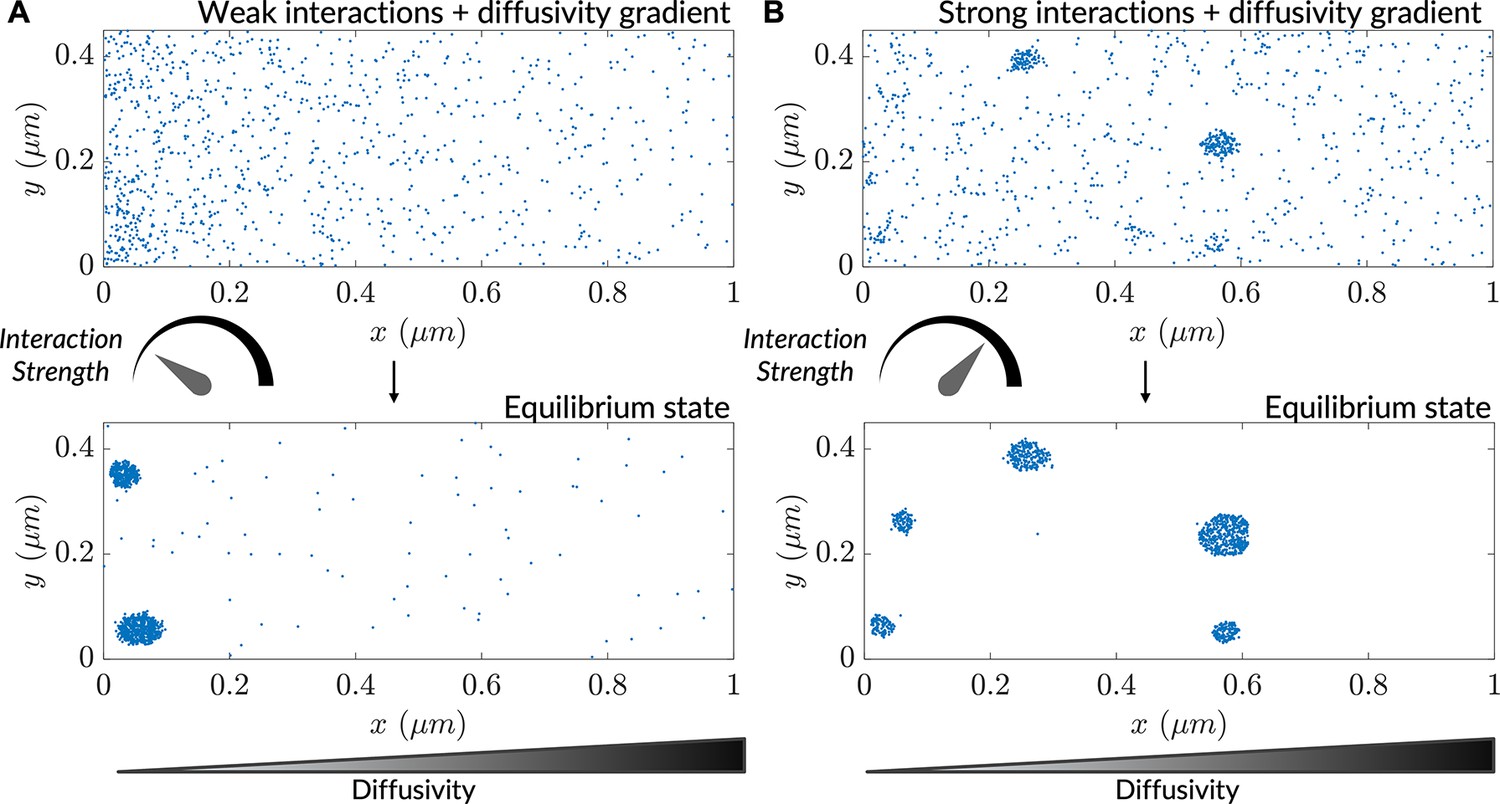
Interaction-driven clustering is modulated by heterogenous diffusivity.
(A) Progress of a simulation comprising particles possessing weak interactions ( is the interaction strength; see Methods), initialized with a uniform concentration of particles. (B) Progress of a simulation comprising particles possessing strong interactions (), initialized with a uniform concentration of particles.
Figure 2—figure supplement 1
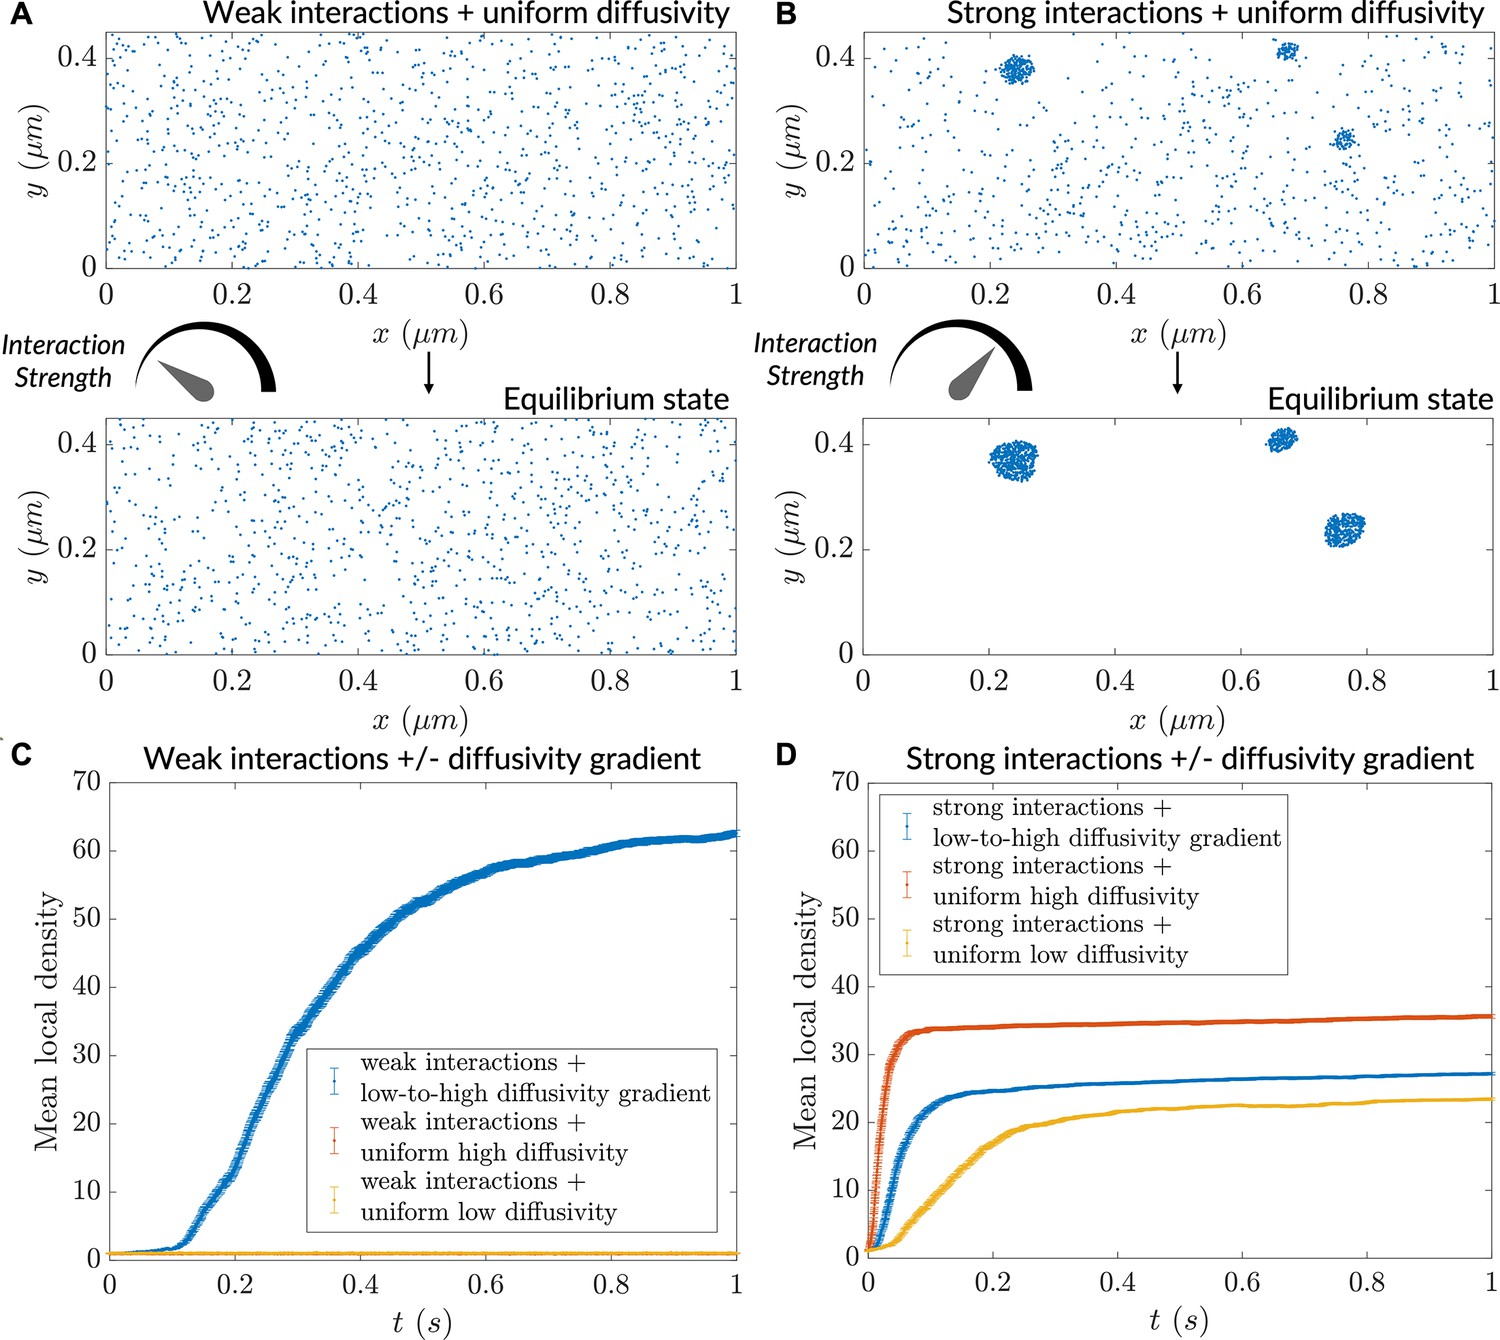
Particle clustering at different strengths in homogeneous versus heterogeneous diffusivity environments.
(A) Progress of a simulation comprising particles possessing weak interactions (), initialized with a uniform concentration of particles; no diffusivity gradient used here. (B) Progress of a simulation comprising particles possessing weak interactions (), initialized with a uniform concentration of particles; no diffusivity gradient used here. (C) Mean local density versus time for particles possessing weak interaction strength. (D) Mean local density versus time for particles possessing strong interaction strength. For (C) and (D), n=1000 particles for mean local density calculation (error bars denote SEM).
Figure 3 with 1 supplement
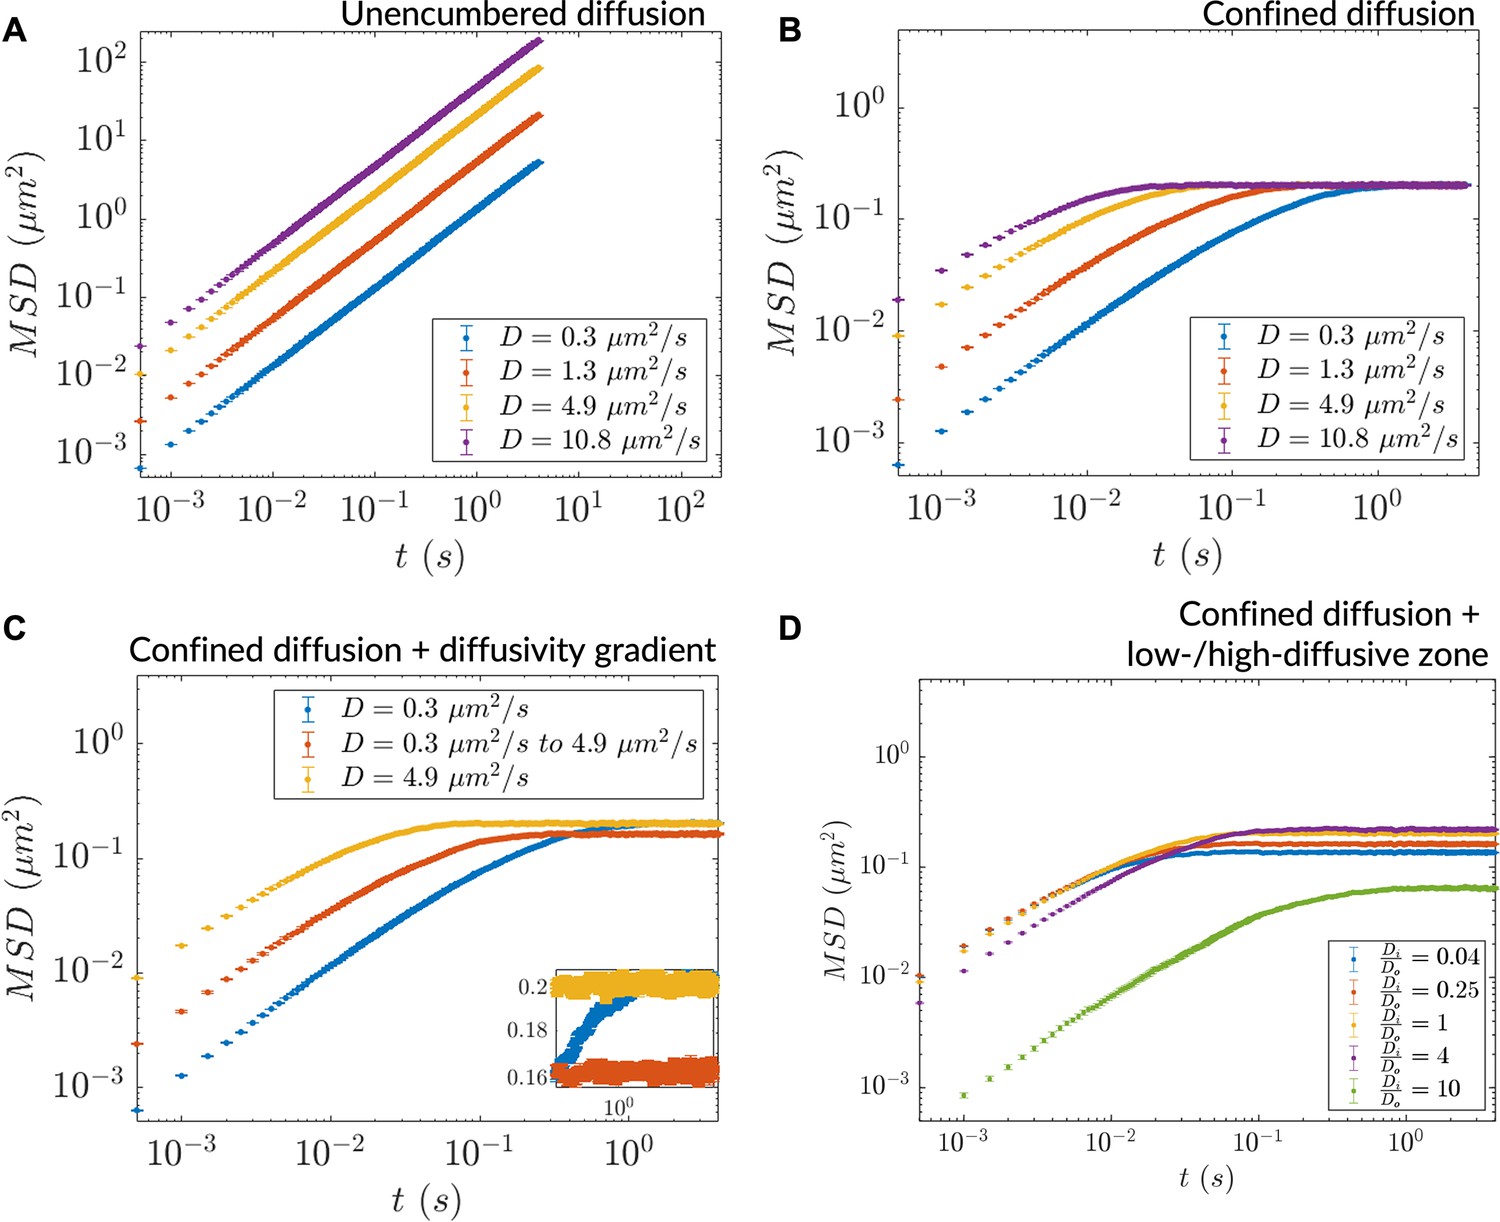
Heterogeneous diffusion alters bulk particle motion as measured by in silico microrheology.
(A) mean squared displacement (MSD) versus time for homogeneous diffusion of 10,000 particles in a 5 mm × 5 mm simulation region. (B) Same as (A) for homogeneous diffusion in a more tightly bounded simulation region (1 μm × 0.45 μm). (C) MSD versus time for inhomogeneous diffusion in a diffusivity gradient versus homogeneous diffusion in the extreme diffusivity cases (simulation region size: 1 μm × 0.45 μm). Inset: zoomed region showing differential saturation of the MSD. (D) MSD versus time for inhomogeneous diffusion due to a stepwise diffusivity distribution with diffusivity ratio relative to the bulk (simulation region size: 1 μm × 0.45 μm). In all cases, n=10,000 particles for MSD calculation (error bars denote SEM).
Figure 3—figure supplement 1
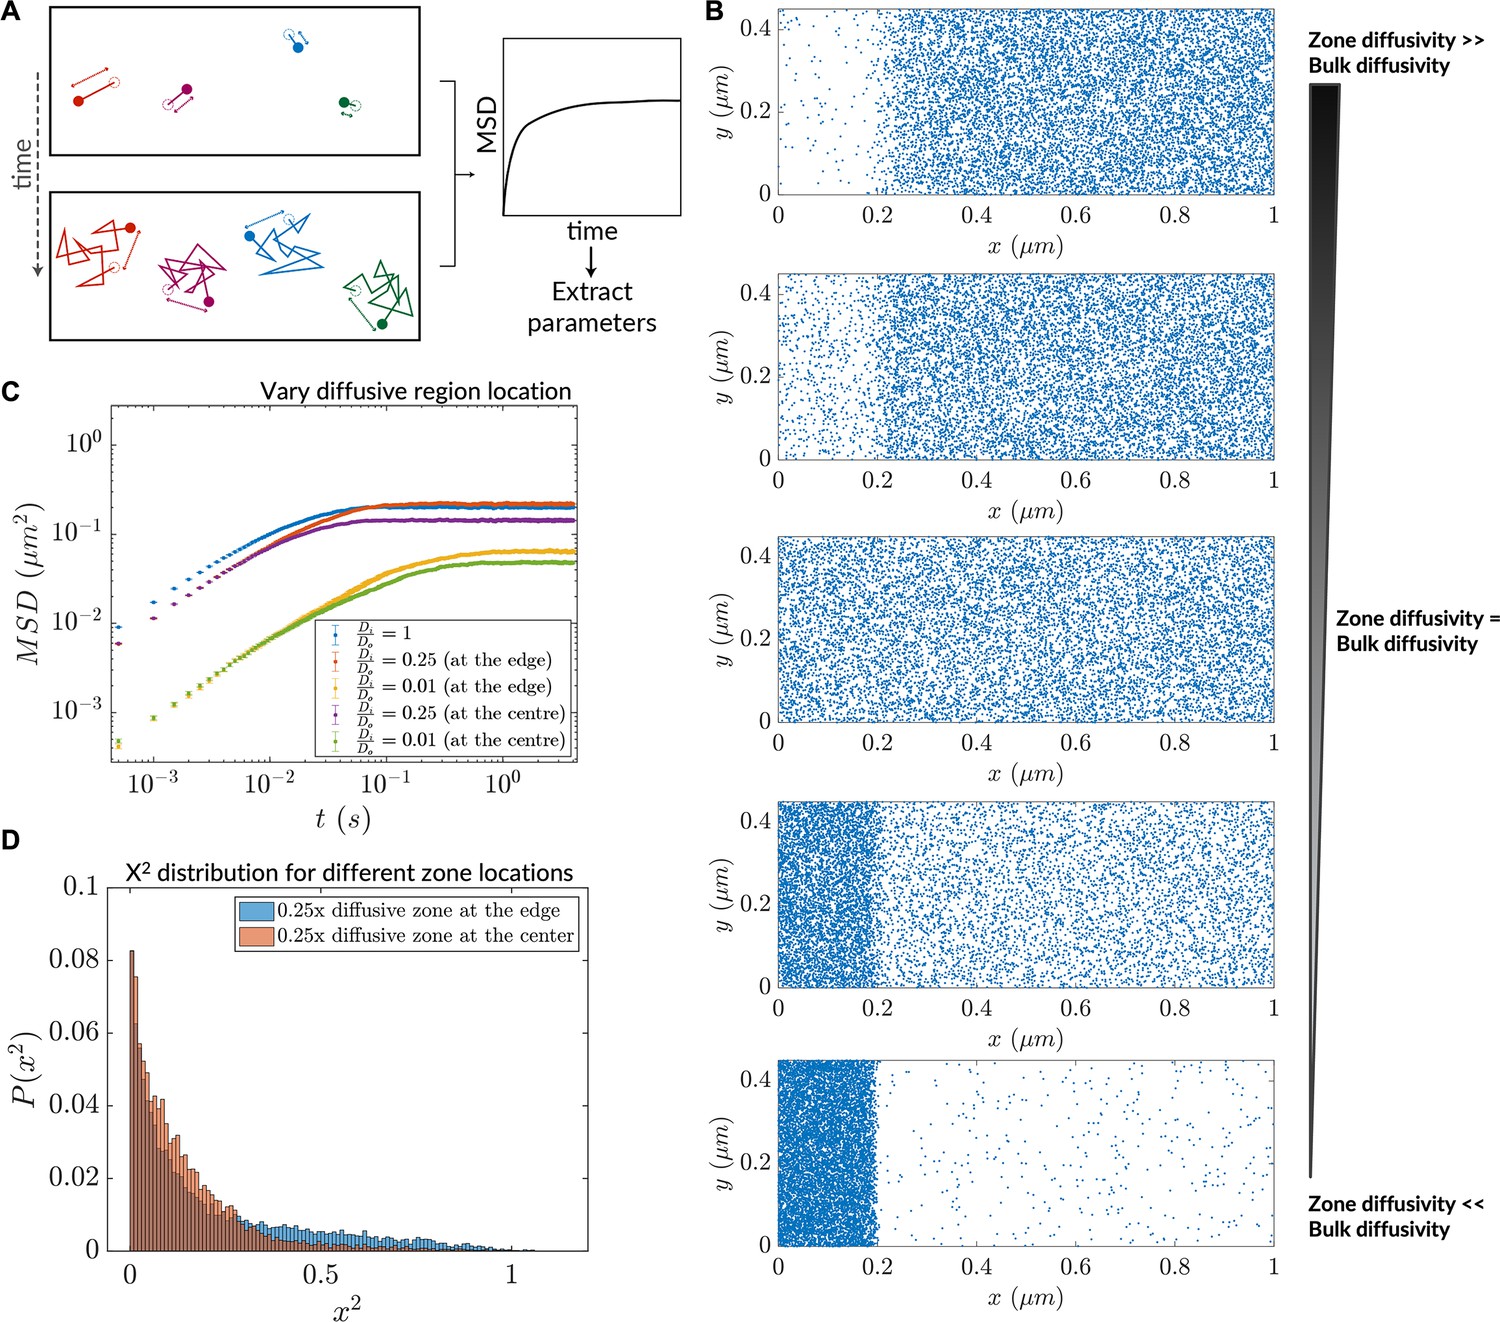
Magnitude and distribution of inhomogeneity in diffusivity affects diffusive lensing.
(A) Analysis of simulation trajectories via in silico microrheology. (B) Increasing diffusiophoretic extent due to variation of the zone diffusivity in a chamber comprising a low-diffusive end. (C) Mean squared displacement after transition to normal diffusion (saturation mean squared displacement, MSD) depends both on the magnitude of diffusivity difference and the location of the zone itself. n=10,000 particles for MSD calculation (error bars denote SEM). (D) Histogram of at the end of the run for the cases of the 0.25 x low-diffusive zone located at the simulation region edge versus the center.
Figure 4 with 1 supplement
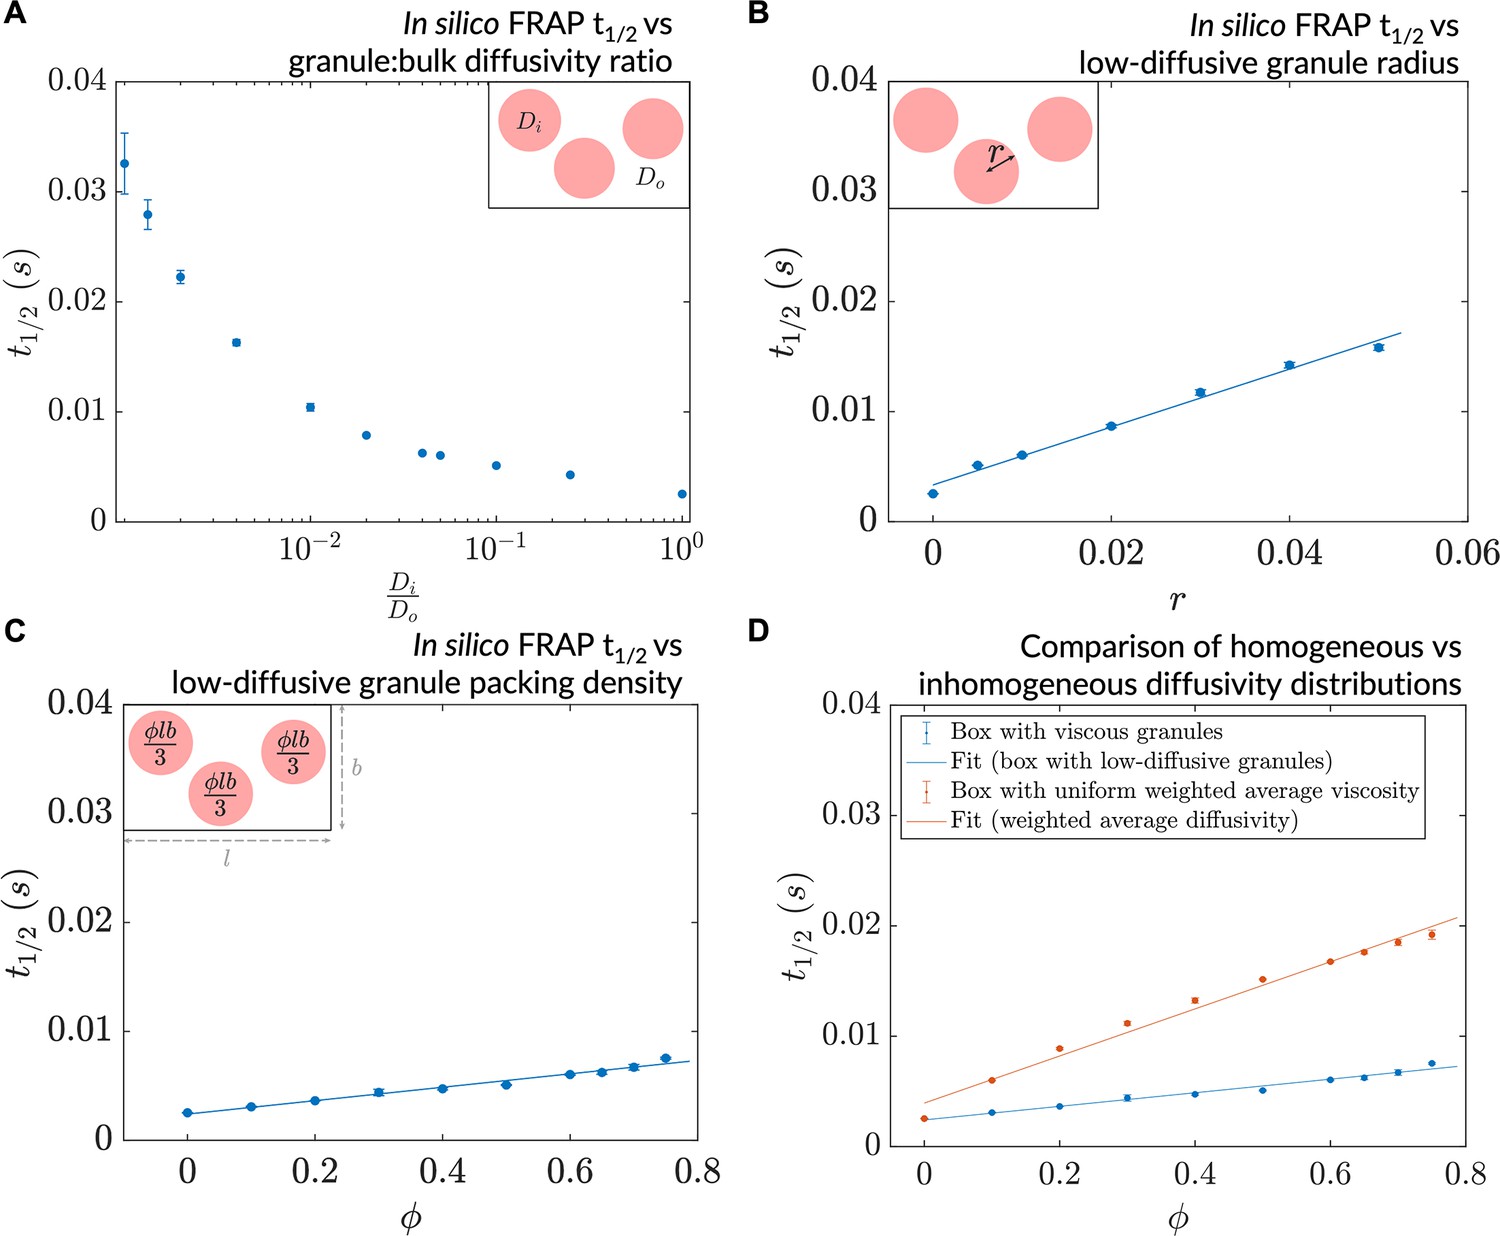
A decrease in granule diffusivity, an increase in granule radius, or packing density slows down mesoscale dynamics.
(A) Simulated fluorescence recovery after photobleaching (FRAP) t1/2 as a function of granule:bulk diffusivity ratio (, ). (B) Simulated FRAP as a function of granule radius (, ). (C) Simulated FRAP t1/2 as a function of granule packing density (, ). (D) Simulated FRAP for homogeneous and inhomogeneous diffusivity setups realizing the same effective diffusivities (, ). In all cases, n=3 ROIs were chosen for the simulated photobleaching (error bars denote SEM).
Figure 4—figure supplement 1
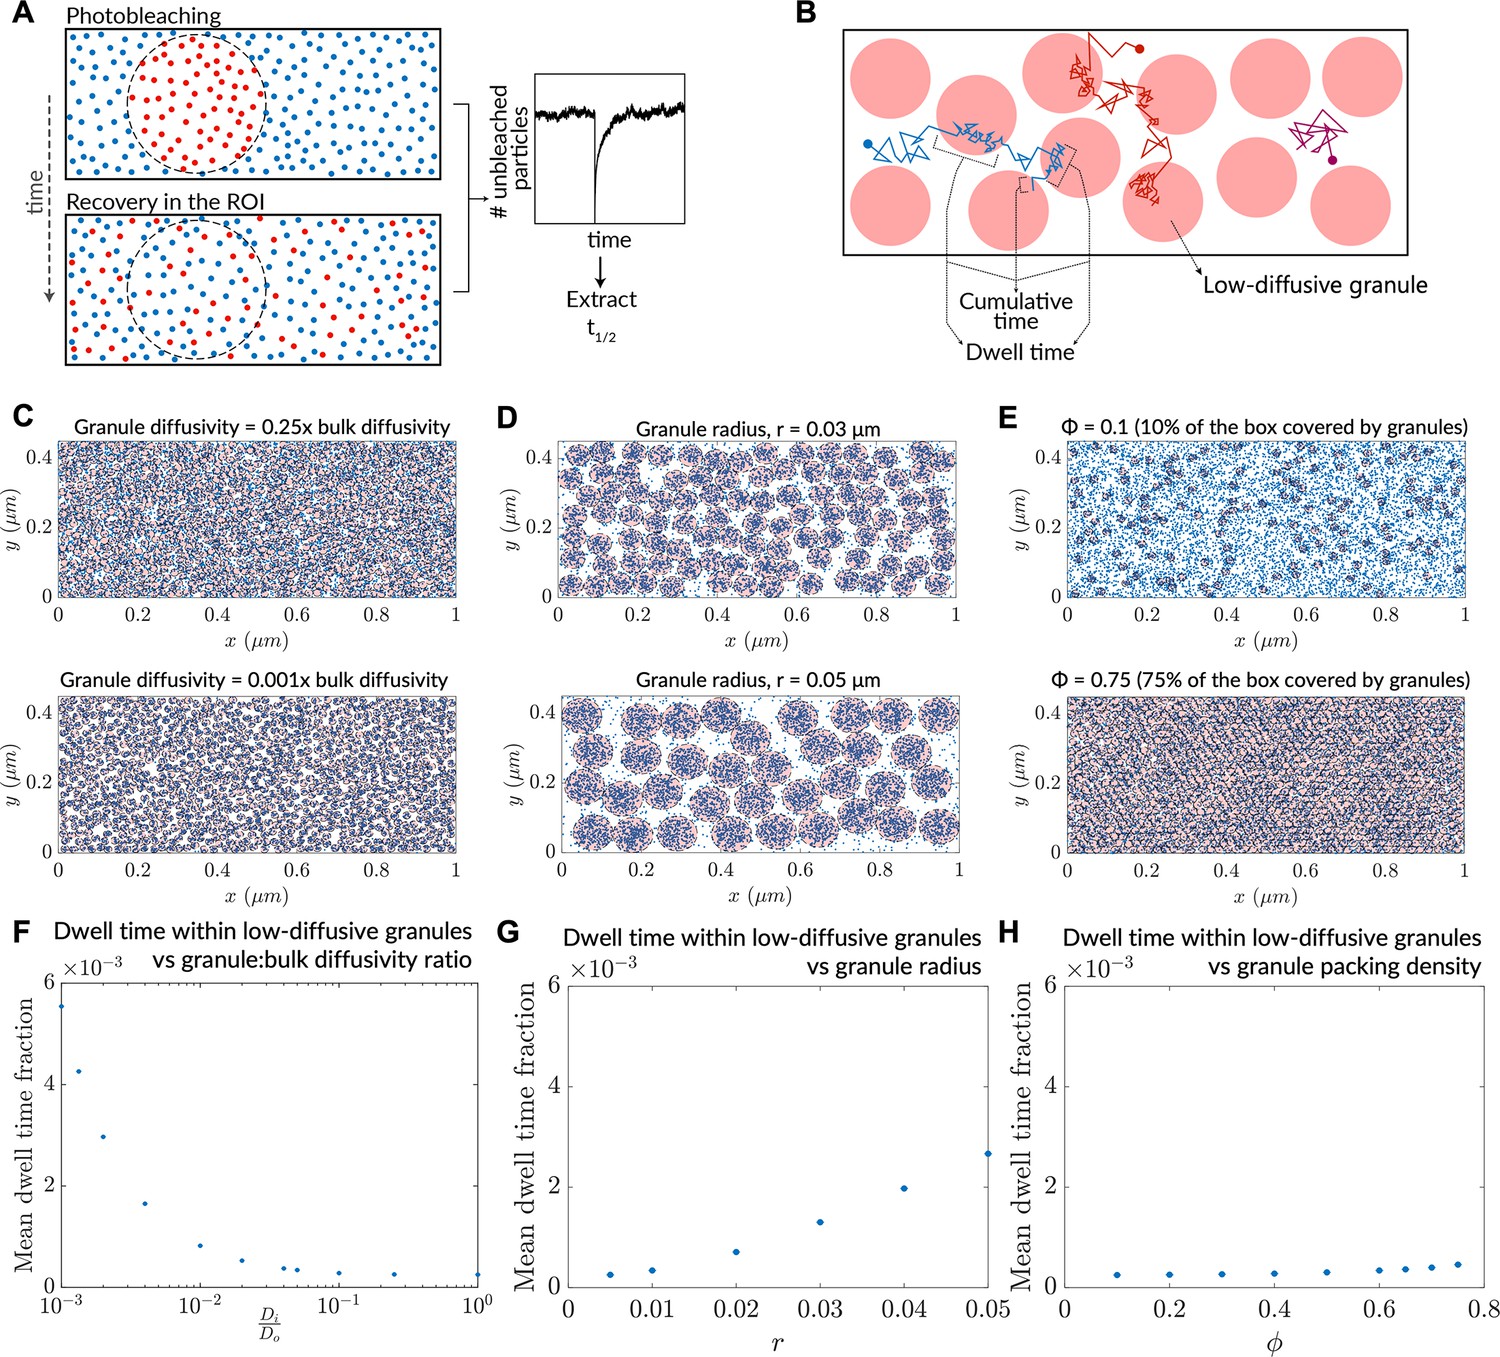
Dwell times for particles in low-diffusive granules dictate fluorescence recovery after photobleaching (FRAP) kinetics.
(A) The in silico implementation of FRAP was used in this study. (B) Methodology for determining mean dwell time of particles in low-diffusive granules, from a set of simulation trajectories. (C) Steady-states of systems in the variation of granule diffusivity, before commencing in silico FRAP. (D) Steady-states of systems in the variation of granule radius, before commencing in silico FRAP. (E) Steady-states of systems in the variation of granule packing density, before commencing in silico FRAP. (F) Mean dwell time fraction variation as a function of granule:bulk diffusivity. (G) Mean dwell time fraction variation as a function of granule radius. (H) Mean dwell time fraction variation as a function of granule packing density. For (F)-(H), n=10,000 particles used for calculation (error bars denote SEM).
Tables
Appendix 1—table 1
Converting between stochastic integration conventions.
 |  |  |
| Active noise/memory effects/other sources of nonequilibrium behaviors | Nonequilibrium in case of Itô and Stratonovich, equilibrium in case of isothermal | Consistent with equilibrium; thermal noise dominates |
| Diffusive lensing occurs | Diffusive lensing is seen in the Itô and Stratonovich cases (Figure 1—figure supplement 1B) | Diffusive lensing does not occur |
Additional files
Download links
A two-part list of links to download the article, or parts of the article, in various formats.
Downloads (link to download the article as PDF)
Open citations (links to open the citations from this article in various online reference manager services)
Cite this article (links to download the citations from this article in formats compatible with various reference manager tools)
Diffusive lensing as a mechanism of intracellular transport and compartmentalization
eLife 12:RP89794.
https://doi.org/10.7554/eLife.89794.3


