An open-source, high-resolution, automated fluorescence microscope
- Institut für Chemie und Biochemie, Freie Universität Berlin, Germany
- Department of Molecular Neurobiology, German Cancer Research Cente, Germany
- Leibniz-IPHT Jena, Germany
Figures
Figure 1
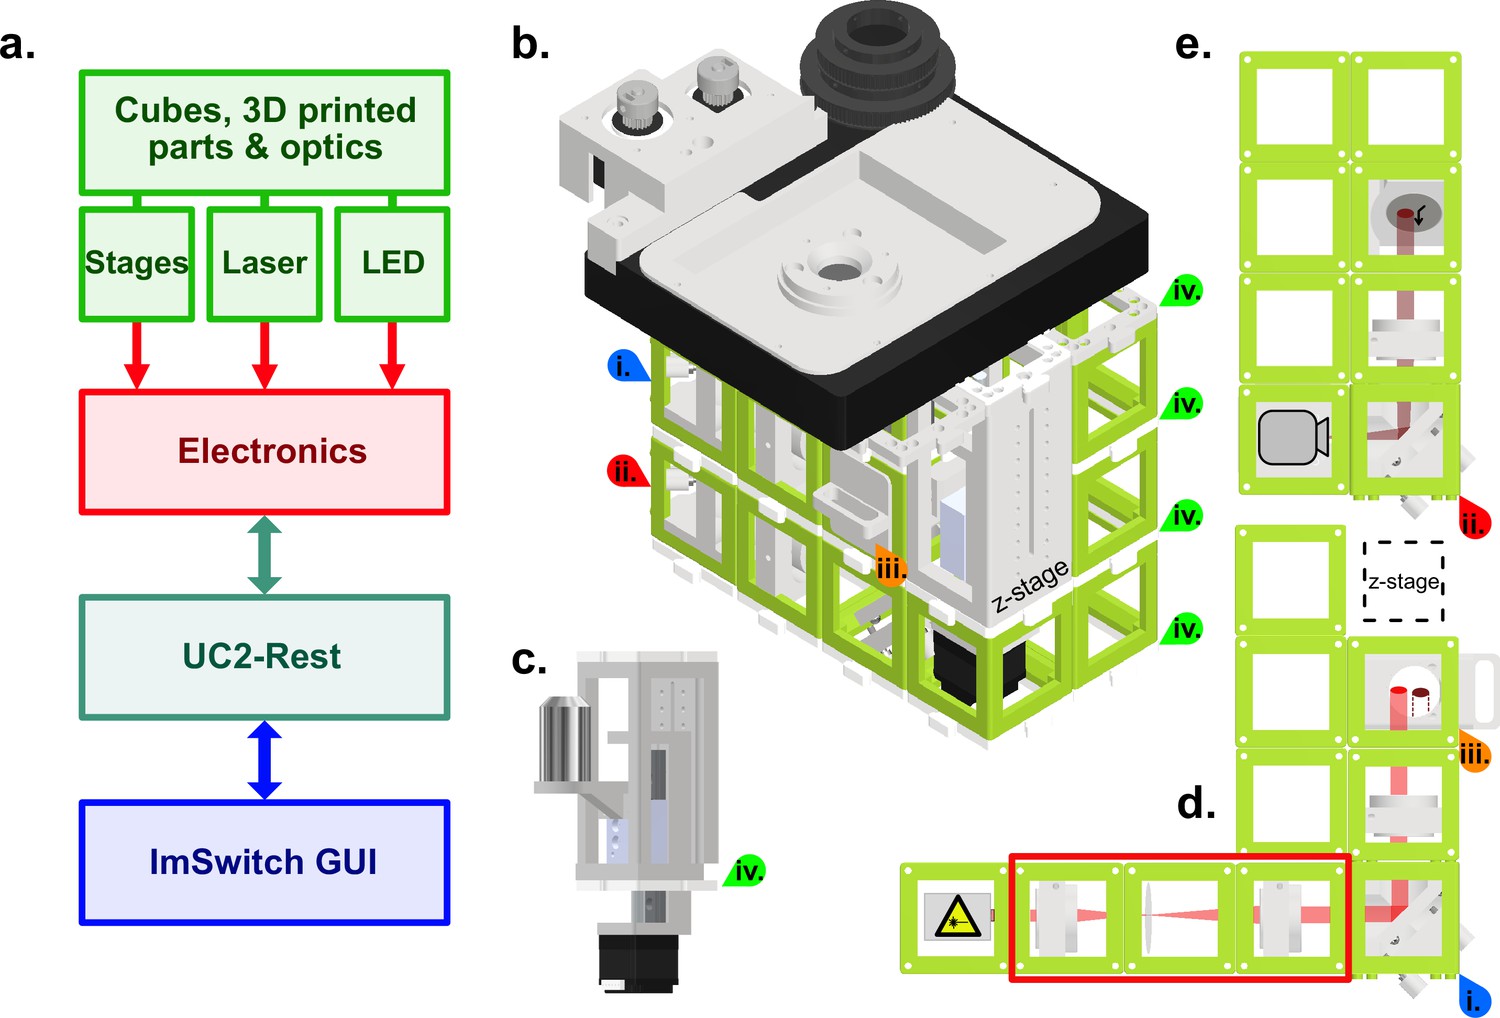
Schematic of the high-resolution-UC2 widefield microscope.
(a) Overview of the different component categories of the microscope, from the hardware, through the electronics controlling, to the software and the ImSwitch-based GUI. (b) Schematic of the complete setup. Red and blue arrows (i and ii) are references to help visualize the 3D structure. Top layer is the commercially bought XY-stage that was motorized for this project. Timing belts convert motor torque (two grey gears top left) into stage motion (bigger black gear middle) but have been omitted in this representation for clarity. Sample holder can be printed according to the sample used, circular in this case. (c) Commercially bought precision Z-stage and high-NA objective (Olympus 60 x/1.49 NA TIRF) (d) Excitation layer. Laser emission (bright red light-path) is focused by a f=100mm lens onto the back focal plane of the objective. Orange arrow (iii) marks the filter cube which has an excitation filter (Chroma ZET635/20 x EX), a dichroic mirror (Chroma ZT640rdc) and on the bottom an emission filter (Chroma ET655lp long-pass for λ>655 nm) to separate excitation from fluorescence. Red rectangle shows a telescope build including a diffusor (rotating piece of cling foil) in the focus point between both lenses. Telescope build magnifies and homogenizes the laser beam and can be used optionally. (e) Detection layer, corresponds to the bottom layer in the setup (red star as reference). Emitted fluorescence (dark red light-path) is depicted with a f=100 mm lens on the detector (Alvium 1800 U-158c CMOS camera from Allied Vision). All active optical elements, for example mirrors and lenses are mounted into the injection moulded cubes (50x50 × 50mm, green) via custom 3D printed mounts. Cubes are connected laterally and vertically via the puzzle shaped connection pieces. Green arrows (iv) indicate the connecting puzzle layers between the cubes.
Figure 2
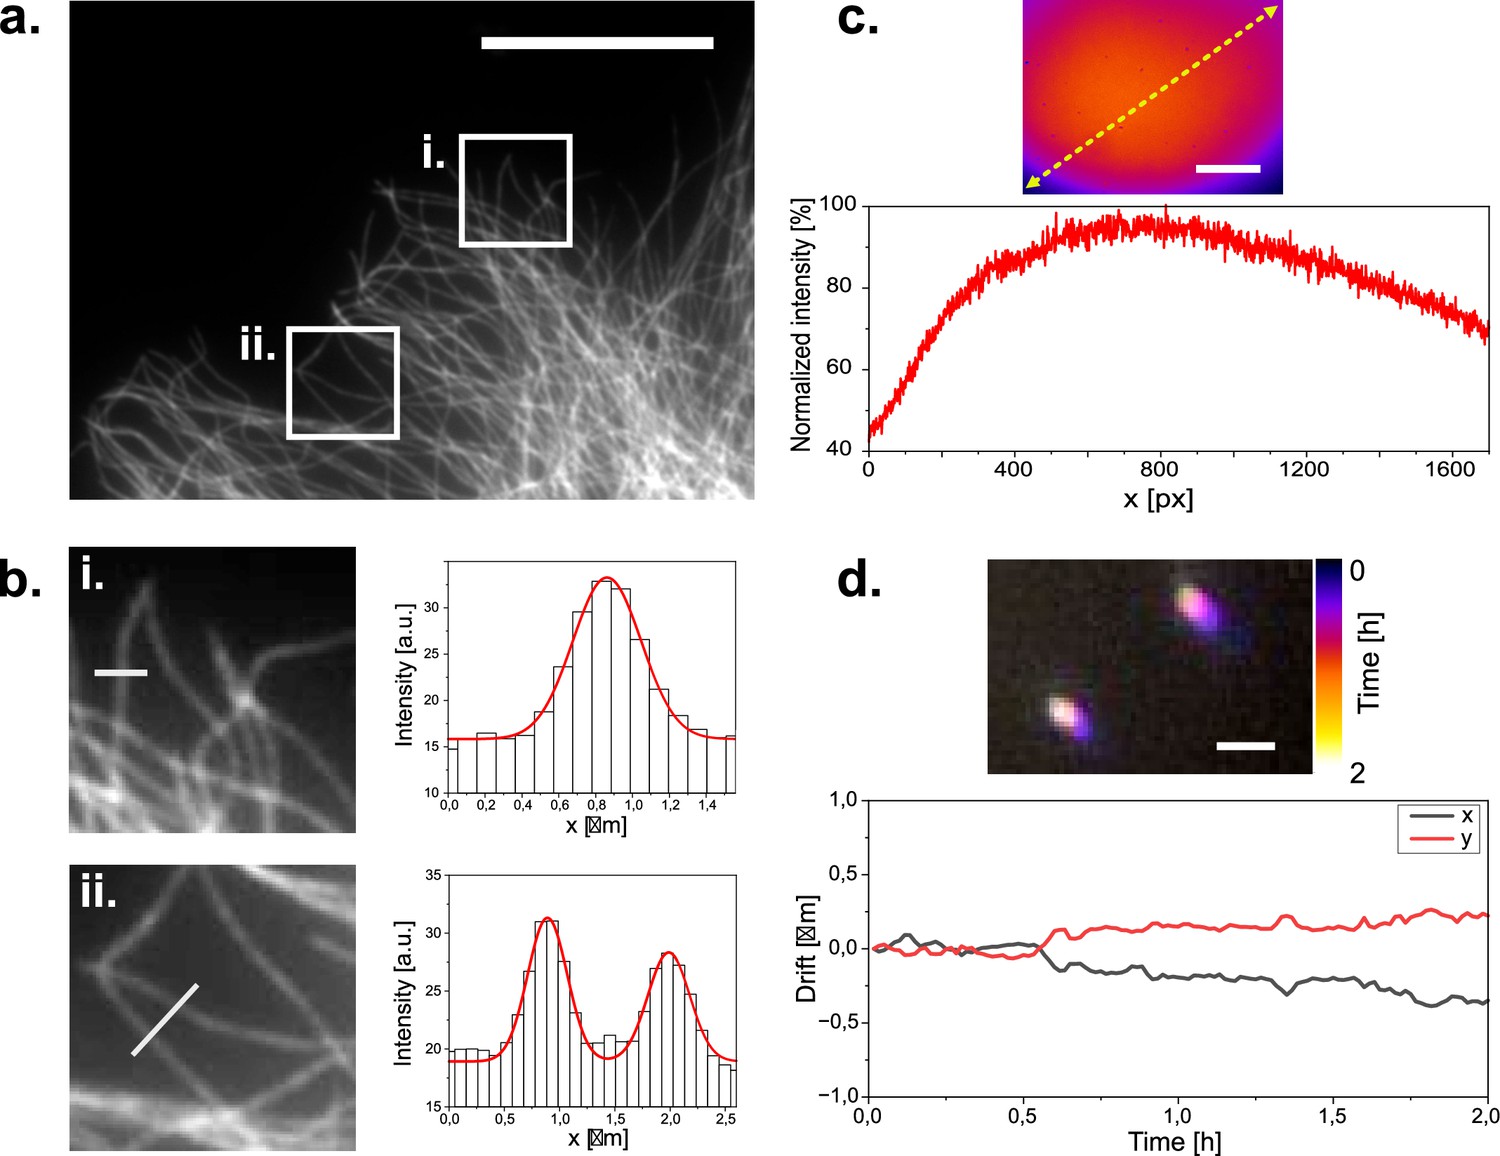
Widefield imaging of immuno-stained CV1 cells against tubulin (α and β-tubulin).
(a) Widefield image of a tubulin stained CV1 cell. Two regions of interest are highlighted. Scale bar represents 20 µm. (b) Zoomed in images of the selected ROIs in (a). with respective microtubule profile plotted across the white line in the ROI images. ROI dimensions are 8x8 µm. Grey values are plotted as columns and fitted with gaussian functions (red line). Microtubule diameter can be estimated to 340–420 nm according to the full width at half maximum of the fits. (c) Illumination profile of whole camera chip (1456x1088 px) at the sample plane as imaged on a far-red fluorescent Chroma slide. Scale bar represents 35 µm. (d) Tetra-speck beads imaged over a period of three hours and color coded over time. Scale bar represents 1 µm. Bead positions are localized over time to measure their displacement to their initial position over time.
Figure 3
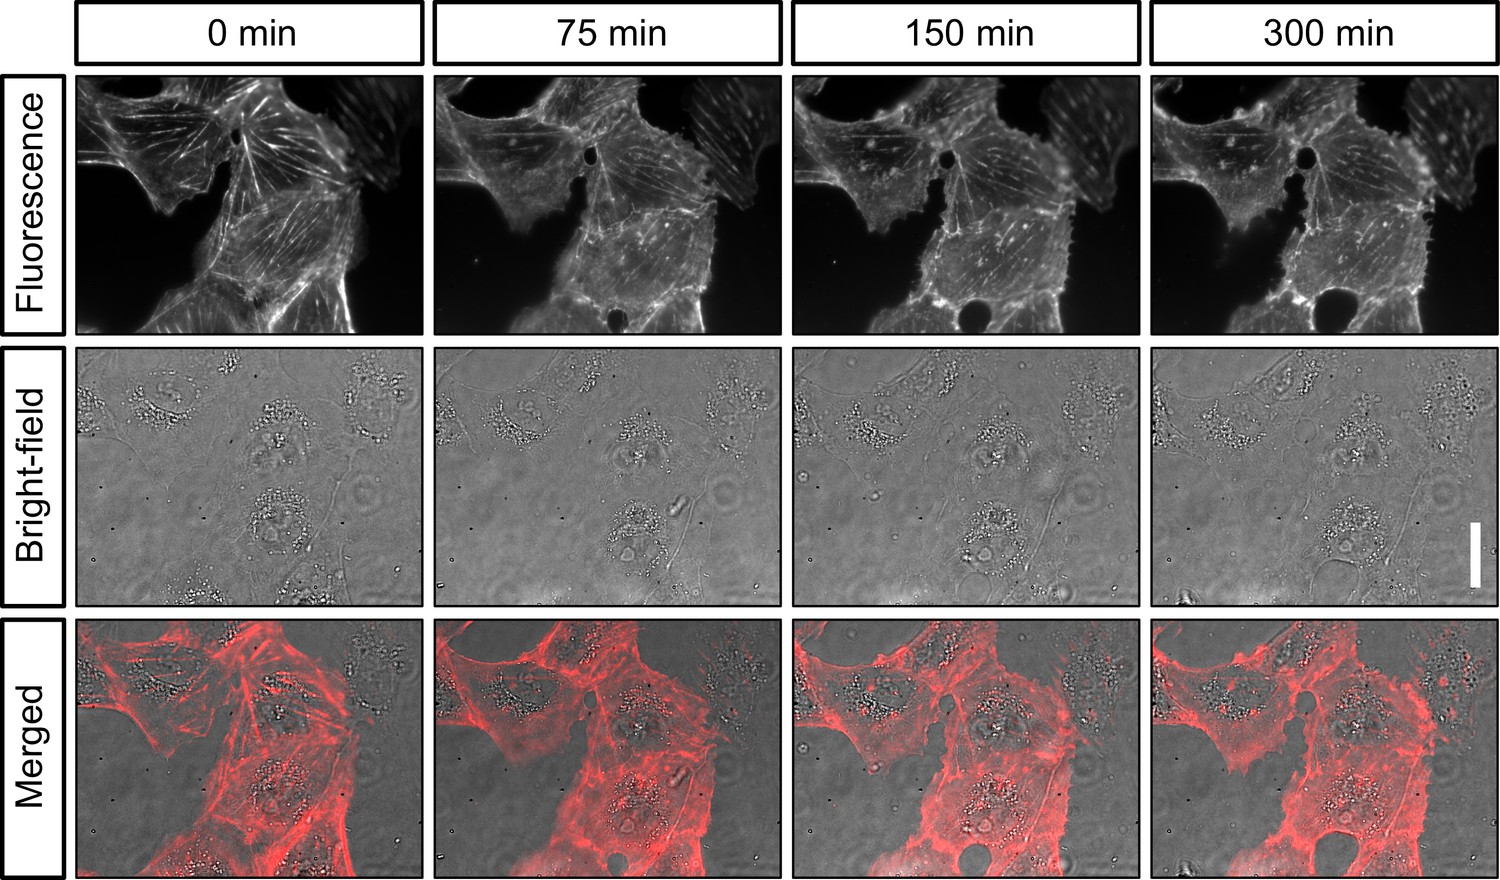
Live-cell imaging of actin in cultured cells.
Shown are still images of the same CV-1 fibroblast cells in SiR-actin fluorescence and widefield (background corrected) at different timepoints over 5 hr. Scalebar on the right represents 30 µm.
Figure 4
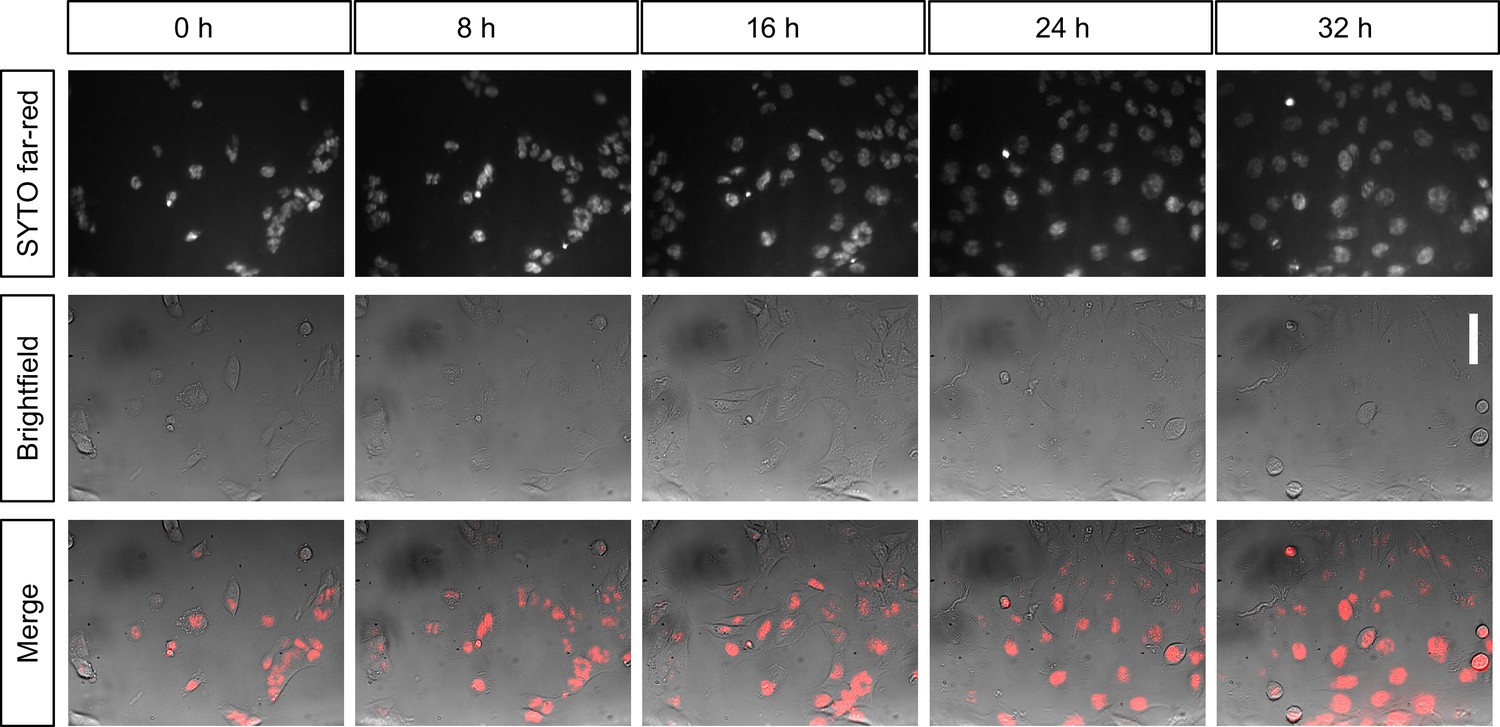
Long-term live-cell imaging of cultured cells inside the incubator.
Shown are still images of the same population of T98G glioblastoma cells over time in the same field of view. Cells are stained with SYTO nucleic-acid fluorescent dye and imaged in widefield (background corrected) every 20 min for over 32 hr inside an incubator. Scalebar on the right represents 30 µm.
Figure 5
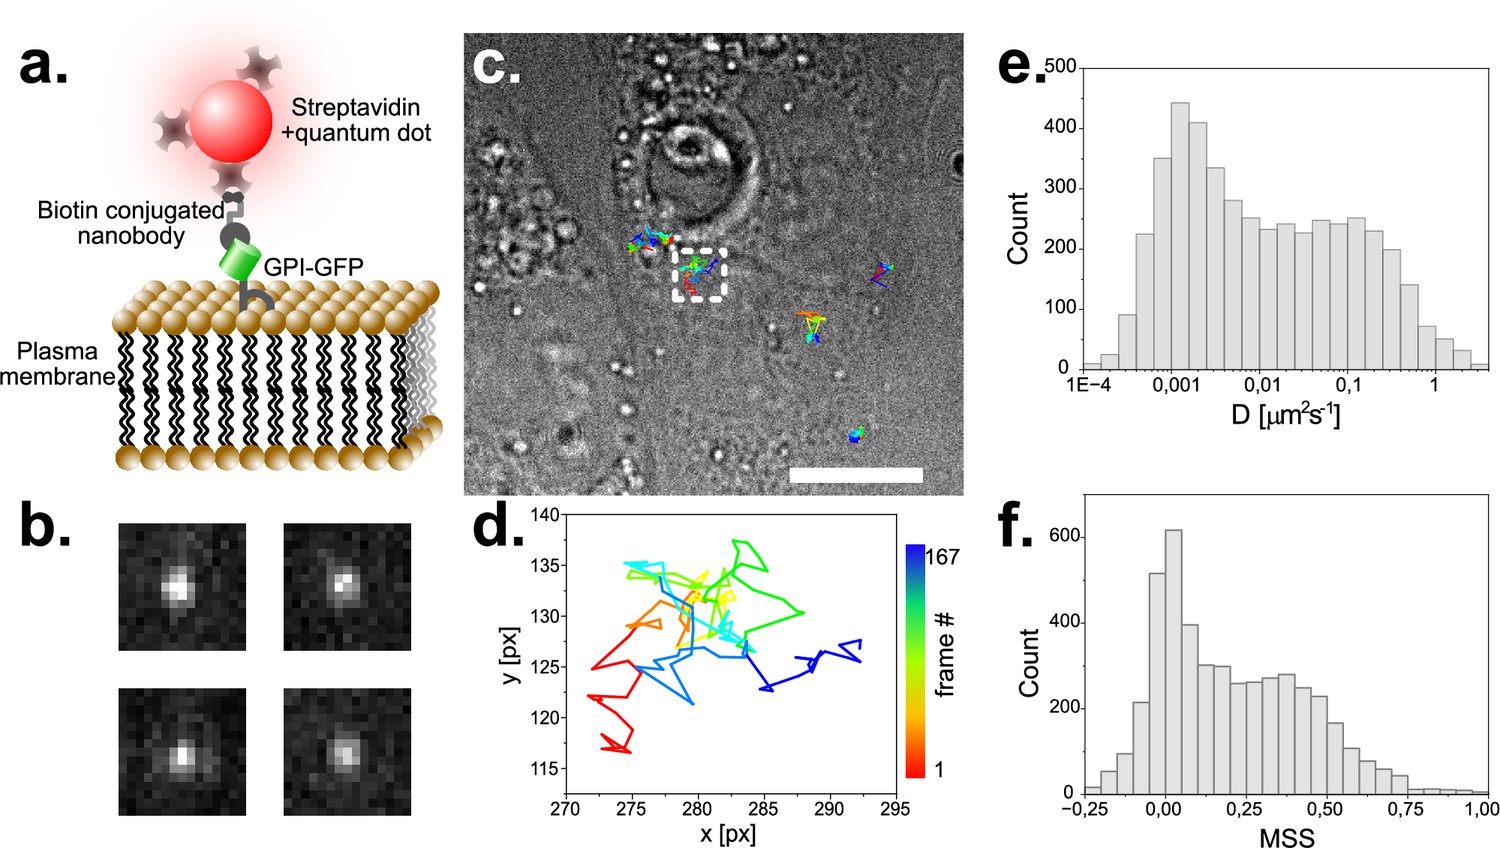
Single particle tracking of GPI-GFP in live CV1 cells using functionalized Quantum dots.
(a) Schematic of the construct used to track single GPI- molecules with quantum dots. (b) Exemplary raw images of single fluorescent Quantum Dots. Image dimension is 1.6 µm x 1.6 µm. (c) Trajectories of several single molecules visualized on a top-light illuminated image of CV1 cells. Scale bar represents 10 µm. (d) Selected trajectory of a single particle over 167 time-points. Sampling rate is 25ms, pixel size 104 nm. (e) Histogram of the diffusion coefficient of around 5000 tracks with 20 or more detected time points each. (f) MSS (moment scaling spectrum) of the same population as plotted in (e).
Figure 6
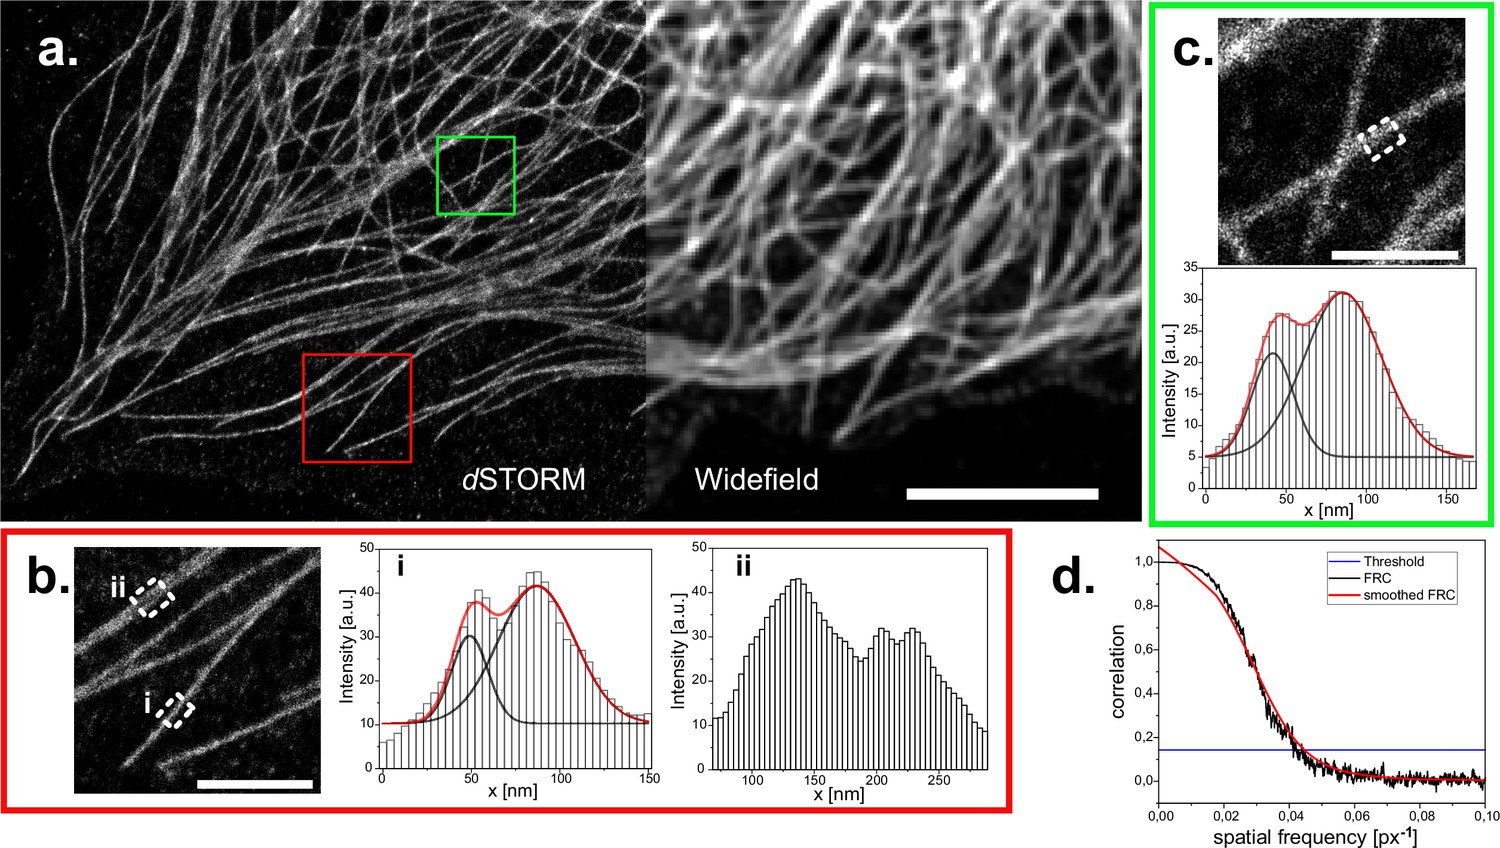
dSTORM reconstruction of immuno-stained CV1 cells against tubulin (α and β-tubulin).
(a) Widefield image and reconstructed super-resolution image of 30’000 widefield frames, localized and reconstructed using ThunderSTORM, applied parameters described in the methods part. Reconstruction is displayed with the average shifted histogram method, including a 25-fold magnification. Scale bar represents 5 µm. Two regions of interest in the reconstruction are marked (red square for (b) and green square for (c)) and zoomed in (scale bar 1 μm). Profiles within these ROIs are measured by averaging the profile of the reconstructed image over 250 nm along the microtubule (white dashed rectangles). White histogram bars are the intensity values of the pixels in the reconstruction. Two peaks arise from the circular shape of microtubules. These were analyzed with a double gaussian fit (red curves are the cumulated single black fits). Distances of (38±2) nm (red box) and (43±2) nm (green box) could be extrapolated. (d) Fourier ring correlation of the complete reconstructed image. Threshold is left to the preset 1/7. Overall resolution is estimated at 93 nm.
Author response image 1
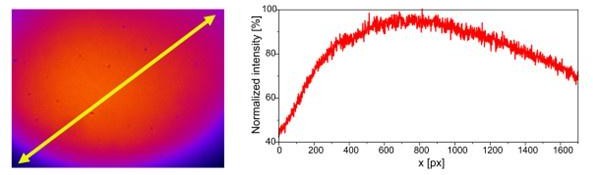
Diagonal cross-section of the illuminated FOV.
Pixel-size (104nm) is the same as in figure 2. Intensity has been normalized according to the maximal value.
Author response image 2
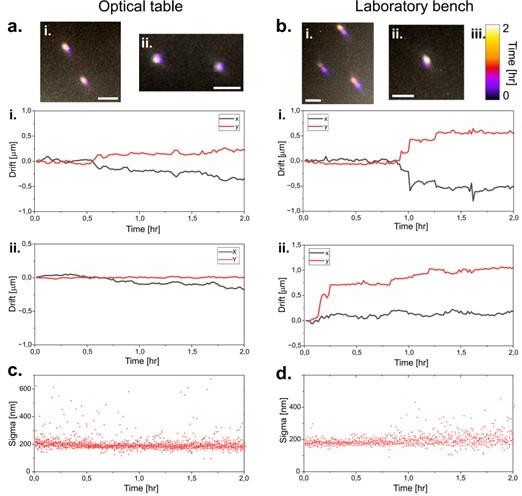
Drift Figure: a.
Drift of fluorescent TS beads on the UC2 setup positioned upon an optical table over a duration of two hours. Beads are localized and resulting displacement in i. and ii. are plotted in the graphs below. The procedure is repeated in b. with the microscope placed on a laboratory bench instead. c. (for the optical table i.) and d. (for the laboratory bench i.) show the variation in the sigma value of the localized beads over the measurement duration. As the sigma values changes when the beads are out of focus, the stability of the setup can be confirmed, as it remains practically unchanged over the measurement duration.
Author response image 3
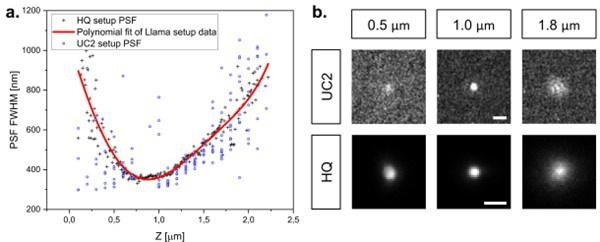
Z-focus Figure: Estimation of the axial position of TS beads on the UC2 setup.
a. The change in PSF FWHM was quantified by acquiring a Z stack of a beads sample. The homebuilt high-quality setup (HQ) was used as a reference, by using the same objective and TS sample. The PSF FWHM on the UC2 setup was measured using the lowest possible axial stage displacement. A Z-position can thus be estimated for single molecules, as displayed in b.
Author response image 4
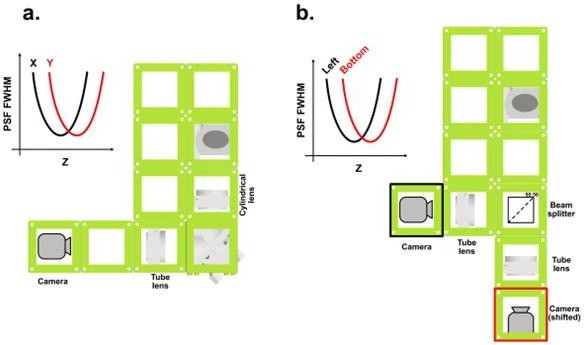
3D concept Figure: Two possible setup modifications to provide axial information when imaging single molecules.
a. A cylindrical lens can be placed to induce an asymmetry between the PSF FWHM in x and in y. Every Z position can be identified by two distinct PSF FWHM values in X and Y. b. By splitting the beam in two and defocusing one path, every PSF will have a specific set of values for its FWHM on the two detectors.
Author response image 5
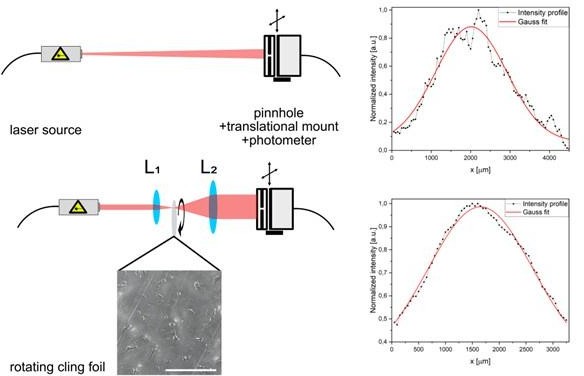
Profile Figure: By moving a combination of pinhole and photometer to scan through the laser profile with a translational mount, the shape of the laser beam can be estimated.
The cling foil plays the same role as a diffuser in other setups.
Author response image 6
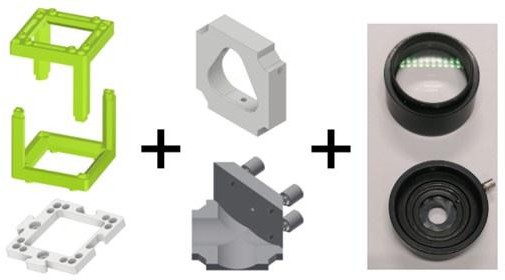
Basic concept of the UC2 setup: Left: Cubes (green) are connected to one another via puzzle pieces (white).
Middle: 3D printed mounts have been designed to adapt various optics (right) to the cube framework. Combined usage of cubes and design of various mounts allows to interface various optics for the assembly.
Author response image 7
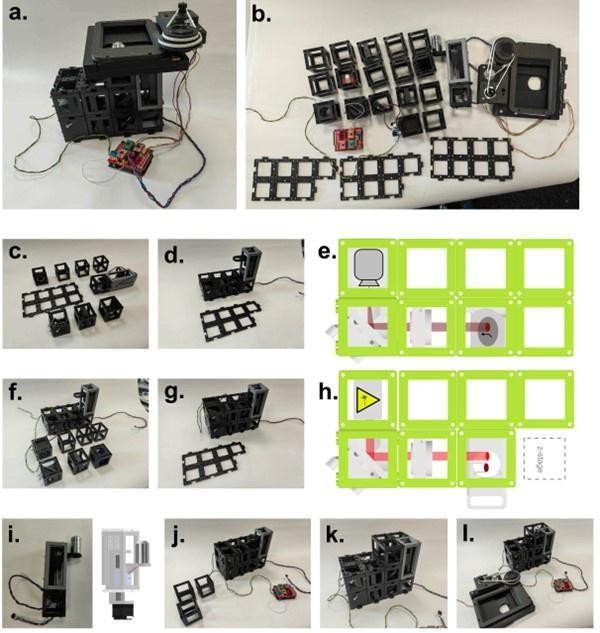
Building the UC2 widefield microscope: a.
Photograph of the complete setup. b. All pieces necessary to build the setup. A list of the components can be found in the bill of materials. c. Bottom emission layer of the microscope before assembly. d. Emission layer after assembly. Connection between cubes is doubled by using a layer of puzzles on the top and the bottom of the emission layer. e. CAD schematic of the emission layer and the positioning of the optics. f. Middle excitation layer of the microscope before assembly. Beam magnifier and homogenizer have been left out for clarity. g. Excitation layer after assembly is also covered by a puzzle layer. h. CAD schematic of the excitation layer and the positioning of the optics. i. Z-stage photograph and corresponding CAD file. Motor of the stage is embedded within the bottom cube. j. A layer of empty cubes supports the microscope stage. k. At this stage of the assembly, the objective is screwed into the objective holder. l. Finally, the stage is wired to the electronics and can then be mounted on top of the microscope (see a.).
Author response image 8
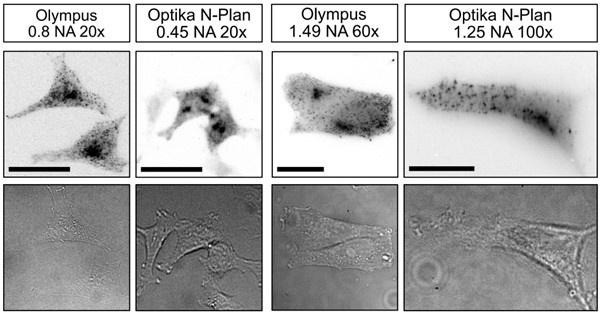
Measurements performed on the UC2 setup with lower budget objectives.
The imaged sample is HeLa cells, stably transfected to express CLC-GFP, then labelled with AF647 through immunostaining. The setup has been kept identical except for the objectives. Scale bar respectively represents 30 µm.
Tables
Table 1
Github repositories for hardware, electronics and software.
| Repository | Link: |
|---|---|
| General openUC2 | https://github.com/openUC2/UC2-GIT; copy archived at Diederich, 2024 |
| Specific to this setup: UC.STORM | https://github.com/openUC2/UC2-STORM-and-Fluorescence, (openUC2, 2024b) |
| ImSwitch (UC2 specific) | https://github.com/openUC2/ImSwitch/. (openUC2, 2024c) |
| UC2-Rest | https://github.com/openUC2/UC2-REST, (openUC2, 2024a) |
| UC2-ESP32 | https://github.com/youseetoo/uc2-esp32, (youseetoo, 2024) |
| UC2-ESP32 Firmware Flashintool (Online) | https://youseetoo.github.io/ |
Additional files
Download links
A two-part list of links to download the article, or parts of the article, in various formats.
Downloads (link to download the article as PDF)
Open citations (links to open the citations from this article in various online reference manager services)
Cite this article (links to download the citations from this article in formats compatible with various reference manager tools)
An open-source, high-resolution, automated fluorescence microscope
eLife 12:RP89826.
https://doi.org/10.7554/eLife.89826.3


