Regulation of hippocampal mossy fiber-CA3 synapse function by a Bcl11b/C1ql2/Nrxn3(25b+) pathway
- Institute of Molecular and Cellular Anatomy, Ulm University, Germany
- Institute of Physiology and Pathophysiology, Faculty of Medicine, Heidelberg University, Germany
- Department of Neuroanatomy, Institute of Anatomy and Cell Biology, Faculty of Medicine, University of Freiburg, Germany
- Institute of Anatomy and Molecular Neurobiology, University of Münster, Germany
- School of Biomedical Sciences, Li Ka Shing Faculty of Medicine, The University of Hong Kong, China
- Centre for Translational Stem Cell Biology, China
Figures
Figure 1 with 1 supplement
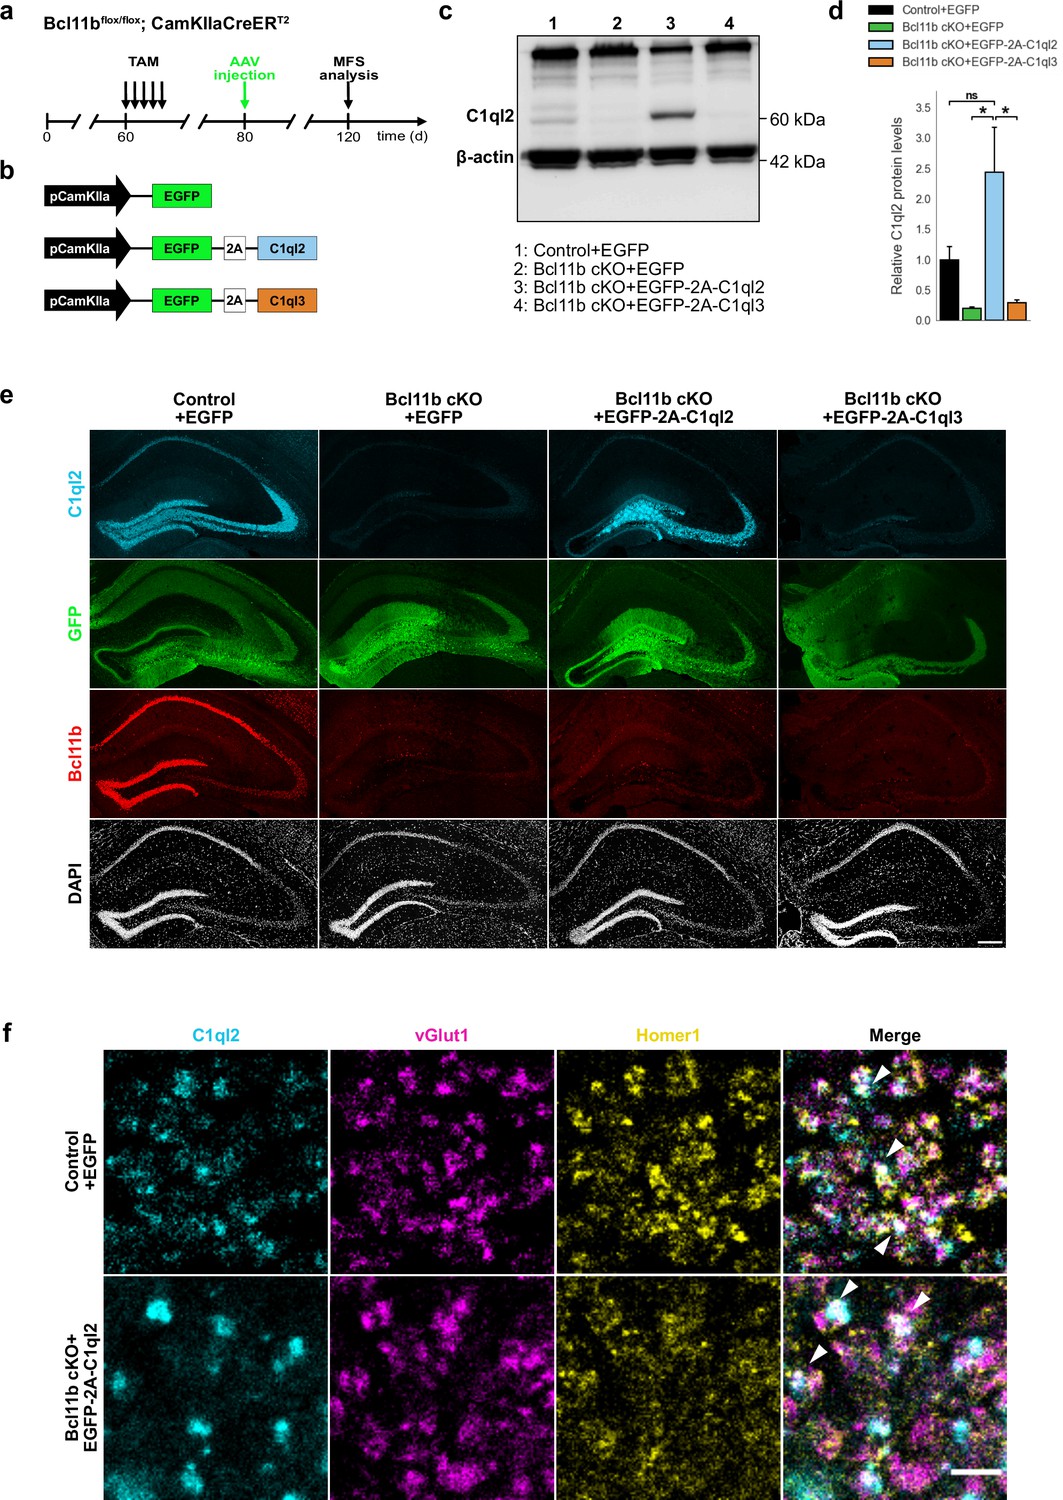
Stereotaxic injection of C1ql2-expressing AAV into Bcl11b cKO DGN restores C1ql2 levels.
(a) Experimental design to analyze the functions of C1ql2 in the MFS as a downstream target of Bcl11b. (b) AAV constructs injected in the DG of Bcl11b cKO and control littermates. (c) Western blot and (d) relative C1ql2 protein levels in mouse hippocampal homogenates. N=3. All data are presented as means; error bars indicate SEM. Two-way ANOVA and Tuckey’s PHC. Control +EGFP vs. Bcl11b cKO +EGFP-2A-C1ql2: ns, p=0.11; Bcl11b cKO +EGFP-2A-C1ql2 vs. Bcl11b cKO +EGFP: *p=0.015; Bcl11b cKO +EGFP-2A-C1ql2 vs. Bcl11b cKO +EGFP-2A-C1ql3: *p=0.019; ns, not significant. (e) Immunohistochemistry of C1ql2 (cyan), GFP (green), and Bcl11b (red) on hippocampal sections. Scale bar: 200 μm. (f) Immunohistochemistry of C1ql2 (cyan), vGlut1 (magenta), and Homer1 (yellow) in the SL of CA3. White arrowheads indicate co-localizing puncta of all three proteins. Scale bar: 15 μm.
-
Figure 1—source data 1
File containing the raw data for Figure 1, panel d.
- https://cdn.elifesciences.org/articles/89854/elife-89854-fig1-data1-v1.xlsx
-
Figure 1—source data 2
Original file for the western blot analysis in Figure 1c.
- https://cdn.elifesciences.org/articles/89854/elife-89854-fig1-data2-v1.zip
-
Figure 1—source data 3
PDF containing Figure 1c and original scans of the relevant western blot analysis with highlighted bands and sample labels.
- https://cdn.elifesciences.org/articles/89854/elife-89854-fig1-data3-v1.zip
Figure 1—figure supplement 1
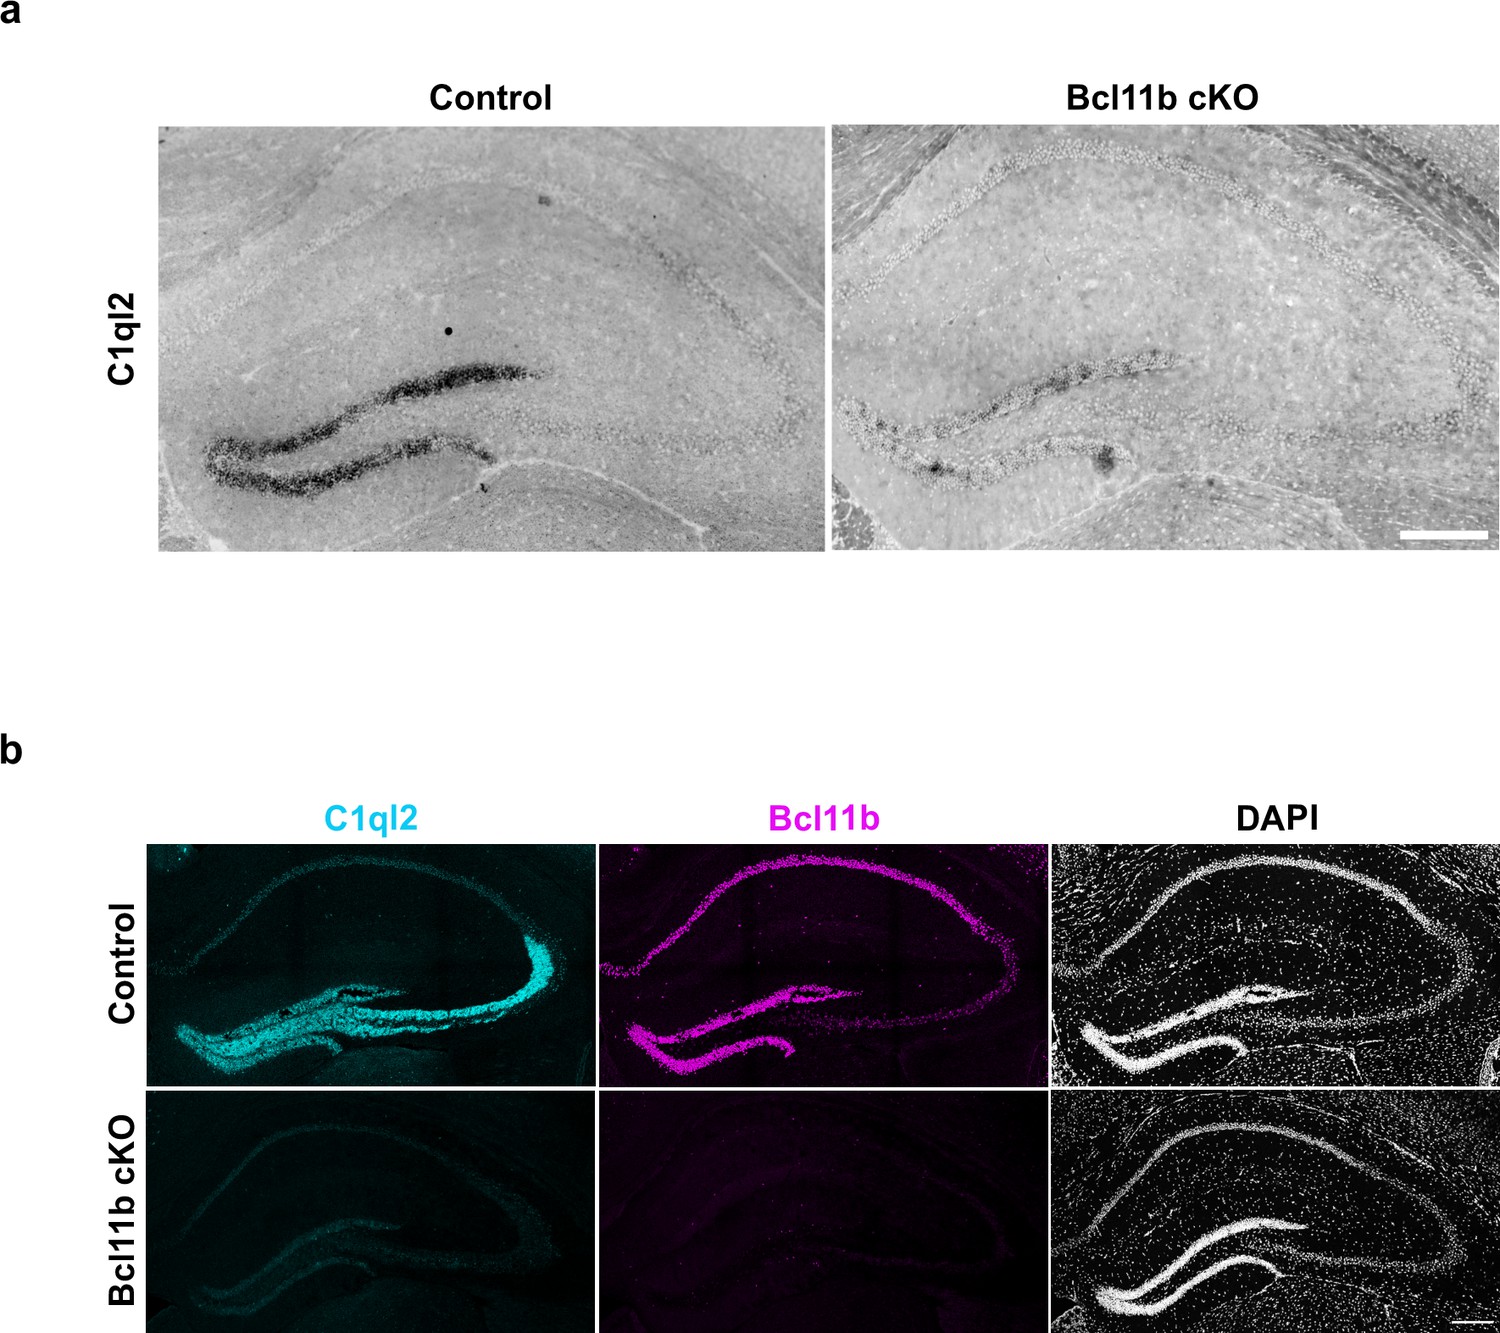
C1ql2 mRNA and protein are lost upon Bcl11b cKO in DGN.
(a) mRNA in situ hybridization of C1ql2 on hippocampal sections. Scale bar: 200 μm. (b) Immunohistochemistry of C1ql2 (cyan) and Bcl11b (magenta) on hippocampal sections. Scale bar: 200 μm.
Figure 2 with 1 supplement
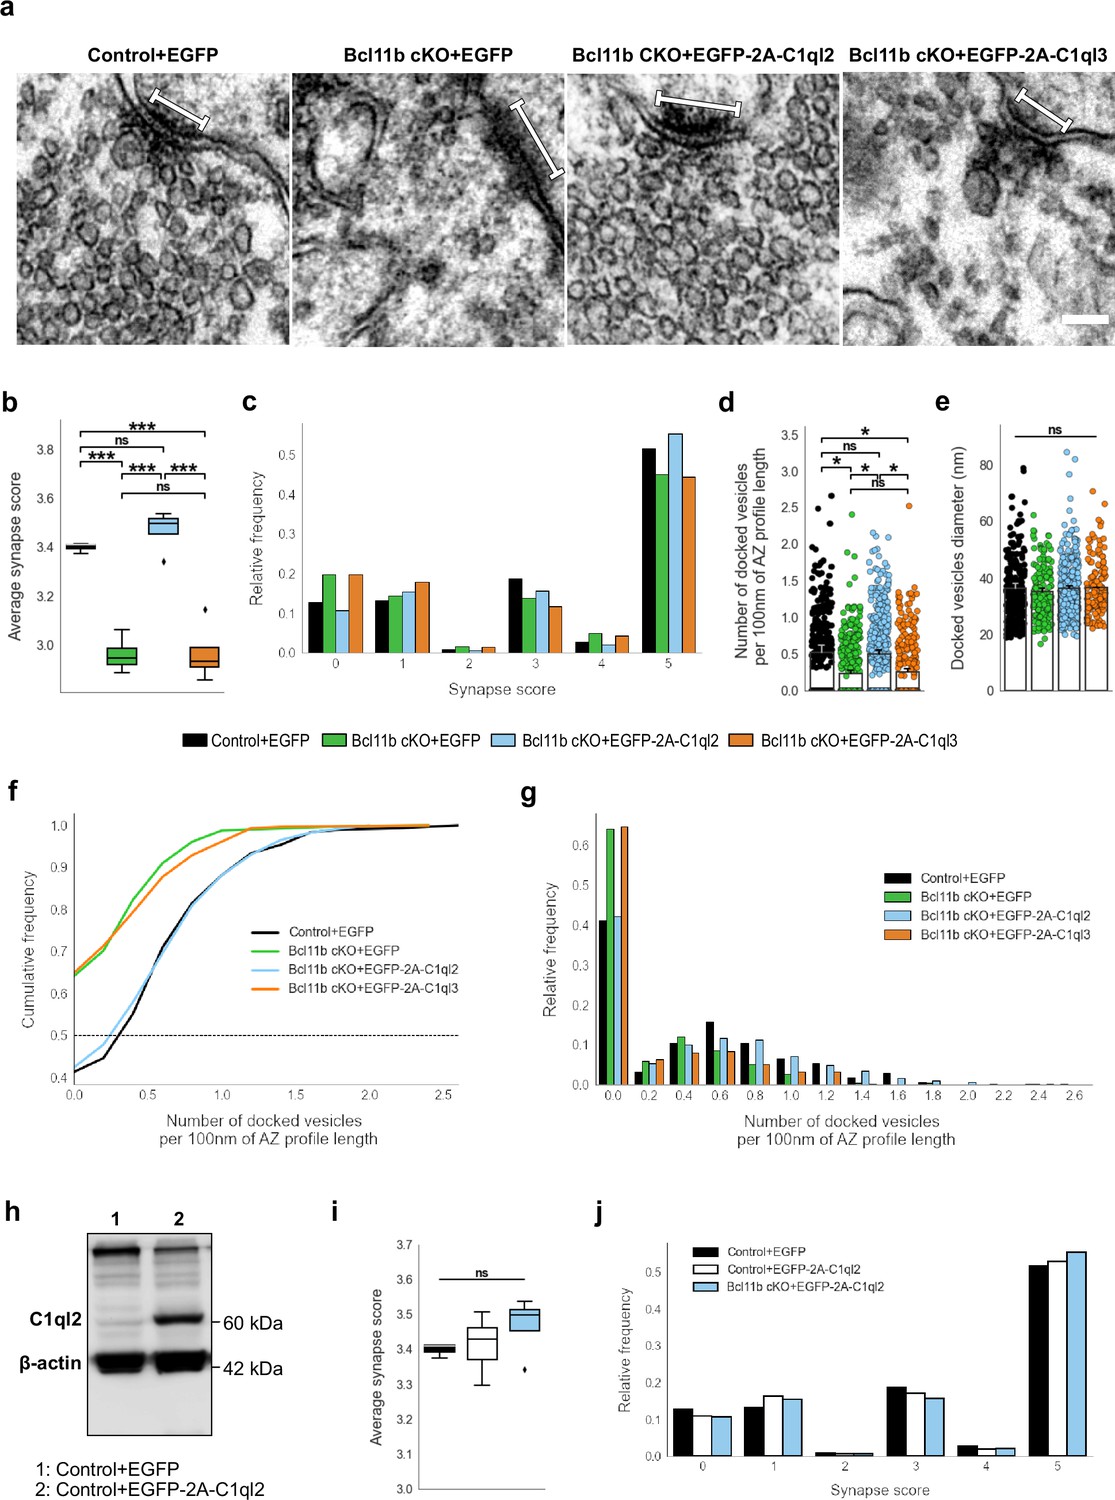
C1ql2 reintroduction in Bcl11b cKO DGN rescues SV recruitment in MFS.
(a) Electron microscope images of MFS and proximal SV. White bars mark synapse length from the postsynaptic side. Scale bar: 100 nm. (b) Average synapse score. Control +EGFP, N=3; Bcl11b cKO +EGFP, Bcl11b cKO +EGFP-2A-C1ql2, Bcl11b cKO +EGFP-2A-C1ql3, N=4. Two-way ANOVA and Tuckey’s PHC. Control +EGFP vs. Bcl11b cKO +EGFP: ***p=0.0002, and vs. Bcl11b cKO +EGFP-2A-C1ql3: ***p=0.0003; Bcl11b cKO +EGFP-2A-C1ql2 vs. Bcl11b cKO +EGFP and vs. Bcl11b cKO +EGFP-2A-C1ql3: ***p<0.0001; ns, not significant. (c) Relative frequency of synapse scores. (d) Number of docked vesicles per 100 nm AZ profile length. Control +EGFP, Bcl11b cKO +EGFP-2A-C1ql3, N=3; Bcl11b cKO +EGFP, Bcl11b cKO +EGFP-2A-C1ql2, N=4. All data are presented as means; error bars indicate SEM. Points represent the individual examined AZ and SV, respectively. Two-way ANOVA and Tuckey’s PHC. Control +EGFP vs. Bcl11b cKO +EGFP: *p=0.024, and vs. Bcl11b cKO +EGFP-2A-C1ql3: *p=0.045; Bcl11b cKO +EGFP-2A-C1ql2 vs. Bcl11b cKO +EGFP: *p=0.026, and vs. Bcl11b cKO +EGFP-2A-C1ql3: *p=0.049; ns, not significant. (e) Diameter of docked vesicles. Control +EGFP, Bcl11b cKO +EGFP-2A-C1ql3, N=3; Bcl11b cKO +EGFP, Bcl11b cKO +EGFP-2A-C1ql2, N=4; Two-way ANOVA. ns, not significant. (f) Cumulative and (g) relative frequency of the number of docked vesicles per 100 nm AZ profile length. (h) Western blot of mouse hippocampal homogenates. (i) Average synapse score. Control +EGFP, N=3; Control +EGFP-2A-C1ql2, N=6; Bcl11b cKO +EGFP-2A-C1ql2, N=4. Two-way ANOVA. ns, not significant. (j) Relative frequency of synapse scores. Data for Control +EGFP-2A-C1ql2 from i-j in this figure are compared with Control +EGFP and Bcl11b cKO +EGFP-2A-C1ql2 data from (b-c).
-
Figure 2—source data 1
File containing the raw data for Figure 2 b-g and i-j and for Figure 2—figure supplement 1b-d and f.
- https://cdn.elifesciences.org/articles/89854/elife-89854-fig2-data1-v1.xlsx
-
Figure 2—source data 2
Original file for the western blot analysis in Figure 2h.
- https://cdn.elifesciences.org/articles/89854/elife-89854-fig2-data2-v1.zip
-
Figure 2—source data 3
PDF containing Figure 2h and original scans of the relevant western blot analysis with highlighted bands and sample labels.
- https://cdn.elifesciences.org/articles/89854/elife-89854-fig2-data3-v1.zip
Figure 2—figure supplement 1
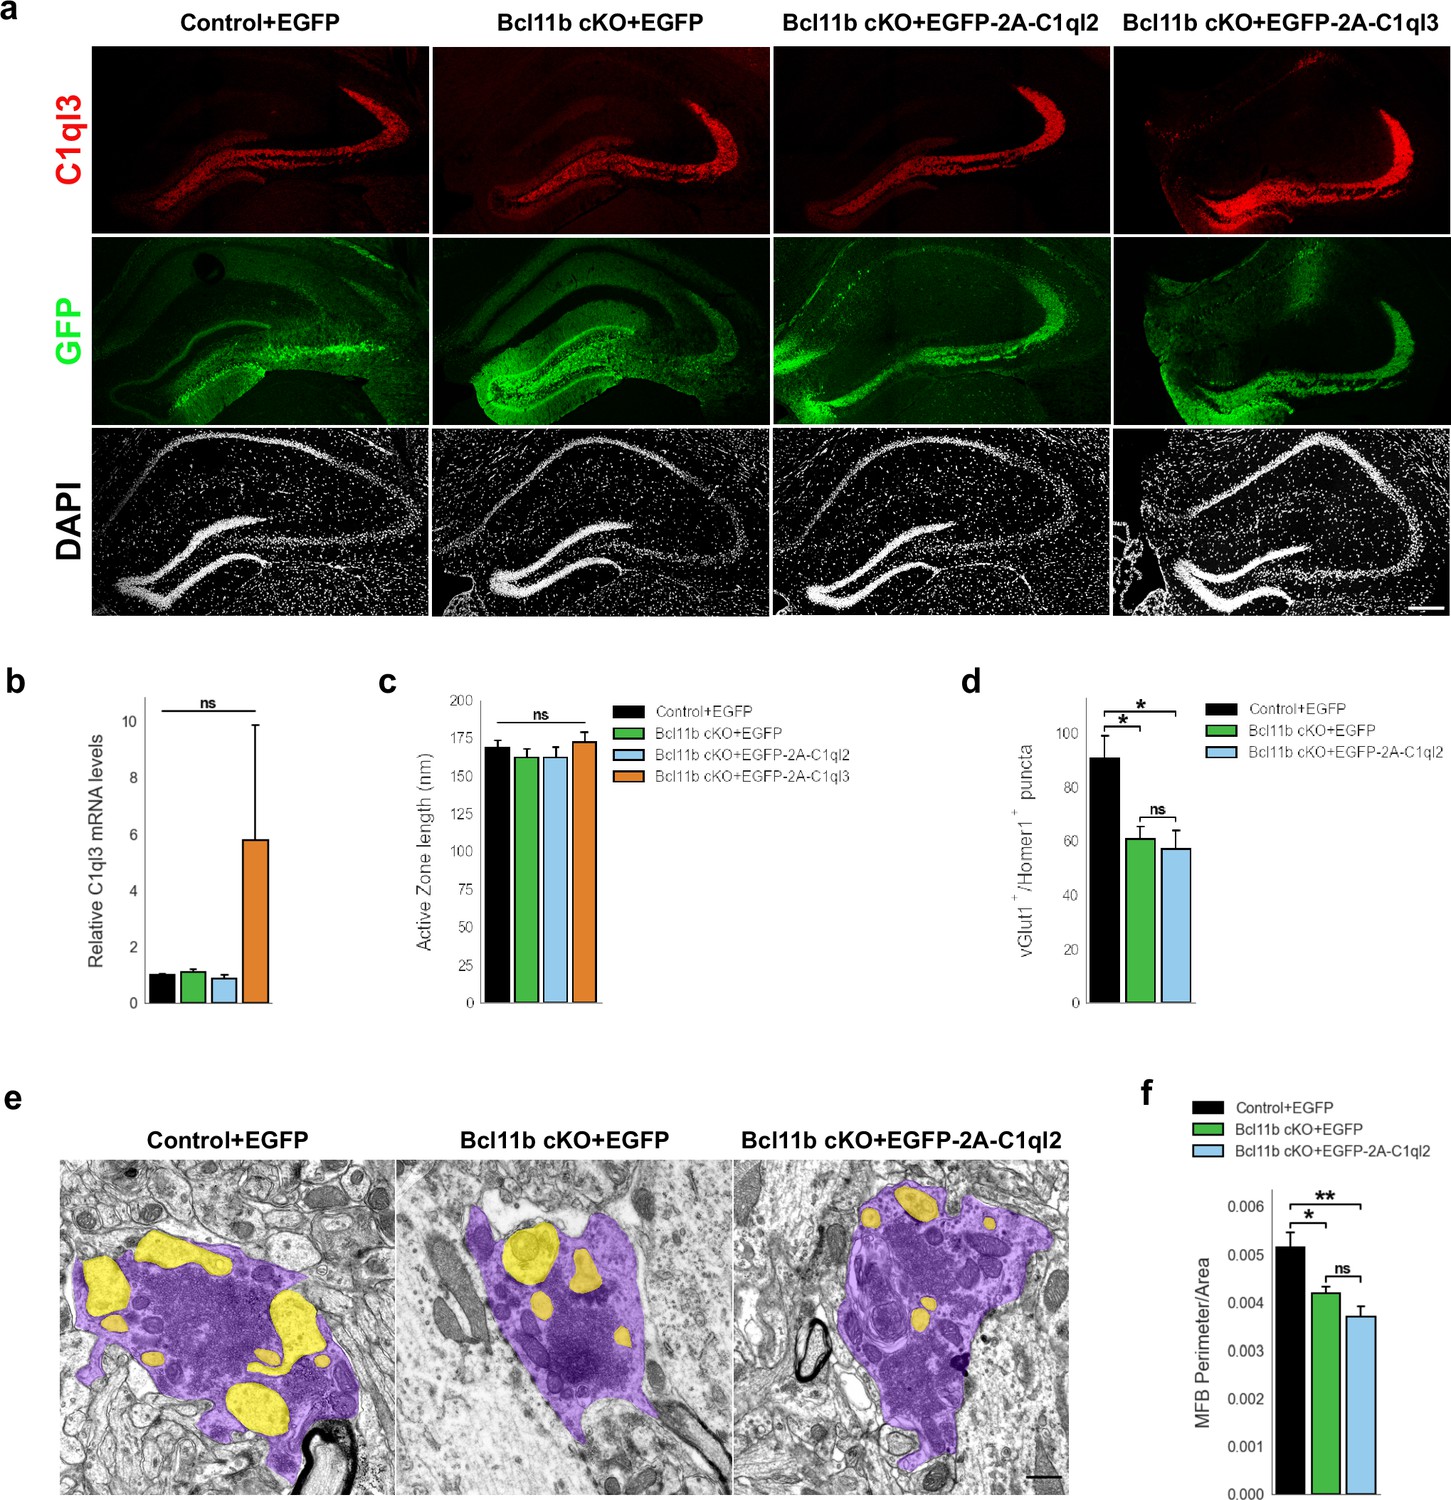
C1ql2 reintroduction in Bcl11b cKO DGN does not rescue MFS number and MFB complexity.
(a) Immunohistochemistry of C1ql3 (red) and GFP (green) on hippocampal sections. Scale bar: 200 μm. (b) Relative C1ql3 mRNA levels in DGN. Control +EGFP, Bcl11b cKO +EGFP, Bcl11b cKO +EGFP-2A-C1ql2, N=4; Bcl11b cKO +EGFP-2A-C1ql3, N=3. All data are presented as means; error bars indicate SEM. Two-way ANOVA. ns, not significant. (c) Active zone length. Control +EGFP, Bcl11b cKO +EGFP-2A-C1ql3, N=3; Bcl11b cKO +EGFP, Bcl11b cKO +EGFP-2A-C1ql2, N=4. All data are presented as means; error bars indicate SEM. Two-way ANOVA. ns, not significant. (d) vGlut1 and Homer1 double positive puncta in selected CA3 SL ROIs. N=3. All data are presented as means; error bars indicate SEM. Two-way ANOVA and Tuckey’s PHC. Control +EGFP vs. Bcl11b cKO +EGFP: *p=0.047, and vs. Bcl11b cKO +EGFP-2A-C1ql2: *p=0.029; ns, not significant. (e) Electron microscopy images of MFBs (purple) and contacting postsynaptic spines (yellow). Scale bar: 500 nm. (f) MFB perimeter-to-area ratio. N=5. All data are presented as means; error bars indicate SEM. Two-way ANOVA and Tuckey’s PHC. Control +EGFP vs. Bcl11b cKO +EGFP: *p=0.035, and vs. Bcl11b cKO +EGFP-2A-C1ql2: **p=0.0014; ns, not significant.
Figure 3 with 1 supplement

C1ql2 reintroduction in Bcl11b cKO DGN rescues mossy fiber LTP.
(a) Representative fEPSP traces showing baselines before HFS (black), fEPSP changes 30–40 min after HFS (cyan) and following the application of 3 µM DCG-IV (red). (b) Time course of fEPSP slopes. The black arrow indicates HFS and the dashed line is the baseline level. (c) Quantification of fEPSP facilitation at four different time intervals after HFS. Changes in the fEPSP slope are shown as the percentage of the mean baseline fEPSP. Control +EGFP, 7 slices from 6 mice; Bcl11b cKO +EGFP, 8 slices from 5 mice, Bcl11b cKO +EGFP-2A-C1ql3, 8 slices from 6 mice; Bcl11b cKO +EGFP-2A-C1ql2, 6 slices from 4 mice; All data are presented as means; error bars indicate SEM. One-way ANOVA followed by Bonferroni’s PHC for each time interval. 20–30 min: Control +EGFP vs. Bcl11b cKO +EGFP: **p=0.002, and vs. Bcl11b cKO +EGFP-2A-C1ql3: *p=0.011; Bcl11b cKO +EGFP-2A-C1ql2 vs. Bcl11b cKO +EGFP: *p=0.023; 30–40 min: Control +EGFP vs. Bcl11b cKO +EGFP: ***p<0.001, and vs. Bcl11b cKO +EGFP-2A-C1ql3: **p=0.002; Bcl11b cKO +EGFP-2A-C1ql2 vs. Bcl11b cKO +EGFP: *p=0.01 and vs. Bcl11b cKO +EGFP-2A-C1ql3: *p=0.023; ns, not significant. (d) Representative fEPSP traces showing baselines before forskolin application (black), fEPSP changes 105–120 min after the start of application (cyan) and following the addition of 3 µM DCG-IV (red). (e) Time course of fEPSP slopes. The black solid line indicates forskolin perfusion and the dashed line is the baseline level. (f) Quantification of fEPSP facilitation at two different time intervals after the start of the forskolin application. Changes in fEPSP slope are shown as percentage of the mean baseline fEPSP. 8 slices from 5 mice. All data are presented as means; error bars indicate SEM. Unpaired t-test for both time intervals. 15–30 min: **p=0.005; 105–120 min: **p=0.0025.
-
Figure 3—source data 1
File containing the raw data for Figure 3, panels b & e and for Figure 3—figure supplement 1, panels b and d.
- https://cdn.elifesciences.org/articles/89854/elife-89854-fig3-data1-v1.xlsx
Figure 3—figure supplement 1
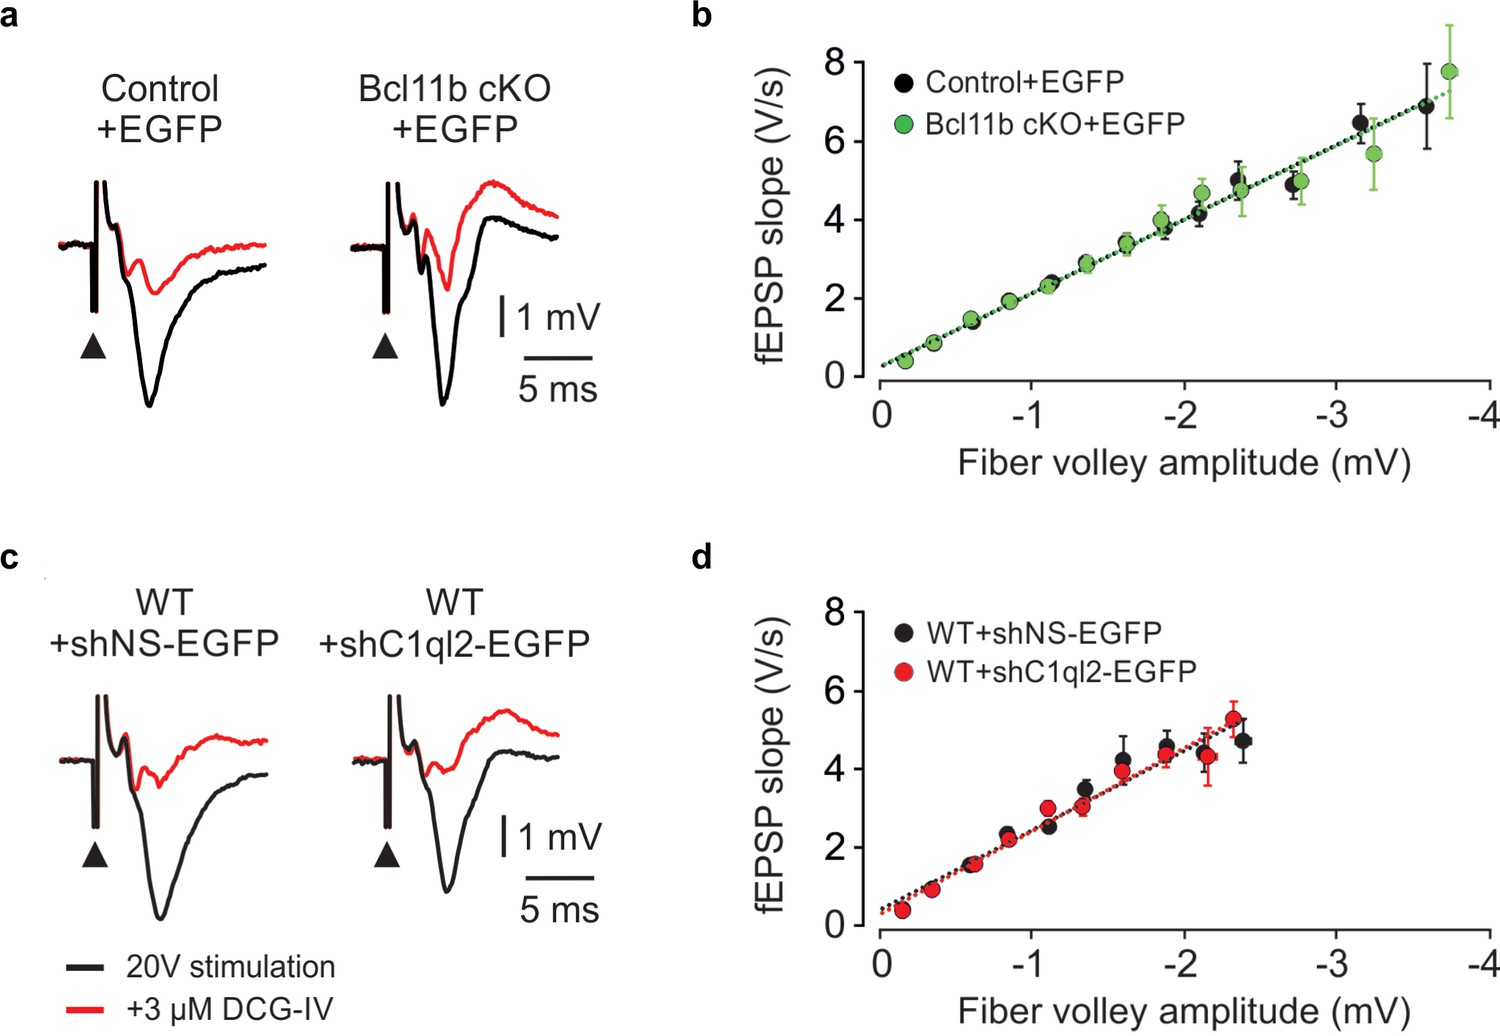
Bcl11b cKO and C1ql2 KD in DGN do not affect basal synaptic transmission.
(a) Representative fEPSP traces recorded in slices from a control and Bcl11b cKO animal showing responses to a 20 V electrical stimulation (black, black arrowheads indicate stimulation). The signal is almost entirely blocked by the application of 3 µM DCG-IV (red). (b) Input-output curves generated by plotting fEPSP slope against fiber volley amplitude at increasing stimulation intensities. Control +EGFP, 35 slices from 16 mice; Bcl11b cKO +EGFP, 32 slices from 14 mice. The data are presented as means, error bars represent SEM. (c) Representative fEPSP traces recorded in slices from a control and C1ql2 KD animal, showing responses to a 20 V electrical stimulation (black, black arrowheads indicate stimulation). The signal is almost entirely blocked by the application of 3 µM DCG-IV (red). (d) Input-output curves generated by plotting fEPSP slope against fiber volley amplitude at increasing stimulation intensities.+ shNS EGFP, 16 slices from 9 mice;+shC1ql2-EGFP, 12 slices from 8 mice. The data are presented as means, error bars represent SEM.
Figure 4 with 1 supplement
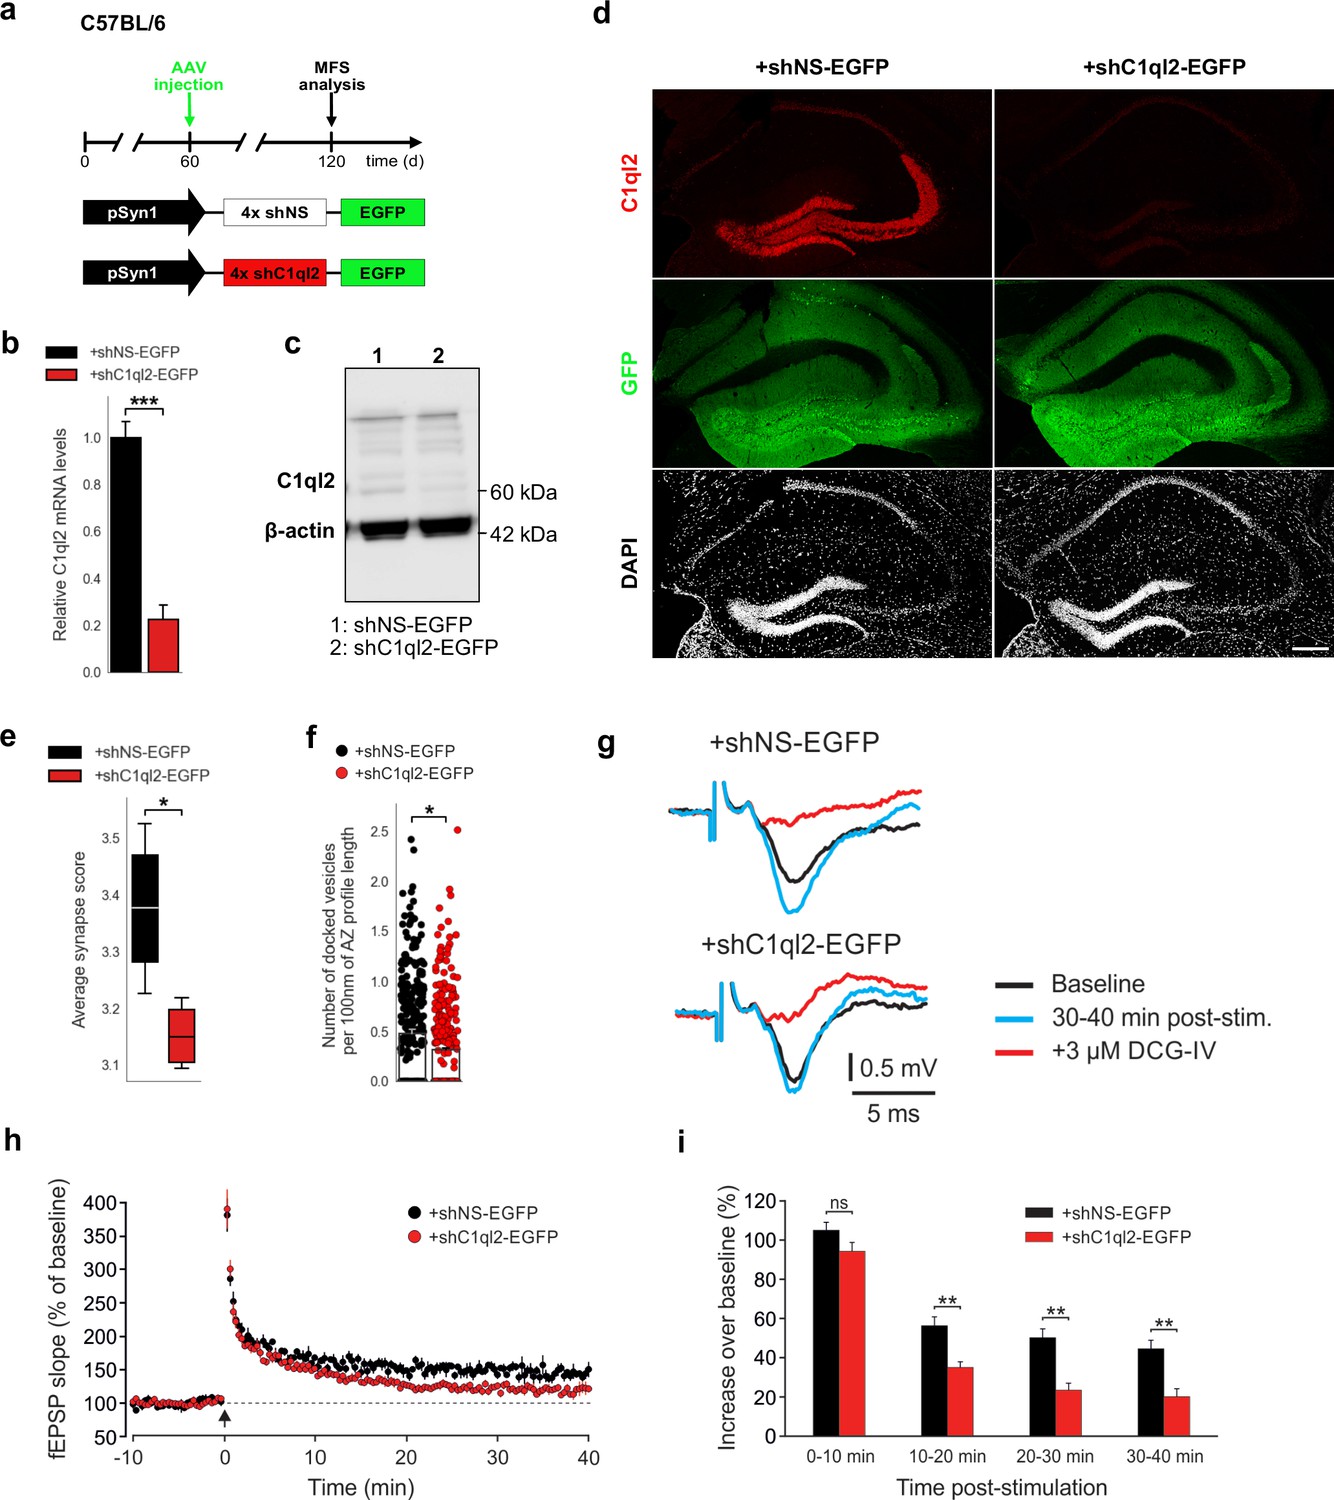
KD of C1ql2 in DGN of WT mice impairs SV recruitment and LTP.
(a) Experimental design to analyze the MFS after AAV-mediated KD of C1ql2 in WT DGN. (b) Relative C1ql2 mRNA levels in DGN. N=4. All data are presented as means; error bars indicate SEM. Unpaired t-test: ***p=0.0002. (c) Western blot of mouse hippocampal homogenates. (d) Immunohistochemistry of C1ql2 (red) and GFP (green) on hippocampal sections. Scale bar: 200 μm. (e) Average synapse score. N=4. Unpaired t-test. *p=0.025. (f) Number of docked vesicles per 100 nm AZ profile length. N=3. All data are presented as means; error bars indicate SEM. Points represent the individual examined AZ. Unpaired t-test. *p=0.018. (g) Representative fEPSP traces showing baselines before HFS (black), fEPSP changes 30–40 min after HFS (cyan) and following the application of 3 µM DCG-IV (red). (h) Time course of fEPSP slopes. The black arrow indicates HFS and the dashed line the baseline level. (i) Quantification of fEPSP facilitation at four different time intervals after HFS. Changes in fEPSP slope are shown as percentage of the mean baseline fEPSP. +shNS EGFP, 6 slices from 6 mice;+shC1ql2-EGFP, 7 slices from 7 mice. All data are presented as means; error bars indicate SEM. Mann-Whitney U-test for each time interval. 10–20 min: **p=0.0012; 20–30 min: **p=0.0023; 30–40 min: **p=0.0023; ns, not significant.
-
Figure 4—source data 1
File containing the raw data for Figure 4, panels b, e-f & h and for Figure 4—figure supplement 1, panels b-g & i.
- https://cdn.elifesciences.org/articles/89854/elife-89854-fig4-data1-v1.xlsx
-
Figure 4—source data 2
Original file for the western blot analysis in Figure 4c.
- https://cdn.elifesciences.org/articles/89854/elife-89854-fig4-data2-v1.zip
-
Figure 4—source data 3
PDF containing Figure 4c and original scans of the relevant western blot analysis with highlighted bands and sample labels.
- https://cdn.elifesciences.org/articles/89854/elife-89854-fig4-data3-v1.zip
Figure 4—figure supplement 1
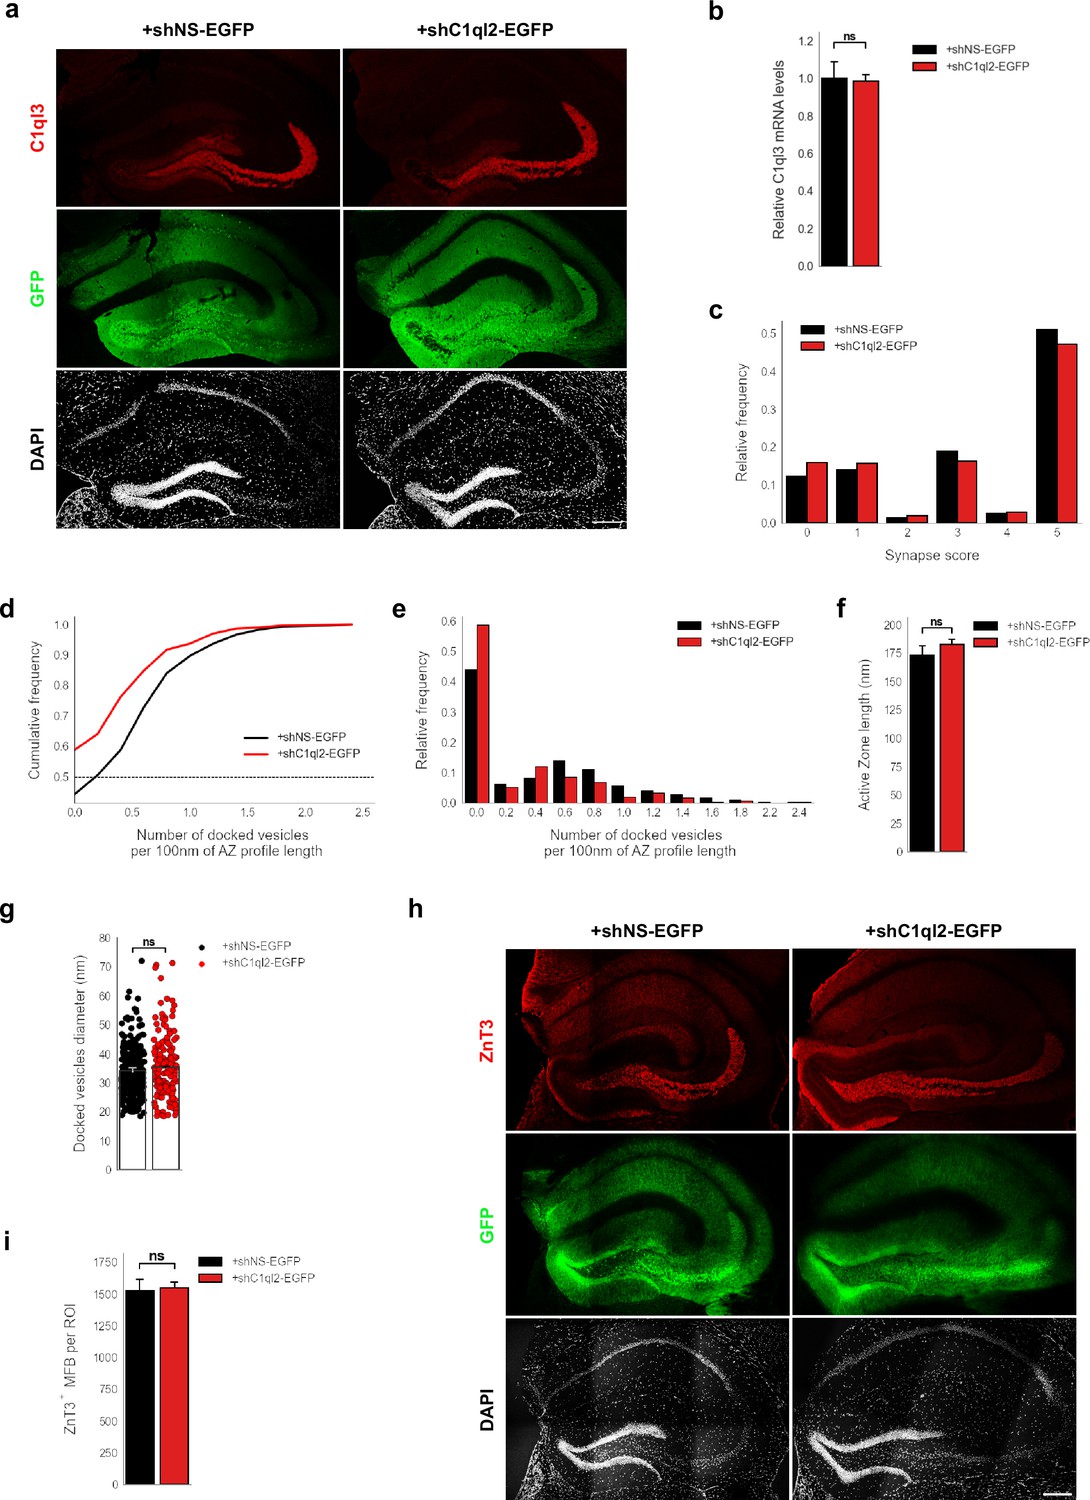
C1ql2 KD in DGN of WT mice impairs SV recruitment.
(a) Immunohistochemistry of C1ql3 (red) and GFP (green) on hippocampal sections. Scale bar: 200 μm. (b) Relative C1ql3 mRNA levels in DGN. N=4. All data are presented as means; error bars indicate SEM. Unpaired t-test. ns, not significant. (c) Relative frequency of synapse scores (refer to Figure 4e). (d Cumulative and e) relative frequency of the number of docked vesicles per 100 nm AZ profile length (refer to Figure 4f). (f) Active zone length. N=3. All data are presented as means; error bars indicate SEM. Unpaired t-test. ns, not significant. (g) Diameter of the docked vesicles. N=3. All data are presented as means; error bars indicate SEM. Points represent the individual examined SV. Unpaired t-test. ns, not significant. (h) Immunohistochemistry of ZnT3 (red) and GFP (green) on hippocampal sections. Scale bar: 200 μm. (i) Number of MFB from selected ROIs in SL of CA3.+shNS-EGFP: N=4;+shC1ql2-EGFP: N=3. All data are presented as means; error bars indicate SEM. Unpaired t-test. ns, not significant.
Figure 5
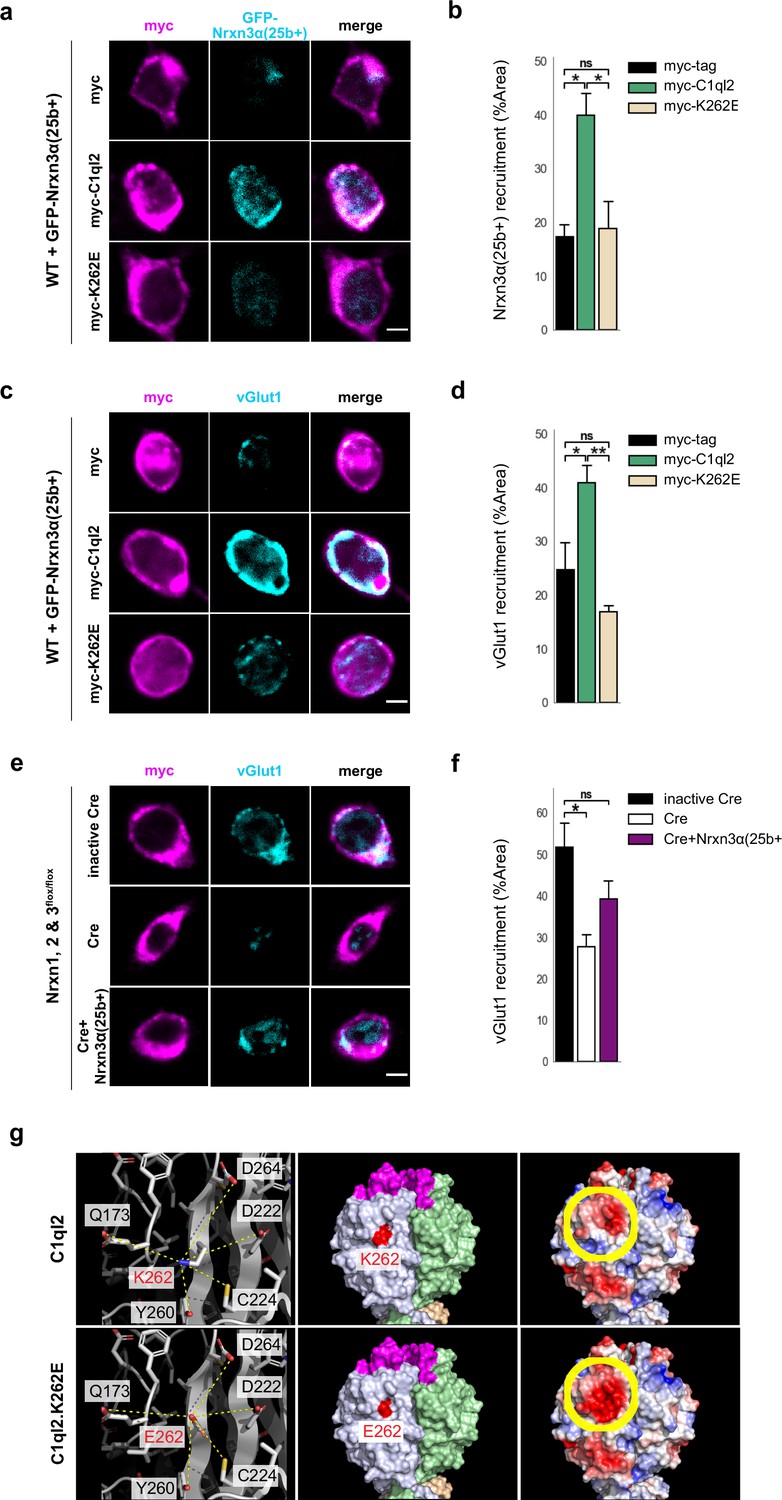
C1ql2-Nrxn3 interaction recruits vGlut1 in vitro.
(a) Immunocytochemistry of myc-tagged C1ql2, C1ql2.K262E or myc-tag (magenta) expressing HEK293 cells and GFP-Nrxn3α(25b+) (cyan) from contacting hippocampal neurons. Scale bar: 5 μm. (b) Nrxn3α(25b+) recruitment by differentially transfected HEK293 cells. N=3. All data are presented as means; error bars indicate SEM. One-way ANOVA and Tuckey’s PHC. myc-C1ql2 vs. myc-tag: *p=0.016, and vs. myc-K262E: *p=0.022; ns, not significant. (c) Immunocytochemistry of myc-tagged C1ql2, C1ql2.K262E or myc-tag (magenta) expressing HEK293 cells and vGlut1 (cyan) from contacting hippocampal neurons. Scale bar: 5 μm. (d) vGlut1 recruitment by differentially transfected HEK293 cells. N=3. All data are presented as means; error bars indicate SEM. One-way ANOVA and Tuckey’s PHC. myc-C1ql2 vs. myc-tag: *p=0.04, and vs. myc-K262E: **p=0.007; ns, not significant. (e) Immunocytochemistry of myc-tagged C1ql2 (magenta) expressing HEK293 cells and vGlut1 (cyan) from contacting control, Nrxn123 KO or Nrxn123 KO with Nrxn3α(25+) rescued hippocampal neurons. Scale bar: 5 μm. (f) vGlut1 recruitment by HEK293 cells in presence or absence of neuronal Nrxns. N=3. All data are presented as means; error bars indicate SEM. One-way ANOVA and Tuckey’s PHC. inactive Cre vs. Cre: *p=0.023, and vs. Cre +Nrxn3α(25+): p=0.21; ns, not significant. (g) Trimeric structures of C1ql2 (PDB_ID: 4QPY, upper panels) and the variant C1ql2.K262E (lower panels). Residue 262 is the central residue (red, left and middle panels) of a larger area underneath the C1ql2-specific calcium and receptor binding loops (magenta, middle panel). The mutation K262E alters the charge of that surface area negative (yellow-circled area, right panels) and makes it potentially repulsive to bind Nrxn3(25b+).
-
Figure 5—source data 1
File containing the raw data for Figure 5, panels b, d, and f.
- https://cdn.elifesciences.org/articles/89854/elife-89854-fig5-data1-v1.xlsx
Figure 6 with 1 supplement
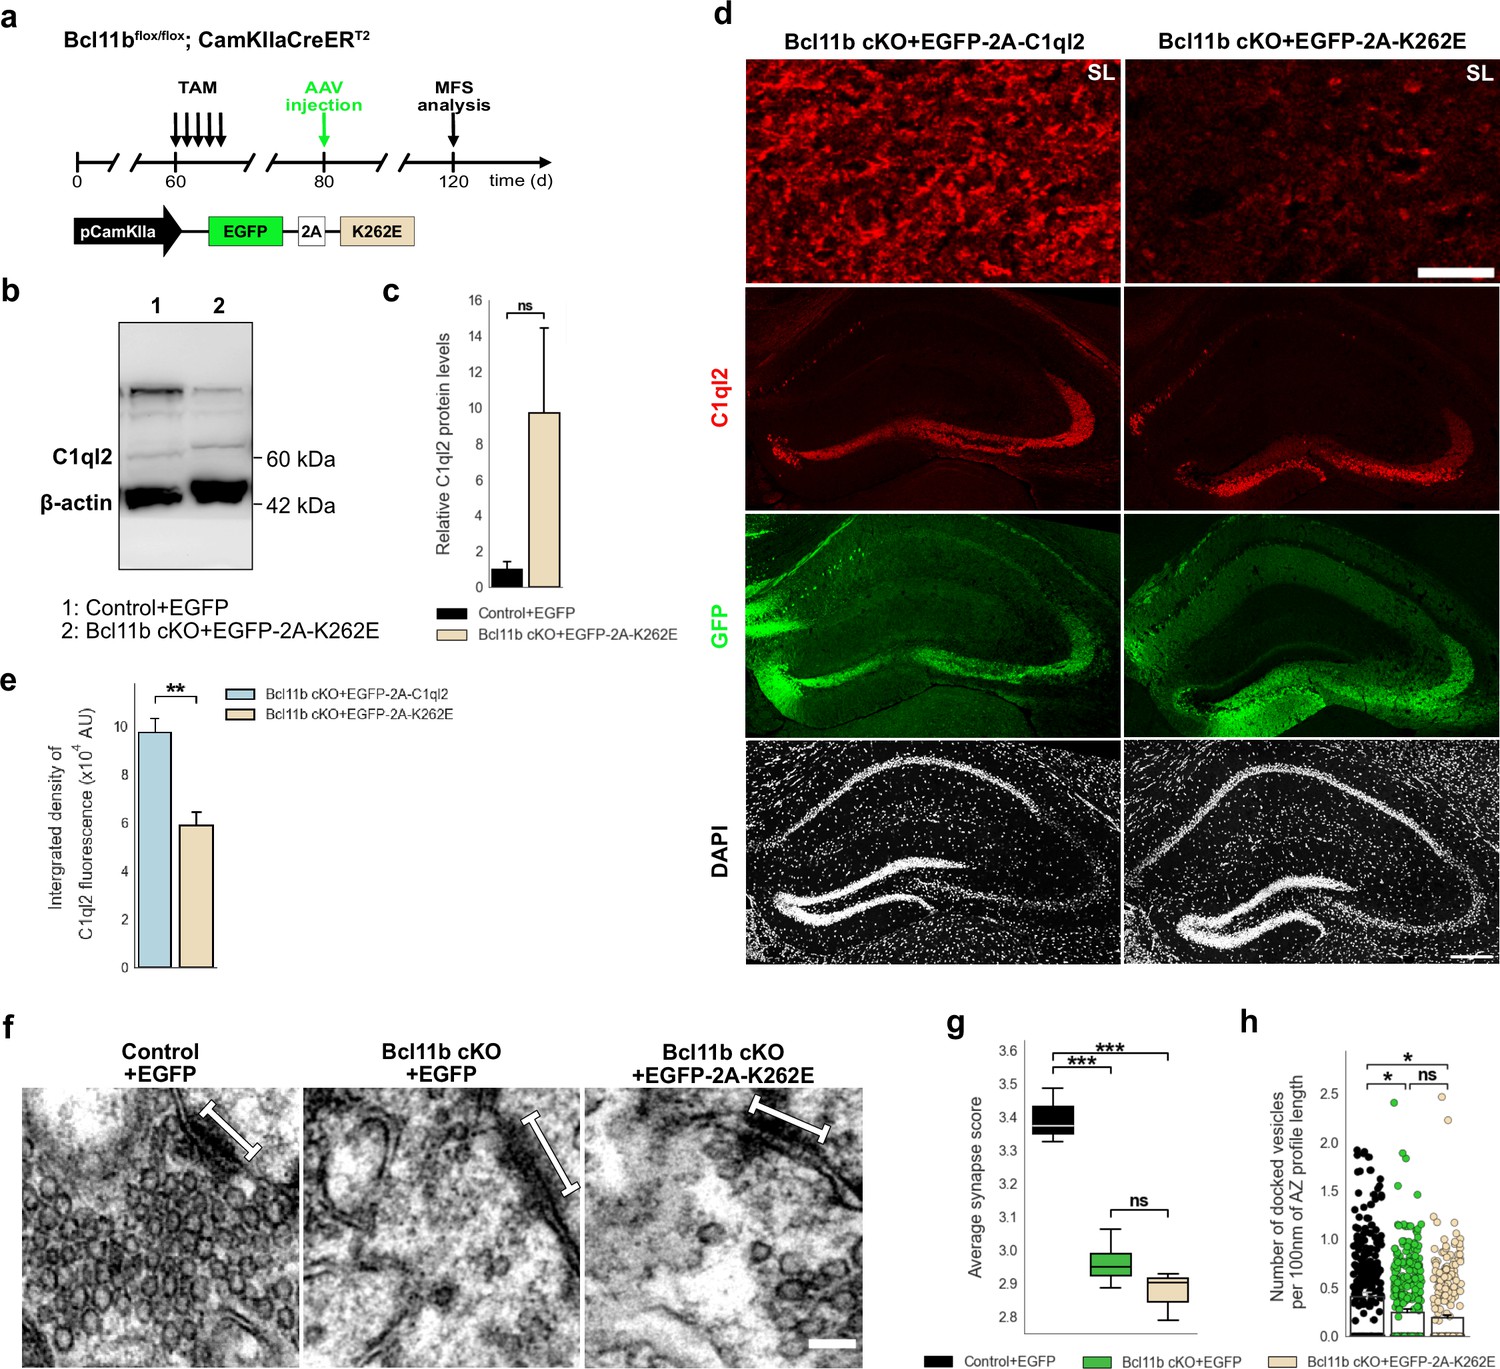
C1ql2-Nrxn3(25b+) interaction is important for C1ql2 localization at the MFS and SV recruitment.
(a) Experimental design to analyze the MFS after AAV-mediated expression of C1ql2.K262E in Bcl11b cKO DGN. (b) Western blot and (c) relative C1ql2.K262E protein levels in mouse hippocampal homogenates. N=3. All data are presented as means; error bars indicate SEM. Mann-Whitney U-test. ns, not significant. (d) Immunohistochemistry of C1ql2 (red) and GFP (green) in hippocampal sections. Scale bar: 200 μm. Upper panels depict close-ups of C1ql2 staining from the SL of CA3. Scale bar: 15 μm. (e) Integrated density of C1ql2 fluorescence in the SL of CA3. N=3. All data are presented as means; error bars indicate SEM. Unpaired t-test. *p=0.008. (f) Electron microscope images of MFS and proximal SV. White bars mark synapse length from postsynaptic side. Scale bar: 100 nm. (g) Average synapse score. Control +EGFP, Bcl11b cKO +EGFP-2A-K262E: N=3; Bcl11b cKO +EGFP: N=4. Two-way ANOVA and Tuckey’s PHC. Control +EGFP vs. Bcl11b cKO +EGFP: ***p=0.0004, and vs. Bcl11b cKO +EGFP-2A-K262E: ***p=0.0002; ns, not significant. (h) Number of docked vesicles per 100 nm AZ profile length. Control +EGFP, Bcl11b cKO +EGFP-2A-K262E: N=3; Bcl11b cKO +EGFP: N=4. All data are presented as means; error bars indicate SEM. Points represent the individual examined AZ. Two-way ANOVA and Tuckey’s PHC. Control +EGFP vs. Bcl11b cKO +EGFP: *P=0.0434, and vs. Bcl11b cKO +EGFP-2A-K262E: *p=0.0196; ns, not significant. Data for Control +EGFP and Bcl11b cKO +EGFP-2A-K262E from f-h in this figure are compared with Bcl11b cKO +EGFP data from Figure 2.
-
Figure 6—source data 1
File containing the raw data for Figure 6, panels c, e, and g-h and for Figure 6—figure supplement 1, panels a, c-g, and i.
- https://cdn.elifesciences.org/articles/89854/elife-89854-fig6-data1-v1.xlsx
-
Figure 6—source data 2
Original file for the western blot analysis in Figure 6b.
- https://cdn.elifesciences.org/articles/89854/elife-89854-fig6-data2-v1.zip
-
Figure 6—source data 3
PDF containing Figure 6b and original scans of the relevant western blot analysis with highlighted bands and sample labels.
Figure 6—figure supplement 1—source data 1. Original file for the western blot analysis in Figure 6—figure supplement 1k.
- https://cdn.elifesciences.org/articles/89854/elife-89854-fig6-data3-v1.zip
Figure 6—figure supplement 1
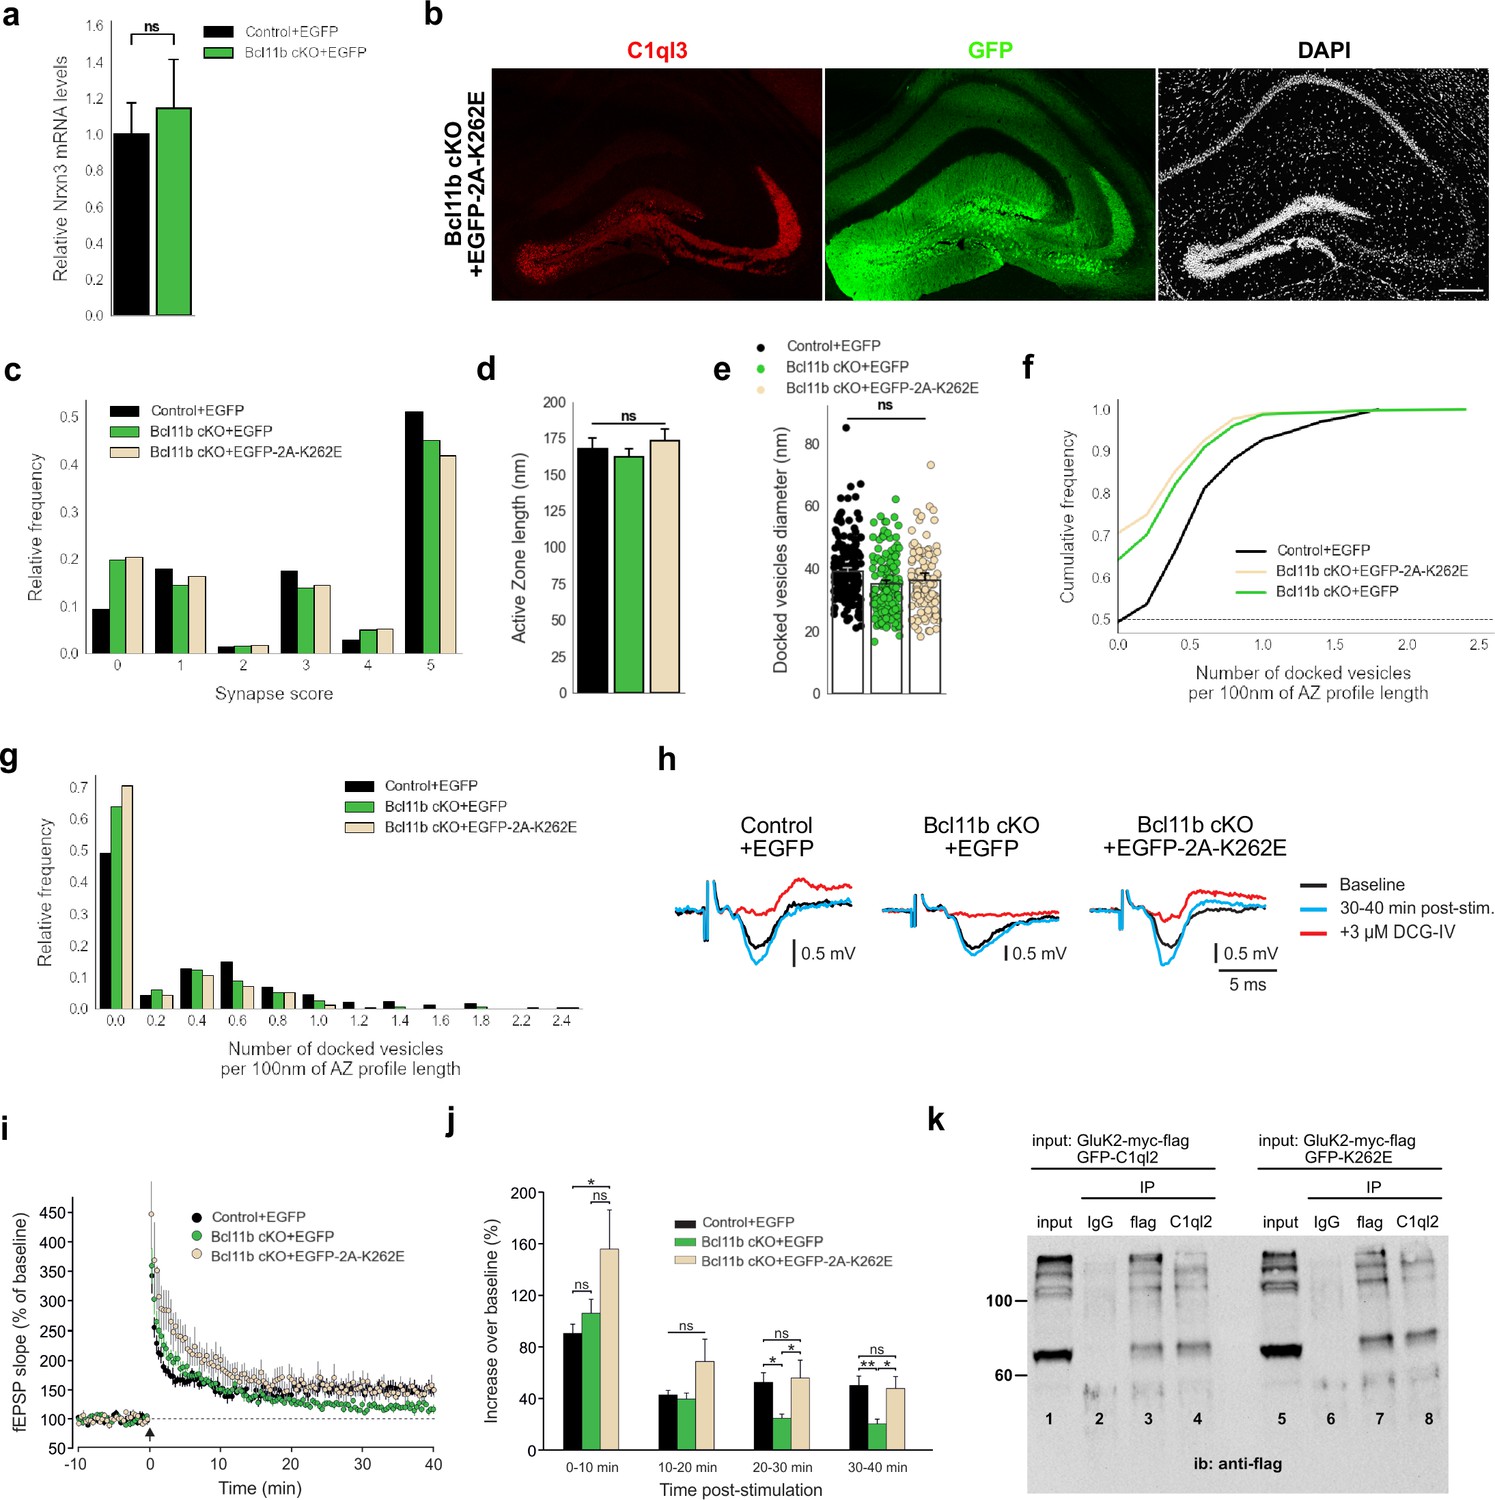
C1ql2-Nrxn3(25b+) interaction is important for SV recruitment at the MFS.
(a) Relative Nrxn3 mRNA levels in DGN. N=3. All data are presented as means; error bars indicate SEM. Unpaired t-test. ns, not significant. (b) Immunohistochemistry for C1ql3 (red) and GFP (green) on hippocampal sections. Scale bar: 200 μm. (c) Relative frequency of synapse scores (refer to Figure 6g). (d) Active zone length. Control +EGFP, Bcl11b cKO +EGFP-2A-K262E: N=3; Bcl11b cKO +EGFP: N=4. All data are presented as means; error bars indicate SEM. Two-way ANOVA. ns, not significant. (e) Diameter of the docked vesicles. Control +EGFP, Bcl11b cKO +EGFP-2A-K262E: N=3; Bcl11b cKO +EGFP: N=4. All data are presented as means; error bars indicate SEM. Points represent the individual examined SV. Two-way ANOVA. ns, not significant. Data for Control +EGFP and Bcl11b cKO +EGFP-2A-K262E from b-f in this figure are compared with Bcl11b cKO +EGFP data from Figure 2. (f Cumulative and g) relative frequency of the number of docked vesicles per 100 nm AZ profile length (refer to Figure 6h). (h) Representative fEPSP traces showing baselines before HFS (black), fEPSP changes 30–40 min after HFS (cyan) and following the application of 3 µM DCG-IV (red). (i) Time course of fEPSP slopes. The black arrow indicates HFS and the dashed line is the baseline level. (j) Quantification of fEPSP facilitation at four different time intervals after HFS. Changes in the fEPSP slope are shown as the percentage of the mean baseline fEPSP. Data for C1ql2.K262E from f-h in this figure are compared with control and Bcl11b cKO data from Figure 3a–c. Control +EGFP, 7 slices from 6 mice; Bcl11b cKO +EGFP, 8 slices from 5 mice; Bcl11b cKO +EGFP-2A-K262E, 5 slices from 4 mice. All data are presented as means; error bars indicate SEM. One-way ANOVA followed by Bonferroni’s PHC for each time interval. 0–10 min: Control +EGFP vs. Bcl11b cKO +EGFP-2A-K262E: *p=0.037; 20–30 min: Control +EGFP vs. Bcl11b cKO +EGFP: *p=0.047; Bcl11b cKO +EGFP vs. Bcl11b cKO +EGFP-2A-K262E: *p=0.042; 30–40 min: Control +EGFP vs. Bcl11b cKO +EGFP: **p=0.009; Bcl11b cKO +EGFP vs. Bcl11b cKO +EGFP-2A-K262E: *p=0.031; ns, not significant. (k) Western blot analysis with flag-tag antibody upon co-immunoprecipitation of HEK293 cells protein extract expressing GluK2-myc-flag and GFP-C1ql2 (lanes 1,2,3, and 4) or GluK2-myc-flag and GFP-K262E (lanes 5,6,7, and 8). Protein extract was precipitated with magnetic beads coupled with anti-flag antibody (lanes 3 and 7) or anti-C1ql2 antibody (lanes 4 and 8). Anti-IgG antibody was used as negative. Expression of GluK2 was verified using protein lysate as input for the co-immunoprecipitation (lanes 1 and 5).
-
Figure 6—figure supplement 1—source data 1
Original file for the Western blot analysis in Figure 6—figure supplement 1k.
- https://cdn.elifesciences.org/articles/89854/elife-89854-fig6-figsupp1-data1-v1.zip
-
Figure 6—figure supplement 1—source data 2
PDF containing Figure 6—figure supplement 1k and original scans of the relevant Western blot analysis with highlighted bands and sample labels.
- https://cdn.elifesciences.org/articles/89854/elife-89854-fig6-figsupp1-data2-v1.zip
Figure 7 with 1 supplement

Nrxn KO perturbs C1ql2 localization at the MFS and SV recruitment.
(a) Experimental design to analyze the MFS after AAV-mediated Nrxn KO. (b) Relative Nrxn3 mRNA levels. N=4. All data are presented as means; error bars indicate SEM. Unpaired t-test. **p=0.007. (c) Immunohistochemistry of C1ql2 (red) and GFP (green) in hippocampal sections. Scale bar: 200 μm. Upper panels depict close-ups of C1ql2 staining from the SL of CA3. Scale bar: 15 μm. (d) Integrated density of C1ql2 fluorescence in the SL of CA3. N=3. All data are presented as means; error bars indicate SEM. Unpaired t-test. *p=0.02. (e) Immunohistochemistry of ZnT3 (red) and GFP (green) in hippocampal sections. Scale bar: 200 μm. Upper right corner of ZnT3 panels depicts close-ups from the SL of CA3. Scale bar: 15 μm. (f) Electron microscope images of MFS and proximal SVs. White bars mark synapse length from postsynaptic side. Scale bar: 100 nm. (g) Average synapse score. N=3. Unpaired t-test. **p=0.009. (h) Number of docked vesicles per 100 nm AZ profile length. N=3. All data are presented as means; error bars indicate SEM. Points represent the individual examined AZ. Unpaired t-test. **p=0.007.
-
Figure 7—source data 1
File containing the raw data for Figure 7, panels b, d, and g-h and for Figure 7—figure supplement 1, panels a-b and d-g.
- https://cdn.elifesciences.org/articles/89854/elife-89854-fig7-data1-v1.xlsx
Figure 7—figure supplement 1
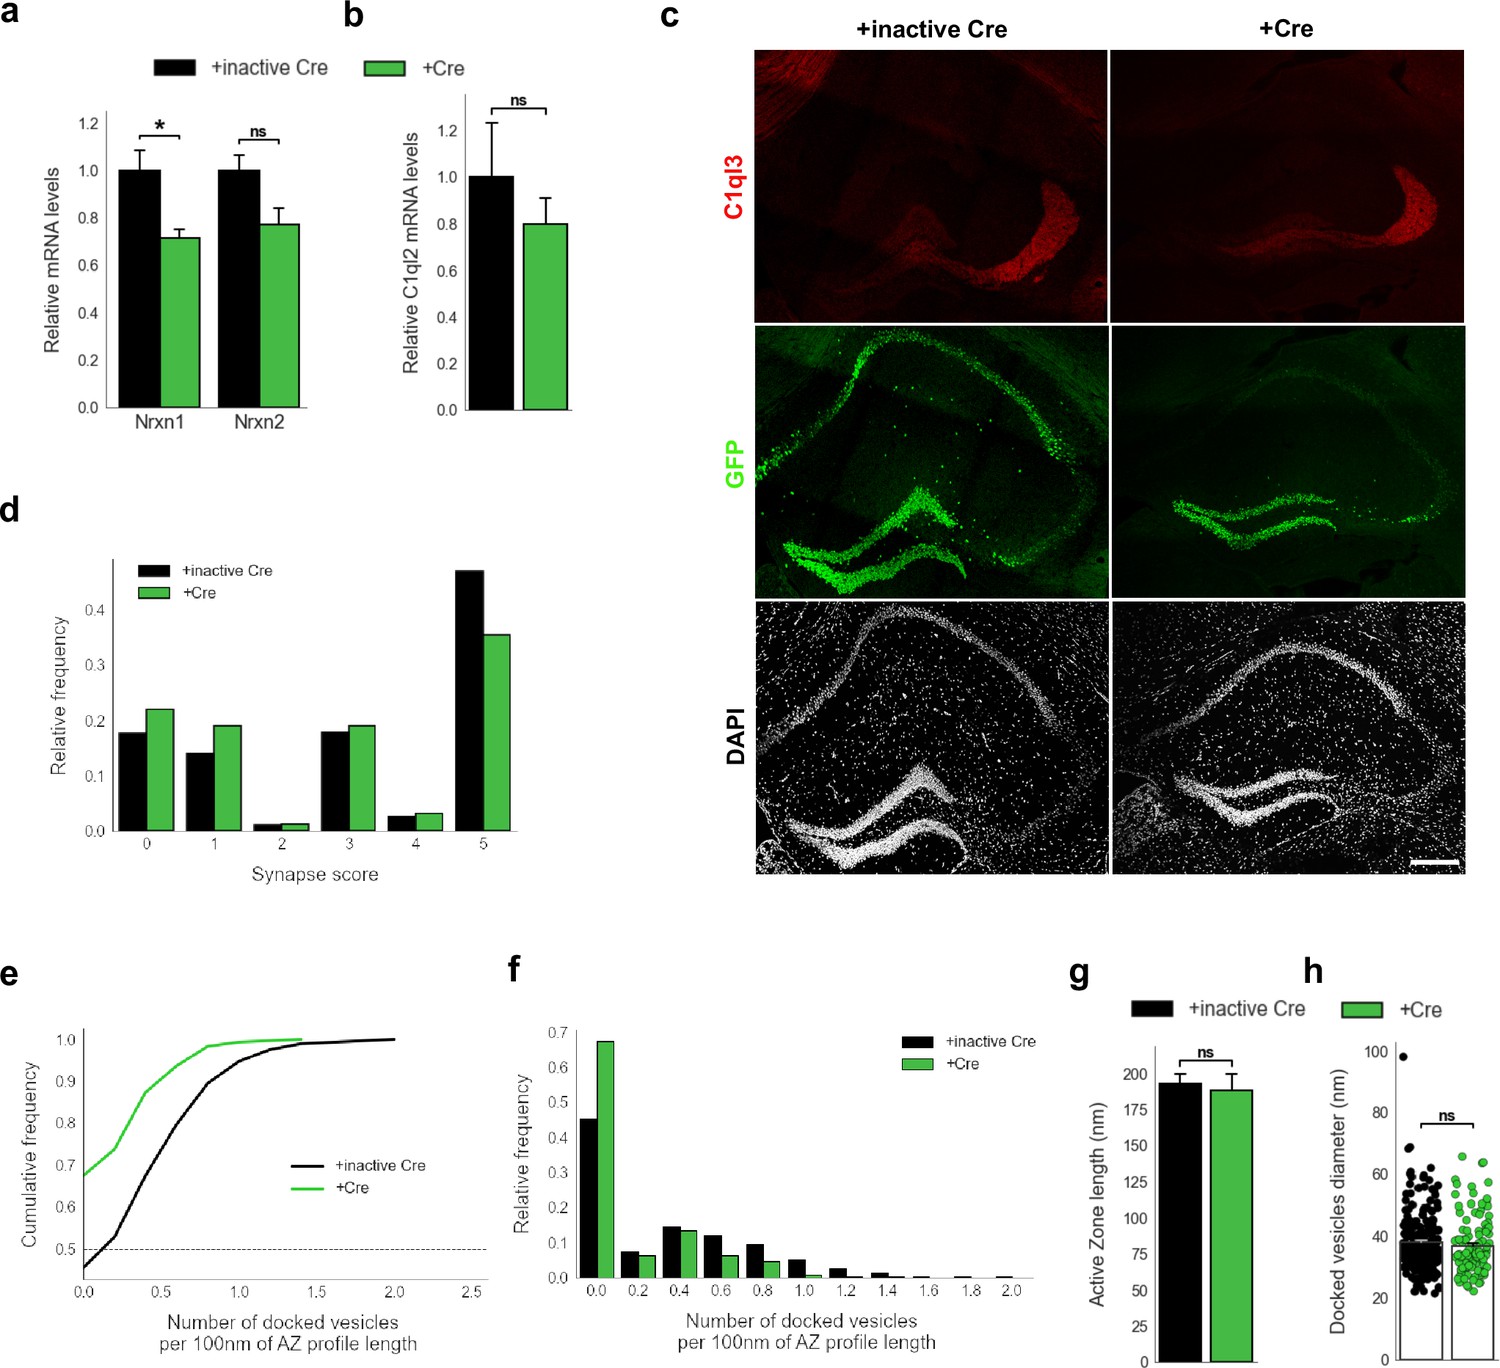
Nrxn KO perturbs SV recruitment at the MFS.
(a) Relative Nrxn1 and Nrxn2 mRNA levels in DGN. N=4. All data are presented as means; error bars indicate SEM. Unpaired t-test. *=0.02; ns, not significant. (b) Relative C1ql2 mRNA levels in DGN. N=4. All data are presented as means; error bars indicate SEM. Unpaired t-test. ns, not significant. (c) Immunohistochemistry for C1ql3 (red) and GFP (green) on hippocampal sections. Scale bar: 200 μm. (d) Relative frequency of synapse scores (refer to Figure 7g). (e) Cumulative and (f) relative frequency of the number of docked vesicles per 100 nm AZ profile length (refer to Figure 7h). (g) Active zone length. N=3. All data are presented as means; error bars indicate SEM. Unpaired t-test. ns, not significant. (h) Diameter of the docked vesicles. N=3. All data are presented as means; error bars indicate SEM. Points represent the individual examined SV. Unpaired t-test. ns, not significant.
Author response image 1

C1ql2 reintroduction in Bcl11b cKO DGN does not significantly alter basal synaptic transmission at mossy fiber-CA3 synapses.
a Input-output curves generated by plotting fEPSP slope against fiber volley amplitude at increasing stimulation intensities. b Quantification of regression line slopes for input-output curves for all three conditions. Control+EGFP, 35 slices from 16 mice; Bcl11b cKO+EGFP, 32 slices from 14 mice; Bcl11b cKO+EGFP-2A-C1ql2, 22 slices from 11 mice. The data are presented as means, error bars represent SEM. Kruskal-Wallis test (non-parametric ANOVA) followed by Dunn’s post hoc pairwise comparisons. p=0.106; ns, not significant.
Author response image 2

Estimation of RRP size using high-frequency stimulus trains at mossy fiber-CA3 synapses.
a Results from field potential recordings. Cumulative fEPSP amplitude in response to a train of 40 stimuli at 100 Hz. All subsequent peak amplitudes were normalized to the amplitude of the first peak. Data points corresponding to putative steady state responses were fit with linear regression (RRP size is indirectly reflected by the intersection of the regression line with the yaxis). Control+EGFP, 6 slices from 5 mice; Bcl11b cKO+EGFP, 6 slices from 3 mice. b Results from single-cell recordings. Cumulative EPSC amplitude in response to a train of 15 stimuli at 50 Hz. The last four stimuli were fit with linear regression. Control, 5 cells from 4 mice; Bcl11b cKO, 3 cells from 3 mice. Note the shallow onset of response amplitudes and the subsequent frequency potentiation. Due to the resulting increase in slope at higher stimulus numbers, intersection with the y-axis occurs at negative values. The differences shown were not found to be statistically significant; unpaired t-test or Mann-Whitney U-test.
Author response image 3

Basal synaptic transmission at mossy fiber-CA3 synapses is unaltered in Bcl11b cKO mice.
a Representative average trace (20 sweeps) recorded from CA3 pyramidal cells in control and Bcl11b cKO mice at minimal stimulation conditions, showing EPSCs in response to paired-pulse stimulation (PPS) at an interstimulus interval of 40 ms. The signal is almost entirely blocked by the application of 2 μM DCG-IV (red). b Quantification of MF EPSC amplitudes in response to PPS for both the first and the second pulse. c Ratio between the amplitude of the second over the first EPSC. d Percentage of stimulation events resulting in no detectable EPSCs for the first pulse. Events <5 pA were considered as noise. e Fast decay time constant obtained by fitting the average second EPSC with the following double exponential function: I(t)=Afaste−t/τfast+Aslowe−t/τslow+C, where I is the recorded current amplitude after time t, Afast and Aslow represent fractional current amplitudes decaying with the fast (τfast) and slow (τslow) time constant, respectively, and C is the offset. Starting from the peak of the EPSC, the first 200 ms of the decaying trace were used for fitting. f Fractional current amplitude decaying with the fast time constant. g-h Slow decay time constant and fractional current amplitude decaying with the slow time constant. For all figures: Control, 8 cells from 4 mice; Bcl11b cKO, 8 cells from 6 mice. All data are presented as means, error bars indicate SEM. None of the differences shown were found to be statistically significant; Mann-Whitney U-test for nonnormally and unpaired t-test for normally distributed data.
Tables
Appendix 1—key resources table
| Reagent type (species) or resource | Designation | Source or reference | Identifiers | Additional information |
|---|---|---|---|---|
| Antibody | Anti-GFP (Chicken Polyclonal) | Abcam | Cat #Ab13970 RRID: AB_300798 | IHC(1:1000) IF(1:1000) |
| Antibody | Anti-Bcl11b (Guinea pig Polyclonal) | Simon et al., 2012 | n/a | IHC(1:1000) |
| Antibody | Anti-Homer1 (Guinea pig Polyclonal) | Synaptic Systems | Cat #160004 RRID: AB_10549720 | IHC(1:250) |
| Antibody | Anti-vGlut1 (Mouse Monoclonal) | Synaptic Systems | Cat #135311 RRID: AB_887880 | IHC(1:100) |
| Antibody | Anti-flag M2 (Mouse Monoclonal) | Sigma-Aldrich | Cat #F3165 RRID: AB_259529 | WB(1:2000) |
| Antibody | Anti-vGlut1 (Guinea pig Polyclonal) | Synaptic Systems | Cat #135304 RRID: AB_887878 | ICC(1:250) |
| Antibody | Anti-β-actin (Mouse Monoclonal) | Sigma-Aldrich | Cat #A5441 RRID: AB_476744 | WB(1:5000) |
| Antibody | Anti-flag (Rabbit Polyclonal) | Sigma-Aldrich | Cat #F7425 RRID: AB_439687 | Co-IP(2 μg) |
| Antibody | Anti-IgG (Rabbit Isotype control) | Cell Signaling Technology | Cat #3900 RRID: AB_1550038 | Co-IP(2 μg) |
| Antibody | Ant-myc-tag (Rabbit Polyclonal) | Abcam | Cat #ab9106 RRID: AB_307014 | ICC(1:1000) |
| Antibody | Anti-C1ql2 (Rabbit Polyclonal) | Invitrogen | Cat #PA5-63504 RRID: AB_2638958 | IHC(1:1000) WB(1:500) |
| Antibody | Anti-C1ql2 (Rabbit Polyclonal) | Sigma-Aldrich | Cat #HPA057934 RRID: AB_2683558 | IHC(1:500) WB(1:500) |
| Antibody | Anti-C1ql3 (Rabbit Polyclonal) | Biozol | Cat #bs-9793R | IHC(1:500) |
| Antibody | Anti-ZnT3 (Rabbit Polyclonal) | Synaptic Systems | Cat #197003 RRID: AB_2737039 | IHC(1:2500) |
| Strain, strain background (adenovirus-associated virus) | AAV-DJ_8/2-hSyn1-chI[4xsh(mC1ql2)]-EGFP-WPRE-bGHp(A) | This paper | n/a | AAV expressing an shRNA cassette against mC1ql2 |
| Strain, strain background (adenovirus-associated virus) | AAV-DJ_8/2-hSynI-chI[4 x(m/rshNS)]-EGFP-WPRE-bGHp(A) | Viral Vector Facility, ZNZ | Cat #v668-DJ/8 | |
| Strain, strain background (adenovirus-associated virus) | AAV-DJ_8/2-mCaMKIIa-EGFP_2 A_C1QL2-WPRE-hGHp(A) | This paper | n/a | AAV expressing EGFP and C1ql2 |
| Strain, strain background (adenovirus-associated virus) | AAV-DJ_8/2-mCaMKIIa-EGFP_2 A_C1QL2.K262E-WPRE-hGHp(A) | This paper | n/a | AAV expressing EGFP and C1ql2 variant K262E |
| Strain, strain background (adenovirus-associated virus) | AAV-DJ_8/2-mCaMKIIa-EGFP_2 A_C1QL3-WPRE-hGHp(A) | This paper | n/a | AAV expressing EGFP and C1ql3 |
| Strain, strain background (adenovirus-associated virus) | AAV-DJ_8/2-hSyn1-chI-EGFP_Cre(Y324F)-WPRE-bGHp(A) | This paper | n/a | AAV expressing inactive Cre |
| Strain, strain background (adenovirus-associated virus) | AAV-DJ_8/2-hSyn1-chI-EGFP_iCre-WPRE-bGHp(A) | Viral Vector Facility, ZNZ | Cat #v750-DJ/8 | |
| Strain, strain background (adenovirus-associated virus) | AAV-DJ_8/2-mCaMKIIα-EGFP-WPRE-hGHp(A) | Viral Vector Facility, ZNZ | Cat #v113-DJ/8 | |
| Chemical compound, drug | B27 | Gibco | Cat #17504044 | |
| Chemical compound, drug | Benzonase | Millipore | Cat #71206 | |
| Chemical compound, drug | cOmplete EDTA-free proteinase inhibitor | Roche | Cat #11873580001 | |
| Chemical compound, drug | DCG-IV | Tocris Bioscience | Cat #0975 | |
| Chemical compound, drug | DMEM | Gibco | Cat #31966047 | |
| Chemical compound, drug | Fetal bovine serum | Gibco | Cat #10082147 | |
| Chemical compound, drug | Forskolin | Biomol | Cat #AG-CN2-0089 | |
| Chemical compound, drug | Igepal | Sigma-Aldrich | Cat #I3021 | |
| Chemical compound, drug | L-Glutamine | Gibco | Cat #25030149 | |
| Chemical compound, drug | N2 | Gibco | Cat #A1370701 | |
| Chemical compound, drug | Neurobasal A | Gibco | Cat #10888022 | |
| Chemical compound, drug | NGF | Gibco | Cat #13290010 | |
| Chemical compound, drug | Opti-MEM | Gibco | Cat #31985062 | |
| Chemical compound, drug | Poly-L-Lysine | Sigma-Aldrich | Cat #P2636 | |
| Chemical compound, drug | Tamoxifen | Sigma-Aldrich | Cat #T5648 | |
| Chemical compound, drug | Trypsin | Gibco | Cat #15090046 | |
| Commercial assay or kit | Dynabeads Protein A for Immunoprecipitation | Invitrogen | Cat #10001D | |
| Commercial assay or kit | LightCycler DNA Master SYBR Green I Master | Roche | Cat #04707516001 | |
| Commercial assay or kit | Lipofectamin 2000 | Invitrogen | Cat #11668030 | |
| Commercial assay or kit | Lipofectamin 3000 | Invitrogen | Cat #L3000001 | |
| Commercial assay or kit | Pierce ECL western blotting substrate | ThermoFisherScientific | Cat #32209 | |
| Commercial assay or kit | Q5 Site-Directed Mutagenesis Kit | New England Laboratories | Cat #E0554S | |
| Commercial assay or kit | RNeasy Micro Kit | Qiagen | Cat #74004 | |
| Cell line (Homo-sapiens) | Human Embryonic Kidney (HEK) 293 | ATCC | Cat #PTA-4488 RRID: CVCL_0045 | Female |
| Cell line (M. musculus) | Primary | This paper | n/a | Hippocampal primary neurons from P0 C57BL/6JRj mice |
| Cell line (M. musculus) | Primary | This paper | n/a | Hippocampal primary neurons from P0 Nrxn1, 2 & 3 flox/flox mice |
| Strain, strain background (M. musculus) | Bcl11bflox/flox; CamKIIa-CreERT2 | De Bruyckere et al., 2018 | n/a | |
| Strain, strain background (M. musculus) | C57BL/6JRj | Janvier Labs | RRID:MGI:2670020 | |
| Strain, strain background (M. musculus) | C57BL/6 N | Charles River Laboratories | Strain code: 027 | |
| Strain, strain background (M. musculus) | Nrxn1, 2 & 3 flox/flox | Jurrus et al., 2018 | n/a | |
| Recombinant DNA reagent | pAAV-8/2-hSyn1-chI[4xsh(mC1ql2)]-EGFP-WPRE-bGHp(A) | This paper | n/a | Plasmid for production of relevant AAV |
| Recombinant DNA reagent | pAAV-DJ_8/–2-mCaMKIIa-EGFP_2 A_C1QL2-WPRE-hGHp(A) | This paper | n/a | Plasmid for production of relevant AAV |
| Recombinant DNA reagent | pAAV-DJ_8/–2-mCaMKIIa-EGFP_2 A_C1QL2.K262E-WPRE-hGHp(A) | This paper | n/a | Plasmid for production of relevant AAV |
| Recombinant DNA reagent | pAAV-DJ_8/–2-mCaMKIIa-EGFP_2 A_C1QL3-WPRE-hGHp(A) | This paper | n/a | Plasmid for production of relevant AAV |
| Recombinant DNA reagent | pAAV-DJ_8/2-hSyn1-chI-EGFP_Cre(Y324F)-WPRE-bGHp(A) | This paper | n/a | Plasmid for production of relevant AAV |
| Recombinant DNA reagent | pCMV-GluK2-myc-flag (plasmid) | OriGene | Cat #MR219233 | |
| Recombinant DNA reagent | pCMV-Igk-GFP-C1ql2 | This paper | n/a | Expression plasmid for secreted GFP tagged C1ql2 |
| Recombinant DNA reagent | pCMV-Igk-GFP-C1ql2.K262E | This paper | n/a | Expression plasmid for secreted GFP tagged C1ql2 variant K262E |
| Recombinant DNA reagent | pCMV-Igk-His-myc-C1ql2 | This paper | n/a | Expression plasmid for secreted His-myc tagged C1ql2 |
| Recombinant DNA reagent | pCMV-Igk-His-myc-C1ql2.K262E | This paper | n/a | Expression plasmid for secreted His-myc tagged C1ql2 variant K262E |
| Recombinant DNA reagent | pSecTag2A | Invitrogen | Cat #V90020 | |
| Recombinant DNA reagent | pSyn1-EGFP-Nrxn3a(25b+) | This paper | n/a | Expression plasmid for GFP tagged Nrxn3a(25b+) |
| Recombinant DNA reagent | pSyn1-nls-EGFP-Cre (plasmid) | Wang et al., 2016 | n/a | |
| Recombinant DNA reagent | pSyn1-nls-EGFP-Cre.Y324F (plasmid) | Klatt et al., 2021 | n/a | |
| Software, algorithm | Fiji v2.14.0 | NIH | RRID:SCR_002285 | |
| Software, algorithm | CorelDRAW | Corel Corporation | X4 | |
| Software, algorithm | GraphPad v3.10 | InStat | RRID:SCR_000306 | |
| Software, algorithm | ImageSP | Tröndle | n/a | |
| Software, algorithm | Leica Application Suite X | Leica | RRID:SCR_013673 | |
| Software, algorithm | SigmaPlot v11.0 | Systat | RRID:SCR_003210 | |
| Software, algorithm | Spike2 v7 | CED | RRID:SCR_000903 |
Additional files
Download links
A two-part list of links to download the article, or parts of the article, in various formats.
Downloads (link to download the article as PDF)
Open citations (links to open the citations from this article in various online reference manager services)
Cite this article (links to download the citations from this article in formats compatible with various reference manager tools)
Regulation of hippocampal mossy fiber-CA3 synapse function by a Bcl11b/C1ql2/Nrxn3(25b+) pathway
eLife 12:RP89854.
https://doi.org/10.7554/eLife.89854.3


