Microbes with higher metabolic independence are enriched in human gut microbiomes under stress
- Biophysical Sciences Program, The University of Chicago, United States
- Department of Medicine, The University of Chicago, United States
- Data Science Institute and Department of Biomedical Data Science, Stanford University, United States
- Committee on Microbiology, The University of Chicago, United States
- MARUM Center for Marine Environmental Sciences, University of Bremen, Germany
- Department of Biostatistics, University of Washington, United States
- Toyota Technological Institute at Chicago, United States
- Lundbeck Foundation GeoGenetics Centre, GLOBE Institute, University of Copenhagen, Denmark
- Institute for Chemistry and Biology of the Marine Environment, University of Oldenburg, Germany
- Marine ‘Omics Bridging Group, Max Planck Institute for Marine Microbiology, Germany
- Helmholtz Institute for Functional Marine Biodiversity, Germany
- Alfred Wegener Institute for Polar and Marine Research, Germany
Figures
Figure 1
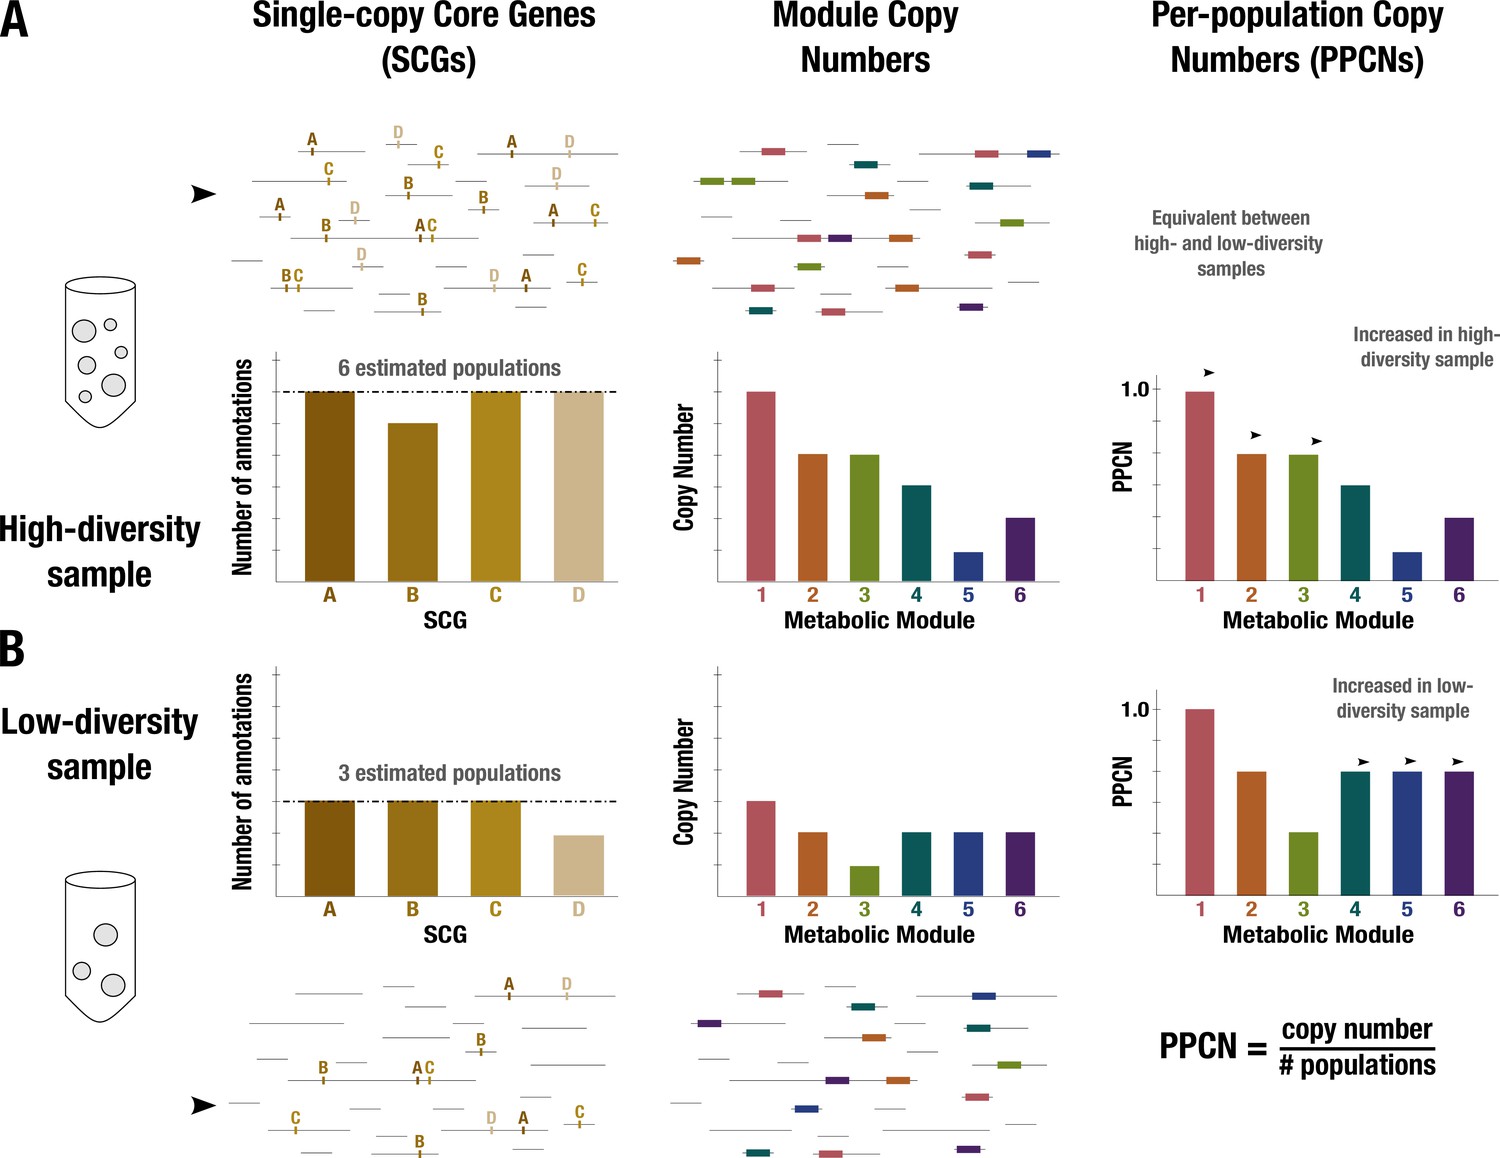
Conceptual diagram of per-population copy number (PPCN) calculation.
Each step of the calculation is demonstrated in (A) for a sample with high diversity (six microbial populations) and in (B) for a sample with low diversity (three populations). Metagenome sequences are shown as black lines. The left panel shows the single-copy core genes (SCGs) annotated in the metagenome (indicated by letters), with a barplot showing the counts for different SCGs. The dashed black line indicates the mode of the counts, which is taken as the estimate of the number of populations. The middle panel shows the annotations of metabolic modules (indicated by boxes and numerically labeled), with a barplot showing the copy number of each module (for more details on how this copy number is computed, see Appendix 1 and Appendix 1—figure 2). The right panel shows the equation for PPCN, with the barplots indicating the PPCN values for each metabolic module in each sample and arrows differentiating between different types of modules based on the comparison of their normalized copy numbers between samples.
Figure 2
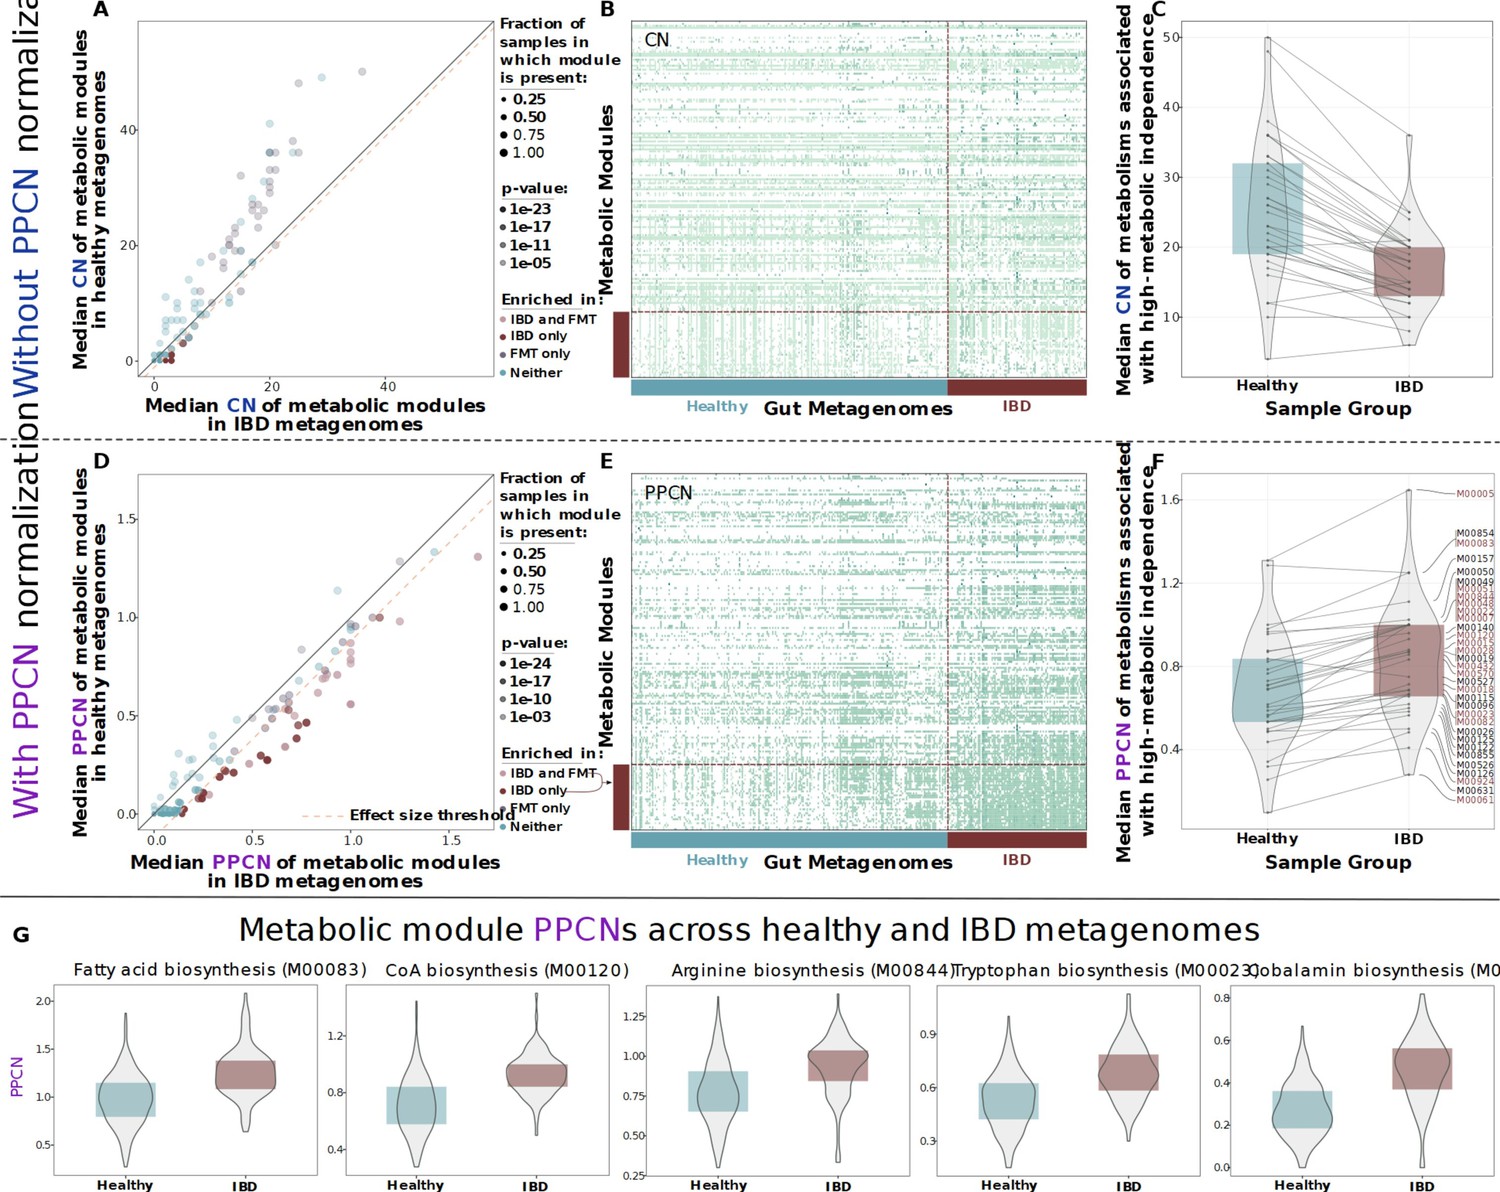
Comparison of metabolic potential across healthy and inflammatory bowel disease (IBD) cohorts.
Panels A–C show unnormalized copy number data and the remaining panels show normalized per-population copy number (PPCN) data. (A) Scatterplot of module copy number in IBD samples (x-axis) and healthy samples (y-axis). Transparency of points indicates the p-value of the module in a Wilcoxon rank-sum test for enrichment (based on copy number data), and color indicates whether the module is enriched in the IBD samples (in this study), enriched in the good colonizers from the fecal microbiota transplant (FMT) study (Watson et al., 2023), or enriched in both. The pink dashed line indicates the effect size threshold applied to modules when determining their enrichment in IBD. (B) Heatmap of unnormalized copy numbers for all modules. The 33 modules that were found to be IBD-enriched based on PPCN data are highlighted by the red bar on the left. Sample group is indicated by the blue (healthy) and red (IBD) bars on the bottom. (C) Boxplots of median copy number for each module enriched in the FMT colonizers from Watson et al., 2023, in the healthy samples (blue) and the IBD samples (red). Solid lines connect the same module in each plot. (D) Scatterplot of module PPCN values in IBD samples (x-axis) and healthy samples (y-axis). Transparency and color of points are defined as in panel A, but based on PPCN data. The pink dashed line indicates the effect size threshold applied to modules when determining their enrichment in IBD. (E) Heatmap of PPCN values for all modules. Side bars defined as in (B). (F) Boxplots of median PPCN values for modules enriched in the FMT colonizers from Watson et al., 2023, in the healthy samples (blue) and the IBD samples (red). Lines defined as in (D). Modules that were also enriched in the IBD samples (in this study) are highlighted in red. (G) Boxplots of PPCN values for individual modules in the healthy samples (blue) and the IBD samples (red). All example modules were enriched in both this study and in Watson et al., 2023.
Figure 3
Identification of high metabolic independence (HMI) genomes and their distribution across gut samples.
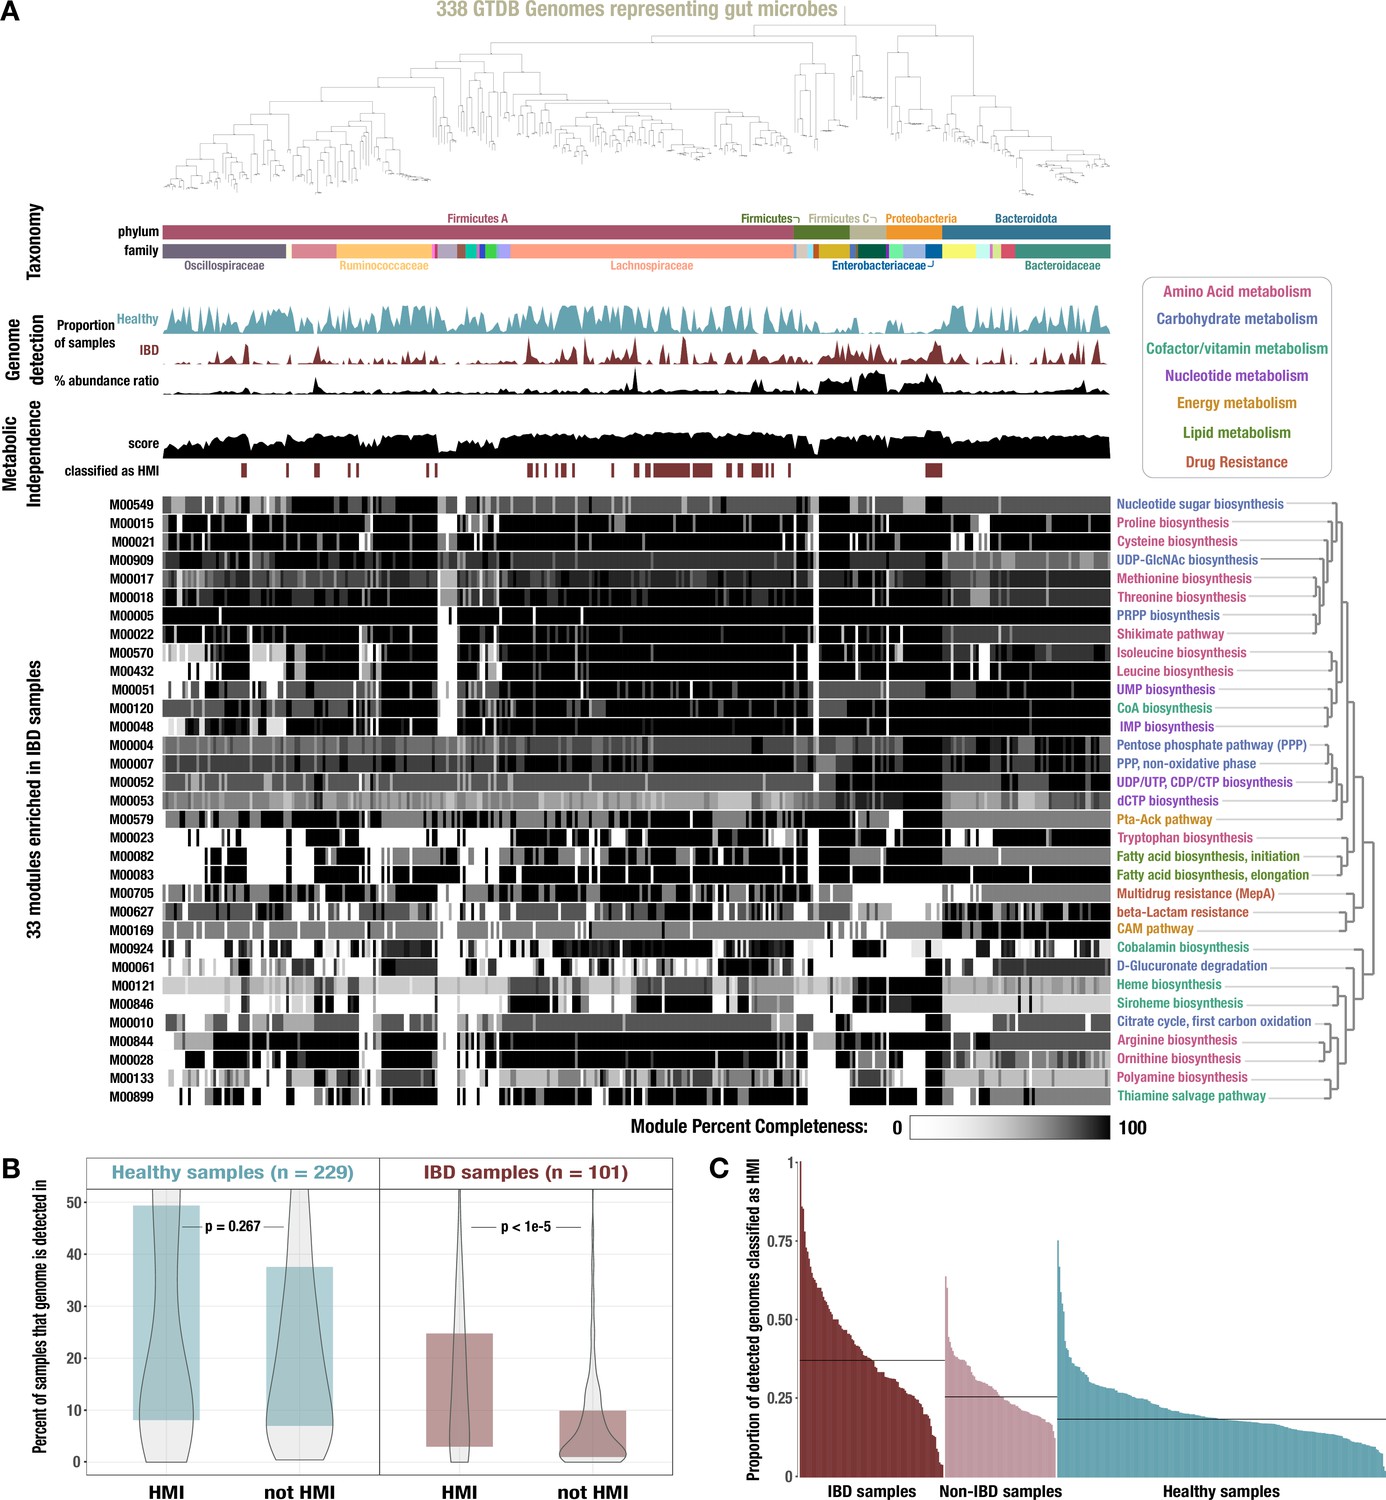
(A) The phylogeny of 338 gut-associated genomes from the Genome Taxonomy Database (GTDB) along with the following data, from top to bottom: taxonomic classification as assigned by GTDB; proportion of healthy samples with at least 50% detection of the genome sequence; proportion of inflammatory bowel disease (IBD) samples with at least 50% detection of the genome sequence; square-root normalized ratio of percent abundance in IBD samples to percent abundance in healthy samples; metabolic independence score (sum of completeness scores of 33 HMI-associated metabolic modules); whether (red) or not (white) the genome is classified as having HMI with a threshold score of 26.4; heatmap of completeness scores for each of the 33 HMI-associated metabolic modules (0% completeness is white and 100% completeness is black). Module name is shown on the right and colored according to its category of metabolism. (B) Boxplot showing the proportion of healthy (blue) or IBD (red) samples in which genomes of each class are detected ≥ 50%, with p-values from a Wilcoxon rank-sum test on the underlying data. (C) Barplot showing the proportion of detected genomes (with ≥ 50% genome sequence covered by at least 1 read) in each sample that are classified as HMI, for each group of samples. The black lines show the median for each group: 37.0% for IBD samples, 25.5% for non-IBD samples, and 18.4% for healthy samples.
Figure 4

Performance of our metagenome classifier trained on per-population copy numbers (PPCNs) of inflammatory bowel disease (IBD)-enriched modules.
(A) Receiver operating characteristic (ROC) curves for 25-fold cross-validation. Each fold used a random subset of 80% of the data for training and the other 20% for testing. In each fold, we calculated a set of IBD-enriched modules from the training dataset and used the PPCN of these modules to train a logistic regression model whose performance was evaluated using the test dataset. Light gray lines show the ROC curve for each fold, the dark blue line shows the mean ROC curve, the gray area delineates the confidence interval for the mean ROC, and the pink dashed line indicates the benchmark performance of a naive (random guess) classifier. (B) Confusion matrix for each fold of the random cross-validation. Categories of classification, from top left to bottom right, are: true positives (correctly classified IBD samples), false positives (incorrectly classified healthy samples), false negatives (incorrectly classified IBD samples), and true negatives (correctly classified healthy samples). Each fold is represented by a box within each category. Opacity of the box indicates the proportion of samples in that category, and the actual proportion is written within the box with one significant digit. Underlying data for this matrix can be accessed in Supplementary file 4d.
Figure 5
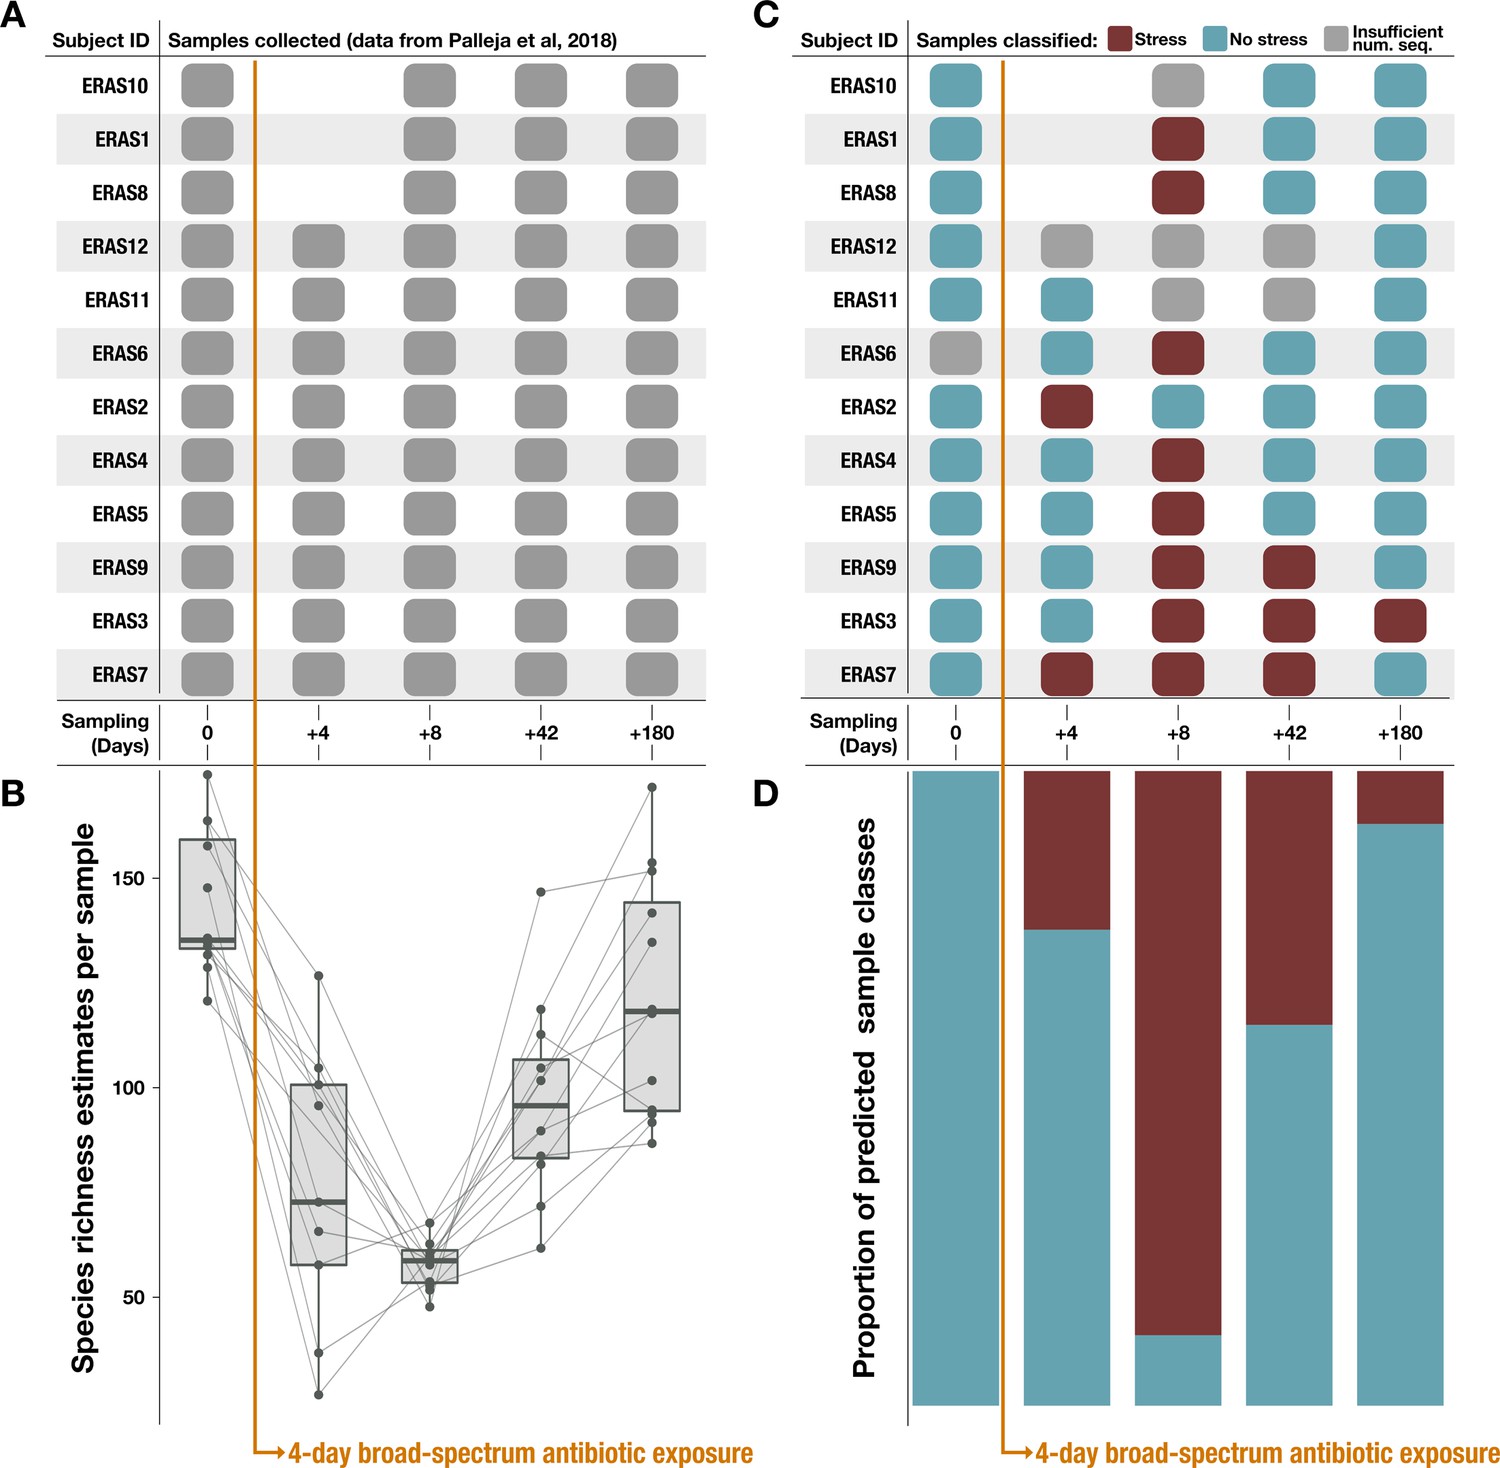
Classification results on an antibiotic time-series dataset from Palleja et al., 2018.
Note that antibiotic treatment was taken on days 1–4. (A) Samples collected per subject during the time series. (B) Species richness data (figure created using data from Palleja et al., 2018). (C) Classification of each sample by the metabolism classifier profiled in Figure 4. Samples with insufficient sequencing depth were not classified. (D) Proportion of classes assigned to samples per day in the time series. Samples classified as ‘healthy’ by the model were considered to have ‘no stress’ (blue), while samples classified as inflammatory bowel disease (‘IBD’) were considered to be under ‘stress’ (red).
Appendix 1—figure 1
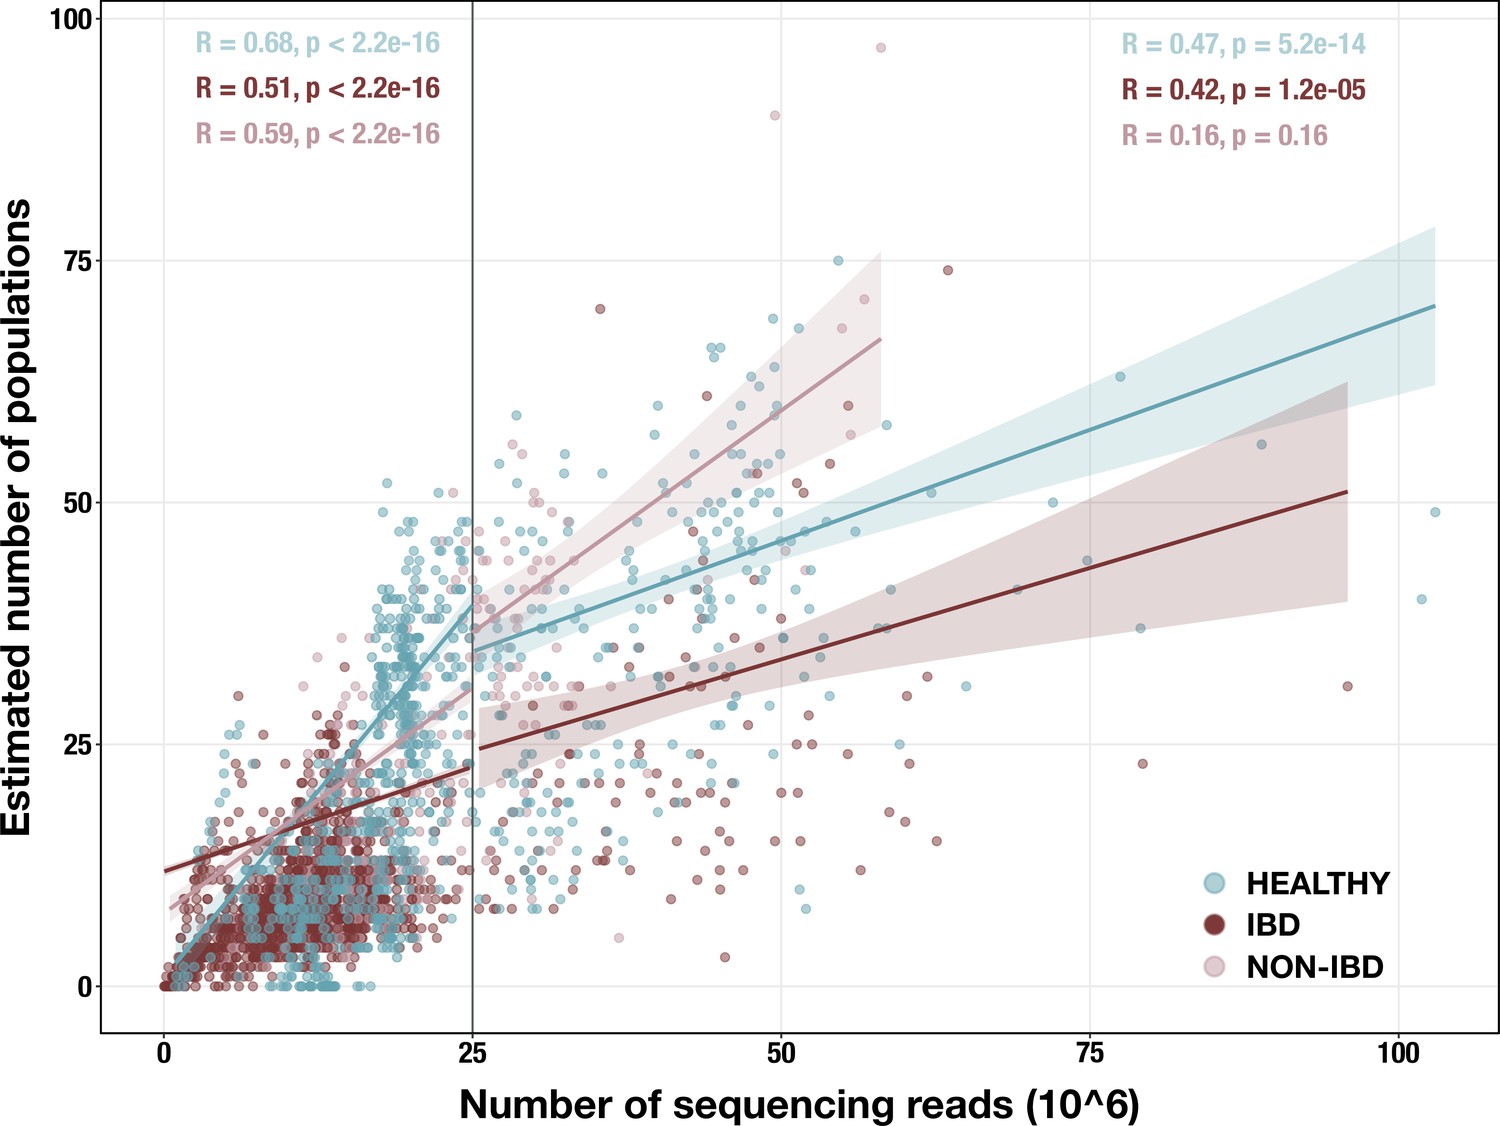
Scatterplot of sequencing depth vs estimated number of microbial populations in each of 2893 stool metagenomes.
Sequencing depth is represented by the number of R1 reads, except for (Vineis et al., 2016) samples, in which case it is the number of merged paired-end reads. The vertical line indicates our sequencing depth threshold of 25 million reads. Per-group Spearman’s correlation coefficients and p-values are shown for the subset of samples with depth < 25 million reads (top left) and for the subset with depth ≥ 25 million reads (top right). Regression lines are shown for each group in each subset, with standard error indicated by the colored background.
Appendix 1—figure 2
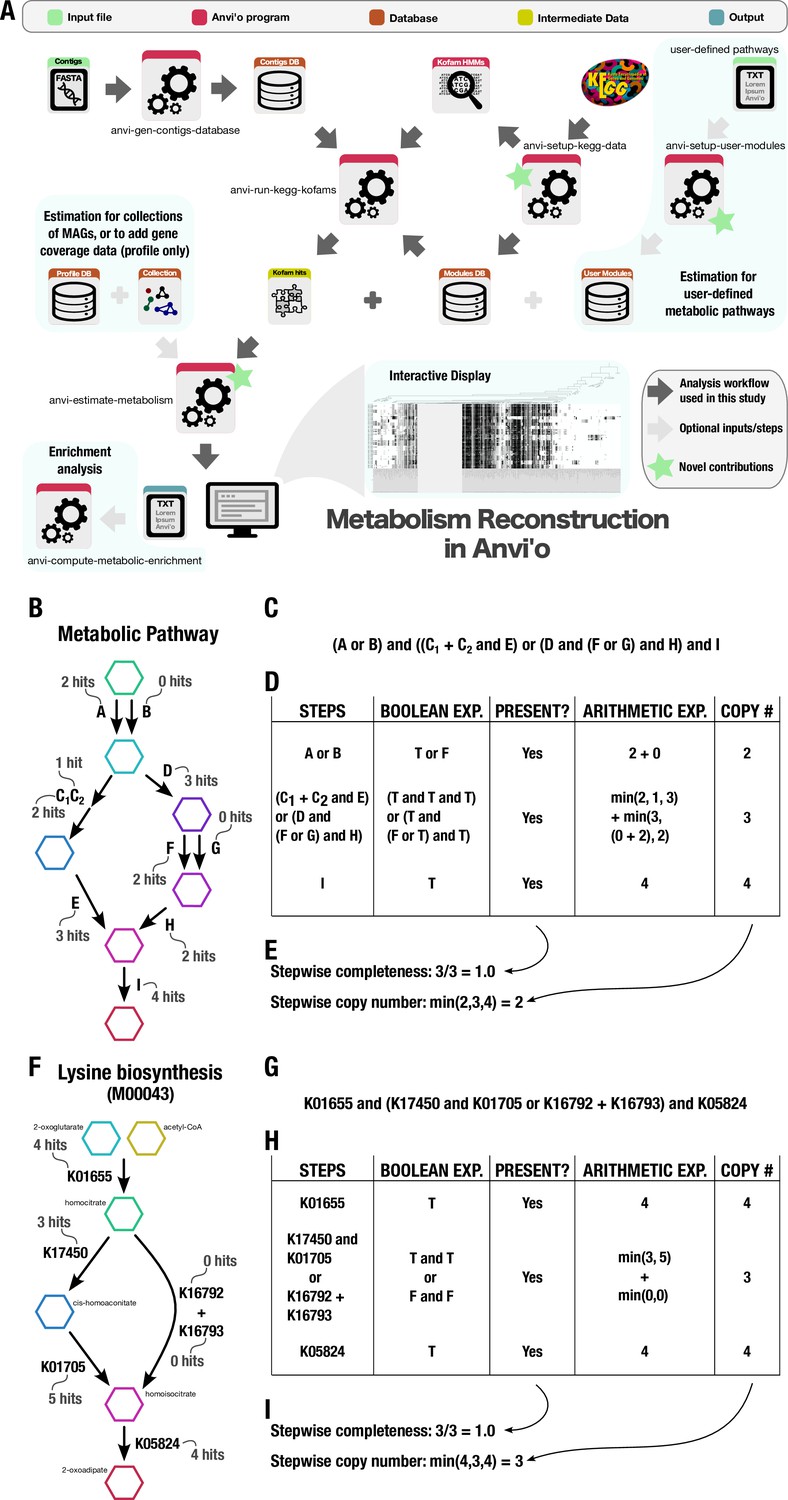
Technical details of the metabolism reconstruction software framework in anvi’o.
(A) Workflow of metabolism reconstruction programs and their inputs/outputs. Dark arrows indicate the primary analysis path utilized in this study. Blue background indicates optional features in the framework. A demonstration of completeness score and copy number calculations for metabolic pathways performed by the program ‘anvi-estimate-metabolism’ is shown using example enzyme annotation data in panels B–E (for a theoretical pathway) and F–I (for a real pathway). (B) Theoretical metabolic pathway, where hexagons represent metabolites, arrows represent chemical reactions, letters represent enzymes (subscripts indicate enzyme components), and the example number of gene annotation hits for each enzyme is written in gray. (C) The definition of the theoretical pathway from panel B, written in terms of the required enzymes. (D) Table showing the major steps in the pathway and example calculations for step presence and copy number. Step presence is calculated by evaluating a Boolean expression created from the step definition in which enzymes with > 0 hits are replaced with True (T) and the others with False (F). Step copy number is calculated by evaluating the corresponding arithmetic expression in which the enzymes are replaced with their annotation counts. (E) Final calculations of completeness score (fraction of present steps) and copy number for the theoretical metabolic pathway. (F–I) Same as panels B–E, but for KEGG module M00043. A high-resolution version of this figure is available at https://doi.org/10.6084/m9.figshare.22851173.
Appendix 1—figure 3
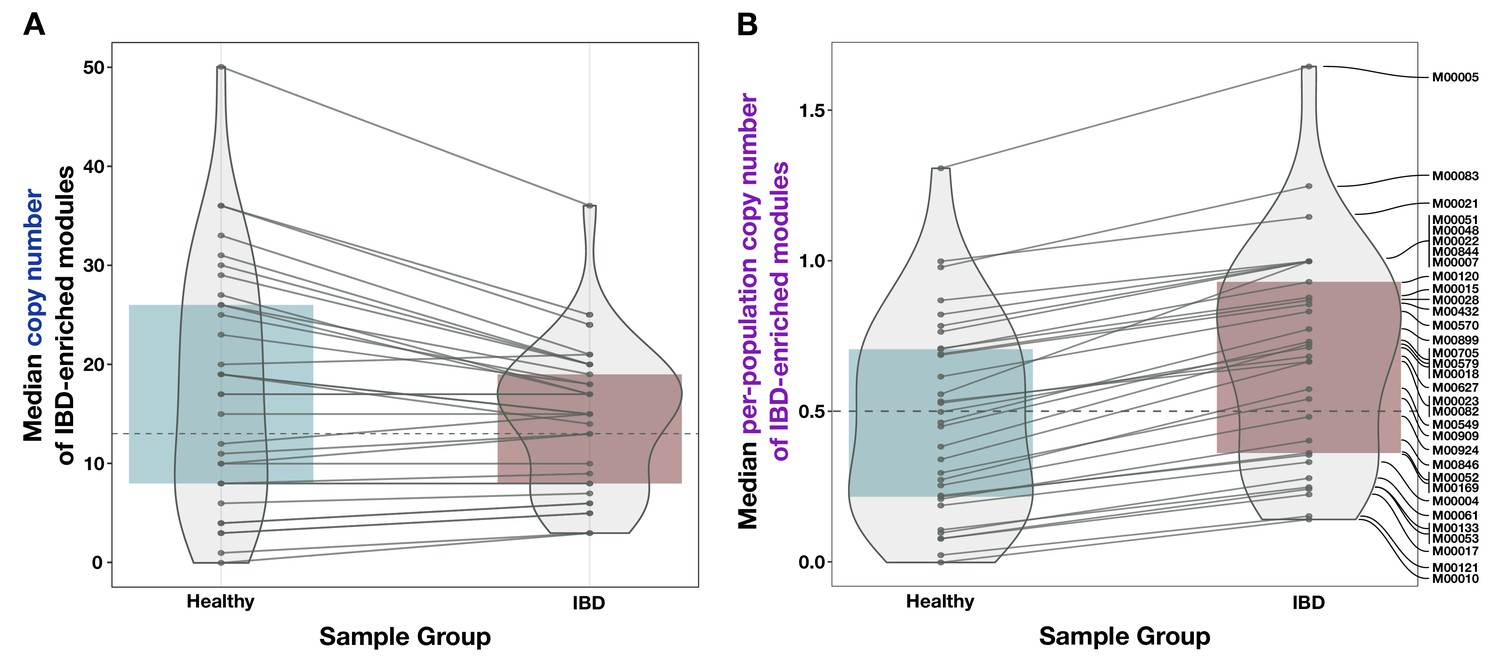
Comparison of unnormalized copy number data and normalized per-population copy number (PPCN) data for the inflammatory bowel disease (IBD)-enriched modules.
(A) Boxplot of median copy numbers for each module in the healthy samples (blue) and IBD samples (red). (B) Boxplots of median PPCN for each module in the healthy samples (blue) and IBD samples (red). Lines connect data points for the same module in each plot. The gray dashed line in each plot indicates the overall median value.
Appendix 1—figure 4
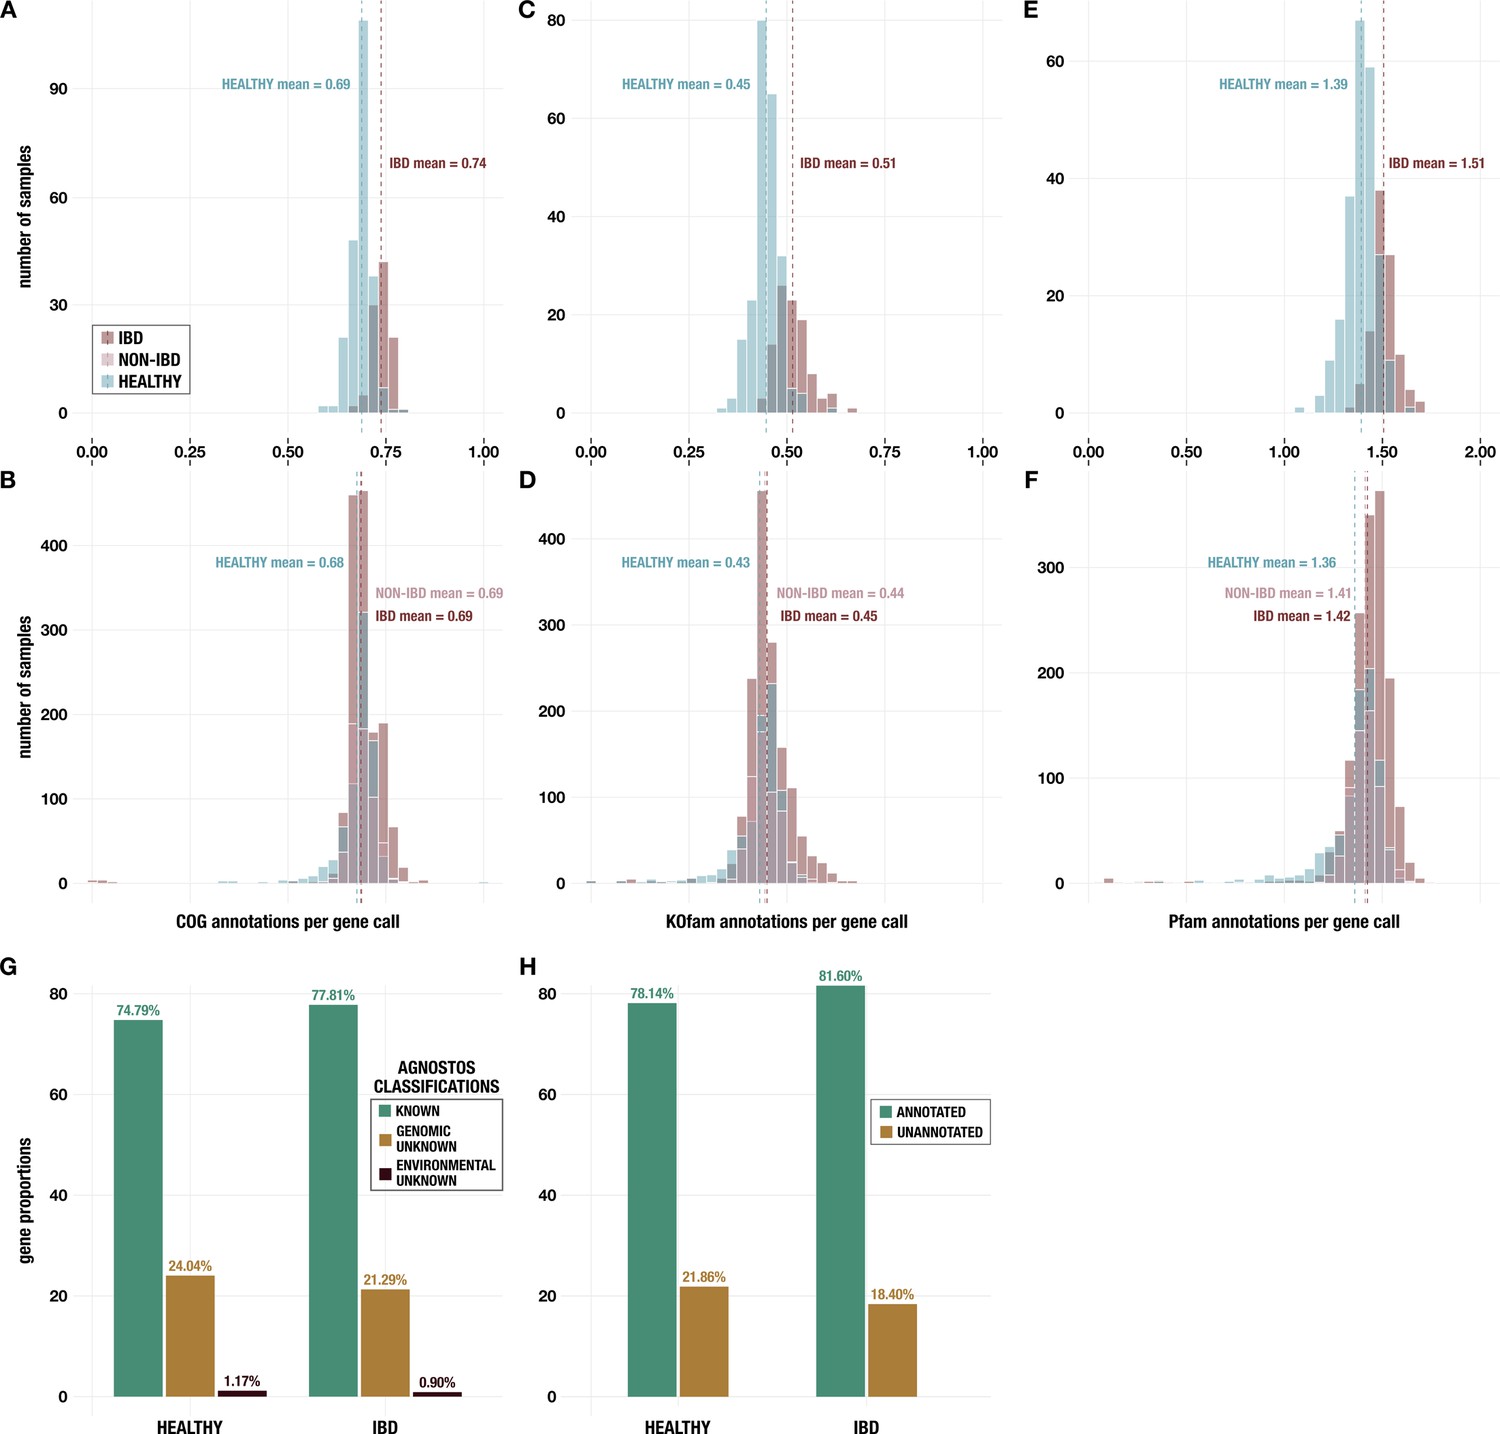
Histograms of annotations per gene call from (A, B) NCBI Clusters of Orthologous Groups (COGs); (C, D) KEGG KOfams; and (E, F) Pfams.
Panels A, C, and E show data for metagenomes in the subset of 330 deeply sequenced samples from healthy people and people with inflammatory bowel disease (IBD), and panels B, D, and F show data for all 2893 samples including those from non-IBD controls. (G) Proportion of genes with each classification from AGNOSTOS (Vanni et al., 2022) in the subset of 330 deeply sequenced samples. (H) Proportion of genes with at least one annotation from KEGG KOfams (Aramaki et al., 2020), NCBI COGs (Galperin et al., 2015), or Pfams (Mistry et al., 2021) (green) and proportion without any annotation (brown) in the subset of 330 deeply sequenced samples.
Appendix 1—figure 5
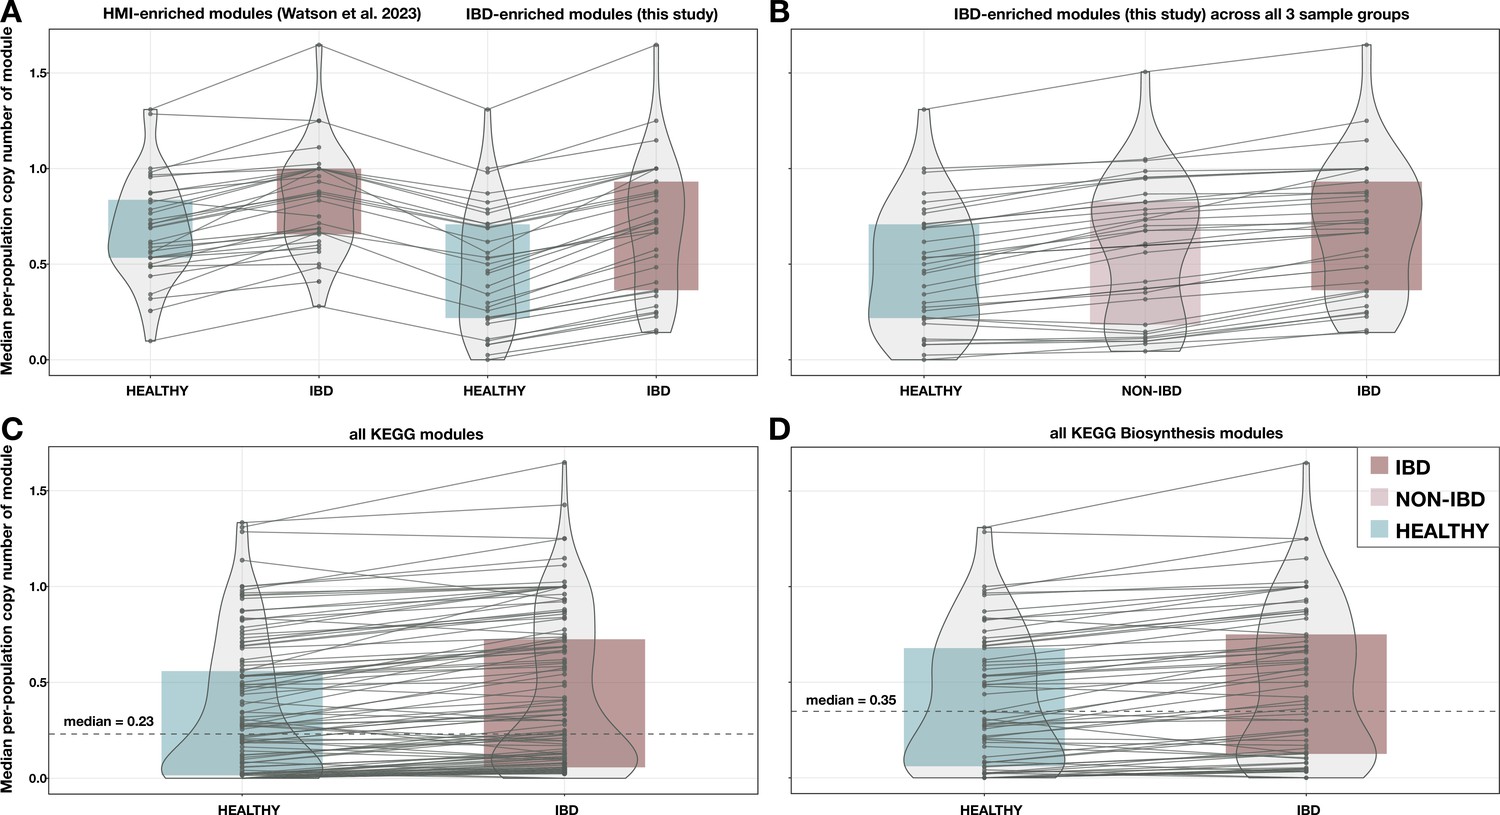
Additional boxplots of median per-population copy number for various subsets of metabolic pathways and metagenome samples.
(A) 33 modules enriched in high metabolic independence (HMI) populations from Watson et al., 2023, compared to the 33 inflammatory bowel disease (IBD)-enriched modules from this study, with medians computed in the set of deeply sequenced healthy (n = 229) and IBD (n = 101) samples. (B) The 33 IBD-enriched modules from this study, with medians computed in the set of deeply sequenced healthy (n = 229), non-IBD (n = 78), and IBD (n = 101) samples. (C) All KEGG modules (n = 117) with nonzero copy number in at least one sample, with medians computed in the set of deeply sequenced healthy (n = 229) and IBD (n = 101) samples. (D) All biosynthesis modules (n = 88) from the KEGG MODULE database, with medians computed in the set of deeply sequenced healthy (n = 229) and IBD (n = 101) samples. Where applicable, dashed lines indicate the overall median for all modules, and solid lines connect the points for the same module in each sample group. The IBD sample group is highlighted in red, the NON-IBD group in pink, and the HEALTHY group in blue.
Appendix 1—figure 6
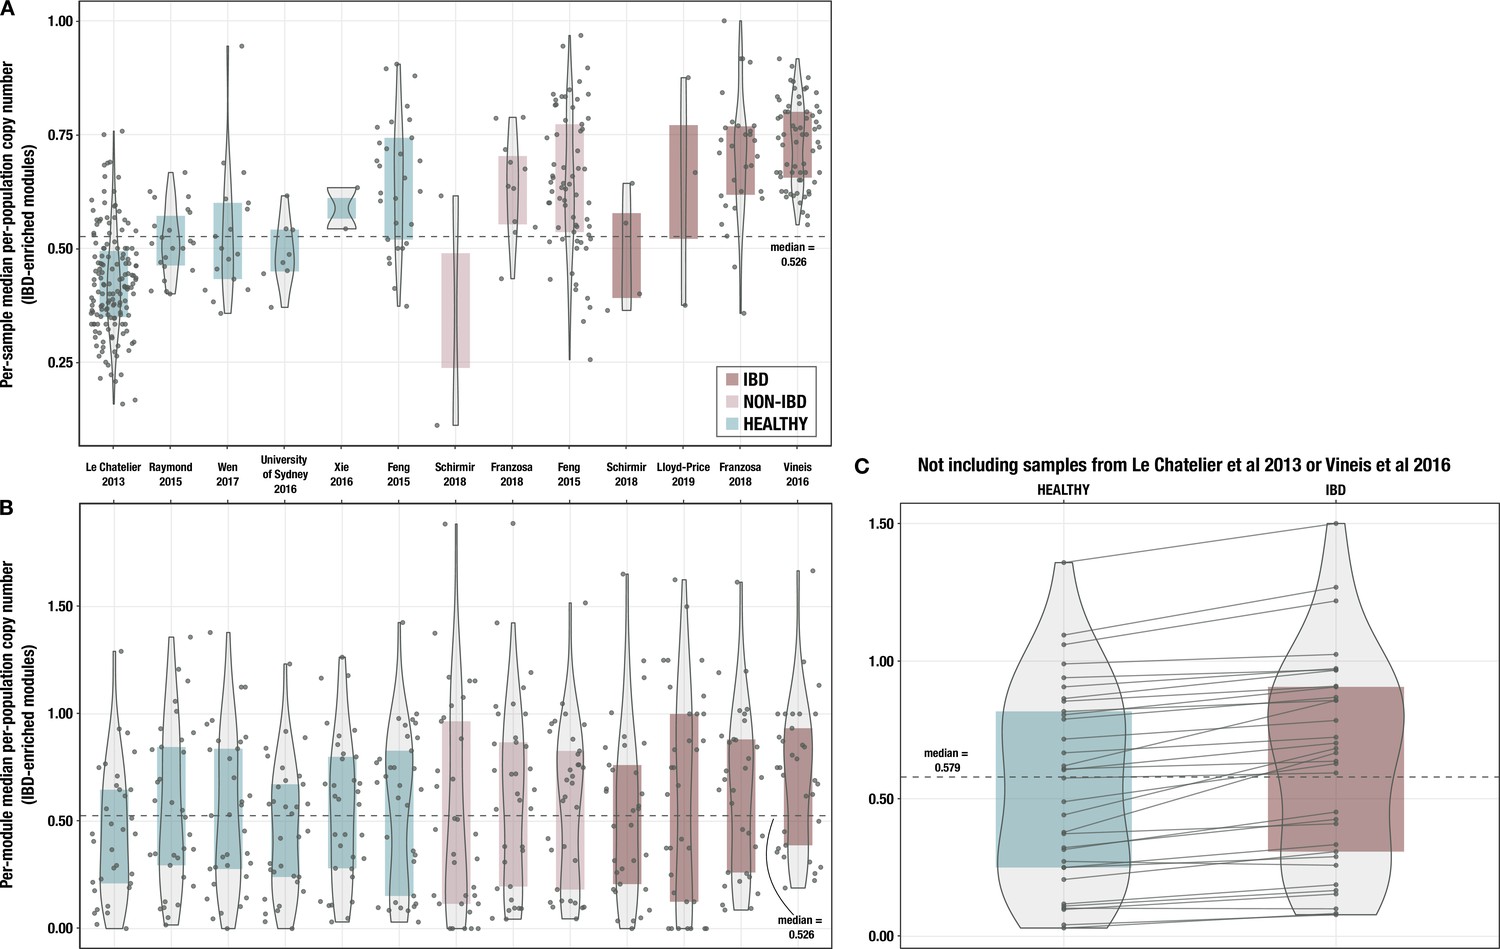
Boxplots of median per-population copy number of 33 inflammatory bowel disease (IBD)-enriched modules for samples from each individual cohort.
(A) with medians computed within each sample (i.e. one point per sample) and (B) with medians computed for each IBD-enriched module (i.e. one point per module). The x-axis indicates study of origin. (C) Boxplots of median per-population copy number of 33 IBD-enriched modules for the 115 samples in the deeply sequenced set that are not from Le Chatelier et al., 2013, or Vineis et al., 2016. The dashed line indicates the overall median for all 33 modules, and solid lines connect the points for the same module in each sample group.
Appendix 1—figure 7
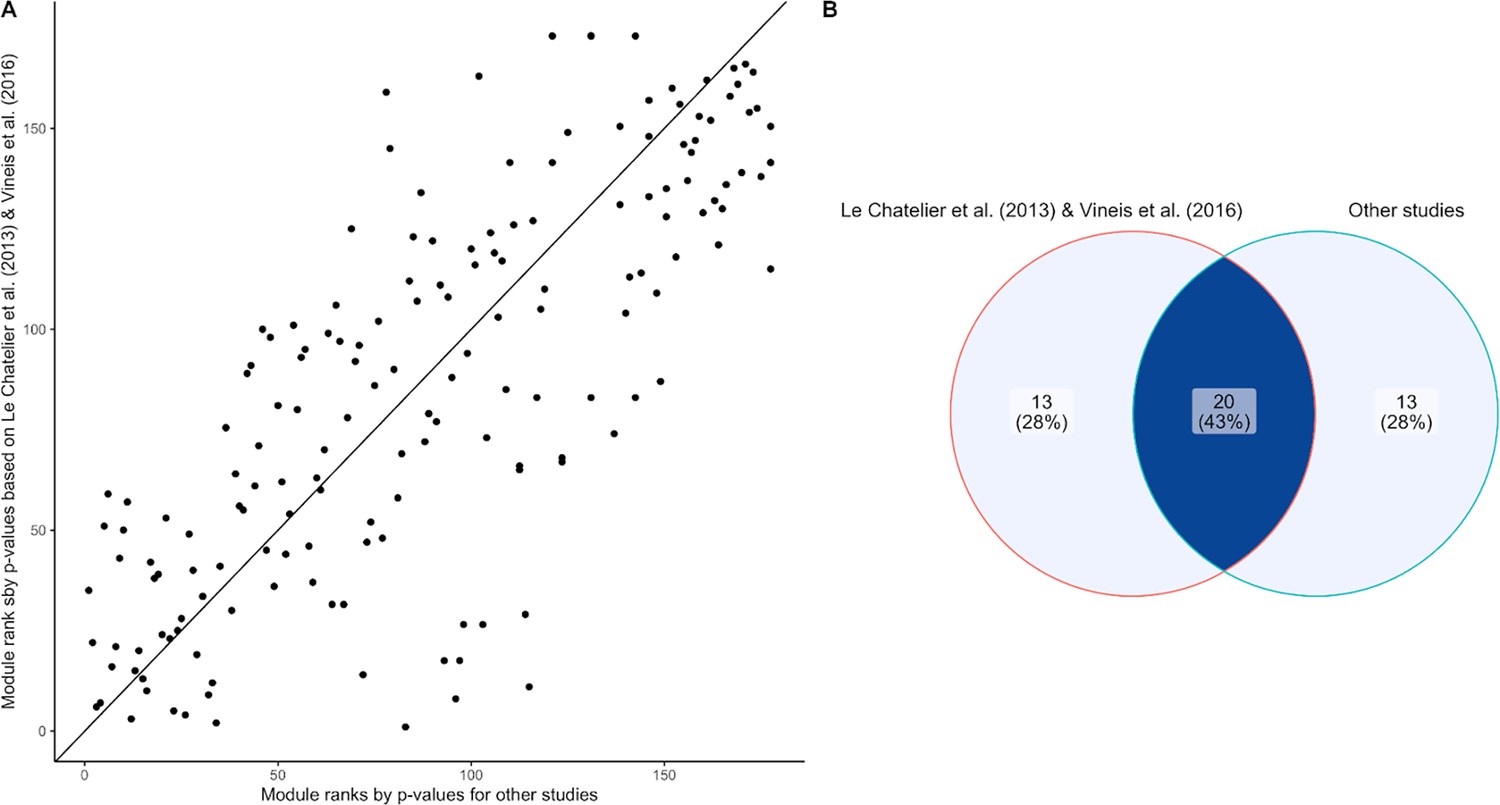
Assessing batch effect of the inflammatory bowel disease (IBD) enrichment study.
(A) Scatter plot comparing the module ranks of Wilcoxon-Mann-Whitney p-values comparing IBD and healthy subjects on Le Chatelier et al., 2013 and Vineis et al., 2016 (y-axis) and the rest of our dataset (x-axis). (B) Venn diagram displaying the overlap of IBD-enriched modules identified by the 33 smallest p-values in Le Chatelier et al., 2013 and Vineis et al., 2016 (left) and the rest of our dataset (right). There is good agreement (20 out of 33) between the two sets of modules, indicating generalizability of the signals across studies used in our sample set.
Appendix 1—figure 8
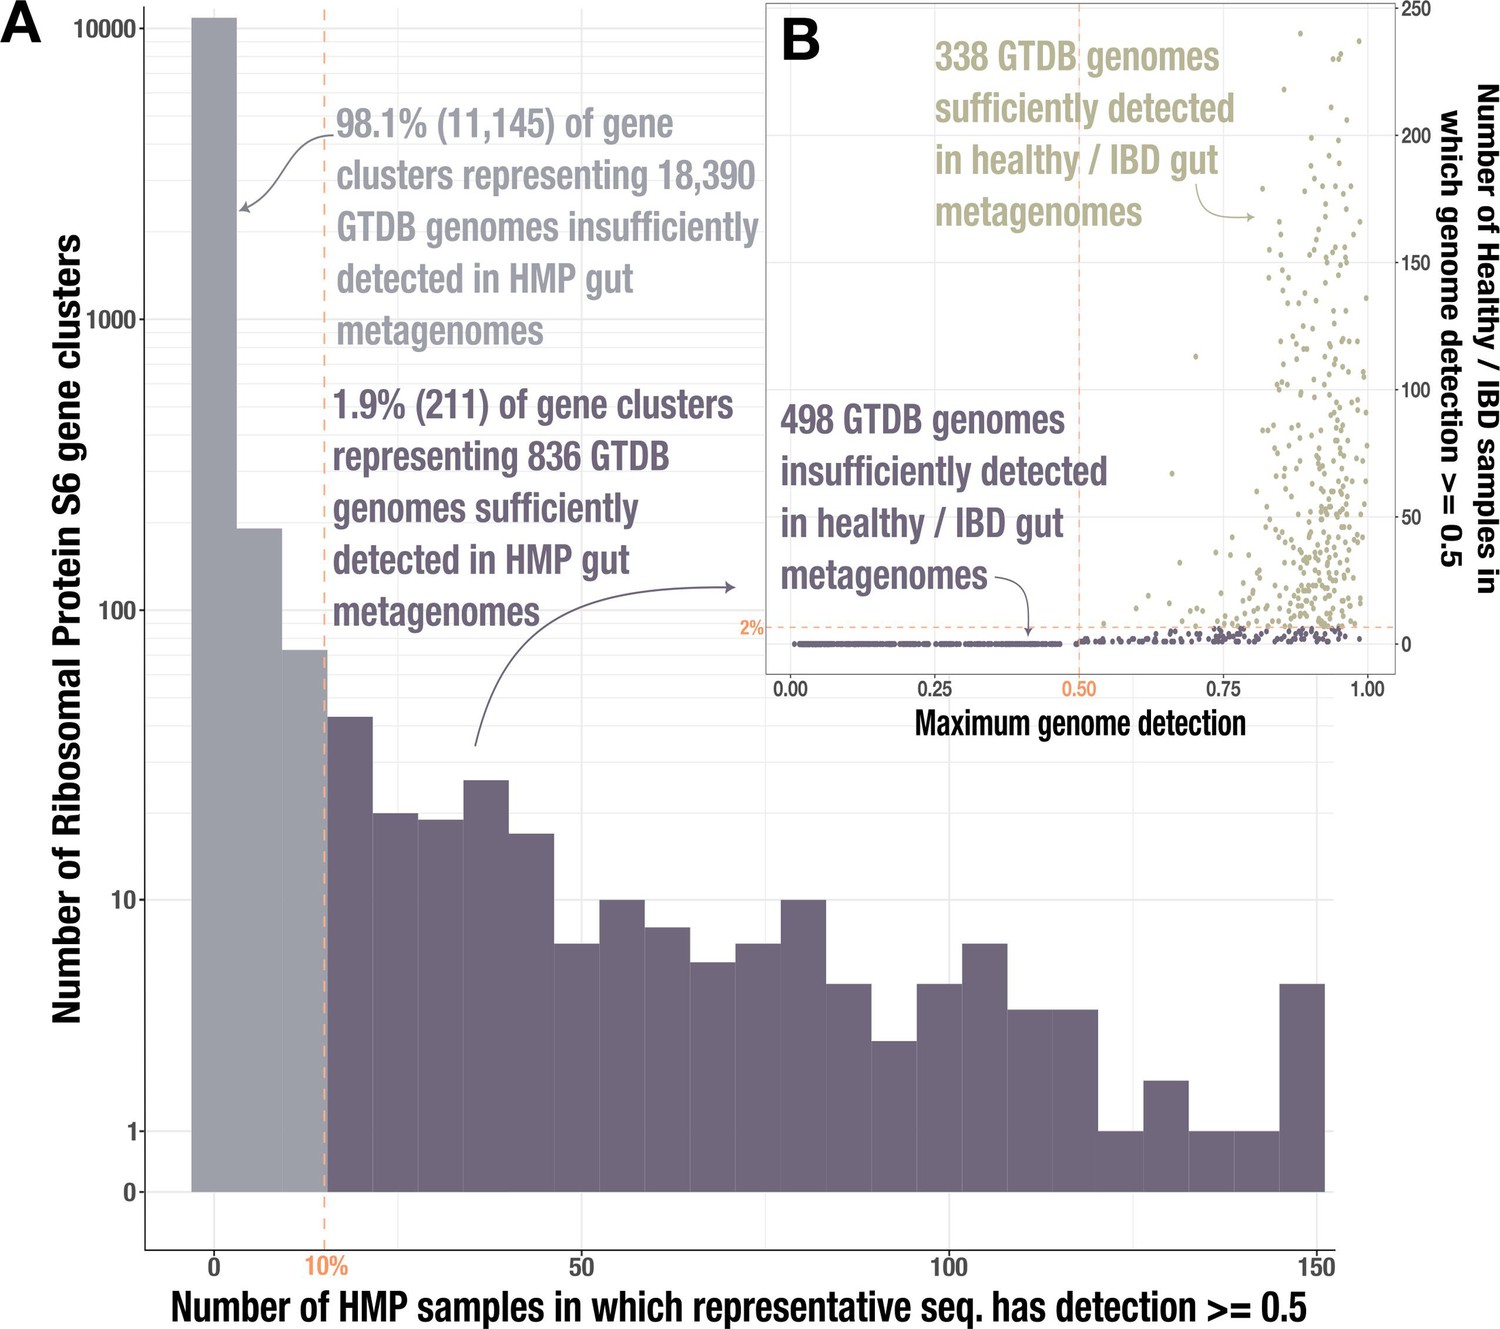
Identification of gut-associated genomes.
(A) Histogram of Ribosomal Protein S6 gene clusters (94% ANI) for which at least 50% of the representative gene sequence is covered by at least 1 read (≥50% ‘detection’) in fecal metagenomes from the Human Microbiome Project (HMP) (Human Microbiome Project Consortium, 2012). The dashed line indicates our threshold for reaching at least 50% detection in at least 10% of the HMP samples; gray bars indicate the 11,145 gene clusters that do not meet this threshold while purple bars indicate the 836 clusters that do. (B) Data for the 836 genomes whose Ribosomal Protein S6 sequences belonged to one of the passing (purple) gene clusters. The y-axis indicates the number of healthy/inflammatory bowel disease (IBD) gut metagenomes from our set of 330 in which the full genome sequence has at least 50% detection, and the x-axis indicates the genome’s maximum detection across all 330 samples. The dashed line indicates our threshold for reaching at least 50% genome detection in at least 2% of samples; the 338 genomes that pass this threshold are tan and those that do not are purple.
Appendix 2—figure 1
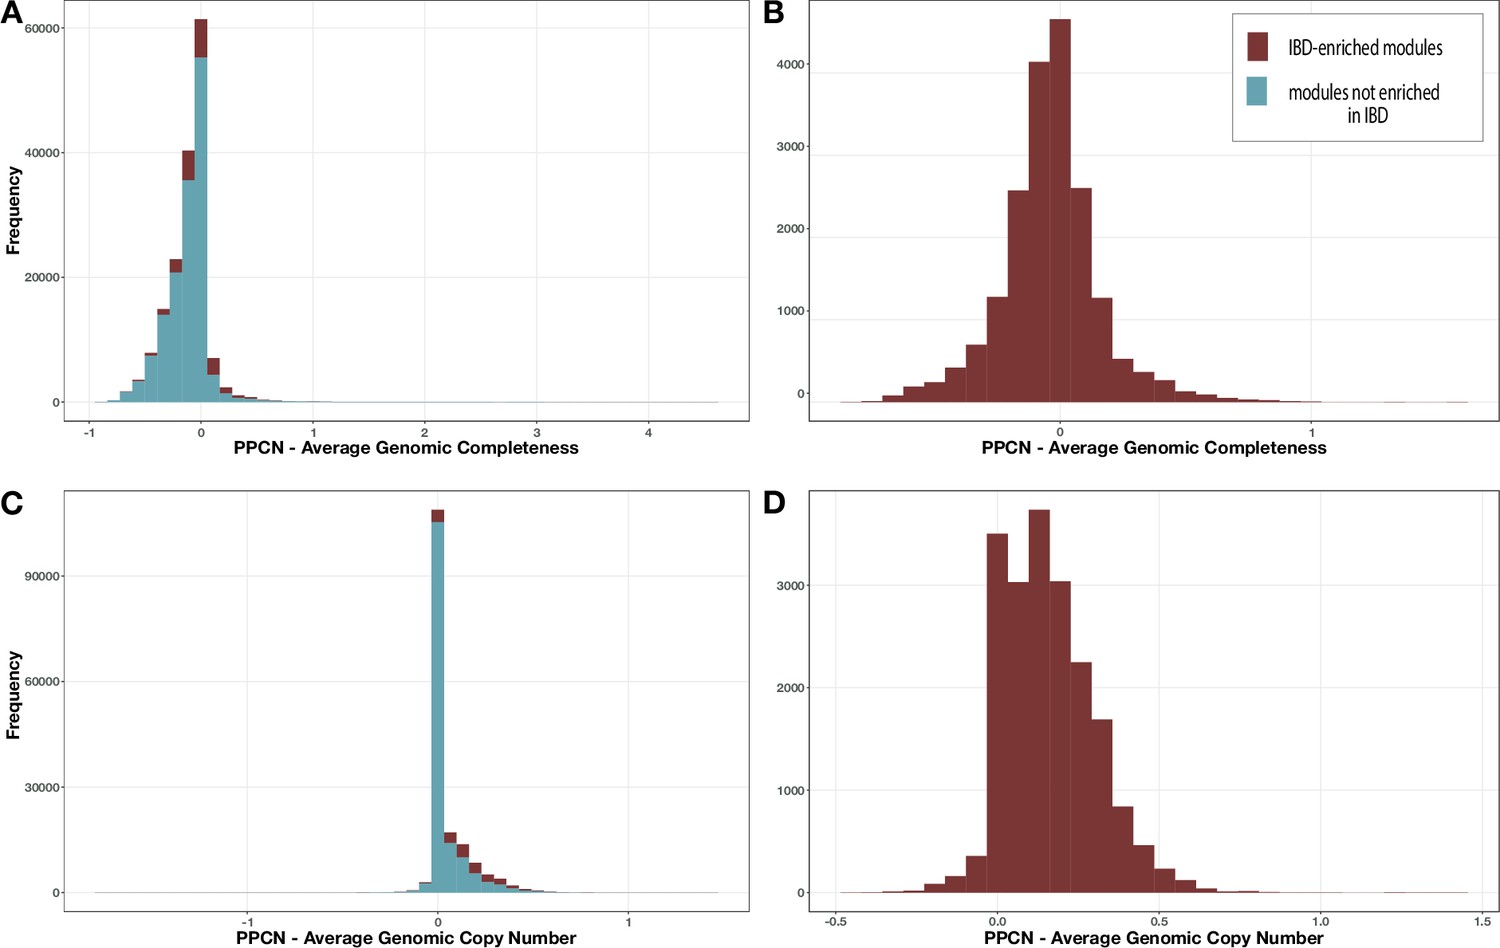
Distribution of per-population copy number (PPCN) error relative to average genomic completeness.
(A, B) or average genomic copy number (C, D) for all modules (A, C) or just the inflammatory bowel disease (IBD)-enriched modules (B, D).
Appendix 2—figure 2
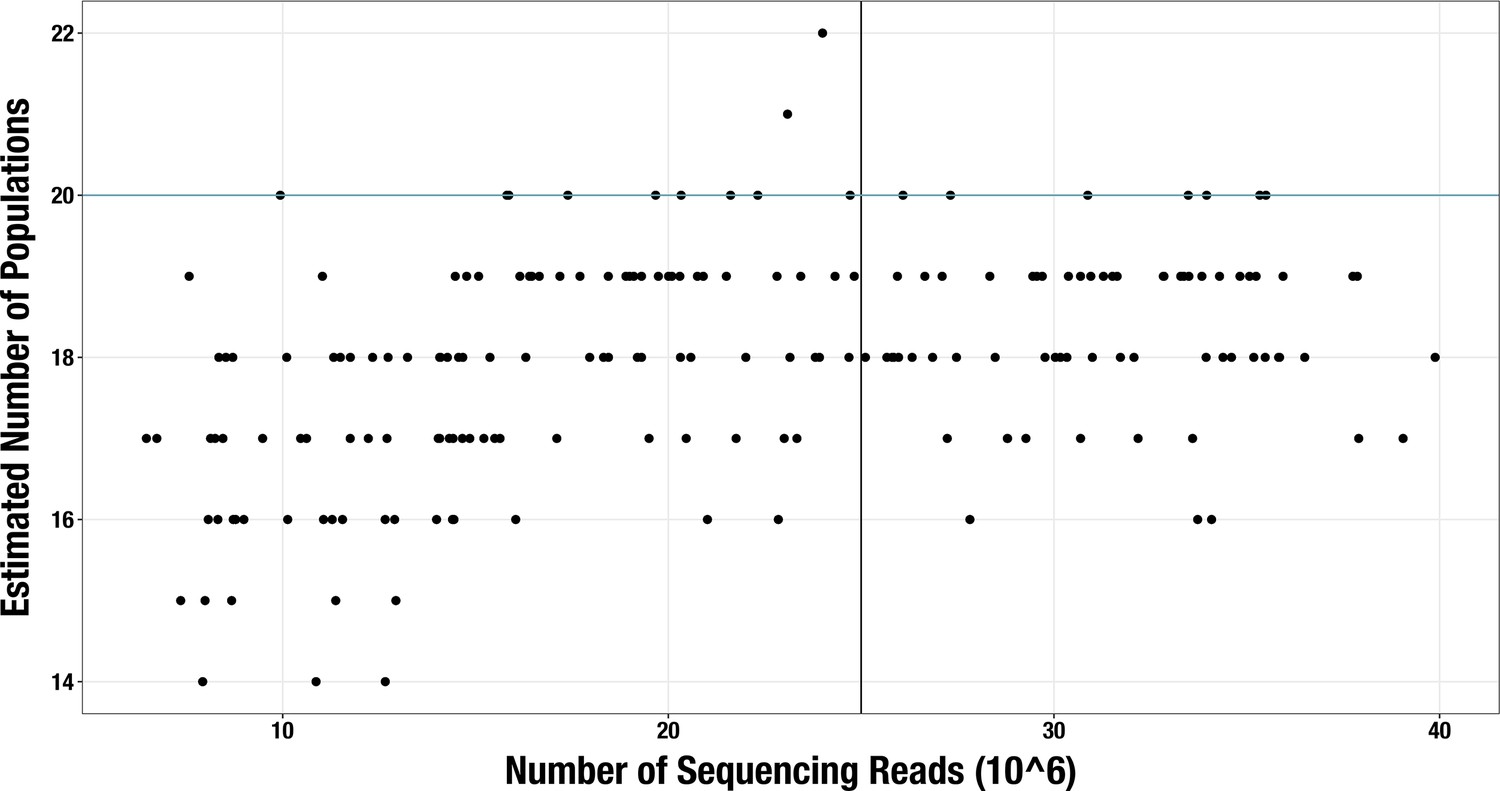
Scatterplot of sequencing depth vs estimated number of microbial populations in each of 189 ‘realistic’ synthetic metagenome assemblies.
The blue line shows the actual number of genomes in each synthetic community (n = 20) and the black line shows the sequencing depth threshold used in our main analysis.
Appendix 2—figure 3
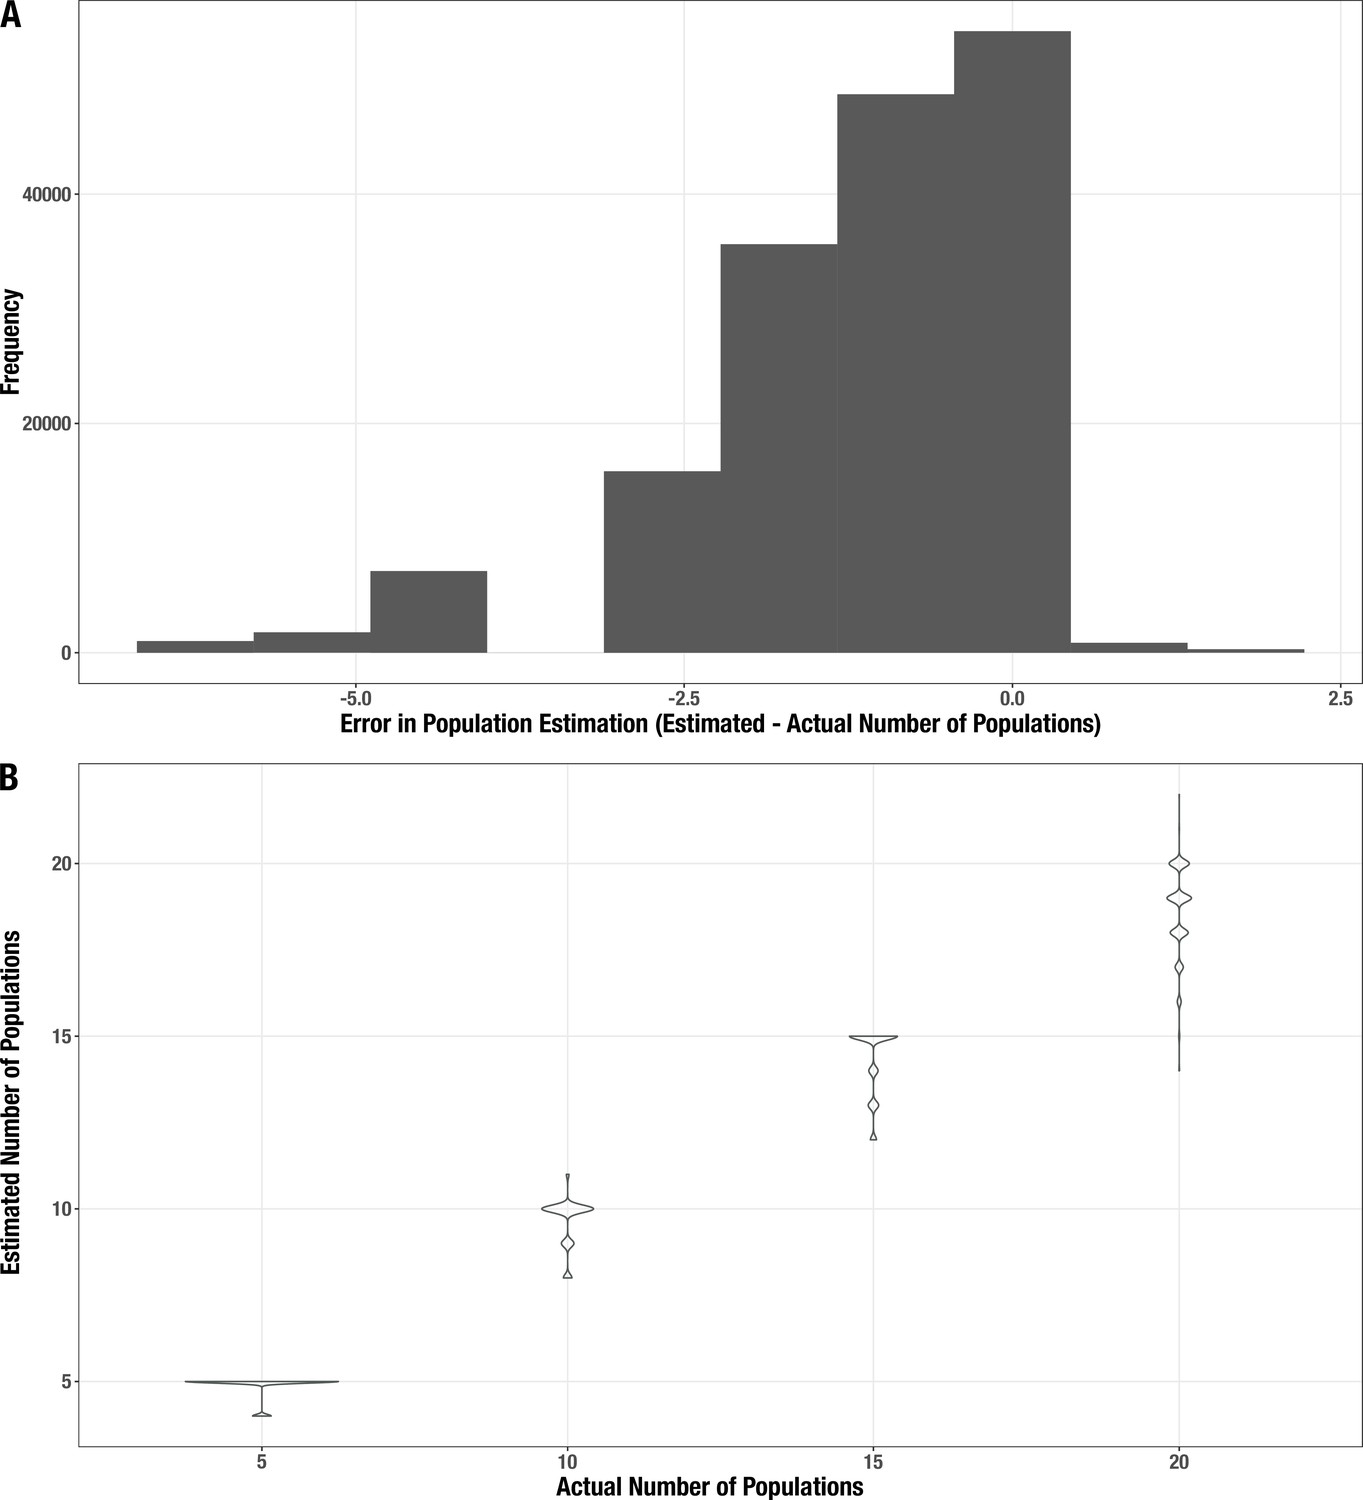
Distribution of error for the estimated number of populations in the synthetic metagenomes.
(A) Histogram of the difference between estimated and actual community size. (B) Distribution of estimates (y-axis) for each actual community size (x-axis).
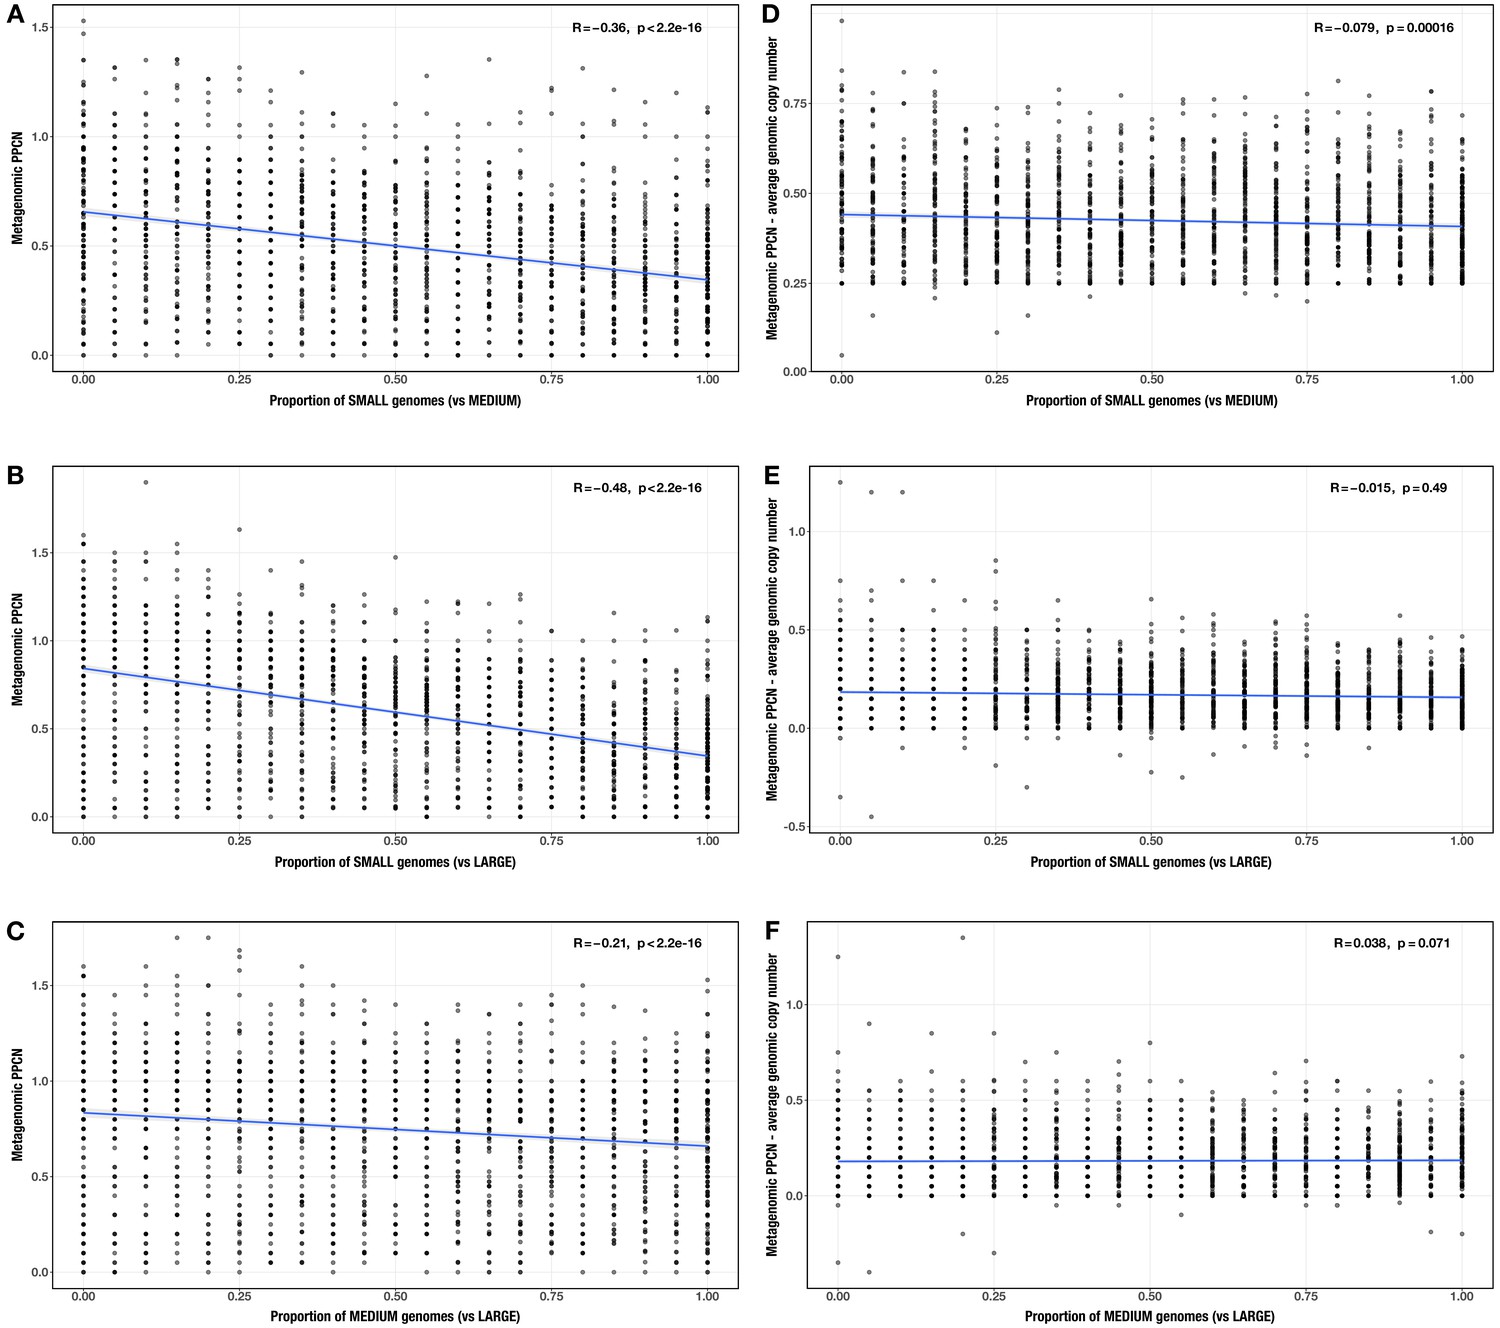
Appendix 2—figure 4
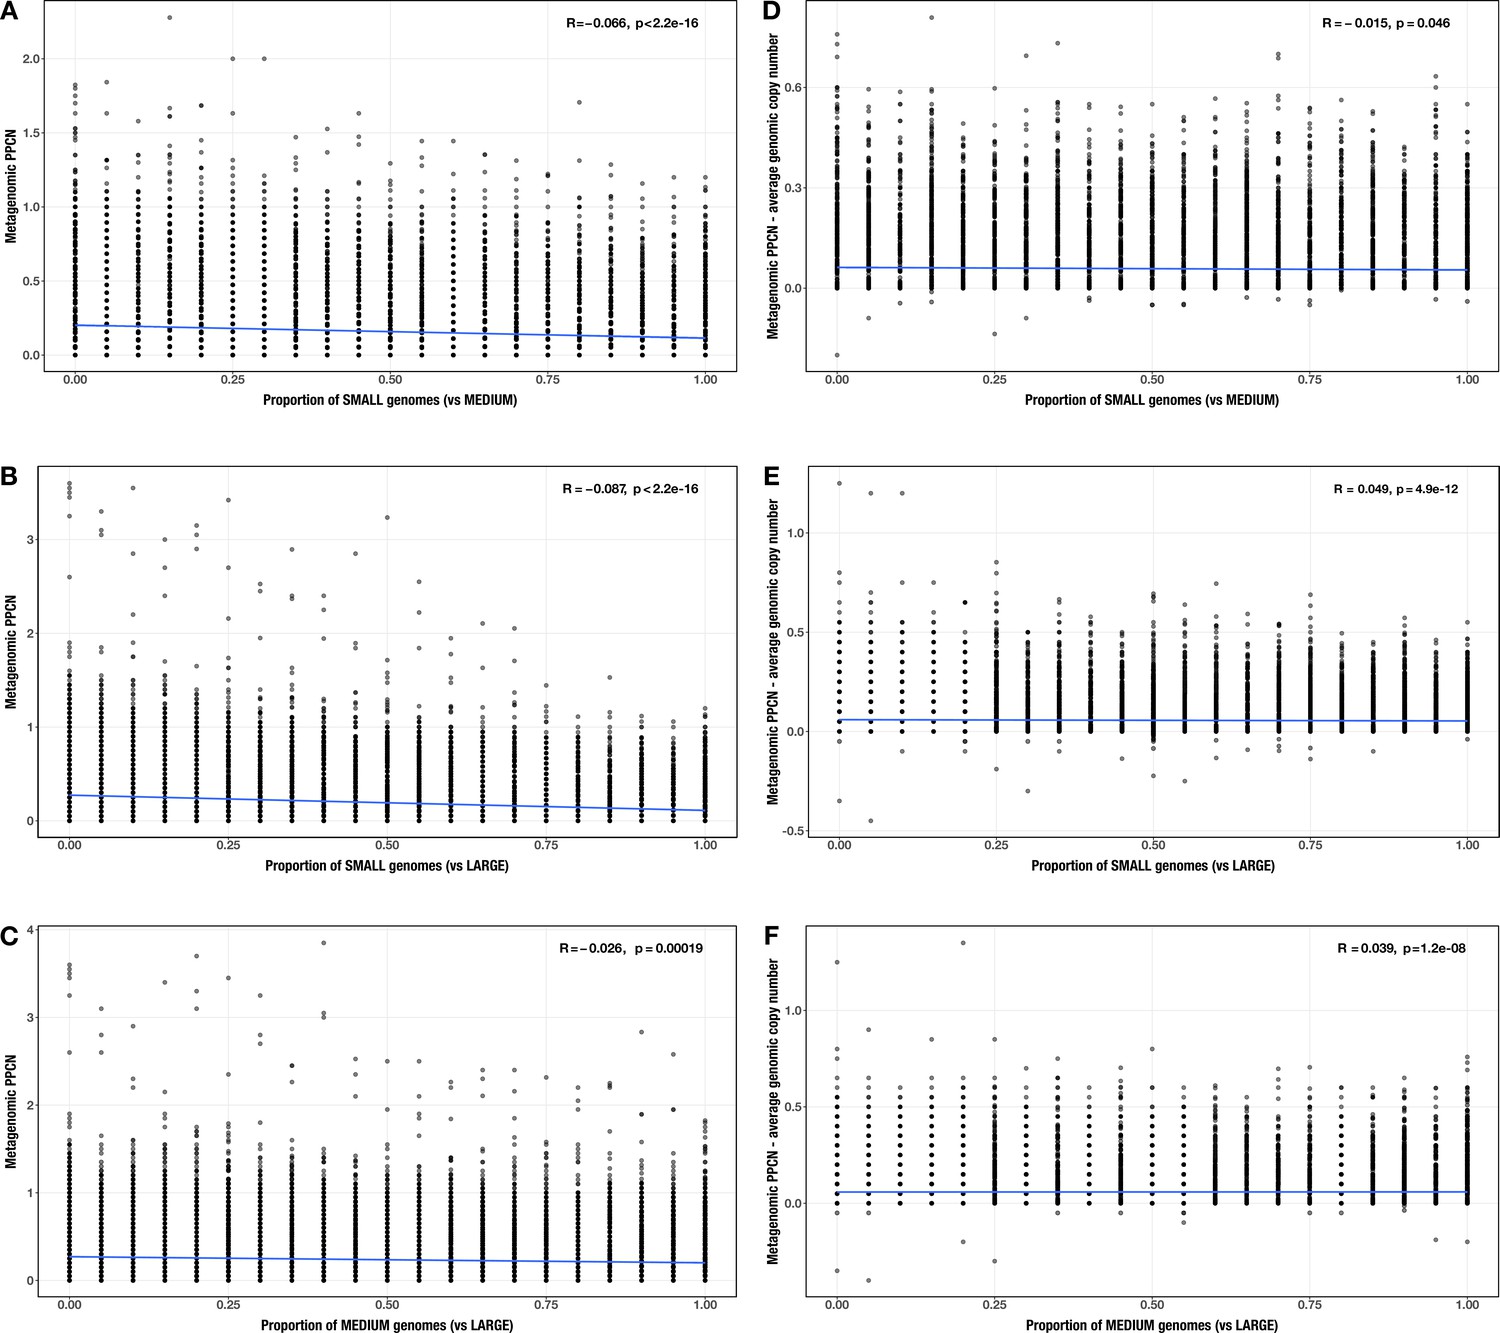
Correlations between proportion of genomes in smaller size category and (A–C) per-population copy number (PPCN) or (D–F) PPCN error relative to average genomic copy number for each size category pair (A/D) small vs medium genomes; (B/E) small vs large genomes; (C/F) medium vs large genomes across all modules.
The Spearman’s correlation coefficients and p-values are shown in the top-right corner of each plot, and regression lines are plotted in blue.
Appendix 2—figure 5
Correlations between proportion of genomes in smaller size category and (A–C) per-population copy number (PPCN) or (D–F) PPCN error relative to average genomic copy number for each size category pair (A/D: small vs medium genomes; B/E: small vs large genomes; C/F: medium vs large genomes) across inflammatory bowel disease (IBD)-enriched modules (n = 33).
The Spearman’s correlation coefficients and p-values are shown in the top-right corner of each plot, and regression lines are plotted in blue.
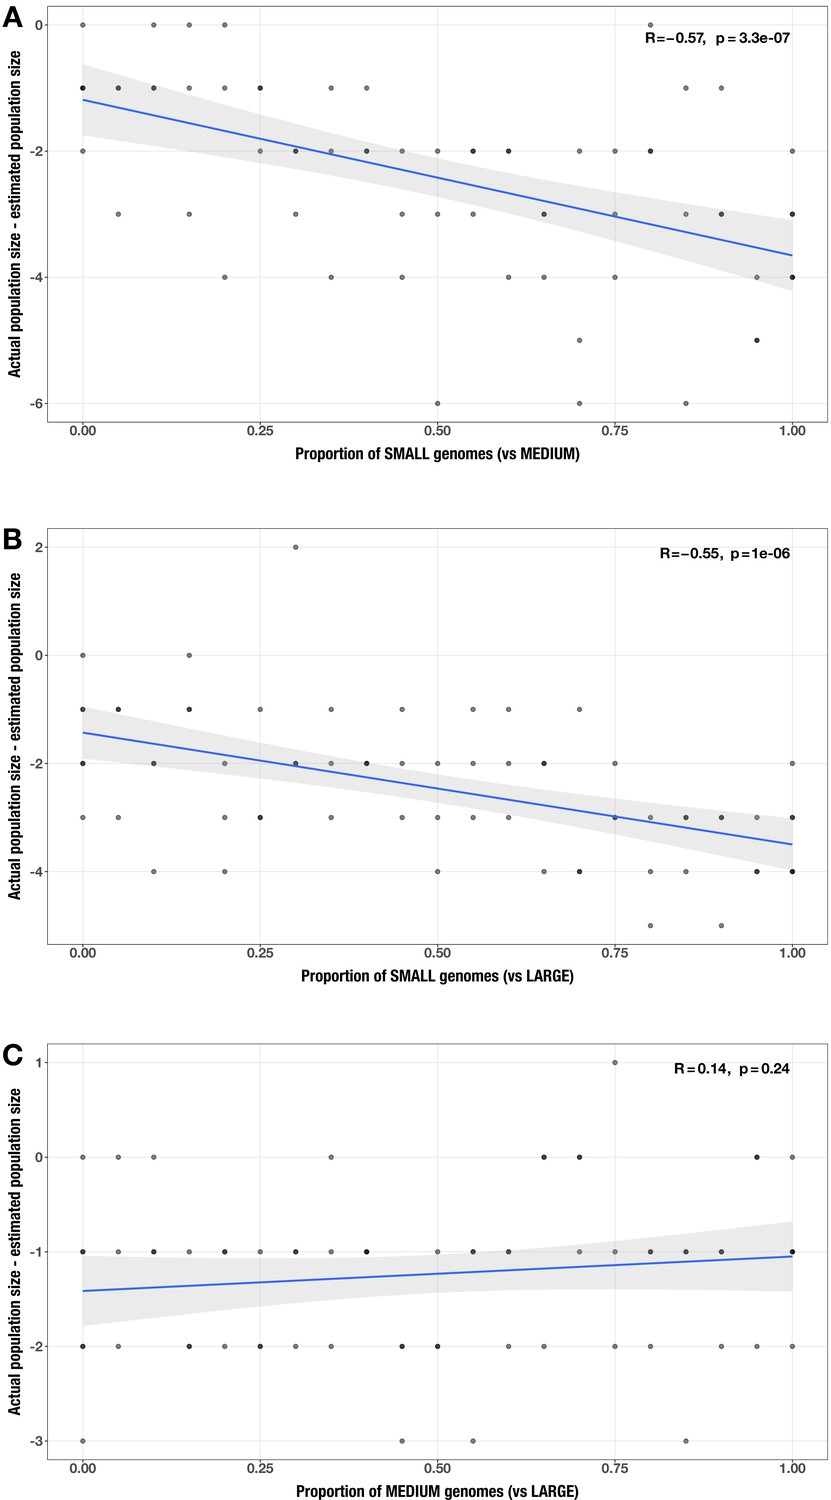
Appendix 2—figure 6
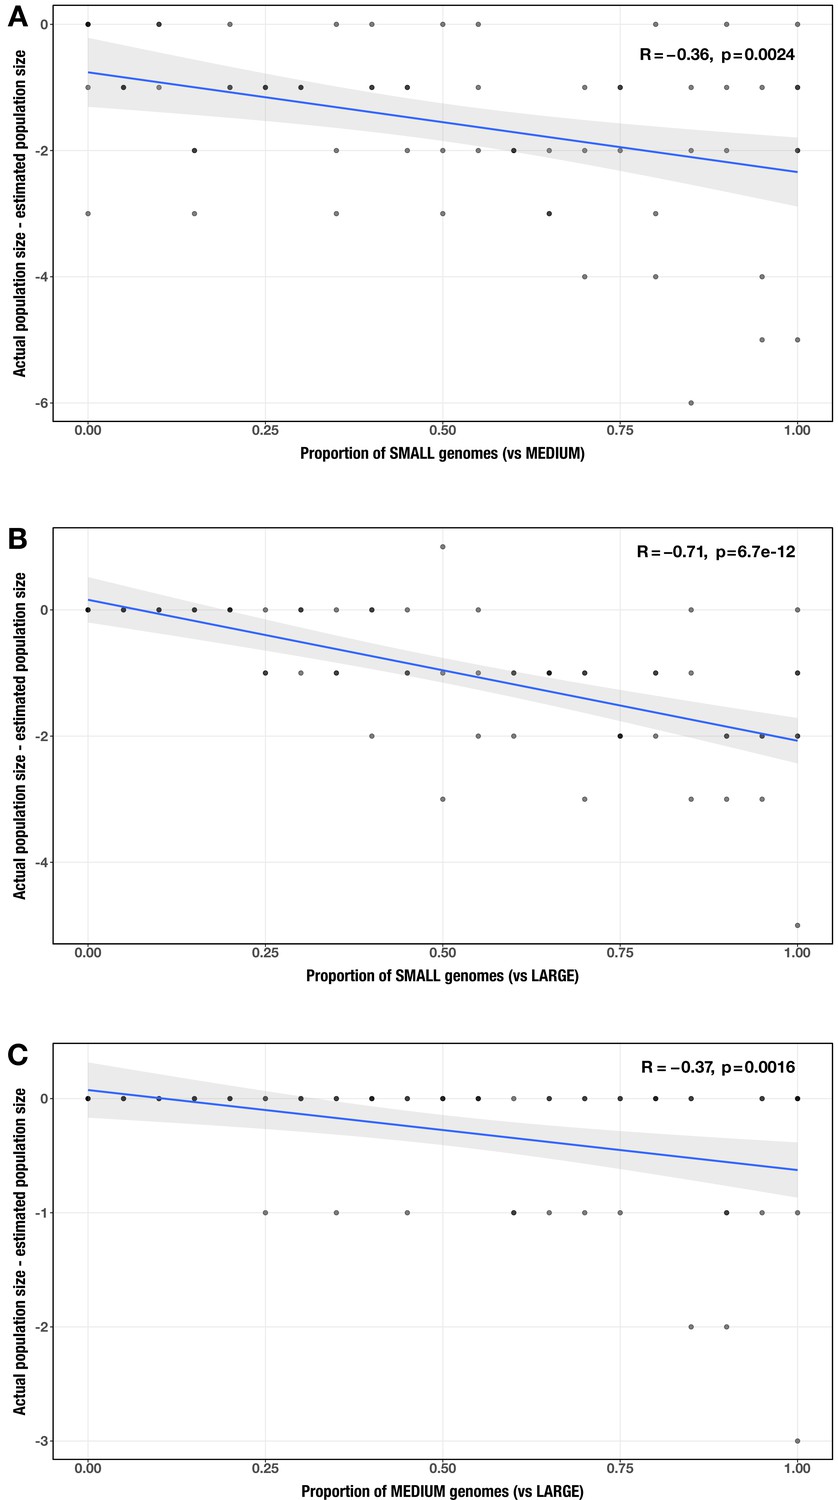
Correlation between proportion of genomes in smaller size category and error in community size estimate (relative to actual community size) for each size category pair (A: small vs medium genomes; B: small vs large genomes; C: medium vs large genomes).
The Spearman’s correlation coefficients and p-values are shown in the top-right corner of each plot, and regression lines are plotted in blue.
Appendix 2—figure 7
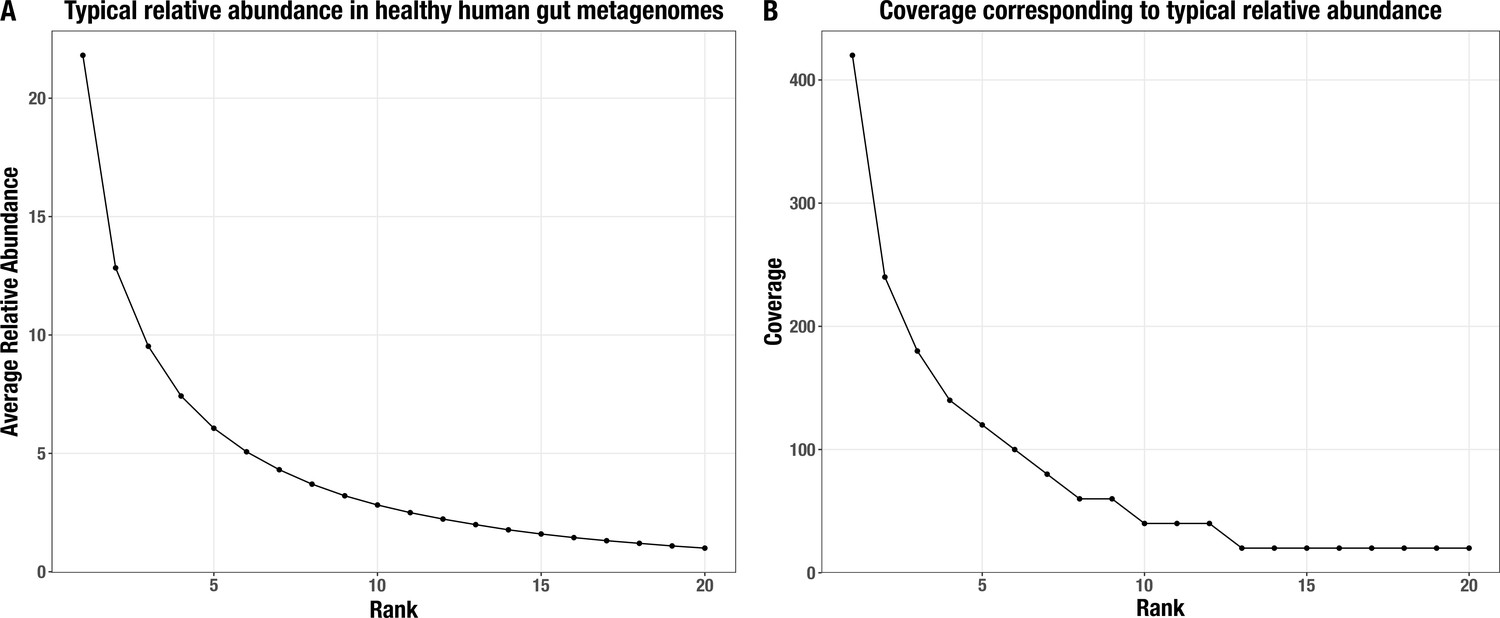
Normalized average relative abundance curve.
(A) for the top 20 most abundant populations in a typical healthy human gut metagenome and (B) their corresponding coverage values in our synthetic metagenomes.
Appendix 2—figure 8
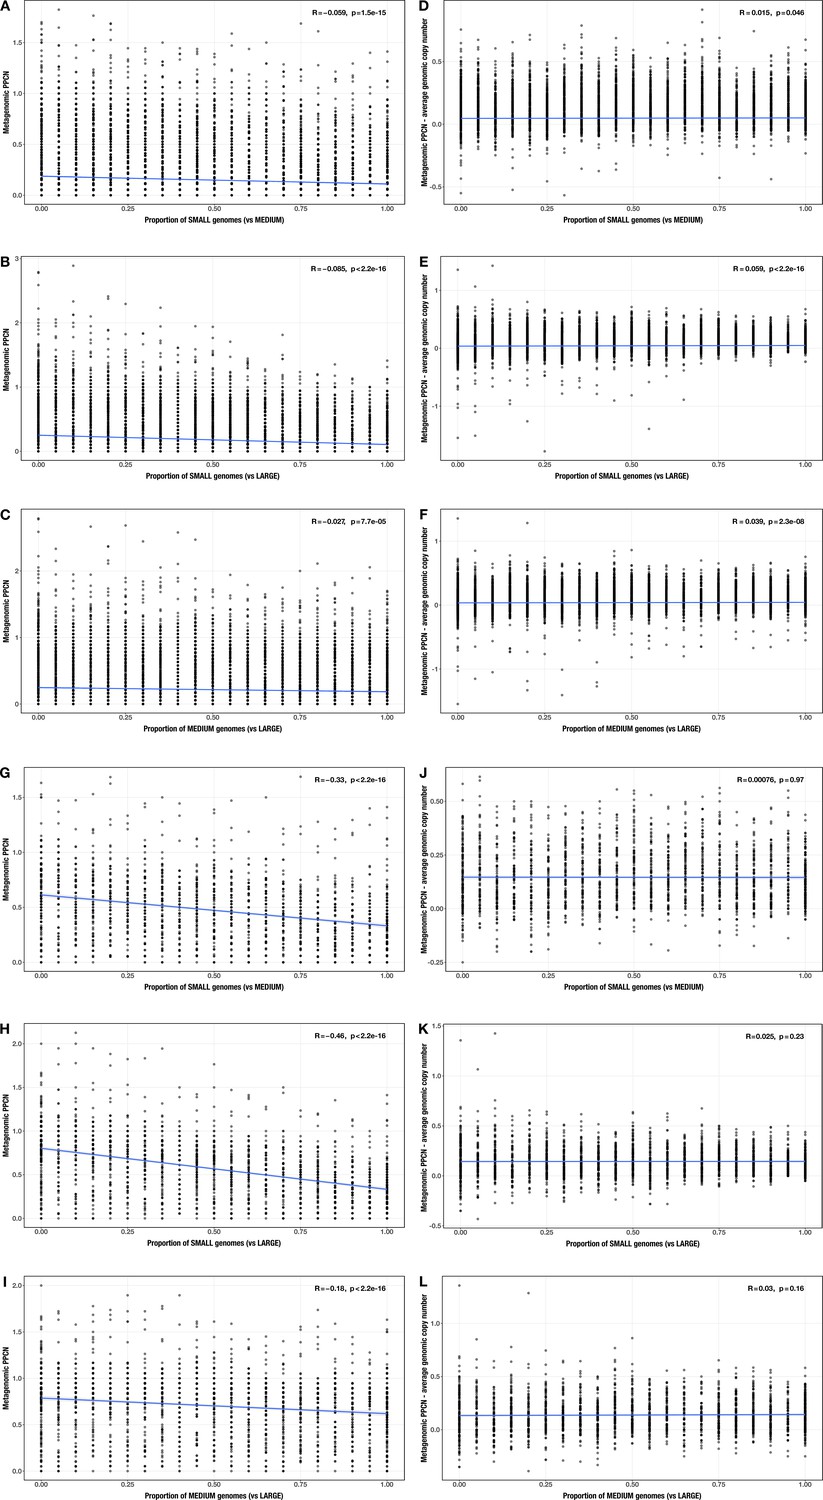
Correlations between proportion of genomes in smaller size category and (A–C, G–I) per-population copy number (PPCN) or (D–F, J–L) PPCN error relative to average genomic copy number for each size category pair across all modules (A–F) or the subset of inflammatory bowel disease (IBD)-enriched modules (G–L) in the realistic genome size test case.
The Spearman’s correlation coefficients and p-values are shown in the top-right corner of each plot, and regression lines are plotted in blue.
Appendix 2—figure 9
Correlations between proportion of genomes in smaller size category and error in community size estimate (relative to actual community size) for each size category pair.
(A) small vs medium genomes; (B) small vs large genomes; (C) medium vs large genomes in the realistic genome size test case. The Spearman’s correlation coefficients and p-values are shown in the top-right corner of each plot, and regression lines are plotted in blue.
Appendix 2—figure 10

Correlation between community size and metagenomic copy number across all modules.
(A–C) and across the subset of enriched modules (D–F) for each genome size category (A/D: small genomes; B/E: medium genomes; C/F: large genomes) in the community size test case. The Spearman’s correlation coefficients and p-values are shown in the top-right corner of each plot, and regression lines are plotted in blue.
Appendix 2—figure 11
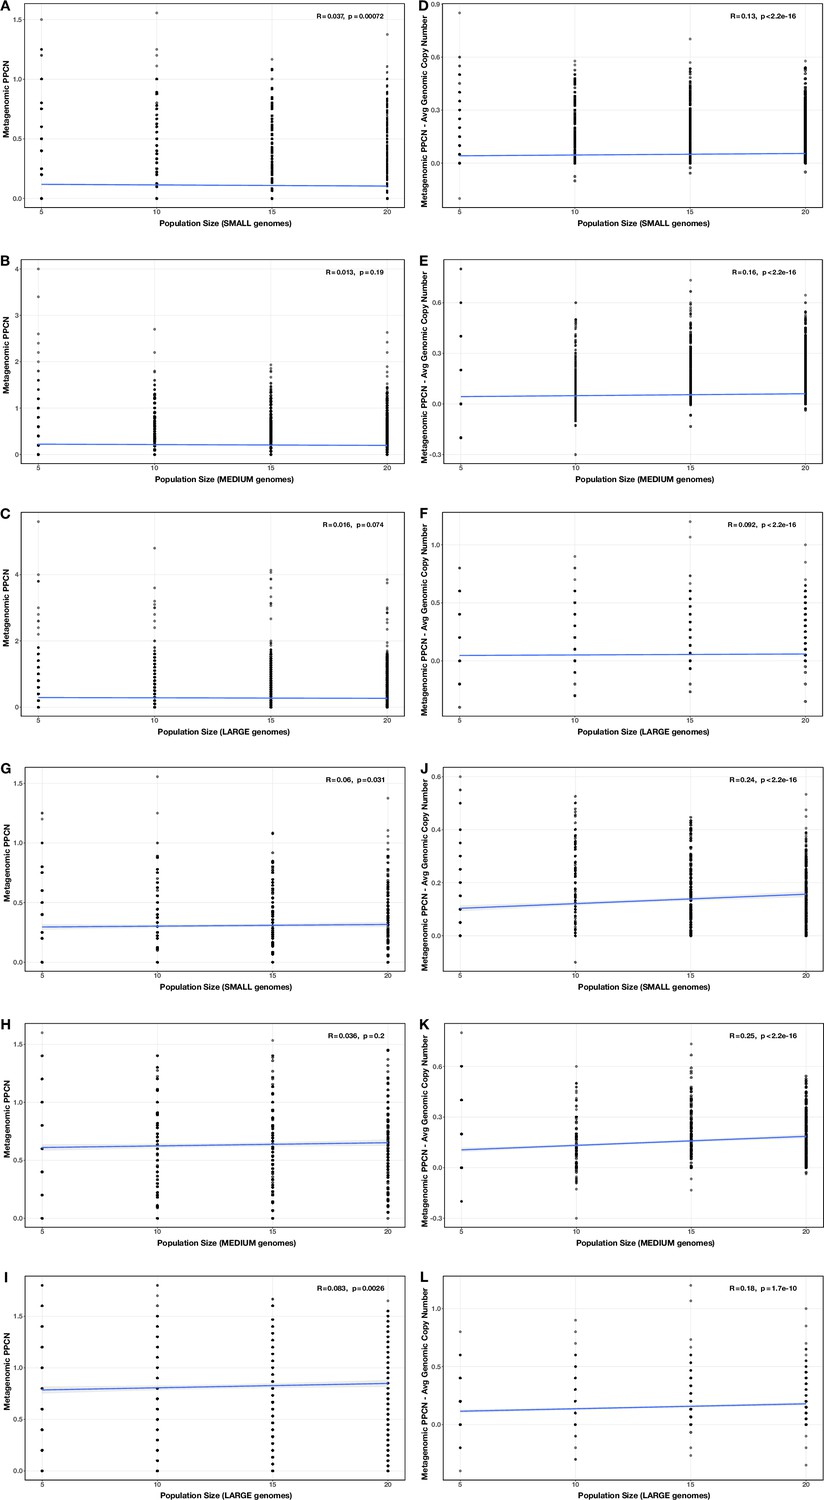
Correlations between community size and (A–C, G–I) per-population copy number (PPCN) or (D–F, J–L) PPCN error relative to average genomic copy number for each genome size category (A/D/G/J: small genomes; B/E/H/K: medium genomes; C/F/I/L: largegenomes), across all modules (A–F) or the subset of inflammatory bowel disease (IBD)-enriched modules (G–L) in the community size test case.
The Spearman’s correlation coefficients and p-values are shown in the top-right corner of each plot, and regression lines are plotted inblue.
Appendix 2—figure 12
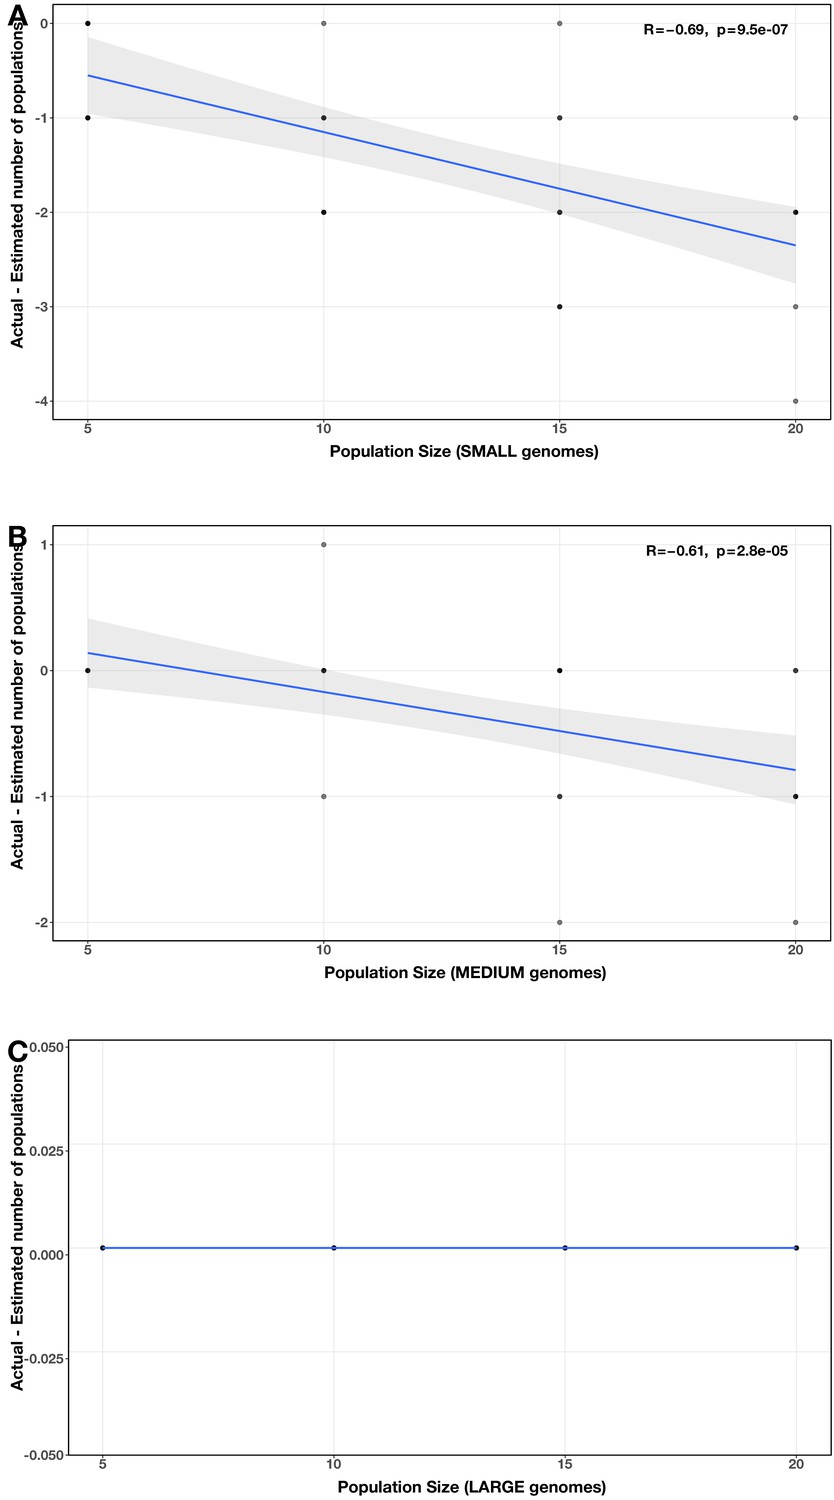
Correlations between community size and error in community size estimate (relative to actual community size) for each genome size category.
(A) small; (B) medium; (C) large in the community size test case. The Spearman’s correlation coefficients and p-values are shown in the top-right corner of each plot, and regression lines are plotted in blue.
Appendix 2—figure 13
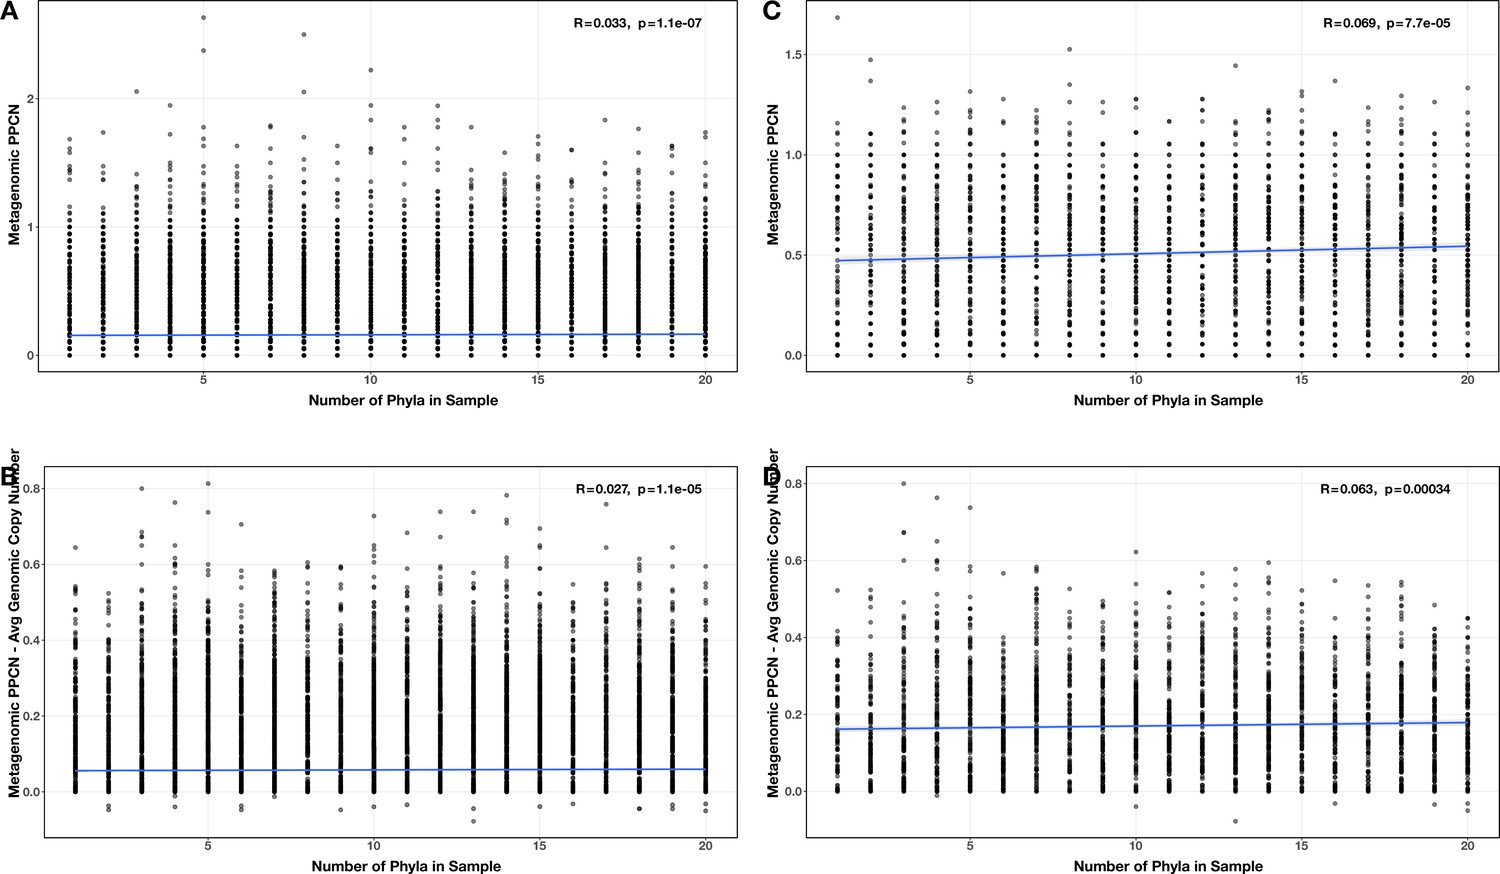
Correlations between number of phyla and (A/C) per-population copy number (PPCN) or PPCN accuracy relative to average genomic copy number (B/D), for all modules (A/B) or the subset of inflammatory bowel disease (IBD)-enriched modules (C/D) in the diversity test case.
The Spearman’s correlation coefficients and p-values are shown in the top-right corner of each plot, and regression lines are plotted in blue.
Appendix 2—figure 14
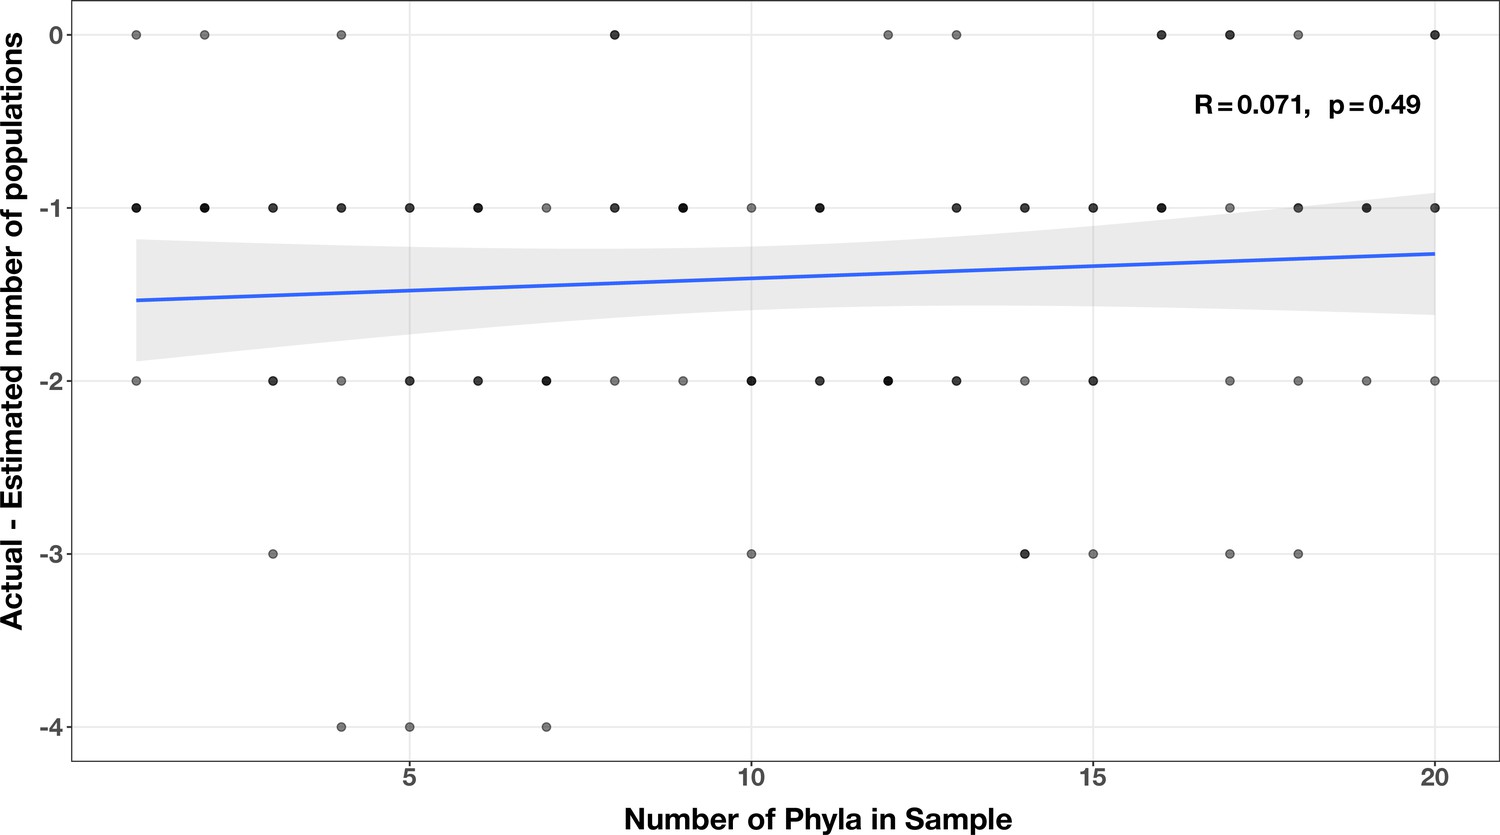
Correlation between number of phyla and accuracy of community size estimates (relative to actual community size) in the diversity test case.
The Spearman’s correlation coefficient and p-value are shown in the top-right corner of each plot, and the regression line is plotted in blue.
Author response image 1

Screenshots of Figure 3 that demonstrate the overlapping signal between HMI status and genome detection/abundance in IBD.
Tables
Appendix 2—table 1
Summary of correlation relationships between per-population copy number (PPCN), PPCN accuracy, and sample parameters from Supplementary file 6b.
We labeled each pair according to the strength of correlation indicated with the R value: NO, very weak with |R| ≤ 0.19; SOME, weak with 0.19 < |R| ≤ 0.39; YES, moderate to strong with |R| > 0.39. A ‘+’ sign in front of the R value indicates that all R values were positive, a ‘-’ sign indicates that all were negative, and the absolute value sign indicates that they had mixed signs. An asterisk (*) indicates that some of the correlations were nonsignificant (p > 0.05).
| Correlation? | PPCN (all) | PPCN error (all) | PPCN (enriched) | PPCN error (enriched) |
|---|---|---|---|---|
| Genome size (proportion of smaller genomes) | NO (-R < 0.09) | NO (+R ≤ 0.11) | YES (-R ≥ 0.48) | NO* (|R| < 0.13) |
| Community size (# of populations) | NO* (+R < 0.04) | SOME (+R ≤ 0.16) | NO* (+R < 0.085) | SOME (+R ≤ 0.25) |
| Diversity (# of phyla) | NO (+R = 0.033) | NO (+R < 0.04) | NO (+R = 0.069) | NO (+R < 0.065) |
Appendix 2—table 2
Summary of correlation relationships between the accuracy of community size estimates and sample parameters from Supplementary file 6b.
We labeled each pair according to the strength of correlation indicated with the R value: NO, very weak with |R| ≤ 0.19; SOME, weak with 0.19 < |R| ≤ 0.39; YES, moderate to strong with |R| > 0.39. A ‘+’ sign in front of the R value indicates that all R values were positive, a ‘-’ sign indicates that all were negative, and the absolute value sign indicates that they had mixed signs. An asterisk (*) indicates that some of the correlations were nonsignificant (p > 0.05).
| Correlation? | Error in community size estimate |
|---|---|
| Genome size (proportion of smaller genomes) | YES* (0.14<|R| < 0.72) |
| Community size (# of populations) | YES (0.6 < -R < 0.7) (except for large genomes) |
| Diversity (# of phyla) | NO* (+R = 0.071) |
Author response table 1
Number and proportion of Bacteroides genomes classified as HMI at each HMI score threshold.
There were 20 total Bacteroides genomes in the set of 338 gut microbes identified from the GTDB. The HMI score is computed by adding the percent completeness of all 33 IBD-enriched KEGG modules. The full table can be viewed in Supplementary Table 3h.
| Average percent completeness of | Corresponding HMI score threshold | Number of | |
|---|---|---|---|
| IBD-enriched modules | 24.75 | Bacteroides genomes classified as HMI | Hercent of Bacteroides genomes classified as |
| 75 | 25.08 | 6 | 30% |
| 76 | 25.41 | 4 | 20% |
| 77 | 25.74 | 3 | 15% |
| 78 | 26.07 | 0 | 0% |
| 79 | 26.4 | 0 | 0% |
| 80 |
Author response table 2
Key genome-level results at each HMI score threshold.
The HMI score is computed by adding the percent completeness of all 33 IBD-enriched KEGG modules. WRS – Wilcoxon Rank Sum test; KW – Kruskal-Wallis test. The full table can be viewed in Supplementary Table 3h
| Average percent completeness of IBD-enriched modules | HMI score threshold | Number of HMI genomes | WRS p-value for HMI vs non-HMI detection in IBD | WRS p-value for HMI vs non-HMI detection in healthy | KW p-value for fraction of HMI in IBD vs nonIBD samples |
|---|---|---|---|---|---|
| 75 | 24.75 | 129 | 2.18E-08 | 0.001776512 | 1.24E-16 |
| 76 | 25.08 | 115 | 2.70E-08 | 0.002832713 | 2.54E-19 |
| 77 | 25.41 | 98 | 2.10E-06 | 0.012257189 | 1.60E-18 |
| 78 | 25.74 | 78 | 4.16E-06 | 0.087182579 | 4.36E-21 |
| 79 | 26.07 | 69 | 5.46E-06 | 0.078132573 | 1.75E-21 |
| 80 | 26.4 | 59 | 4.82E-06 | 0.267265165 | 8.98E-25 |
| 81 | 26.73 | 48 | 0.000168971 | 0.700660484 | 5.03E-25 |
| 82 | 27.06 | 39 | 0.000217924 | 0.836279996 | 2.89E-29 |
| 83 | 27.39 | 35 | 0.001750966 | 0.962660229 | 3.77E-30 |
| 84 | 27.72 | 28 | 0.024916547 | 0.997986302 | 5.66E-30 |
| 85 | 28.05 | 24 | 0.043823626 | 0.999220691 | 5.21E-30 |
Additional files
-
Supplementary file 1
Samples and cohorts used in this study.
(a) Description of studies/cohorts providing publicly available gut metagenomes from healthy people, non-inflammatory bowel disease (IBD) controls, and people with IBD. For each study, we note the sample groups it contributes metagenomes to; whether or not those samples were sufficiently deeply sequenced to be included in the main analyses; the country of origin of the samples; the sample type (fecal metagenome or ileal pouch luminal aspirate); the number of samples it contributes to each group before and after applying the sequencing depth threshold; and cohort details/exclusions as described within the study. (b) Description of 408 samples included in the primary analyses of this manuscript (i.e. those with sufficient sequencing depth of ≥ 25 million reads), including their associated diagnosis (ulcerative colitis (UC), Crohn’s disease (CD), non-IBD, healthy, colorectal cancer with adenoma (CRC_ADENOMA), or colorectal cancer with carcinoma (CRC_CARCINOMA)); study of origin; sample group; sequencing depth; and number of microbial populations estimated to be represented within the metagenome. (c) Description of all samples initially considered and their SRA accession numbers. (d) The number of gene calls and the number/proportion of annotations per gene call for KOfams, Clusters of Orthologous Groups (COGs), and Pfams in each sample. (e) The number of genes with at least one functional annotation and the number of tRNAs in each sample from the subset of deeply sequenced samples. (f) Description of the 57 antibiotic time-series gut metagenomes from Palleja et al., 2018 used for classifier testing, including SRA accession number; sampling day in the time series; sequencing depth; and estimated numbers of microbial populations represented in the sample.
- https://cdn.elifesciences.org/articles/89862/elife-89862-supp1-v1.zip
-
Supplementary file 2
Metabolism data in metagenomes.
(a) Description of the 33 KEGG modules enriched in inflammatory bowel disease (IBD) samples, including: module name, KEGG categorization, and definition; their median per-population copy numbers (PPCNs) in the healthy sample group and IBD sample group; the p-value, FDR-adjusted p-value, and W statistic from the per-module Wilcoxon rank-sum test used to determine enrichment in IBD; the difference between its median PPCN in IBD samples and median PPCN in healthy samples (‘effect size’); the fraction of samples in which the module occurs with nonzero copy number; whether the module is also enriched in the high metabolic independence (HMI) populations analyzed in Watson et al., 2023; the number of total enzymes in the module; the number of total compounds in the modules; and the numbers and proportions of shared enzymes or compounds between this module and the other IBD-enriched modules. (b) Description of all 179 KEGG modules with nonzero copy number in at least one metagenome. Most of the columns match the corresponding column in sheet (b) with the exception of the ‘enrichment status’ column, which indicates whether the module was found to be enriched in the IBD samples in this study (‘IBD_ENRICHED’), in the high-metabolic independence genomes in Watson et al., 2023 (‘HMI_ENRICHED’), in both (‘HMI_AND_IBD’), or in neither (‘OTHER’). (c) Matrix of stepwise copy number of each module in each deeply sequenced gut metagenome. (d) Per-population copy number of each module in each deeply sequenced gut metagenome in the IBD, non-IBD, and healthy sample groups. (e) Per-population copy number of each module in each antibiotic time-series sample from Palleja et al., 2018.
- https://cdn.elifesciences.org/articles/89862/elife-89862-supp2-v1.zip
-
Supplementary file 3
Genome Taxonomy Database (GTDB) genome data.
(a) List of 338 GTDB representative genomes identified as gut microbes, their taxonomy, metabolic independence score, classification as high metabolic independence (‘HMI’) or not (‘non-HMI’), genome length in base pairs, and number of gene calls. (b) Matrix of stepwise completeness of each module in each genome. (c) Matrix of genome detection in each deeply sequenced gut metagenome in the inflammatory bowel disease (IBD), non-IBD, and healthy sample groups. (d) Percent abundance of each genome in each deeply sequenced gut metagenome. (e) Per-genome proportion of samples from each sample group that the genome is detected in using a threshold of 50% (i.e. at least half of the genome sequence is covered by at least one sequencing read in a given sample). (f) Per-sample proportion of detected genomes that are classified as HMI. (g) Average completion of each IBD-enriched module within the HMI genome group and the non-HMI genome group, as well as the difference between these values. (h) Genome-level results when using different HMI score thresholds for determining HMI status. Each threshold is shown both as the average percent completeness required for the 33 IBD-enriched modules and as the HMI score above which a genome is considered HMI. Results for each threshold include the number of genomes assigned as HMI, the percent of genomes assigned as HMI (out of 338), the number and percent of Bacteroides genomes assigned as HMI, the mean genome size and mean number of gene calls for both HMI and non-HMI genomes, the p-values and W statistics of the Wilcoxon rank-sum tests comparing detection of HMI vs non-HMI genomes (1) in IBD samples and (2) in healthy samples, and the p-value of the Kruskal-Wallis rank-sum test comparing the fraction of genomes classified as HMI in IBD samples vs healthy/non-IBD samples.
- https://cdn.elifesciences.org/articles/89862/elife-89862-supp3-v1.zip
-
Supplementary file 4
Metagenome classifier information.
(a) Details and performance of previously published classifiers for inflammatory bowel disease (IBD) and IBD subtypes. For each classifier, we summarize the cohort details as described by the study; the size of training datasets and validation datasets (if any); the type(s) of samples, data, and extracted features used for classification; the target classes (i.e. what the samples were being classified as); the classifier type and training/validation strategy; and the performance metrics as reported by the study. (b) Classification of each (Palleja et al., 2018) metagenome by our logistic regression model trained for distinguishing IBD vs healthy samples on the basis of PPCN data for IBD-enriched modules. This table describes whether the sample was classified as healthy (‘HEALTHY’) or stressed (‘IBD’, which we consider to be equivalent to an identification of gut stress), and also whether the sample had low sequencing depth (<25 million reads) or not. (c) Summary of the performance of our metagenome classifier across different training/validation strategies using the IBD and healthy metagenome samples. It also includes the details of our final classifier trained on all 330 samples, though performance data is not available for this model since there were no IBD/healthy samples left for validation – however, see manuscript for its performance on the (Palleja et al., 2018) antibiotic time-series dataset. The subsequent sheets include per-fold data and performance information for each train-test strategy: (d) random split cross-validation (25-fold) on PPCN data; (e) leave-two-studies-out cross-validation (24-fold); and (f) (10-fold) cross-validation leaving out samples from the two dominating studies in our dataset (Le Chatelier et al., 2013; Vineis et al., 2016).
- https://cdn.elifesciences.org/articles/89862/elife-89862-supp4-v1.zip
-
Supplementary file 5
Details of available software for metabolism estimation.
For each tool (including the one published in this study), we summarize: the software category (based upon the tool’s architecture and mode of use); its metabolism reconstruction strategy (whether it is a pathway prediction tool or a modeling tool or both); the data source(s) it uses for enzyme and metabolic pathway information; how it calculates pathway completeness or generates models (depending on reconstruction strategy); what input and output types it accepts/generates; any additional capabilities as advertised by the tool’s publication; whether or not the tool is open-source; the program type; and what language(s) it is developed in (if known). The reference publication and code repository or webpage for each tool is also included.
- https://cdn.elifesciences.org/articles/89862/elife-89862-supp5-v1.zip
-
Supplementary file 6
Data from validation of the per-population copy number (PPCN) approach with simulated metagenomic data.
(a) Distribution (mean and standard deviation) of PPCN and PPCN error (computed relative to either average genomic completeness or average genomic copy number) across each validation test case, as well as the proportion of correct, off-by-one, and off-by-two community size estimates in each test case. (b) Spearman’s correlation test results between sample parameters (genome size, community size, and diversity level) and important values computed in our approach (PPCN, PPCN accuracy metrics, and accuracy of community size estimates). Negative values are shown in red and nonsignificant p-values are highlighted in blue. (c) Normalized and rank-ordered relative abundance data from the top 20 most abundant microbial populations in healthy gut metagenomes that we used to recreate a ‘typical’ relative abundance curve for our simulated metagenomes, based upon data from Beghini et al., 2021. Each initial column provides the data from a single sample, and the final four columns describe: the average relative abundance at each rank order; the averages when scaled such that the minimum abundance is 1; the corresponding (integer) coverage values for each scaled average relative abundance value; and the coverage values when increased by 20× for sufficient sequencing depth for assembly.
- https://cdn.elifesciences.org/articles/89862/elife-89862-supp6-v1.zip
-
MDAR checklist
- https://cdn.elifesciences.org/articles/89862/elife-89862-mdarchecklist1-v1.pdf
Download links
A two-part list of links to download the article, or parts of the article, in various formats.
Downloads (link to download the article as PDF)
Open citations (links to open the citations from this article in various online reference manager services)
Cite this article (links to download the citations from this article in formats compatible with various reference manager tools)
Microbes with higher metabolic independence are enriched in human gut microbiomes under stress
eLife 12:RP89862.
https://doi.org/10.7554/eLife.89862.3


